Optimal Design of Viscoelastic Dampers in Frame Structures ...

Research ArticleOptimal Design of Viscoelastic Dampers in FrameStructures considering Soil-Structure Interaction Effect
Xuefei Zhao Shuguang Wang Dongsheng Du and Weiqing Liu
College of Civil Engineering Nanjing Tech University Nanjing 210009 China
Correspondence should be addressed to Shuguang Wang 720108vipsinacom
Received 6 May 2016 Accepted 26 September 2016 Published 5 January 2017
Academic Editor Giuseppe C Marano
Copyright copy 2017 Xuefei Zhao et al This is an open access article distributed under the Creative Commons Attribution Licensewhich permits unrestricted use distribution and reproduction in any medium provided the original work is properly cited
The seismic response control of multistory frame structures using optimally placed viscoelastic dampers (VEDs) withinconsideration of soil-structure interaction (SSI) effect is investigated in this paperThe system is assumed to be elastic and responsesof the system are obtained in frequency domain for stationary random seismic excitations The optimal designs of VEDs instructures are achieved through genetic algorithm (GA) by minimizing the maximum response quantities of the system for adetermined total amount of viscoelastic material Two typical elastic multistory frame structures with different soil types andfoundation embedment ratios are considered to demonstrate the optimization process It is shown that the VEDs have the bestcontrol of the structural response for fixed base condition and the control efficiency decreases as the soil becomes softer Theoptimal placement types of VEDs for different soil types differ from each other With the decrease of soil stiffness the optimallocations of VEDs have a tendency to shift to top floors
1 Introduction
In order to attain a high level of structural vibration controlvarious types of energy dissipation devices such as viscoelas-tic dampers (VEDs) viscous fluid dampers and frictiondampers have received considerable attention in recent yearsAmong the available devices the VED has been successfullyused in several buildings for the effective reduction of windor earthquake induced vibrations
Theproperties of VED such as the behavior of energy dis-sipation mechanism or the dynamic stiffness are frequencyand temperature dependent which are commonly defined interms of experimentally obtained storage and loss modulesA more in-depth understanding of the dynamic behavior isrequired for the vibration analysis of structures supplementedwith VEDs In the past several rheological models wereproposed to describe the dynamic behavior of VEDs suchas the classical Maxwell model Kelvin model and thefractional-derivative model These models are presented byChang [1] Lewandowski [2] and other researchers
The dynamic analyses of structures equipped withVEDs are presented in many papers both analytical and
experimental studies have shown that a significant reductionin structural response excited by earthquake motions can beachieved by adding VEDs to the structure Zhang and Soong[3] Chang andLin [4] andHwang et al [5] have reported thatthe VEDs can greatly reduce the seismic induced structuralvibrations through the numerical examples Researches byTsai and Lee [6] and Lai et al [7] have shown that VEDs aresuitable for seismicmitigation of buildings Extensive shakingtable studies have revealed that the VEDs are very effectivein reducing vibrations of structures due to mild and strongearthquakes for both steel and reinforced concrete structuresat various environmental temperatures (Chang et al [8] andShen and Soong [9])
Optimization analysis about structures with VEDs inclu-ding parameter and location optimization of VEDs in thestructure is an important problem from a practical point ofview In one case the problem has been studied for idealizedconfiguration of structures by Ashour [10] A multistorybuilding with identical properties at every story has beenmodeled as a uniform shear beam optimal damper locationis acquired to conform to the pattern of distribution thatwill result in maximizing the first mode damping ratio
HindawiShock and VibrationVolume 2017 Article ID 9629083 16 pageshttpsdoiorg10115520179629083
2 Shock and Vibration
A similar problem has been studied with regard to the activestructural control by Chang and Soong the optimal locationof the dampers was obtained by minimizing a performanceindex of modal response [11] Later Zhang and Soong [3]extended the controllability index method to address thedamper location problem leading to a sequential procedurefor the optimal placement of VEDs Shukla and Datta [12]obtained the optimal locations of VEDs with the help ofa controllability index which is defined by the root-mean-square value of interstory drift
Nevertheless due to the complicated seismic analysis ofstructures considering soil-structure interaction (SSI) effectmost of the studies are carried out based on the assumptionof rigid foundation The researches conducted by Veletsosand Meek [13] Aviles and Perez-Rocha [14] and Medina etal [15] demonstrate that the SSI effect significantly modifiesthe structural dynamic characteristics and then influencesthe seismic response performance of the whole structureBesides the performance of VED is closely related to thedynamic characteristics of the structure especially the struc-tural frequencies and thus it will be inevitably influencedby the SSI effect Conversely the stiffness and dampingchanges of the system induced by VEDs will affect the soil-structure interaction and vice versa Accordingly the seismicanalysis of the soil-foundation-structure-damper system isa relatively complicated coupling problem The assumptionof rigid foundation may result in analytical inaccuracy andconsiderable deviation from the original design objective ifthe structures equipped with VEDs are located on relativelysoft foundations The optimal locations of VEDs in struc-tures considering SSI effect may also be different from theoptimization results based on rigid foundation assumptionsHowever to the authorsrsquo knowledge there are very fewstudies in scientific literatures focusing on the problem ofoptimal design of VEDs in structures considering the SSIeffect
The work in this paper is targeted at evaluating theSSI effect on the performance of VEDs and at finding theoptimal placement of VEDs in the elastic frame structureBecause earthquakes are random phenomena a stochasticprocedure is used for evaluating the seismic response ofthe system The free-field earthquake excitation is assumedto be stationary with mean value of zero and the effectiveinput power spectral density function (PSDF) is obtainedby modifying the free-field PSDF based on the kinematicinteraction effect between soil and foundation A geneticalgorithm (GA) is used as a numerical searching techniqueto find the optimal locations of VEDs for a determinedtotal amount of viscoelastic material Finally two typicalearthquake excited elastic multistory frame structures withdifferent foundation embedment ratios and soil types areconsidered to demonstrate the numerical optimal procedure
2 Simplified Model of Multistory Buildingwith VEDs considering the SSI Effect
Consider linear elastic 119873 degree-of-freedom frame struc-tures containing VEDs supported by circular foundations
Base
mn In
VED
VED
VED
mnminus1 Inminus1
kn Cn
knminus1 Cnminus1
mj Ij
kj Cihj+1
m1 I1
k1 C1
m0 I0R
E
H
SRSH
S0 Bedrock
Structure
mj+1 Ij+1
kj+1 Cj+1
Soil (120585g 120596g)
Figure 1 The model of frame structure with VEDs supported byembedment foundation
embedded in the homogeneous viscoelastic and isotropichalf-space as shown in Figure 1 The seismic response ofthe system can be studied using a substructure method inwhich the model is subdivided into building-cap superstruc-ture and soil-foundation system According to Kausel andRoesset [16] the solution of the problem can be brokeninto three steps the first step (kinematic interaction) is todetermine themotion ofmassless foundationwhen subjectedto the free-field motion the next step is to determine thefoundation impedance values which are complex-valuedfrequency-dependent functions that represent the stiffnessand damping of the soil in horizontal rocking and cross-coupled horizontal-rocking vibration respectively finallythe last step consists in the computation of the responseat each frequency of the structure subjected to the motioncomputed in the first step
21 Fractional-Derivative Maxwell Model for VED The con-stitutive behavior of VED might be dependent upon thefrequency temperature and amplitude However a mathe-matical model considering all these effects is very difficultto achieve Therefore for practical applications isothermalconditions are usually considered in the simulation condi-tions Somanymathematical constitutivemodels ofVED justconsider the frequency-dependent constitutive behaviorThefive-parameter fractional-derivative Maxwell model (FDM)is used in this paper to demonstrate the general frequency-dependent constitutive behavior of VED The model was
Shock and Vibration 3
proposed by Makris and Constantinou [17] and validated bydynamic testing very good agreement between the predictedand experimental results was obtained over a wide rangefrequency
The linear dynamic properties of materials in the fre-quency domain are characterized by the complex modulus
and the relationship between force amplitude (120596) anddisplacement amplitude (120596) is as follows (120596) = [1198661 (120596) + 1198941198662 (120596)] (120596) (1)
where 1198661(120596) and 1198662(120596) are the frequency-dependent storageand loss stiffness of the damper respectively given as follows
1198661 (120596) = 1198960 [1 + 1198870120596120573 cos (1205731205872)] + 1198880120596120572 [cos (1205721205872) + 1198870120596120573 cos (((120572 minus 120573) 2) 120587)]1 + 119887021205962120573 + 21198870120596120573 cos (1205731205872)1198662 (120596) = minus11988701198960120596120573 sin (1205731205872) + 1198880120596120572 [sin (1205721205872) + 1198870120596120573 sin (((120572 minus 120573) 2) 120587)]1 + 119887021205962120573 + 21198870120596120573 cos (1205731205872) (2)
The loss factor can be calculated by the following equa-tion
120578 (120596) = 1198662 (120596)1198661 (120596) (3)
The damping coefficient to a specific excitation frequencyis defined as follows
119888 (120596) = 1198662 (120596)120596 (4)
The undetermined parameters in (2) can be obtainedby fitting the experimental results A total of 26 tests wereconducted by Makris and Constantinou [17] in the rangeof 001ndash50Hz at a fixed room temperature (about 25∘)Parameter 120572 was set equal to unity and parameters 1198870 and 120573were determined in a least-square fit of the elastic stiffnesscurve which is defined as the square root of the sum ofsquares of storage and loss stiffness Constant 1198880 was thenfound by fitting the damping coefficient curve which isdescribed as (4) Finally the obtained parameters are 1198960 =0Nm 1198880 = 15 kNm 1198870 = 03 s06 120572 = 1 and 120573 = 06and good agreement is achieved between the model and thetest results The frequency-dependent storage loss stiffnessand damping coefficient are shown in Figure 2 The force-displacement loops for different excitation frequencies areshown in Figure 3
The FDM has been widely used in engineering Sun andChen [18] have used the above parameters for the parametricstudy of free vibration of a taut cable with general viscoelasticdampers by altering 1198880 while keeping other parametersconstant The FDM can also be applied to simulate theconstitutive relation of other viscoelastic dampers such asTaylor devices Jarett dampers and HF2V dampers by fittingthe five undetermined parameters through the experimentdata in practical engineering
22 Equilibrium Equations of the System If the superstruc-ture is equipped with only one VED denoted as the dampernumber 119894 which is mounted between two successive stories
119895 and 119895 + 1 then the force interaction vector F(119905) could bewritten in the following form
F (119905) = F119894 (119905) = [0 119865119895 = 119891119894 119865119895+1 = minus119891119894 0]119879= L119894119879119891119894 (119905) (5)
where L119894 = [0 119871 119894 = 1 119871 119894+1 = minus1 0] is the 119894th damperallocation vector of dimension 119873 times 1 and 119891119894(119905) is the damperforce in time domain
For a structure with 119898 dampers the force interactionvector is given as follows
F (119905) = 119898sum119894=1
F119894 (119905) = 119898sum119894=1
L119894119879119891119894 (119905) (6)
Equation (6) can be written in frequency domain byFourier transformation
F (120596) = 119898sum119894=1
F119894 (120596) = 119898sum119894=1
L119894119879119891 (120596)
= 119898sum119894=1
L119894119879 [1198661 (120596) + 1198941198662 (120596)] cos21205790L119894u (120596) (7)
where u(120596) represents the Fourier transform of the structuraldisplacement and 1205790 represents the installation angle of theVED
The governing equations of motion in the frequencydomain for the case where soil and structure behave linearlyare given as follows
minus1205962 [M] + 119895120596 [C] + [K]U (120596)= minus [M] Γ sdot 119867119906 (120596) + 120574 sdot 119867120601 (120596) 119892 (120596) (8)
where U(120596) = u(120596) 1199060(120596) 1206010(120596)119879 is the displacement vec-tor of the system that consists of the structural displacementu(120596) and the translation and rocking motions of the founda-tion 1199060(120596) and 1206010(120596) the symbol 119895 = radicminus1 and120596 indicates theexcitation frequency 119892(120596) represents the free-field ground
4 Shock and Vibration
01
1
10
100
1000
Valu
e
5 10 15 20 25 30 35 40 45 500Frequency (Hz)
G1 (kNm)G2 (kNm)C (kNmiddotsm)
Figure 2 Stiffness and damping coefficient of the FDM
motion The general mass stiffness and damping matrices[M] [K] and [C] in (8) are given by
[M] = ( M119904 M119904120595 M119904Λ
120595119879M119904 119872119879 119864119879Λ119879M119904 119864119879 119868119879 )
[K] = (K119904 + K119889 0 00 119870ℎℎ 119870ℎ1199030 119870119903ℎ 119870119903119903) [C] = (C119904 + C119889 0 00 119862ℎℎ 119862ℎ1199030 119862119903ℎ 119862119903119903)
(9)
where
119864119879 = 11989801198642 + 119899sum119894=1
M119904 (119894 119894) sdot Λ (119894) 119872119879 = 1198980 + 119899sum
119894=1
M119904 (119894 119894) 119868119879 = 1198980 ( 1198642 )2 + 1198680 + 119899sum
119894=1
[M119904 (119894 119894) sdot Λ2 (119894) + 119868119894] K119889 (120596) = 119898sum
119894=1
L1198941198791198661 (120596) cos21205790L119894
C119889 (120596) = 119898sum119894=1
L1198941198791198662 (120596)120596 cos21205790L119894
1Hz3Hz01Hz
minus03
minus02
minus01
00
01
02
03
Forc
e (kN
)
minus1 0 1 2minus2
Displacement (mm)
Figure 3 The force-displacement loop of FDM
Γ = 0119899times1 1 0119879 120574 = 0119899times1 0 1119879
(10)
M119904 K119904 and C119904 are the mass stiffness and dampingmatrices of the superstructure respectively 119868119894 is the massmoment of inertia of the 119894th story level The foundation istreated as a rigid cylinder of radius 119877 embedment depth 119864mass 1198980 and mass moment of inertia 1198680 The coefficients119870ℎℎ 119870ℎ119903 and 119870119903119903 are the frequency-dependent foundationstiffness and 119862ℎℎ 119862ℎ119903 and 119862119903119903 are the frequency-dependentradiation damping coefficient The impedance functions ofthe embedment foundation used in this paper are calcu-lated by the method proposed by Novak and Sachs [19] 120595represents the column vector where each element is unityand Λ is the column vector of bottom foundation to storyheights 119867119906(120596) and 119867120601(120596) represent the transfer function ofthe translational and rocking component of the foundationinput motion
23 The Effective Input Power Spectrum Density In earth-quake engineering the earthquake excitation is usually char-acterized by the well-known Kanai-Tajimi filtered white-noise spectrum [20] which is given by
119878119892 (120596) = 1 + 41205852119892 (120596120596119892)2[1 minus (120596120596119892)2]2 + 41205852119892 (120596120596119892)2 1198780 (11)
where 1198780 is the spectrum of white-noise bedrock accelerationand 120596119892 and 120585119892 are the resonant frequency and damping ratioof the soil
However the Kanai-Tajimi model exaggerates the energyof low frequency vibration which may cause unreasonableresults Some researchers [21 22] have proposedmodification
Shock and Vibration 5
methods Hu introduced a cut frequency parameter 120596119888 tomodify the Kanai-Tajimi model
119878119892 (120596) = 1 + 41205852119892 (120596120596119892)2[1 minus (120596120596119892)2]2 + 41205852119892 (120596120596119892)2 sdot 12059661205966 + 1205966119888 1198780 (12)
1198780 can be obtained by the following equation
1198780 = 1198862max1198912120596119890 (13)
where 119886max represents the peak value of input acceleration119891 represents peak factor 120596119888 denotes the spectral area when1198780 = 1 which is given by120596119890= intinfin0
1 + 41205852119892 (120596120596119892)2[1 minus (120596120596119892)2]2 + 41205852119892 (120596120596119892)2 sdot 12059661205966 + 1205966119888 119889120596 (14)
The covering soil on the bedrock is considered as thehomogeneous viscoelastic and isotropic half-space as men-tioned previously and thus the resonant frequency of the soilcan be easily obtained
120596119892 = 1205871198811199042119867 (15)
where 119867 denotes the height from the soil surface to thebedrock and 119881119904 denotes the shear velocity of the soil
The damping ratio of field soil is a relatively complicatedproblem According to the previous study 120585119892 varies in therange 064sim09 for different site categories determined bythe equivalent shear velocity of soil and the overburdenthickness For the sake of simplicity the damping ratio 120585119892used in this paper is defined as follows when 119881119904 = 500ms120585119892 = 064 when 119881119904 = 100ms 120585119892 = 09 the intermediate rangeis obtained by linearization technique
Figure 4 gives the PSDF of the free field with differentshear velocity of soil overburden thickness 119867 = 40m peakinput acceleration 119886max = 35 gal and cut frequency 120596119888 =17 rads For different soil conditions the value of peak factor119891 is almost the same according to Liu and Fang [23] and119891 = 3 is considered herein for all cases
In the evaluation of seismic response for structuresconsidering SSI effect the base-slab motion is commonlyassumed to match the free-field motion However the actualbase-slab motions deviate from free-field motions as a resultof soil-foundation kinematic interaction The presence ofstiff foundation elements on or in the soil causes foundationmotions to deviate from free-field motions as a result ofgroundmotion incoherence wave inclinationThe kinematiceffects are often described by a frequency-dependent transferfunction relating the free-field motion to the foundationinput motion (FIM) which is themotion that would be expe-rienced by the foundation if it and the supported structureare massless The FIM consists of translational and rotationalcomponents Translational motions are reduced relative to
5 10 15 20 25 300
Circular frequency (rads)
00
30 times 10minus4
60 times 10minus4
90 times 10minus4
12 times 10minus3
15 times 10minus3
PSD
F of
free
fiel
d (m
2s3)
= 100ms= 200ms= 300ms
= 400ms= 500ms
VsVs
VsVs
Vs
Figure 4The PSDF of free field for different shear velocities of soil
the free field primarily in the horizontal components Therotational components are introduced as a result of variationsin ground motion along the foundation due to inclined orincoherent waves For simplifying the analysis the kinematicinteraction mechanism is considered as a low pass filterwhich reduces the translational component of the free-fieldmotion but generates rocking and torsional component If thepropagating mechanism is considered as vertically propagat-ing plane shear waves only the torsional component can beneglected The Fourier amplitude relationships between thefree-field displacement 119880119891119892 and the translational and rockingcomponent (denoted as 119880119891
ℎand 119880119891119903 resp) are simply defined
by Harada et al [24] as follows
The Translational Component
119880119891ℎ
= 119880119891119892 [ sin (120596119864119881119904)120596119864119881119904 ]2 120596 le 1205961198990405 120596 gt 120596119899 (16)
The Rocking Component
If 120596 le 120596119899119880119891119903= 119880119891119892119877
04 119864119877 (1 minus cos120596119864119881119904 ) 119864119877 le 1(0405 minus 005 119864119877 ) (1 minus cos120596119864119881119904 ) 119864119877 gt 1
(17)
If 120596 gt 120596119899119880119891119903 = 119880119891119892119877
04 119864119877 119864119877 le 10405 minus 005 119864119877 119864119877 gt 1
(18)
where 120596119899 = 1205871198811199042119864
6 Shock and Vibration
5 10 15 20 25 300
Circular frequency (rads)
1E minus 5
1E minus 4
1E minus 3
(m2s3)
Sg ( = 200ms)ER = 02ER = 04
ER = 06ER = 08ER = 1
Vs
HS
Figure 5 The translational PSDF component
(
3010 15 20 2550
Circular frequency (rads)
1E minus 12
1E minus 11
1E minus 10
1E minus 9
1E minus 8
1E minus 7
1E minus 6
ER = 02ER = 04ER = 06
ER = 08ER = 1
m2s3)
SR
Figure 6 The rocking PSDF component
According to the relationship between power spectrumdensity function and the Fourier spectrum function thePSDF of the translational and rocking PSDF component 119878119867and 119878119877 can be easily obtained through the above equationsFigures 5 and 6 give the translational and rocking PSDFcomponent when 119881119904 = 200ms five different embedmentratios are considered (119864119877 = 02 04 06 08 and 1 resp)As illustrated by the figures with the increase of foundationembedment ratio the kinematic interaction between founda-tion and soil is more obvious The horizontal component inhigh frequency range decreases compared with the free-fieldPSDF meanwhile generating rotational component
24 The Response of the System The pseudo-excitationalgorithm is used to obtain the structural response The
earthquake random excitations can be converted to a seriesof harmonic excitationsThe pseudo-excitation is constitutedas follows 119892 (119905) = radic119878119892 (120596)119890119894120596119905 (19)
Equation (8) can also be written in the following form
H0 (120596)U (120596) = Γ sdot 119867119906 (120596) + 120574 sdot 119867120601 (120596) 119892 (120596) (20)
in which
H0 (120596) = minus1205962 [I] + 119894120596 [C] [M]minus1 + [K] [M]minus1minus1 (21)
Then the mean square response value of the system canbe obtained by the following expressions
TheMean Square Response Value of Story Displacement
1205902119880119895 = 1205902119906119895 + 1205902119906119887 + ℎ21198951205902119906119903 (22)
where
1205902119906119895 = intinfin0
10038161003816100381610038161003816H0 (120596)119895119899+1100381610038161003816100381610038162 119878119867 (120596)+ 10038161003816100381610038161003816H0 (120596)119895119899+2100381610038161003816100381610038162 119878119877 (120596) 119889120596
1205902119906119887 = intinfin0
1003816100381610038161003816H0 (120596)119899+1119899+110038161003816100381610038162 119878119867 (120596)+ 1003816100381610038161003816H0 (120596)119899+1119899+210038161003816100381610038162 119878119877 (120596) 119889120596
1205902119906119903 = intinfin0
1003816100381610038161003816H0 (120596)119899+2119899+110038161003816100381610038162 119878119867 (120596)+ 1003816100381610038161003816H0 (120596)119899+2119899+210038161003816100381610038162 119878119877 (120596) 119889120596
(23)
The Mean Square Response Value of Story Absolute Accelera-tion 1205902119860119895 = 1205902119886119895 + 1205902119886119887 + ℎ21198951205902119886119903 + 119878119867 (120596) + 119878119877 (120596) ℎ2119895 (24)
where
1205902119886119895 = minus intinfin0
1205962 10038161003816100381610038161003816H0 (120596)119895119899+1100381610038161003816100381610038162 119878119867 (120596)+ 1205962 10038161003816100381610038161003816H0 (120596)119895119899+2100381610038161003816100381610038162 119878119877 (120596) 119889120596
1205902119886119887 = minus intinfin0
1205962 1003816100381610038161003816H0 (120596)119899+1119899+110038161003816100381610038162 119878119867 (120596)+ 1205962 1003816100381610038161003816H0 (120596)119899+1119899+210038161003816100381610038162 119878119877 (120596) 119889120596
1205902119886119903 = minus intinfin0
1205962 1003816100381610038161003816H0 (120596)119899+2119899+110038161003816100381610038162 119878119867 (120596)+ 1205962 1003816100381610038161003816H0 (120596)119899+2119899+210038161003816100381610038162 119878119877 (120596) 119889120596
(25)
Shock and Vibration 7
TheMean Square Response Value of Interstory Drift
For 119895 = 11205902120579119895 = 1ℎ20 intinfin
0
10038161003816100381610038161003816H0 (120596)119895119899+1100381610038161003816100381610038162 119878119867 (120596)+ 10038161003816100381610038161003816H0 (120596)119895119899+2100381610038161003816100381610038162 119878119877 (120596) 119889120596 + ℎ2119895ℎ20sdot intinfin0
1003816100381610038161003816H0 (120596)119899+2119899+110038161003816100381610038162 119878119867 (120596)+ 1003816100381610038161003816H0 (120596)119899+2119899+210038161003816100381610038162 119878119877 (120596) 119889120596
(26)
For 119895 = 2 3 119873
1205902120579119895 = 1ℎ20 intinfin0
10038161003816100381610038161003816H0 (120596)119895119899+1 minus H0 (120596)119895minus1119899+1100381610038161003816100381610038162 119878119867 (120596)+ 10038161003816100381610038161003816H0 (120596)119895119899+2 minus H0 (120596)119895minus1119899+2100381610038161003816100381610038162 119878119877 (120596) 119889120596+ ℎ2119895 minus ℎ2119895minus1ℎ20 intinfin
0
1003816100381610038161003816H0 (120596)119899+2119899+110038161003816100381610038162 119878119867 (120596)+ 1003816100381610038161003816H0 (120596)119899+2119899+210038161003816100381610038162 119878119877 (120596) 119889120596
(27)
According to the random vibration theory for a station-ary random process with mean value of zero the maximumstatistical value of the structural response can be evaluated bythe following expressions
120583119880119895 = [radic2 ln (V119879) + 05772radic2 ln (V119879) ] 120590119880119895120583119860119895 = [radic2 ln (V119879) + 05772radic2 ln (V119879) ] 120590119860119895120583120579119895 = [radic2 ln (V119879) + 05772radic2 ln (V119879) ] 120590120579119895
(28)
where 120583119880119895 120583119860119895 and 120583120579119895 are the maximum statistical valueof displacement acceleration and drift of the 119895th floorrespectively 119879 is the duration of earthquake and V is the zerocrossing rate which can be obtained by
V = 1120587 ( 12058221205820)12 (29)
where 1205820 and 1205822 are the zero- and second-order spectralmoment
Table 1 Characteristics of structures
Story 10 floors 20 floorsStiffness (MNm) Period Stiffness (MNm) Period
1 537 0719 1280 10302 473 0265 1280 03893 435 0164 970 02374 408 0121 923 01725 404 0098 846 01356 320 0083 792 01117 298 0073 748 00968 289 0067 710 00859 244 0060 710 007610 191 0054 680 007011 mdash mdash 612 006612 mdash mdash 577 006113 mdash mdash 543 005714 mdash mdash 485 005415 mdash mdash 441 005116 mdash mdash 413 004817 mdash mdash 409 004518 mdash mdash 320 004219 mdash mdash 298 003920 mdash mdash 289 0035
3 Optimal Locations of VEDs
The optimal design of VEDs in structures considering SSIeffect under random earthquake excitation is illustrated usingtwo typical frame structures originating from the actualproject The basic properties of the structures are listed inTable 1 The height of each floor and the bay width of theframe are taken as 36m and 10m respectively For 10-storystructures three cases of embedment ratios (119864119877 = 13 23and 1) and one foundation radius (119877 = 75m) are consideredfor 20-story structures also three cases of embedment ratios(119864119877 = 13 23 and 1) are considered but with a largerfoundation radius (119877 = 15m) Mass of each floor is 120 tonsfor both structures In all the analysis the viscous dampingmatrix of the superstructure is assumed to be proportionalto the mass and stiffness metrics of the frame structure Thefirst two modal damping ratios are set to be 005 Five typesof site classes are considered (119881119904 = 150ms 200ms 250ms300ms and 400ms) Poissonrsquos ratio of soil 120592119904 = 13 and themass density 120588119904 = 1700 kgm3
The response quantities of interest are the maximumstatistical response values of displacement absolute acceler-ation and interstory drifts of structures with and withoutVEDs The energy dissipation effect can be evaluated bythe reduction ratio 1198770 which is defined as the maximumstatistical response values of the structure with VEDs dividedby the maximum statistical response values of the structurewithout VEDs Therefore the damping effect is better for
8 Shock and Vibration
smaller value of 1198770 The structural drift reduction ratio 119877120579displacement reduction ratio119877119889 absolute acceleration reduc-tion ratio 119877119886 and the mean response quantities reductionratio 119877mean are defined by the following
119877120579 = max 120583120579119895VEDmax 120583120579119895No-VED
119877119889 = max 120583119880119895VEDmax 120583119880119895No-VED
119877119886 = max 120583119860119895VEDmax 120583119860119895No-VED119877mean = 119877119886 + 119877119889 + 1198771205793
(30)
In order to primarily determine the total amount of VEDfor optimal design the damper is firstly uniformly distributedalong the height of the structure For each floor the amountof viscoelastic material is the same The parameter 1198880 of theVEDplays a leading role in the damping forces of the damperwhich can be gradually changed by altering the shear area 119860and shear thickness 119889 of the damper Thus in the followinganalysis the parameter 1198880 is considered as an optimizationvariable Figures 7 and 8 give the variations of 119877120579 119877119889 119877119886 and119877mean with the change of 1198880 for different soil cases In thesepictures 1198880 represents the amount of viscoelastic materialfor each floor The embedment ratio 119864119877 = 1 The peakacceleration of input earthquake is 35 gal
It is indicated by these figures that with the increase of1198880 the reduction ratios of drifts displacement and absoluteacceleration decrease for all soil types The VEDs have thebest control of the structural response for structures restingon fixed bases and the control efficiency ofVEDs deteriorateswithin the consideration of SSI effect The decreased degreeof the control efficiency is higher as the soil becomes softer
As illustrated in Figure 7 when 1198880 = 15 times 104 kNmapproximately 50 the mean response reduction 119877mean isobtained for fixed base cases however the correspondingreduction is only about 85 for a rather soft soil condition(119881119904 = 150ms) when SSI effect is taken into consideration
The foundation embedment ratio is an important factorthat has a significant influence upon the effect of soil-structure interaction and thus the performance of VEDs willthen be affected Figures 9 and 10 depict the mean reductionratio 119877mean for three embedment ratios (119864119877 = 13 23 and 1resp) with different soil types
The figures reveal that the efficiency of theVEDs is closelyrelated to the foundation embedment with the increase offoundation embedment ratio stronger soil-structure inter-action effect occurs and the control effect of the VEDsdependently decreases The difference of reduction ratiobetween the three embedment ratio cases is the largest when119881119904 = 150ms where the soil-structure interaction effect is
the most remarkable With the increase of soil stiffness thedifference gradually decreases For 20-story structures thedifference between the three different embedment ratios ismore significant than that of 10-story structures owing to thefact that the SSI effect is more intense for taller structures
These observations above are used as initial designparameters for structural response control and then thetotal amount of viscoelastic material decided for a certainreduction ratio is redistributed to find the best placementschemes where the minimum value of 119877mean is achieved Forexample a tentative maximum reduction value of 119877mean =70 is achieved when 1198880 = 29 times 104 kNm of each floor for119881119904 = 150ms as illustrated in Figure 7 Thus the total amountof viscoelastic material to be redistributed for optimal designof the 10-story structure is computed as 119862119879 = 29 times 105 kNm
The problem of location optimization of VEDs can bedefined as a procedure of finding theminimumvalue of119877meanwith variations of 1198880 for each floor while keeping the totalamount of viscoelastic material constant
The optimal function is defined as follows
119891 (C) = 119877119889 (C) + 119877120579 (C) + 119877119886 (C)3 (31)
The constraint condition is
119899sum119894=1
C119894 minus 119862119879 = 0C119894 ge 0 (32)
where C = [11988801 11988802 1198880119899] and 119862119879 represents the totalamount of viscoelastic material for a determined reductionvalue of 119877mean which is obtained from the uniform distribu-tion case
Determining the optimal design variables C for thesystem is a very complex problem as a result of varyingdynamic properties of the system within consideration ofthe SSI effect and the interaction between dampers andthe structure Moreover in practical applications designvariables of VEDs may not be continuous functions Thusthe location optimal design of VEDs can be viewed as acombinational optimization problem since the design spaceis discrete In principle the optimal solution for such adiscrete problem can be found by an exhaustive enumerativesearch of every possible combination of damper locationsHowever the practical implementation of this method is notat all effective due to the large number of feasible designcombinations
In order to effectively solve the problem a genetic algo-rithm (GA) is adopted as a numerical searching techniqueFor the past few years the GA introduced by Holland [25]has been successfully applied to a wide range of engineeringapplications and proved to be very effective in solving suchproblems for its features of evolutionary multipoint directand parallel searching The GA is an optimization techniquesimulating the evolutionary process based on the principlesof natural biological evolutionary process where the stronger
Shock and Vibration 9
00
02
04
06
08
10
00
02
04
06
08
10
R
00
02
04
06
08
10
R120579
= 150ms= 200ms= 250ms
= 300ms= 400ms
Fixed base
00
02
04
06
08
10
Rmean
= 150ms= 200ms= 250ms
= 300ms= 400ms
Fixed base
c0 (kNm)300 times 104150 times 104000
c0 (kNm)300 times 104150 times 104000
c0 (kNm)300 times 104150 times 104000
c0 (kNm)300 times 104150 times 104000
450 times 104450 times 104
450 times 104 450 times 104
a
Rd
VsVs
VsVs
Vs
VsVs
VsVs
Vs
Figure 7 The reduction ratios for 10-story structures (119864119877 = 1)individuals are likely to be winners in a competing environ-ment [26ndash28]
In a genetic algorithm a population of candidate solu-tions (called individuals creatures or phenotypes) to anoptimization problem is evolved toward better solutionsEach candidate solution has a set of properties which can bemutated and altered Traditionally solutions are representedin binary as strings of 0s and 1s The evolution usually startsfrom a population of randomly generated individuals whichis an iterative process where the population in each iterationis called a generation In each generation the fitness of everyindividual in the population is evaluated which is usuallythe value of objective function in the optimization problembeing solved The more fit individuals are stochasticallyselected from the current population and each individualrsquosgenome is modified (recombined and possibly randomlymutated) to form a new generation The new generation ofcandidate solutions is then used in the next iteration of thealgorithm Commonly the algorithm terminates when either
a maximum number of generations have been produced or asatisfactory fitness level has been reached for the population
In this study binary code with 0s and 1s is employed torepresent the design variables of 1198880 The design variables canbe encoded by mapping in a certain range using an 119899-bit ofbinary unsigned integer and the GA starts with an initialpopulation which comprises 119873119892 randomly created binarystringsThe following equation can be used to decode a string
119894 = min + (max minus min) 1198871198942119899 minus 1 (33)
where 119887119894 is the decimal integer value of binary string for 119894For both 10-story and 20-story structures 119877mean = 07
is selected as an initial target reduction The total amount ofviscoelasticmaterial119862119879 to be redistributed for optimal designcan be obtained in Figures 7 and 8 where the embedmentratio 119864119877 = 1 Table 2 lists the total amount of viscoelasticmaterial for optimal design
10 Shock and Vibration
c0 (kNm)
00
02
04
06
08
10
c0 (kNm)
00
02
04
06
08
10
00
02
04
06
08
10
R120579
c0 (kNm)
00
02
04
06
08
10
Rmean
c0 (kNm)
600 times 104450 times 104300 times 104150 times 104000600 times 104450 times 104300 times 104150 times 104000
600 times 104450 times 104300 times 104150 times 104000 600 times 104450 times 104300 times 104150 times 104000
R
= 150ms= 200ms= 250ms
= 300ms= 400ms
Fixed base
= 150ms= 200ms= 250ms
= 300ms= 400ms
Fixed base
a
Rd
VsVs
VsVs
Vs
VsVs
VsVs
Vs
Figure 8 The reduction ratios for 20-story structures (119864119877 = 1)Table 2 The total amount of viscoelastic material C119879 for optimal design
Soil type 119881119904 = 150ms 119881119904 = 200ms 119881119904 = 250ms 119881119904 = 300ms 119881119904 = 400ms Fixed base10 floors 290119864 + 05 180119864 + 05 115119864 + 05 095119864 + 05 075119864 + 05 070119864 + 0520 floors 950119864 + 05 600119864 + 05 470119864 + 05 360119864 + 05 300119864 + 05 290119864 + 05
In the application of GA one population consists of 150chromosomes (119873119892 = 150) and each chromosome of thepopulation is a string of size 16119899 Selection is based on roulettewheel selection the crossover operation is performed witha crossover probability of 08 and mutation operates with amutation probability of 001
For an evolutionary process the individual strings of apopulation are manipulated cyclically through three basicoperations and replacement to produce a newpopulation thattends to have a better fitness value namely smaller meanreduction ratio The placement schemes of the VEDs will begradually improved as the evolutionary cycle is repeated
Figures 11 and 12 depict the optimal design results ofVEDs with different soil types for 10-story and 20-story
structures respectively Figures 13 and 14 give the comparisonamong the optimal results for different soil types
It is clear from these results that the SSI effect has agreat influence on the optimal placement of VEDs Differentsoil types will lead to different optimal locations For 10-story structures the optimal placement of VEDs is mainlyconcentrated in the range of 4sim6 floors corresponding torelative hard soil when 119881119904 = 400ms along with the decreaseof shear wave velocity of soil the optimal placement of VEDshas a tendency to shift to top floors when 119881119904 = 150ms theVEDs are mainly distributed in the range of 6sim10 floors Thesame phenomenon is demonstrated by the optimal locationsof VEDs in 20-story structures for different soil types When119881119904 = 400ms the VEDs are mainly concentrated in the range
Shock and Vibration 11
000
c0 (kNm)
00
02
04
06
08
10
Rmean
ER = 13ER = 23ER = 1
= 150ms= 250ms= 400ms
300 times 104150 times 104 450 times 104
VsVsVs
Figure 9 The mean reduction ratio for structures with variousdegrees of foundation embedment ratio (10-story structures)
c0 (kNm)
00
02
04
06
08
10
Rmean
ER = 13ER = 23ER = 1
= 150ms= 250ms= 400ms
600 times 104450 times 104300 times 104150 times 104000
VsVsVs
Figure 10 The mean reduction ratio for structures with variousdegrees of foundation embedment ratio (20-story structures)
of 6sim15 floors with the decrease of shear velocity of soil theoptimal placement shifts to top floors when 119881119904 = 150ms theVEDs are mainly distributed in the range of 9sim18 floors
Previous studies by other researchers have alreadyrevealed that with the decrease of soil stiffness the participa-tion of the first-order mode of the system is becoming moreand more dominant in which the mode shape of the systemis similar to an inverse triangle and the response of eachstory gradually increases along the height of the structureConsequently the VEDs being arranged on higher floorsappear to be more effective as illustrated by the optimizationresults
2 3 4 5 6 7 8 9 101
Floor
0
1 times 104
2 times 104
3 times 104
4 times 104
5 times 104
c 0(k
Nm
)
(a) 119881119904 = 150ms
2 3 4 5 6 7 8 9 101
Floor
0
1 times 104
2 times 104
3 times 104
4 times 104
5 times 104
c 0(k
Nm
)(b) 119881119904 = 250ms
2 3 4 5 6 7 8 9 101Floor
0
1 times 104
2 times 104
3 times 104
4 times 104
5 times 104c 0
(kN
m)
(c) 119881119904 = 400ms
2 3 4 5 6 7 8 9 101
Floor
0
1 times 104
2 times 104
3 times 104
4 times 104
5 times 104
c 0(k
Nm
)
(d) Fixed base
Figure 11The optimal placement schemes of VEDs for different soiltypes (10-story structure 119864119877 = 1)
The maximum responses of drifts and acceleration foroptimal and uniform placement of VEDs are compared inFigures 15 and 16 As the figures show the optimally placedVEDs provide lower responses of drifts and acceleration incomparisonwith the uniformplacement of VEDs for all casesand the optimization effect differs for different soil types
For 10-story structures the maximum story driftdecreases by 105 and the maximum acceleration decreasesby 121 when 119881119904 = 200ms after optimization with theincrease of soil stiffness the decreasing degree increasesgradually for fixed base condition the decreasing degrees
12 Shock and Vibration
2 3 4 5 6 7 8 9 10 11 12 13 14 15 16 17 18 19 201Floor
00
20 times 104
40 times 104
60 times 104
80 times 104
10 times 105
c 0(k
Nm
)
(a) 119881119904 = 150ms
2 3 4 5 6 7 8 9 10 11 12 13 14 15 16 17 18 19 201Floor
00
20 times 104
40 times 104
60 times 104
80 times 104
10 times 105
c 0(k
Nm
)
(b) 119881119904 = 250ms
2 3 4 5 6 7 8 9 10 11 12 13 14 15 16 17 18 19 201Floor
00
20 times 104
40 times 104
60 times 104
80 times 104
10 times 105
c 0(k
Nm
)
(c) 119881119904 = 400ms
2 3 4 5 6 7 8 9 10 11 12 13 14 15 16 17 18 19 201Floor
00
20 times 104
40 times 104
60 times 104
80 times 104
10 times 105
c 0(k
Nm
)
(d) Fixed base
Figure 12Theoptimal placement schemes ofVEDs for different soiltypes (20-story structure 119864119877 = 1)of maximum drift and acceleration are 216 and 182respectively For 20-story structures the same control effectof VEDs is demonstrated for different soil types When 119881119904= 200ms the maximum story drift decreases by 143 andthe maximum acceleration decreases by 165 for fixed basecondition the decreasing degrees of drift and accelerationare about 192 and 205 respectively The distribution ofstory drift is more reasonable after optimization which leadsto a full use of viscoelastic material
Figures 17 and 18 give the comparison of 119877mean betweenstructures with optimal and uniformdistribution of VEDs forthe same total viscoelastic material with different soil types
1 2 3 4 5 6 7 8 9 1000
Floor
1 times 104
2 times 104
3 times 104
4 times 104
5 times 104
c 0(k
Nm
)
= 150ms= 200ms= 250ms
= 300ms= 400ms
Fixed base
VsVs
VsVs
Vs
Figure 13 The comparison of optimal placement of VEDs amongdifferent soil types (10-story structure)
1 2 3 4 5 6 7 8 9 10 11 12 13 14 15 16 17 18 19 200Floor
00
20 times 104
40 times 104
60 times 104
80 times 104
10 times 105
c 0(k
Nm
)
= 150ms= 200ms= 250ms
= 300ms= 400ms
Fixed base
VsVs
VsVs
Vs
Figure 14 The comparison of optimal placement of VEDs amongdifferent soil types (20-story structure)
It can be seen from the pictures that the optimal place-ment of VEDs provides lower reduction ratio than that ofthe uniform placement schemes for all soil types With theincrease of soil stiffness the degree of reduction graduallyincreases and the minimum reduction is achieved for thefixed base condition where the soil stiffness is assumedto be infinity The reduction extent between the 10-storyand 20-story structures is also different for the same soilconditions For 10-story structures when 119881119904 = 150ms themean reduction ratio 119877mean drops from 07 to 068 afterlocation optimization for 20-story structures the meanreduction ratio 119877mean drops from 07 to 064 after locationoptimization The results suggest that the optimization effect
Shock and Vibration 13
Optimal schemeUniform schemeNo VEDs
123456789
10
Floo
r
02 04 06 08 1000The maximum acceleration
response (ms2)
Optimal schemeUniform schemeNo VEDs
00
12times10
minus4
90times10
minus4
60times10
minus4
30times10
minus4
The maximum drift response
123456789
10
Floo
r
(a) 119881119904 = 200ms
Optimal schemeUniform schemeNo VEDs
The maximum drift response
123456789
10
Floo
r
30times10
minus4
12times10
minus4
60times10
minus4
90times10
minus4
00
Optimal schemeUniform schemeNo VEDs
123456789
10Fl
oor
02 04 06 08 1000The maximum acceleration
response (ms2)
(b) 119881119904 = 400ms
Optimal schemeUniform schemeNo VEDs
00
60times10
minus4
90times10
minus4
12times10
minus4
30times10
minus4
The maximum drift response
123456789
10
Floo
r
Optimal schemeUniform schemeNo VEDs
123456789
10
Floo
r
02 04 06 08 1000The maximum acceleration
response (ms2)
(c) Fixed base
Figure 15 The comparison of structural responses for different distribution of VEDs (10-story structure)
14 Shock and Vibration
Optimal schemeUniform schemeNo VEDs
123456789
1011121314151617181920
Floo
r
03 06 09 12 1500The maximum acceleration
response (ms2)
Optimal schemeUniform schemeNo VEDs
123456789
1011121314151617181920
Floo
r
50times10
minus4
10times10
minus3
15times10
minus3
20times10
minus3
00
The maximum drift response
(a) 119881119904 = 200ms
Optimal schemeUniform schemeNo VEDs
123456789
1011121314151617181920
Floo
r
03 06 09 12 1500The maximum acceleration
response (ms2)
Optimal schemeUniform schemeNo VEDs
123456789
1011121314151617181920
Floo
r
50times10
minus4
10times10
minus3
15times10
minus3
20times10
minus3
00
The maximum drift response
(b) 119881119904 = 400ms
Optimal schemeUniform schemeNo VEDs
123456789
1011121314151617181920
Floo
r
03 06 09 12 1500The maximum acceleration
response (ms2)
Optimal schemeUniform schemeNo VEDs
123456789
1011121314151617181920
Floo
r
00
10times10
minus3
15times10
minus3
20times10
minus3
50times10
minus4
The maximum drift response
(c) Fixed base
Figure 16 The comparison of structural responses for different distribution of VEDs (20-story structure)
Shock and Vibration 15
Optimal distributionUniform distribution
Fixe
d ba
se
Soil type
050
055
060
065
070
075
Rm
ean
=150
ms
=200
ms
=250
ms
=300
ms
=400
ms
Vs
Vs
Vs
Vs
Vs
Figure 17 The comparison of 119877mean between optimal distributionand uniform distribution of VEDs (10-story structure)
Optimal distributionUniform distribution
Fixe
d ba
se
Soil type
050
055
060
065
070
075
Rm
ean
=150
ms
=200
ms
=250
ms
=300
ms
=400
ms
Vs
Vs
Vs
Vs
Vs
Figure 18 The comparison of 119877mean between optimal distributionand uniform distribution of VEDs (20-story structure)
is better for taller structure where the space for locationoptimization is larger
4 Conclusions
Control of the seismic response of elastic multistory framestructures using optimally placed VEDs within considerationof SSI effect is investigated Responses of the system areobtained in the frequency domain using spectral analysisThe free-field earthquake excitation is assumed to be sta-tionary with mean value of zero and the effective randomfoundation input motions are acquired by modifying thefree-field groundmotions based on the kinematic interaction
between soil and foundation Different cases of soil typesand foundation embedment ratios are considered as themainparameters that influence the SSI effect and the efficiency ofVEDs The optimization problem is defined as a procedureof finding the minimum reduction ratio 119877mean of the systemfor a determined total amount of viscoelastic material andthe optimal locations of VEDs are successfully acquired withthe help of genetic algorithm Two typical elastic multistoryframe structures are considered to demonstrate the optimiza-tion procedure Based on the limited numerical studies thefollowing conclusions can be drawn
(1) The VEDs have the best control of the structuralresponse for fixed base conditions and the controlefficiency decreases as the soil becomes softer
(2) Embedment ratio of foundation has a significantinfluence on the performance of the VEDs Forrelative soft soil conditions the increase of founda-tion embedment enhances the dynamic interactionbetween soil and foundation thus reducing the effi-ciency of VEDs
(3) The SSI effect has a great effect on the optimalplacement of VEDs in frame structures For relativehard soil conditions the optimal locations of VEDsare more concentrated at the middle floors with thedecrease of soil stiffness the optimal locations have atendency to shift to top floors
(4) The optimal placement schemes of VEDs providelower responses of the system compared with theuniform placement schemesWith the increase of soilstiffness the optimization effect gradually increases
Competing Interests
The authors declare that they have no competing interests
Acknowledgments
The authors are grateful for the financial support fromthe National Natural Science Foundation of China (Grantsnos 51678302 and 51678301) the Jiangsu Province Industry-University-Research Joint Innovation Fund-Prospective JointResearch Project (Grant no BY2014005-05) and the MajorProgramofNatural Science Foundation of the JiangsuHigherEducation Institutions of China (Grant no 14KJA560001)
References
[1] T-S Chang and M P Singh ldquoMechanical model parametersfor viscoelastic dampersrdquo Journal of EngineeringMechanics vol135 no 6 pp 581ndash584 2009
[2] R Lewandowski and B Chorazyczewski ldquoIdentification of theparameters of the Kelvin-Voigt and the Maxwell fractionalmodels used to modeling of viscoelastic dampersrdquo Computersamp Structures vol 88 no 1-2 pp 1ndash17 2010
[3] R-H Zhang and T T Soong ldquoSeismic design of viscoelasticdampers for structural applicationsrdquo Journal of Structural Engi-neering (United States) vol 118 no 5 pp 1375ndash1392 1992
16 Shock and Vibration
[4] K-C Chang and Y-Y Lin ldquoSeismic response of full-scalestructurewith added viscoelastic dampersrdquo Journal of StructuralEngineering vol 130 no 4 pp 600ndash608 2004
[5] J-S Hwang Y-N Huang S-L Yi and S-Y Ho ldquoDesignformulations for supplemental viscous dampers to buildingstructuresrdquo Journal of Structural Engineering vol 134 no 1 pp22ndash31 2008
[6] C S Tsai andHH Lee ldquoApplications of viscoelastic dampers tohigh-rise buildingsrdquo Journal of Structural Engineering vol 119no 4 pp 1222ndash1233 1993
[7] M L Lai K C Chang T T Soong D S Hao and Y CYeh ldquoFull-Scale viscoelastically damped steel framerdquo Journal ofStructural Engineering vol 121 no 10 pp 1443ndash1447 1995
[8] K C Chang T T Soong S T Oh and M L Lai ldquoEffectof ambient temperature on viscoelastically damped structurerdquoJournal of Structural Engineering vol 118 no 7 pp 1955ndash19731992
[9] K L Shen and T T Soong ldquoModeling of viscoelastic dampersfor structural applicationsrdquo Journal of Engineering Mechanicsvol 121 no 6 pp 694ndash701 1995
[10] S A Ashour Elastic Seismic Response of Buildings with Sup-plemental Damping University of Michigan Ann Arbor MichUSA 1987
[11] M I J Chang and T T Soong ldquoOptimal controller placementin modal control of complex systemsrdquo Journal of MathematicalAnalysis amp Applications vol 75 no 2 pp 340ndash358 1980
[12] A K Shukla and T K Datta ldquoOptimal use of viscoelasticdampers in building frames for seismic forcerdquo Journal ofStructural Engineering vol 125 no 4 pp 401ndash409 1999
[13] A S Veletsos and J W Meek ldquoDynamic behaviour of building-foundation systemsrdquo Earthquake Engineering amp StructuralDynamics vol 3 no 2 pp 121ndash138 1974
[14] J Aviles and L E Perez-Rocha ldquoEvaluation of interactioneffects on the system period and the system damping due tofoundation embedment and layer depthrdquo Soil Dynamics andEarthquake Engineering vol 15 no 1 pp 11ndash27 1996
[15] C Medina J J Aznarez L A Padron and O Maeso ldquoEffectsof soil-structure interaction on the dynamic properties and seis-mic response of piled structuresrdquo Soil Dynamics andEarthquakeEngineering vol 53 pp 160ndash175 2013
[16] E Kausel and J M Roesset Soil Structure Interaction ProblemsforNuclear Containment Structures Electric Power and theCivilEngineer 1973
[17] N Makris and M C Constantinou ldquoFractional-derivativemaxwell model for viscous dampersrdquo Journal of StructuralEngineering vol 117 no 9 pp 2708ndash2724 1991
[18] L Sun and L Chen ldquoFree vibrations of a taut cable with ageneral viscoelastic damper modeled by fractional derivativesrdquoJournal of Sound amp Vibration vol 335 pp 19ndash33 2015
[19] M Novak and K Sachs ldquoTorsional and coupled vibrationsof embedded footingsrdquo Earthquake Engineering amp StructuralDynamics vol 2 no 1 pp 11ndash33 1973
[20] G W Housner ldquoProperties of strong ground motion earth-quakesrdquo Bulletin of the Seismological Society of America vol 45no 3 pp 197ndash218 1955
[21] C Nuti and I Vanzi ldquoInfluence of earthquake spatial variabilityon differential soil displacements and SDF system responserdquoEarthquake Engineering amp Structural Dynamics vol 34 no 11pp 1353ndash1374 2005
[22] Y Hu and X Zhou ldquoResponse of the elastic system to stationaryand non-stationary ground motionrdquo Earthquake Engineering
of the Chinese Academy of Sciences Research Report SciencePress Beijing China 1962 (Chinese)
[23] Z-J Liu and X Fang ldquoSimulation of stationary ground motionwith random functions and spectral representationrdquo Journal ofVibration and Shock vol 32 no 24 pp 6ndash10 2013 (Chinese)
[24] T Harada and H Tajimi ldquoThe Japanese Society of EarthquakeEngineering Committeesdot Seismic design and seismic dynamicanalysisrdquo Tokyo Technical Report Hall 1989 (Japanese)
[25] J H Holland Adaption in Natural and Artificial SystemsUniversity of Michigan Press Ann Arbor Mich USA 1975
[26] H Furuya and R T Haftka ldquoPlacing actuators on spacestructures by genetic algorithms and effectiveness indicesrdquoStructural Optimization vol 9 no 2 pp 69ndash75 1995
[27] O Furuya H Hamazaki and S Fujita ldquoProper placement ofenergy absorbing devices for reduction of wind-induced vibra-tion caused in high-rise buildingsrdquo Journal of Wind Engineeringamp Industrial Aerodynamics vol 74-76 pp 931ndash942 1998
[28] Y-J Kim and J Ghaboussi ldquoA new method of reduced orderfeedback control using genetic algorithmsrdquo Earthquake Engi-neering amp Structural Dynamics vol 28 no 2 pp 193ndash212 1999
International Journal of
AerospaceEngineeringHindawi Publishing Corporationhttpwwwhindawicom Volume 2014
RoboticsJournal of
Hindawi Publishing Corporationhttpwwwhindawicom Volume 2014
Hindawi Publishing Corporationhttpwwwhindawicom Volume 2014
Active and Passive Electronic Components
Control Scienceand Engineering
Journal of
Hindawi Publishing Corporationhttpwwwhindawicom Volume 2014
International Journal of
RotatingMachinery
Hindawi Publishing Corporationhttpwwwhindawicom Volume 2014
Hindawi Publishing Corporation httpwwwhindawicom
Journal ofEngineeringVolume 2014
Submit your manuscripts athttpswwwhindawicom
VLSI Design
Hindawi Publishing Corporationhttpwwwhindawicom Volume 2014
Hindawi Publishing Corporationhttpwwwhindawicom Volume 2014
Shock and Vibration
Hindawi Publishing Corporationhttpwwwhindawicom Volume 2014
Civil EngineeringAdvances in
Acoustics and VibrationAdvances in
Hindawi Publishing Corporationhttpwwwhindawicom Volume 2014
Hindawi Publishing Corporationhttpwwwhindawicom Volume 2014
Electrical and Computer Engineering
Journal of
Advances inOptoElectronics
Hindawi Publishing Corporation httpwwwhindawicom
Volume 2014
The Scientific World JournalHindawi Publishing Corporation httpwwwhindawicom Volume 2014
SensorsJournal of
Hindawi Publishing Corporationhttpwwwhindawicom Volume 2014
Modelling amp Simulation in EngineeringHindawi Publishing Corporation httpwwwhindawicom Volume 2014
Hindawi Publishing Corporationhttpwwwhindawicom Volume 2014
Chemical EngineeringInternational Journal of Antennas and
Propagation
International Journal of
Hindawi Publishing Corporationhttpwwwhindawicom Volume 2014
Hindawi Publishing Corporationhttpwwwhindawicom Volume 2014
Navigation and Observation
International Journal of
Hindawi Publishing Corporationhttpwwwhindawicom Volume 2014
DistributedSensor Networks
International Journal of
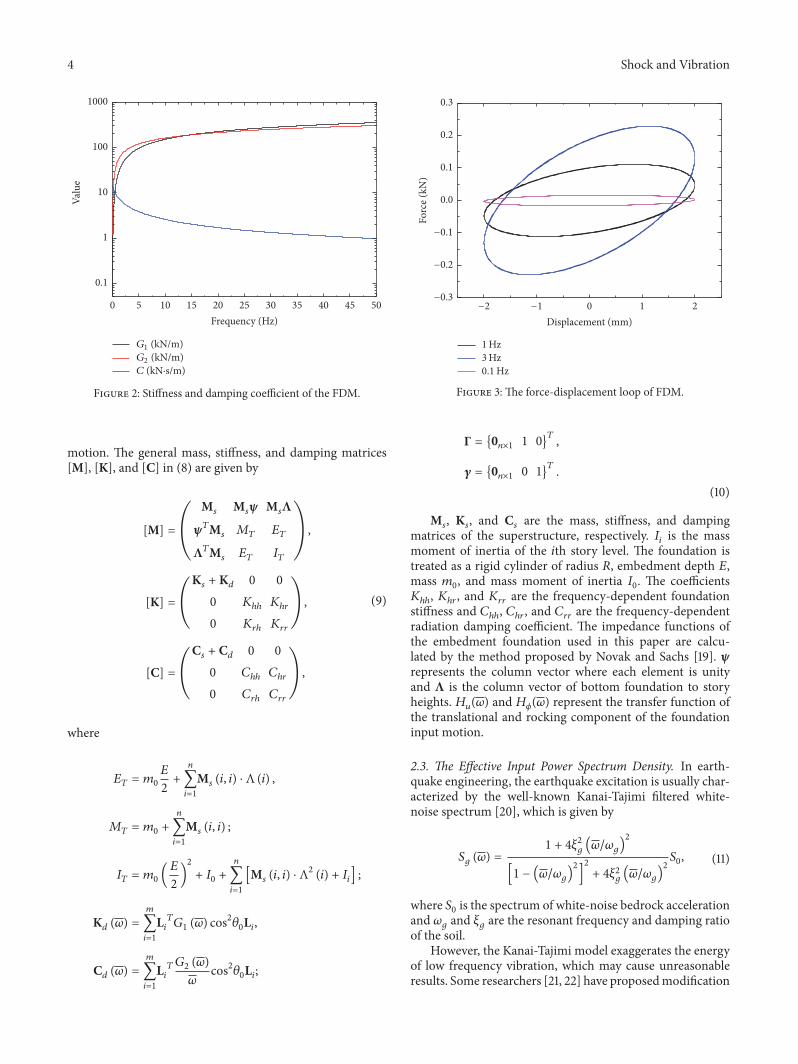
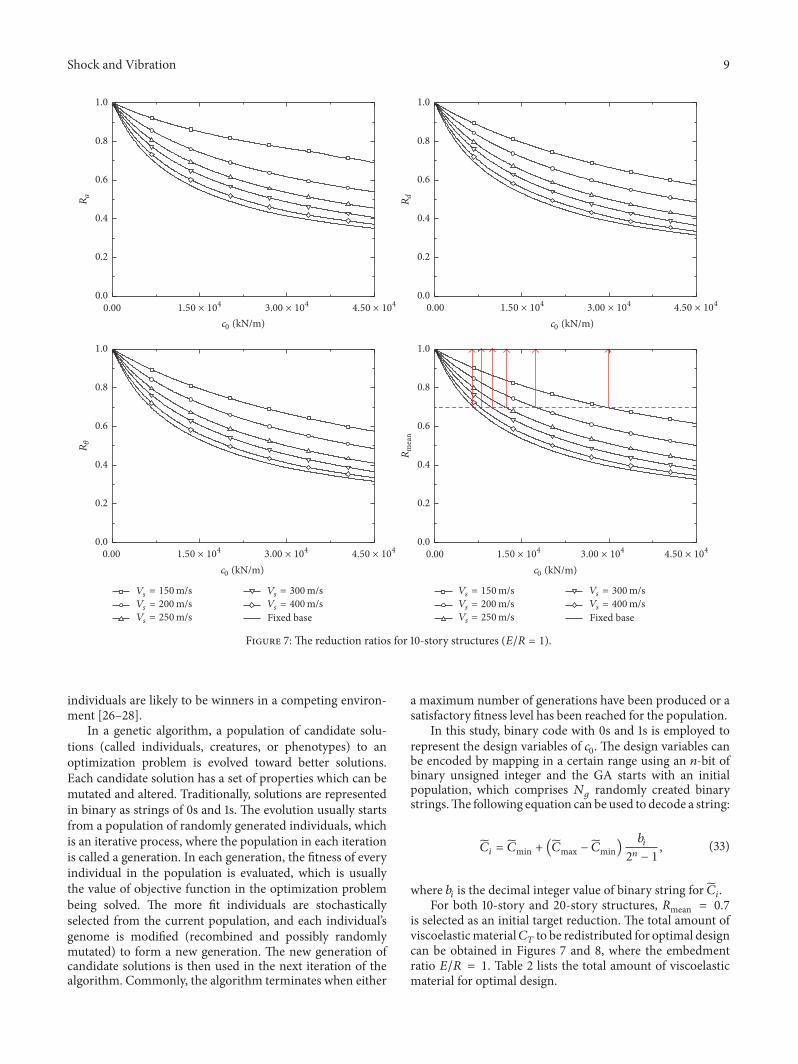
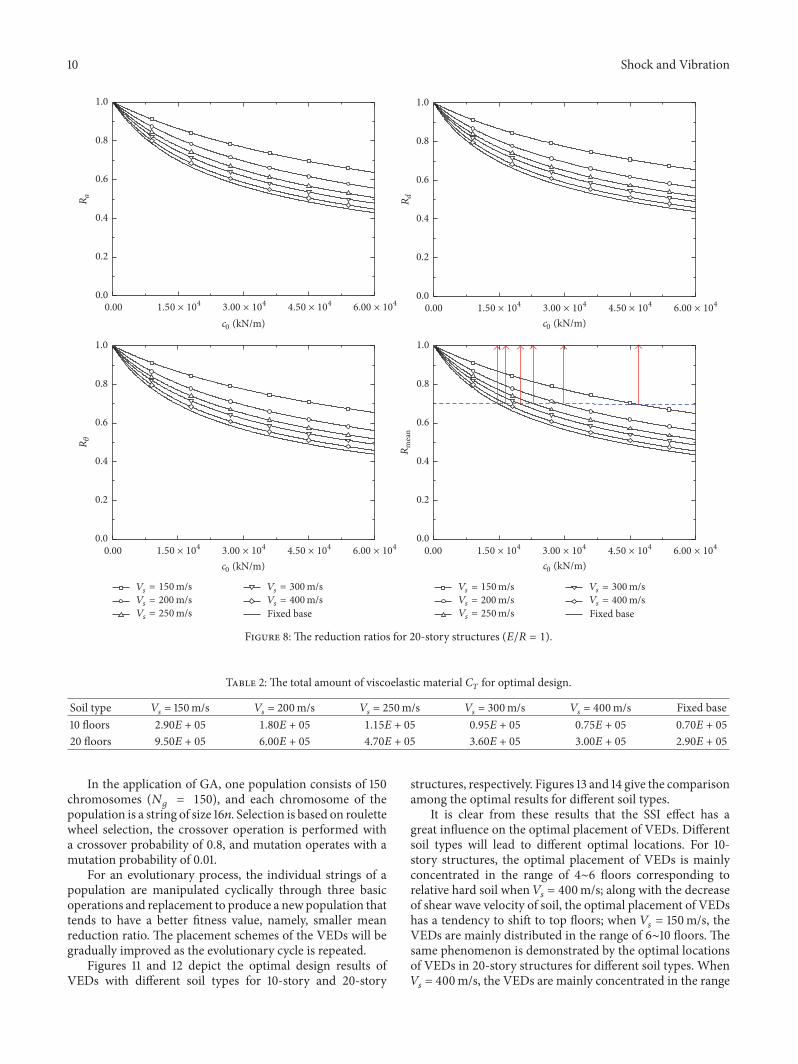
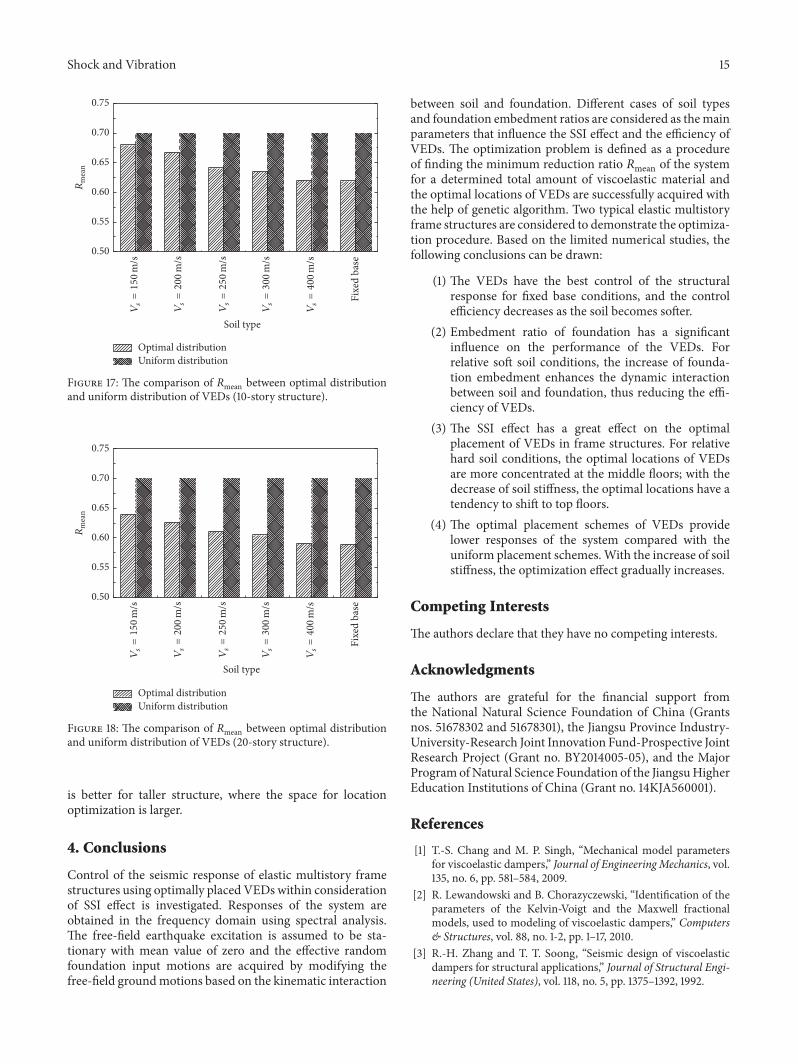

International Journal of
AerospaceEngineeringHindawi Publishing Corporationhttpwwwhindawicom Volume 2014
RoboticsJournal of
Hindawi Publishing Corporationhttpwwwhindawicom Volume 2014
Hindawi Publishing Corporationhttpwwwhindawicom Volume 2014
Active and Passive Electronic Components
Control Scienceand Engineering
Journal of
Hindawi Publishing Corporationhttpwwwhindawicom Volume 2014
International Journal of
RotatingMachinery
Hindawi Publishing Corporationhttpwwwhindawicom Volume 2014
Hindawi Publishing Corporation httpwwwhindawicom
Journal ofEngineeringVolume 2014
Submit your manuscripts athttpswwwhindawicom
VLSI Design
Hindawi Publishing Corporationhttpwwwhindawicom Volume 2014
Hindawi Publishing Corporationhttpwwwhindawicom Volume 2014
Shock and Vibration
Hindawi Publishing Corporationhttpwwwhindawicom Volume 2014
Civil EngineeringAdvances in
Acoustics and VibrationAdvances in
Hindawi Publishing Corporationhttpwwwhindawicom Volume 2014
Hindawi Publishing Corporationhttpwwwhindawicom Volume 2014
Electrical and Computer Engineering
Journal of
Advances inOptoElectronics
Hindawi Publishing Corporation httpwwwhindawicom
Volume 2014
The Scientific World JournalHindawi Publishing Corporation httpwwwhindawicom Volume 2014
SensorsJournal of
Hindawi Publishing Corporationhttpwwwhindawicom Volume 2014
Modelling amp Simulation in EngineeringHindawi Publishing Corporation httpwwwhindawicom Volume 2014
Hindawi Publishing Corporationhttpwwwhindawicom Volume 2014
Chemical EngineeringInternational Journal of Antennas and
Propagation
International Journal of
Hindawi Publishing Corporationhttpwwwhindawicom Volume 2014
Hindawi Publishing Corporationhttpwwwhindawicom Volume 2014
Navigation and Observation
International Journal of
Hindawi Publishing Corporationhttpwwwhindawicom Volume 2014
DistributedSensor Networks
International Journal of