Optimal and Intelligent Designing of Stand-alone Hybrid ...
20
Optimal and Intelligent Designing of Stand-alone Hybrid Photovoltaic/Wind/Fuel Cell System Considering Cost and Deficit Load Demand Probability, Case Study for Iran (Bushehr City) Eisa Ansari Nezhad 1 , Mojtaba Najafi 1* 1 Department of Electrical Engineering Bushehr Branch, Islamic Azad University, Bushehr, Iran. Received: 29-Feb-2020, Revised: 13-Apr-2020, Accepted: 25-Apr-2020. Abstract This paper presents the optimal and intelligent design of photovoltaic-wind-hydrogen system with the aim of minimizing the overall cost of the system and considering the reliability constraints based on annual radiation and wind speed data in Bushehr city. The hydrogen storage system includes an electrolyzer, a hydrogen storage tank and a fuel cell. Overall costs of hybrid systems include initial investment costs, maintenance and operation and replacement of components, and reliability constraint indicate deficit load demand probability (DLDP). In this study, the decision variables were optimized system capacity including number of solar panels, wind turbine, electrolyzer power capacity, mass of hydrogen storage tank, fuel cell capacity and power transfered with inverter by Grey Wolf Optimization (GWO) algorithm that has high convergence speed and accuracy. System design is presented in different scenarios of hybrid system combinations. To verify the proposed method, the results are compared with the results of Particle Swarm Optimization (PSO) algorithm. The simulation results show that the GWO method performs better in design of optimization with lower overall cost and better DLDP than the PSO in different combinations. The results show that photovoltaic -hydrogen storage due to the low wind speed potential in Bushehr city is the optimal combination based on cost and reliability for load supply based on renewable resources hybrid systems. In addition, the results show that the use of higher efficiency inverters reduces energy production costs and improves load reliability. In addition, the results indicate that the outage of renewable units in the design problem has a significant effect on system cost and reliability. Keywords: Photovoltaic-wind-hydrogen system, Overall system cost, Deficit load power probability, Grey wolf optimization algorithm. *Corresponding Authors Email: [email protected] Signal Processing and Renewable Energy June 2020, (pp. 87-106) ISSN: 2588-7327 eISSN: 2588-7335
Transcript of Optimal and Intelligent Designing of Stand-alone Hybrid ...
Optimal and Intelligent Designing of Stand-alone Hybrid
Photovoltaic/Wind/Fuel Cell System Considering Cost and Deficit
Load Demand Probability, Case Study for Iran (Bushehr City)
Eisa Ansari Nezhad1, Mojtaba Najafi1*
1 Department of Electrical Engineering Bushehr Branch, Islamic Azad University,
Bushehr, Iran.
Received: 29-Feb-2020, Revised: 13-Apr-2020, Accepted: 25-Apr-2020.
Abstract
This paper presents the optimal and intelligent design of photovoltaic-wind-hydrogen system with
the aim of minimizing the overall cost of the system and considering the reliability constraints
based on annual radiation and wind speed data in Bushehr city. The hydrogen storage system
includes an electrolyzer, a hydrogen storage tank and a fuel cell. Overall costs of hybrid systems
include initial investment costs, maintenance and operation and replacement of components, and
reliability constraint indicate deficit load demand probability (DLDP). In this study, the decision
variables were optimized system capacity including number of solar panels, wind turbine,
electrolyzer power capacity, mass of hydrogen storage tank, fuel cell capacity and power
transfered with inverter by Grey Wolf Optimization (GWO) algorithm that has high convergence
speed and accuracy. System design is presented in different scenarios of hybrid system
combinations. To verify the proposed method, the results are compared with the results of Particle
Swarm Optimization (PSO) algorithm. The simulation results show that the GWO method
performs better in design of optimization with lower overall cost and better DLDP than the PSO
in different combinations. The results show that photovoltaic -hydrogen storage due to the low
wind speed potential in Bushehr city is the optimal combination based on cost and reliability for
load supply based on renewable resources hybrid systems. In addition, the results show that the
use of higher efficiency inverters reduces energy production costs and improves load reliability.
In addition, the results indicate that the outage of renewable units in the design problem has a
significant effect on system cost and reliability.
Keywords: Photovoltaic-wind-hydrogen system, Overall system cost, Deficit load power probability,
Grey wolf optimization algorithm.
*Corresponding Authors Email:
Signal Processing and Renewable Energy
June 2020, (pp. 87-106)
ISSN: 2588-7327
eISSN: 2588-7335

88 Ansari Nezhad, Najafi. Optimal and Intelligent Designing …
1. INTRODUCTION
In recent years, the importance of utilizing
renewable energy sources has increased. Due
to the dispersed nature of many regions of
Iran, grid-independent systems that use
renewable energy sources are suitable
options for supplying electricity to isolated
areas [2-1]. The purpose of the design of
hybrid systems is to optimize the capacity of
the equipment so that, in addition to
minimizing system costs, load demand is
adequately met or, at times, high reliability.
Therefore, achieving optimum equipment
capacity is important in optimizing the design
of hybrid systems [3]. In [4], optimized
design of hybrid wind-photovoltaic-diesel
hybrid systems with battery storage system
with the aim of minimizing annual system
costs, probability of energy not supplied and
fuel pollution costs using multi-objective
quasi-evolutionary algorithm. In [5], the
design of a wind-photovoltaic system with a
fuel cell storage system with the aim of
minimizing the annual cost of the system and
considering the probability of energy not
supplied the load using the artificial bee
algorithm is presented. In [6], optimal design
of wind-photovoltaic system based on
indicators of probability of shortage of load,
surplus generation capacity, probability of
unmet energy, cost of project useful life,
surface energy cost and life cycle cost of
generating units are presented along with
battery bank. In [7], the optimal design of
hybrid wind-photovoltaic-diesel-battery
systems is presented with the aim of
minimizing the cost of present value and
taking into account the overall energy
shortage of the system. In this study, the
optimal combination of system equipment
was obtained based on the lowest cost. In [8],
the design of a hybrid wind-photovoltaic-
diesel hybrid system with a battery storage
system with the aim of minimizing the annual
cost of the system and considering reliability
and pollution using a quasi-evolutionary
algorithm is presented. In [9], it uses wind-
photovoltaic hybrid systems with a fuel cell
storage system to provide a single charge off
the grid using a particle swarm optimization
algorithm. In [10], technical and economic
design of photovoltaic-biomass-fuel cell
hybrid systems is presented, taking into
account the different initial investment costs
of the fuel cell. In [11], the optimization of
the wind-photovoltaic system with the fuel
cell storage system with the aim of
minimizing the annual cost of the system and
considering the probability of not supplying
the load using the imperial competition
algorithm. In [12], optimization of the wind-
photovoltaic system with the fuel cell system
by considering reliability indices include lost
load expectation and also probability of load
loss using flower pollination algorithm. In
[13], an iterative approach based on
optimization of hybrid wind-photovoltaic-
diesel-battery systems is presented with the
aim of minimizing the cost of present value
and taking into account the overall system
energy shortage.
In this study, optimal and intelligent
design of hybrid photovoltaic-wind system is
presented with hydrogen storage based on
fuel cell for Bushehr city with reliability/cost
assessment. In this study, the grey wolf
optimization (GWO) method [14] is used
which is inspired by the group hunting
behavior of grey wolves. The grey wolf
method is a powerful way to solve problems
Signal Processing and Renewable Energy, June 2020 89
and has high convergence speed. In this
study, optimal and intelligent system design
is done in different combinations including
photovoltaic-wind-fuel cell hybrid
(HPVWTFC), photovoltaic-fuel cell
(HPVFC) and wind-fuel cell (HWTFC)
based on GWO method for Bushehr. The best
combination of hybrid system is determined
in view of cost and reliability for Bushehr. To
validate the GWO method, its performance in
system design has been compared and
analyzed with particle swarm optimization
method. has been compared and analyzed
with particle swarm optimization method.
Contributions of the paper are as follows:
• A framework for designing of a renewable
hybrid photovoltaic-wind-fuel cell system
based on hydrogen storage for Bushehr
region as a case study as new research
• Using of real data of solar irradiance and
wind speed of Bushehr of hybrid system
designing
• Designing of different combination based
on renewable sources and hydrogen
storage for Bushehr as a new research
• Determination of best combination of
hybrid system for Bushehr considering
Cost/Reliability evaluation
• Application of well-known meta-heuristic
algorithm named grey wolf optimizer
(GWO) for optimal designing of the
hybrid system
• Comparison of the cost of energy (COE)
(cost for each kWh supplying the load)
obtained for Bushehr with some regions in
Iran with different hybrid systems
• Also evaluation of considering outage rate
of renewable energy sources in cost and
reliability of designing
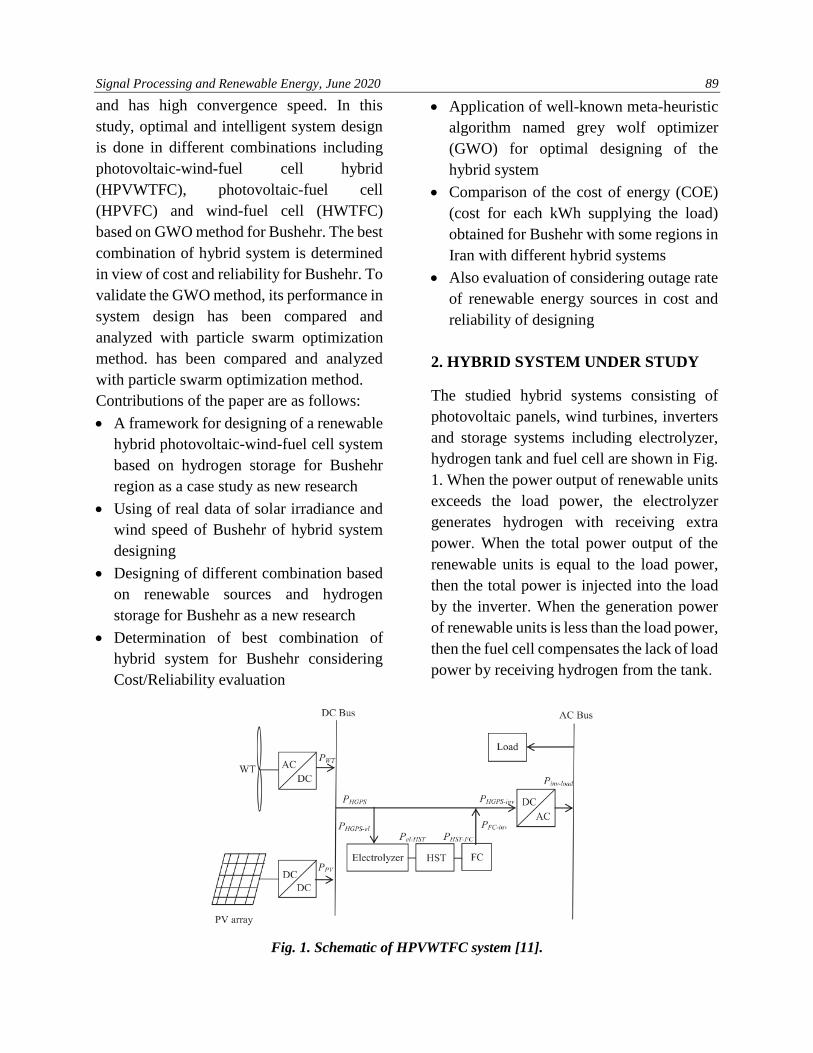
2. HYBRID SYSTEM UNDER STUDY
The studied hybrid systems consisting of
photovoltaic panels, wind turbines, inverters
and storage systems including electrolyzer,
hydrogen tank and fuel cell are shown in Fig.
1. When the power output of renewable units
exceeds the load power, the electrolyzer
generates hydrogen with receiving extra
power. When the total power output of the
renewable units is equal to the load power,
then the total power is injected into the load
by the inverter. When the generation power
of renewable units is less than the load power,
then the fuel cell compensates the lack of load
power by receiving hydrogen from the tank.
Fig. 1. Schematic of HPVWTFC system [11].
90 Ansari Nezhad, Najafi. Optimal and Intelligent Designing …
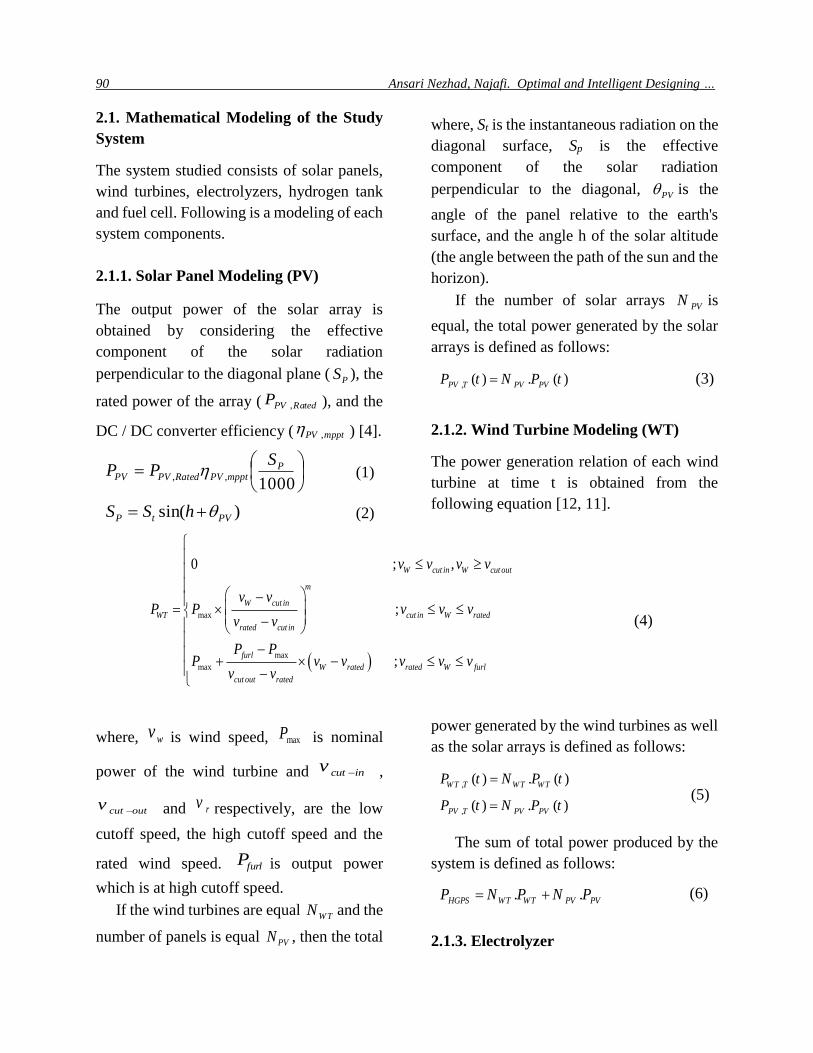
2.1. Mathematical Modeling of the Study
System
The system studied consists of solar panels,
wind turbines, electrolyzers, hydrogen tank
and fuel cell. Following is a modeling of each
system components.
2.1.1. Solar Panel Modeling (PV)
The output power of the solar array is
obtained by considering the effective
component of the solar radiation
perpendicular to the diagonal plane (PS ), the
rated power of the array ( ,PV RatedP ), and the
DC / DC converter efficiency ( ,PV mppt ) [4].
=
1000,,
PmpptPVRatedPVPV
SPP
(1)
)sin( PVtP hSS += (2)
where, St is the instantaneous radiation on the
diagonal surface, Sp is the effective
component of the solar radiation
perpendicular to the diagonal, PV is the
angle of the panel relative to the earth's
surface, and the angle h of the solar altitude
(the angle between the path of the sun and the
horizon).
If the number of solar arrays PVN is
equal, the total power generated by the solar
arrays is defined as follows:
, ( ) . ( )PV T PV PVP t N P t= (3)
2.1.2. Wind Turbine Modeling (WT)
The power generation relation of each wind
turbine at time t is obtained from the
following equation [12, 11].
( )
max
max
max
0 ; ,
;
;
W cut in W cut out
m
W cut in
WT cut in W rated
rated cut in
furl
W rated rated W furl
cut out rated
v v v v
v vP P v v v
v v
P PP v v v v v
v v
− = −
− + −
−
(4)
where, wv is wind speed, maxP is nominal
power of the wind turbine and cut inv − ,
cut outv − and rv respectively, are the low
cutoff speed, the high cutoff speed and the
rated wind speed. furlP is output power
which is at high cutoff speed.
If the wind turbines are equal WTN and the
number of panels is equal PVN , then the total
power generated by the wind turbines as well
as the solar arrays is defined as follows:
, ( ) . ( )WT T WT WTP t N P t=
, ( ) . ( )PV T PV PVP t N P t= (5)
The sum of total power produced by the
system is defined as follows:
. .HGPS WT WT PV PVP N P N P= + (6)
2.1.3. Electrolyzer
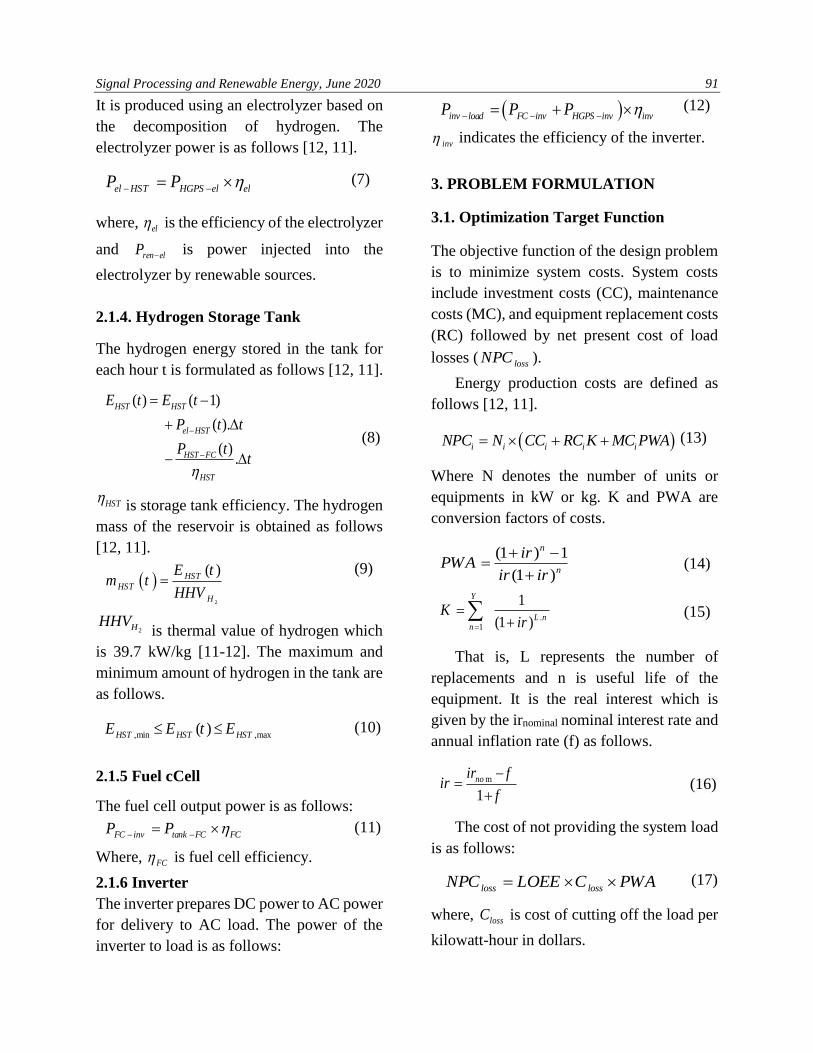
Signal Processing and Renewable Energy, June 2020 91
It is produced using an electrolyzer based on
the decomposition of hydrogen. The
electrolyzer power is as follows [12, 11].
el HST HGPS el elP P − −= (7)
where, el is the efficiency of the electrolyzer
and elrenP − is power injected into the
electrolyzer by renewable sources.
2.1.4. Hydrogen Storage Tank
The hydrogen energy stored in the tank for
each hour t is formulated as follows [12, 11].
( ) ( 1)
( ).
( ).
HST HST
el HST
HST FC
HST
E t E t
P t t
P tt
−
−
= −
+
−
(8)
HSTis storage tank efficiency. The hydrogen
mass of the reservoir is obtained as follows
[12, 11].
( )2
( )HST
HST
H
E tm t
HHV=
(9)
2HHHV is thermal value of hydrogen which
is 39.7 kW/kg [11-12]. The maximum and
minimum amount of hydrogen in the tank are
as follows.
,min ,max( )HST HST HSTE E t E (10)
2.1.5 Fuel cCell
The fuel cell output power is as follows:
FC inv tank FC FCP P − −= (11)
Where, FC is fuel cell efficiency.
2.1.6 Inverter
The inverter prepares DC power to AC power
for delivery to AC load. The power of the
inverter to load is as follows:
( )inv load FC inv HGPS inv invP P P − − −= + (12)
inv indicates the efficiency of the inverter.
3. PROBLEM FORMULATION
3.1. Optimization Target Function
The objective function of the design problem
is to minimize system costs. System costs
include investment costs (CC), maintenance
costs (MC), and equipment replacement costs
(RC) followed by net present cost of load
losses ( lossNPC ).
Energy production costs are defined as
follows [12, 11].
(13) ( )i i i i iNPC N CC RC K MC PWA= + +
Where N denotes the number of units or
equipments in kW or kg. K and PWA are
conversion factors of costs.
(1 ) 1
(1 )
n
n
irPWA
ir ir
+ −=
+ (14)
.1
1
(1 )
Y
L nn
Kir=
=+
(15)
That is, L represents the number of
replacements and n is useful life of the
equipment. It is the real interest which is
given by the irnominal nominal interest rate and
annual inflation rate (f) as follows.
m
1
noir fir
f
−=
+ (16)
The cost of not providing the system load
is as follows:
(17) loss lossNPC LOEE C PWA=
where, lossC is cost of cutting off the load per
kilowatt-hour in dollars.
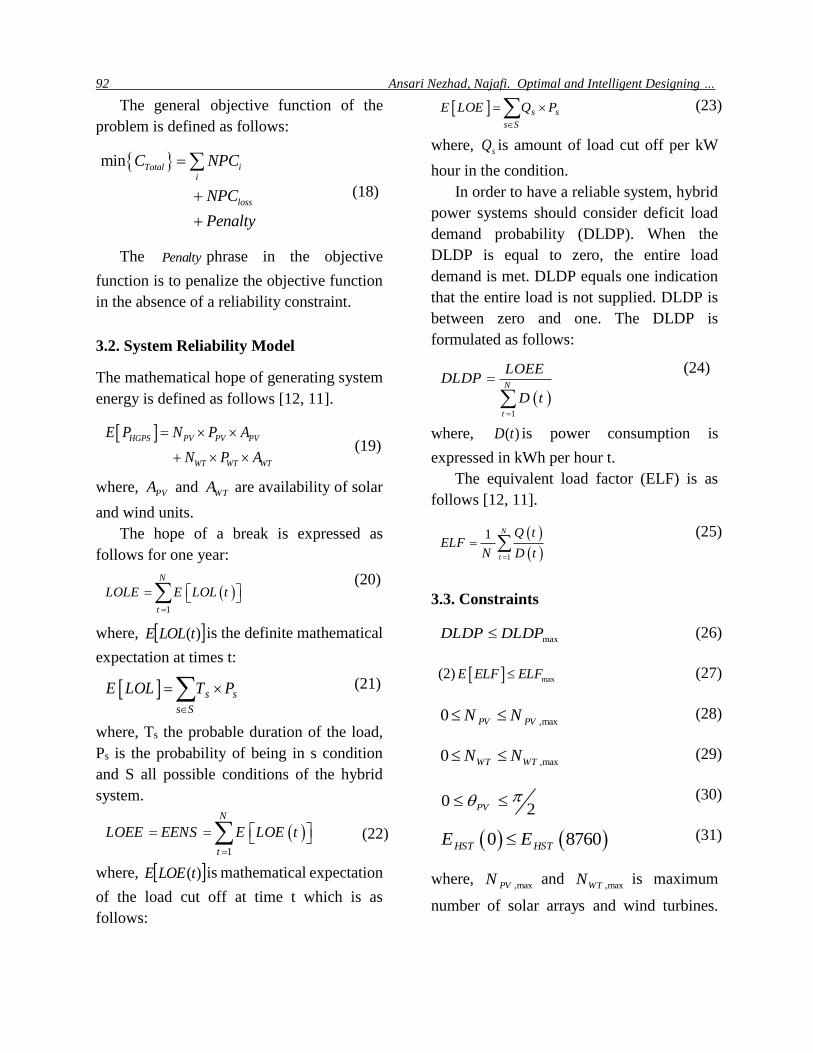
92 Ansari Nezhad, Najafi. Optimal and Intelligent Designing …
The general objective function of the
problem is defined as follows:
(18)
min Total ii
loss
C NPC
NPC
Penalty
=
+
+
The Penalty phrase in the objective
function is to penalize the objective function
in the absence of a reliability constraint.
3.2. System Reliability Model
The mathematical hope of generating system
energy is defined as follows [12, 11].
HGPS PV PV PV
WT WT WT
E P N P A
N P A
=
+ (19)
where, PVA and WTA are availability of solar
and wind units.
The hope of a break is expressed as
follows for one year:
( )1
N
t
LOLE E LOL t
=
= (20)
where, )(tLOLE is the definite mathematical
expectation at times t:
s s
s S
E LOL T P
= (21)
where, Ts the probable duration of the load,
Ps is the probability of being in s condition
and S all possible conditions of the hybrid
system.
( )1
N
t
LOEE EENS E LOE t
=
= = (22)
where, )(tLOEE is mathematical expectation
of the load cut off at time t which is as
follows:
s s
s S
E LOE Q P
= (23)
where, sQ is amount of load cut off per kW
hour in the condition.
In order to have a reliable system, hybrid
power systems should consider deficit load
demand probability (DLDP). When the
DLDP is equal to zero, the entire load
demand is met. DLDP equals one indication
that the entire load is not supplied. DLDP is
between zero and one. The DLDP is
formulated as follows:
( )1
N
t
LOEEDLDP
D t=
=
(24)
where, )(tD is power consumption is
expressed in kWh per hour t.
The equivalent load factor (ELF) is as
follows [12, 11].
( )
( )1
1 N
t
Q tELF
N D t=
= (25)
3.3. Constraints
maxDLDP DLDP
(26)
(2) maxE ELF ELF
(27)
,max0 PV PVN N (28)
,max0 WT WTN N
(29)
02PV
(30)
( ) ( )0 8760HST HSTE E (31)
where, ,maxPVN and
,maxWTN is maximum
number of solar arrays and wind turbines.
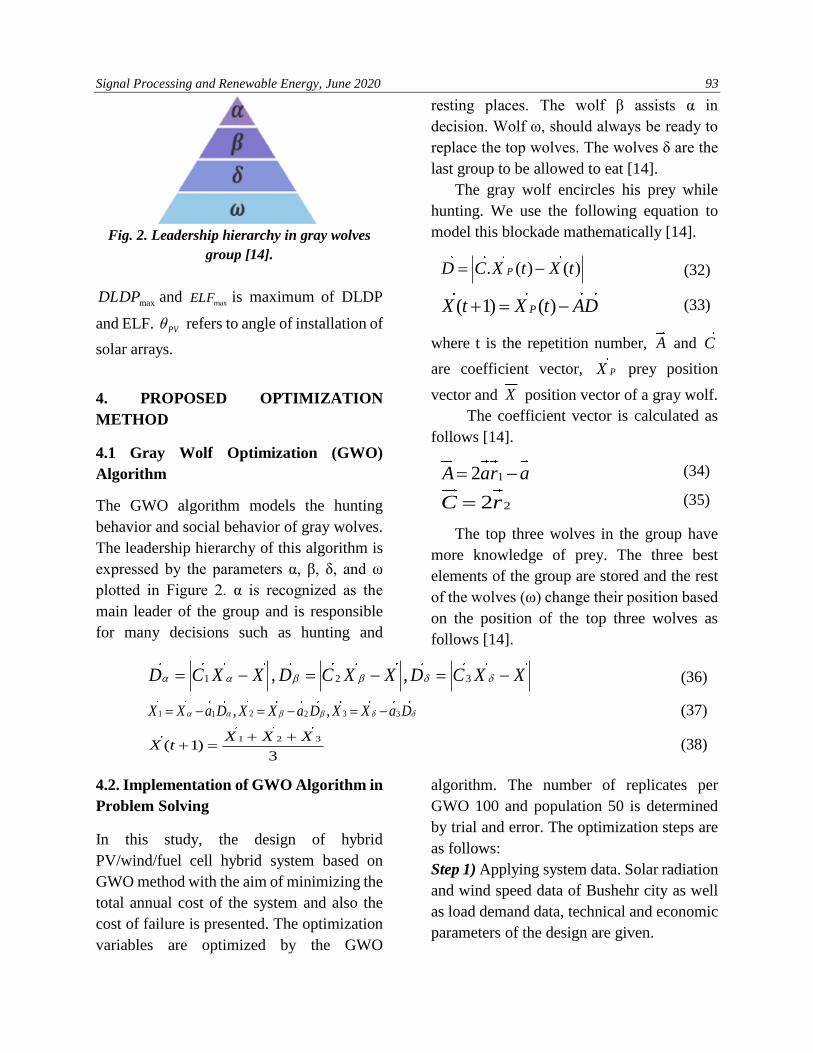
Signal Processing and Renewable Energy, June 2020 93
Fig. 2. Leadership hierarchy in gray wolves
group [14].
maxDLDP and maxELF is maximum of DLDP
and ELF. PV refers to angle of installation of
solar arrays.
4. PROPOSED OPTIMIZATION
METHOD
4.1 Gray Wolf Optimization (GWO)
Algorithm
The GWO algorithm models the hunting
behavior and social behavior of gray wolves.
The leadership hierarchy of this algorithm is
expressed by the parameters α, β, δ, and ω
plotted in Figure 2. α is recognized as the
main leader of the group and is responsible
for many decisions such as hunting and
resting places. The wolf β assists α in
decision. Wolf ω, should always be ready to
replace the top wolves. The wolves δ are the
last group to be allowed to eat [14].
The gray wolf encircles his prey while
hunting. We use the following equation to
model this blockade mathematically [14].
(32) . ( ) ( )PD C X t X t= −
(33) ( 1) ( )PX t X t AD+ = −
where t is the repetition number, A and C
are coefficient vector, PX prey position
vector and X position vector of a gray wolf.
The coefficient vector is calculated as
follows [14].
(34) 12A ar a= −
(35) 22C r=
The top three wolves in the group have
more knowledge of prey. The three best
elements of the group are stored and the rest
of the wolves (ω) change their position based
on the position of the top three wolves as
follows [14].
(36)
(37)
(38)
4.2. Implementation of GWO Algorithm in
Problem Solving
In this study, the design of hybrid
PV/wind/fuel cell hybrid system based on
GWO method with the aim of minimizing the
total annual cost of the system and also the
cost of failure is presented. The optimization
variables are optimized by the GWO
algorithm. The number of replicates per
GWO 100 and population 50 is determined
by trial and error. The optimization steps are
as follows:
Step 1) Applying system data. Solar radiation
and wind speed data of Bushehr city as well
as load demand data, technical and economic
parameters of the design are given.
1 2 3, ,D C X X D C X X D C X X = − = − = −
1 2 31 2 3, ,X X a D X X a D X X a D = − = − = −
1 2 3( 1)
3
X X XX t
+ ++ =
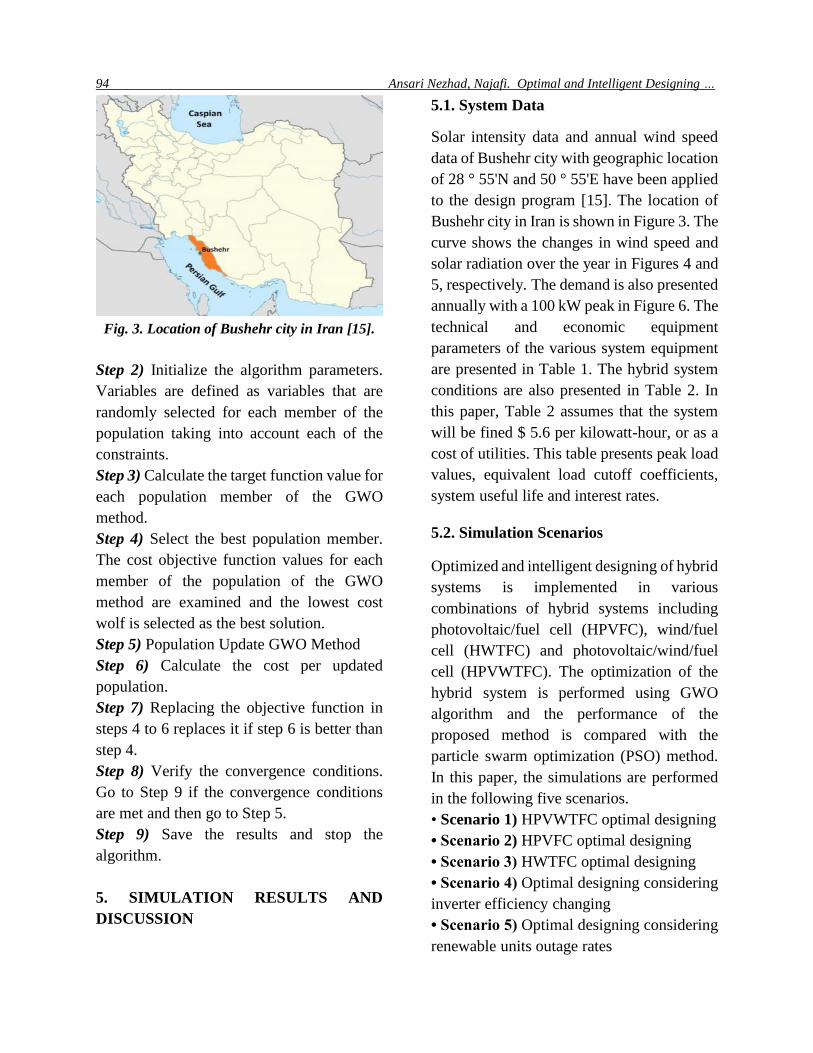
94 Ansari Nezhad, Najafi. Optimal and Intelligent Designing …
Fig. 3. Location of Bushehr city in Iran [15].
Step 2) Initialize the algorithm parameters.
Variables are defined as variables that are
randomly selected for each member of the
population taking into account each of the
constraints.
Step 3) Calculate the target function value for
each population member of the GWO
method.
Step 4) Select the best population member.
The cost objective function values for each
member of the population of the GWO
method are examined and the lowest cost
wolf is selected as the best solution.
Step 5) Population Update GWO Method
Step 6) Calculate the cost per updated
population.
Step 7) Replacing the objective function in
steps 4 to 6 replaces it if step 6 is better than
step 4.
Step 8) Verify the convergence conditions.
Go to Step 9 if the convergence conditions
are met and then go to Step 5.
Step 9) Save the results and stop the
algorithm.
5. SIMULATION RESULTS AND
DISCUSSION
5.1. System Data
Solar intensity data and annual wind speed
data of Bushehr city with geographic location
of 28 ° 55'N and 50 ° 55'E have been applied
to the design program [15]. The location of
Bushehr city in Iran is shown in Figure 3. The
curve shows the changes in wind speed and
solar radiation over the year in Figures 4 and
5, respectively. The demand is also presented
annually with a 100 kW peak in Figure 6. The
technical and economic equipment
parameters of the various system equipment
are presented in Table 1. The hybrid system
conditions are also presented in Table 2. In
this paper, Table 2 assumes that the system
will be fined $ 5.6 per kilowatt-hour, or as a
cost of utilities. This table presents peak load
values, equivalent load cutoff coefficients,
system useful life and interest rates.
5.2. Simulation Scenarios
Optimized and intelligent designing of hybrid
systems is implemented in various
combinations of hybrid systems including
photovoltaic/fuel cell (HPVFC), wind/fuel
cell (HWTFC) and photovoltaic/wind/fuel
cell (HPVWTFC). The optimization of the
hybrid system is performed using GWO
algorithm and the performance of the
proposed method is compared with the
particle swarm optimization (PSO) method.
In this paper, the simulations are performed
in the following five scenarios.
• Scenario 1) HPVWTFC optimal designing
• Scenario 2) HPVFC optimal designing
• Scenario 3) HWTFC optimal designing
• Scenario 4) Optimal designing considering
inverter efficiency changing
• Scenario 5) Optimal designing considering
renewable units outage rates
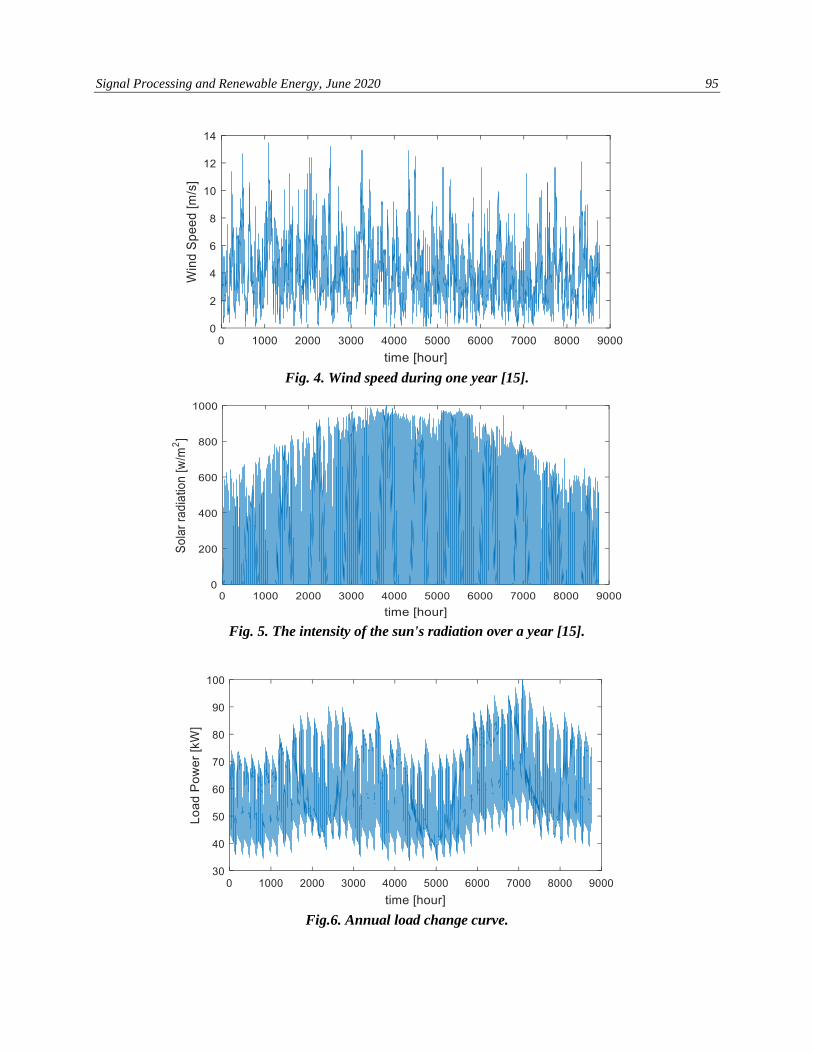
Signal Processing and Renewable Energy, June 2020 95
Fig. 4. Wind speed during one year [15].
Fig. 5. The intensity of the sun's radiation over a year [15].
Fig.6. Annual load change curve.
96 Ansari Nezhad, Najafi. Optimal and Intelligent Designing …
Table 1. System Equipment Parameters [11-12].
Lifetime
(Year)
Efficiency
(%)
Availability
(%)
Maintenance
and
Repair Cost
(US$/unit-yr)
Replacement
Cost
(US$/unit)
Investment
Cost
(US$/unit)
Device
20 - 96 75 15000 19400 Wind Turbine
20 - 96 20 6000 7000 PV panel
20 75 100 25 1500 2000 Electrolyzer
20 95 100 15 1200 1300 Hydrogen
Tank
5 50 100 175 2500 3000 Fuel cell
15 90 99.89 8 750 800 Converter
DC/AC
Table 2. Requirements for the studied system [11-12].
System lifespan Real interest rate maxELF Load peak Cost of load loss
20 yrs 6 % 0.01 100 kW 5.6 US$/kWh
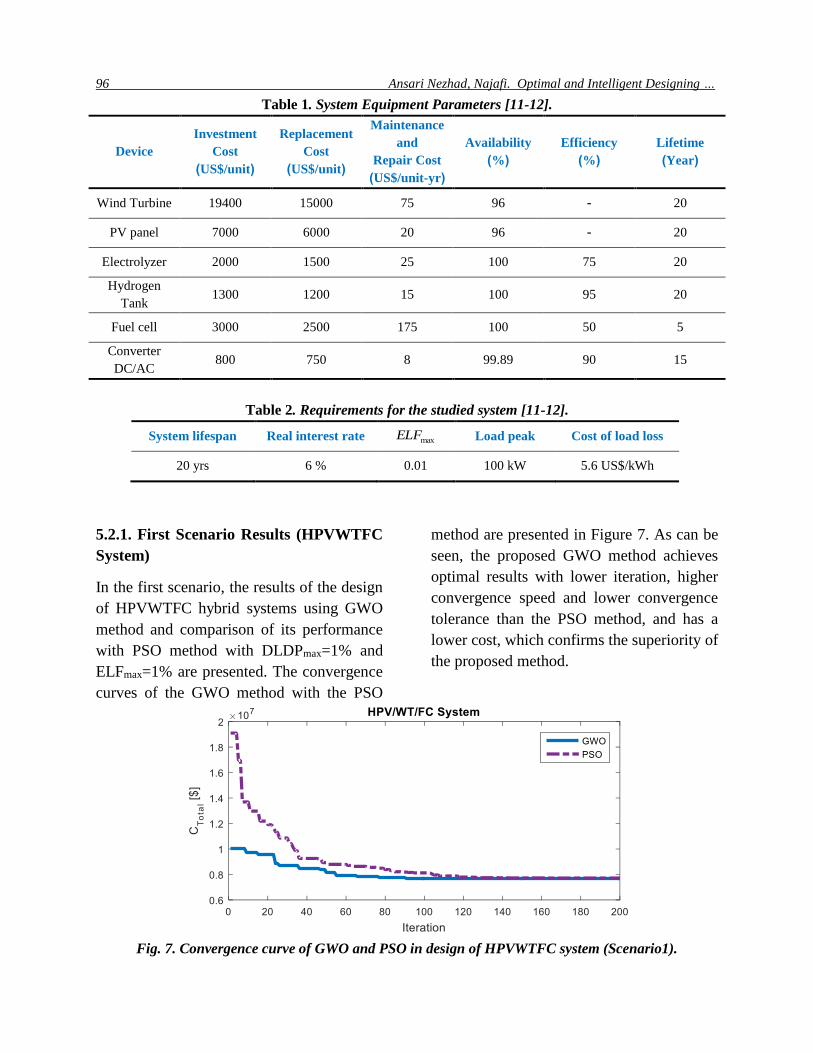
5.2.1. First Scenario Results (HPVWTFC
System)
In the first scenario, the results of the design
of HPVWTFC hybrid systems using GWO
method and comparison of its performance
with PSO method with DLDPmax=1% and
ELFmax=1% are presented. The convergence
curves of the GWO method with the PSO
method are presented in Figure 7. As can be
seen, the proposed GWO method achieves
optimal results with lower iteration, higher
convergence speed and lower convergence
tolerance than the PSO method, and has a
lower cost, which confirms the superiority of
the proposed method.
Fig. 7. Convergence curve of GWO and PSO in design of HPVWTFC system (Scenario1).

Signal Processing and Renewable Energy, June 2020 97
Table 3. Optimal components capacity in HPVWTFC system design (Scenario 1).
WGN PVN elP tankM FCP invP PV Algorithm
0 715 366.52 470.61 90.05 95.20 46.03 GWO
0 756 376.38 248.46 89.47 95.04 43.70 PSO
Table 4. Costs and reliability indices for HPVWTFC system design (Scenario 1).
( $)TotalC MUS ELF ( )/MWL E hE yrO DLDP ( )/hL E rL yrO
Algorithm
7.697 0.0014 1.115 0.0021 241 GWO
7.709 0.0016 1.231 0.0023 258 PSO
Numerical results of HPVWTFC system
design based on GWO and PSO methods
including optimal equipment capacity and
cost and reliability indices are presented in
Tables 3 and 4, respectively. It is observed
that the proposed methods did not utilize
wind energy to supply load on hybrid
systems. Because of the wind situation in
Bushehr, it does not have the potential to
generate energy in the form of renewable
hybrid systems and is not economical.
Therefore, optimization methods have
neglected the cost of hybrid systems due to
the high cost of using wind energy.
Optimization variables based on GWO
method are 715 solar panels, 366.52 kW
electrolyzer power, 470.61 kg tank hydrogen
mass, 90.05 kW fuel cell power, 95.20 kW
inverter to solar load angle and 46.03-degree
solar panels angle. It can be seen that the cost
of GWO and PSO methods is $ 7.697 and $
7.709 million, DLDP is 0.0021 and
0.0023,respectively, and the number of fixed
hours per year is 241 and 258 hours,
respectively.
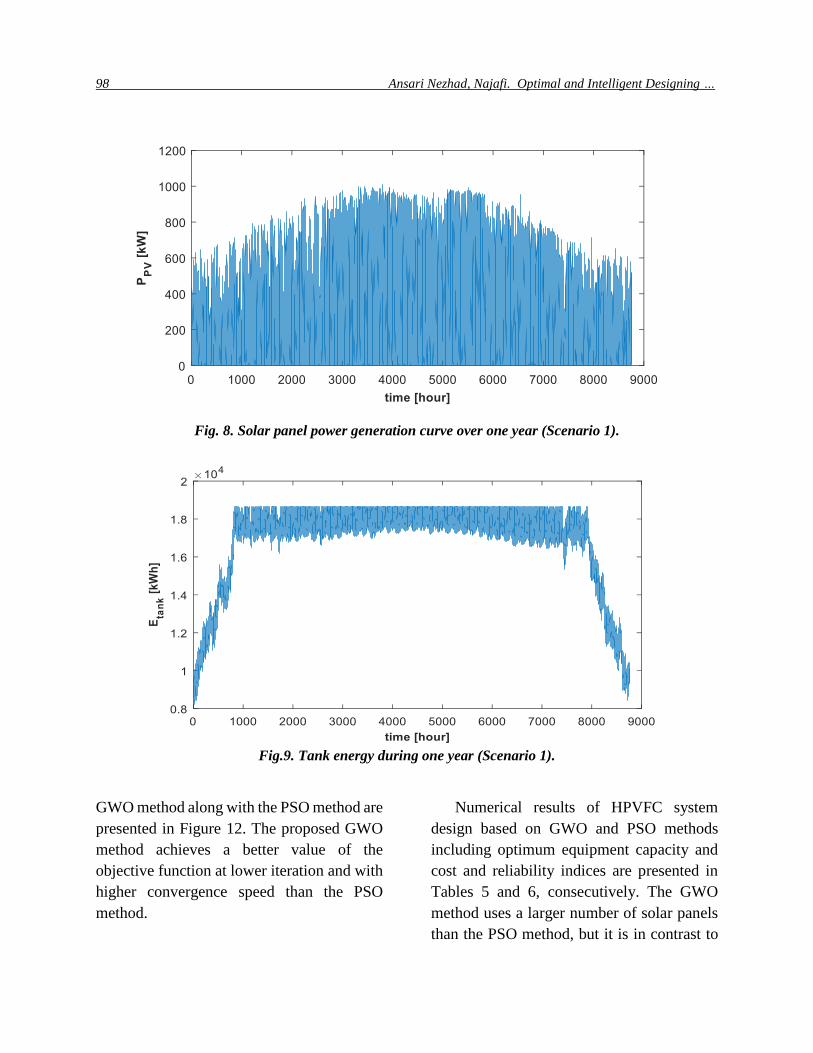
The curves of solar panel power
generation and tank storage energy changing
over a year (for the GWO method) are shown
in Figures 8 and 9, respectively.
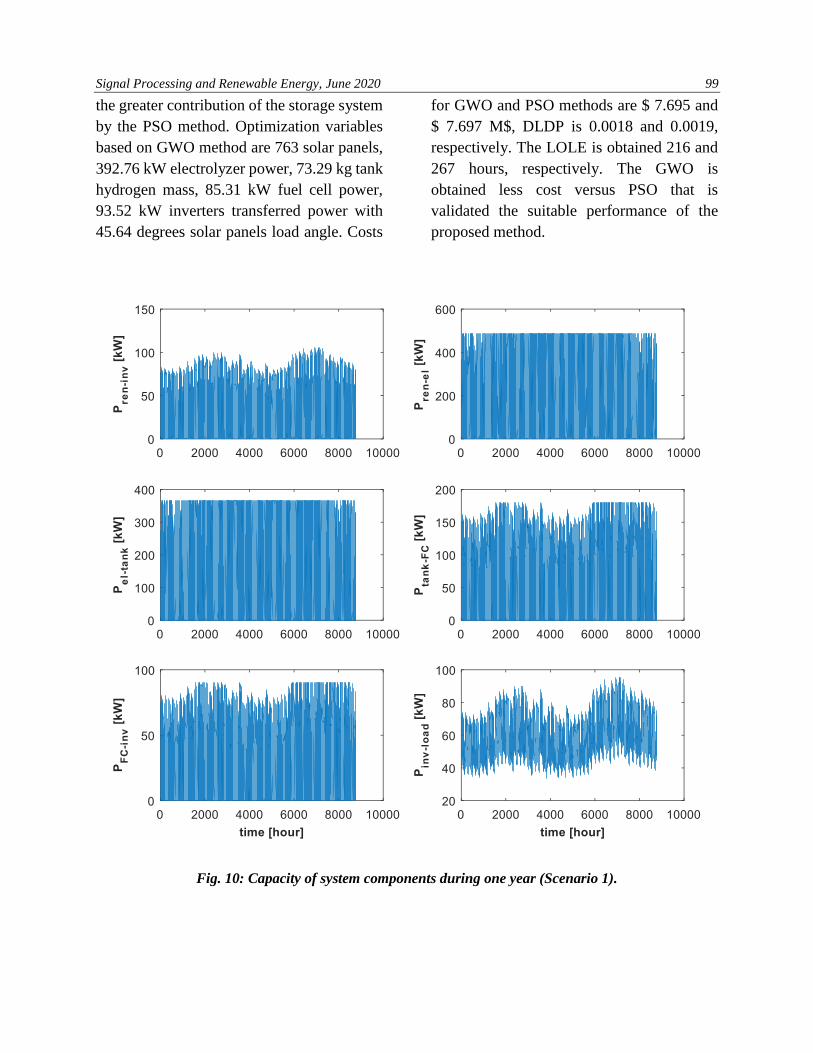
Figure 10 also shows the power transfer
to the inverter, the electrolyzer to the tank,
and the fuel cell to the inverter, as well as the
power to the electrolyzer, the fuel cell, and
the inverter to load over a year.
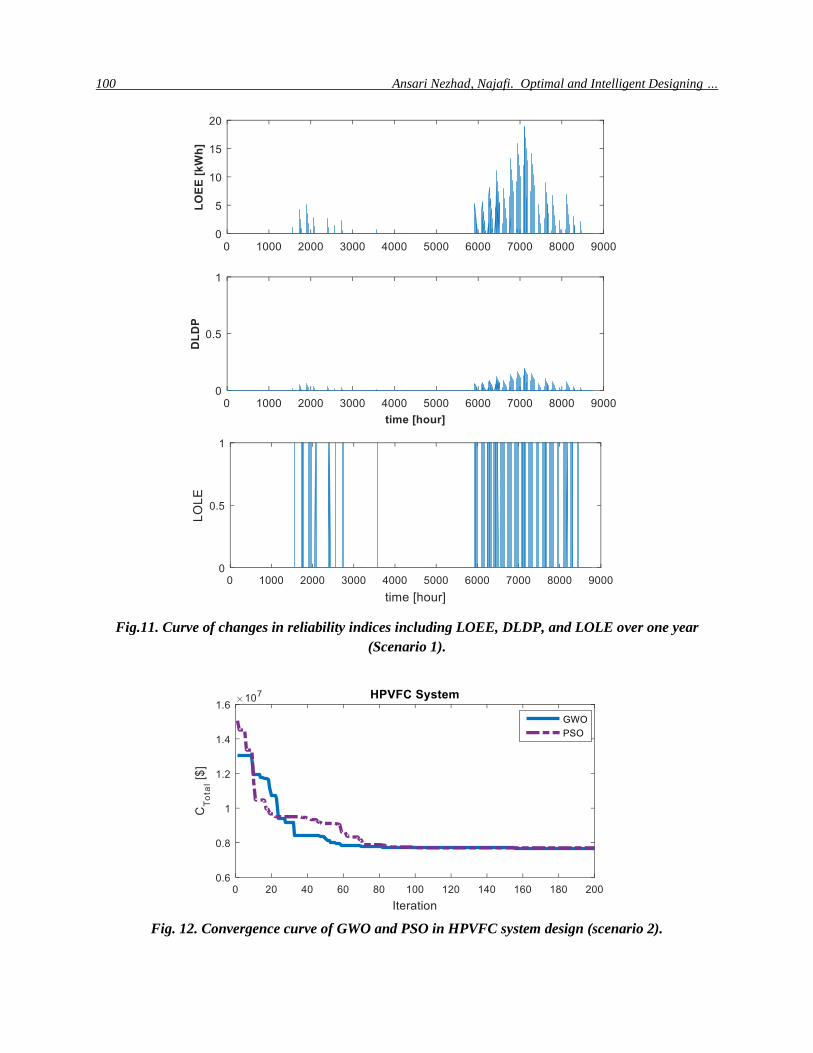
The curve of changes in reliability indices
including LOEE, DLDP and LOLE over a
year (for the GWO method) is shown in
Figure 11.
5.2.2. Second Scenario Results (Optimized
Design of HPVFC Hybrid Systems)
In the second scenario, the results of HPVFC
hybrid system design using GWO method
and comparing its performance with PSO
method with DLDPmax=1% and ELFmax=1%
are presented. The convergence curves of the
98 Ansari Nezhad, Najafi. Optimal and Intelligent Designing …
Fig. 8. Solar panel power generation curve over one year (Scenario 1).
Fig.9. Tank energy during one year (Scenario 1).
GWO method along with the PSO method are
presented in Figure 12. The proposed GWO
method achieves a better value of the
objective function at lower iteration and with
higher convergence speed than the PSO
method.
Numerical results of HPVFC system
design based on GWO and PSO methods
including optimum equipment capacity and
cost and reliability indices are presented in
Tables 5 and 6, consecutively. The GWO
method uses a larger number of solar panels
than the PSO method, but it is in contrast to
Signal Processing and Renewable Energy, June 2020 99
the greater contribution of the storage system
by the PSO method. Optimization variables
based on GWO method are 763 solar panels,
392.76 kW electrolyzer power, 73.29 kg tank
hydrogen mass, 85.31 kW fuel cell power,
93.52 kW inverters transferred power with
45.64 degrees solar panels load angle. Costs
for GWO and PSO methods are $ 7.695 and
$ 7.697 M$, DLDP is 0.0018 and 0.0019,
respectively. The LOLE is obtained 216 and
267 hours, respectively. The GWO is
obtained less cost versus PSO that is
validated the suitable performance of the
proposed method.
Fig. 10: Capacity of system components during one year (Scenario 1).
100 Ansari Nezhad, Najafi. Optimal and Intelligent Designing …
Fig.11. Curve of changes in reliability indices including LOEE, DLDP, and LOLE over one year
(Scenario 1).
Fig. 12. Convergence curve of GWO and PSO in HPVFC system design (scenario 2).
Signal Processing and Renewable Energy, June 2020 101
Table 5. Optimal capacity of components for HPVFC system design (Scenario 2).
PVN elP tankM FCP invP PV Algorithm
763 392.76 73.29 85.31 93.52 45.64 GWO
745 378.10 95.92 90.04 92.82 44.73 PSO
Table 6. Cost values and reliability indices in HPVFC system design (Scenario 2).
( $)TotalC MUS ELF ( )/MWL E hE yrO DLDP ( )/hL E rL yrO
Algorithm
7.695 0.0013 0.988 0.0018 216 GWO
7.697 0.0015 0.993 0.0019 267 PSO
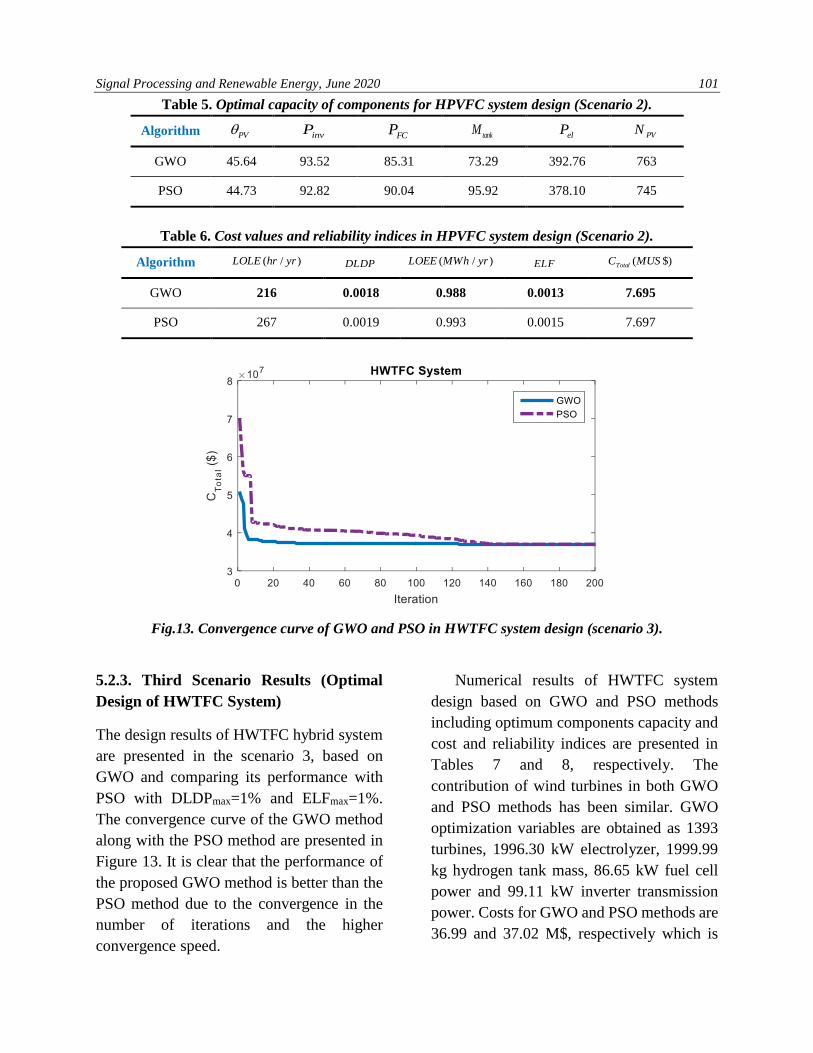
Fig.13. Convergence curve of GWO and PSO in HWTFC system design (scenario 3).
5.2.3. Third Scenario Results (Optimal
Design of HWTFC System)
The design results of HWTFC hybrid system
are presented in the scenario 3, based on
GWO and comparing its performance with
PSO with DLDPmax=1% and ELFmax=1%.
The convergence curve of the GWO method
along with the PSO method are presented in
Figure 13. It is clear that the performance of
the proposed GWO method is better than the
PSO method due to the convergence in the
number of iterations and the higher
convergence speed.
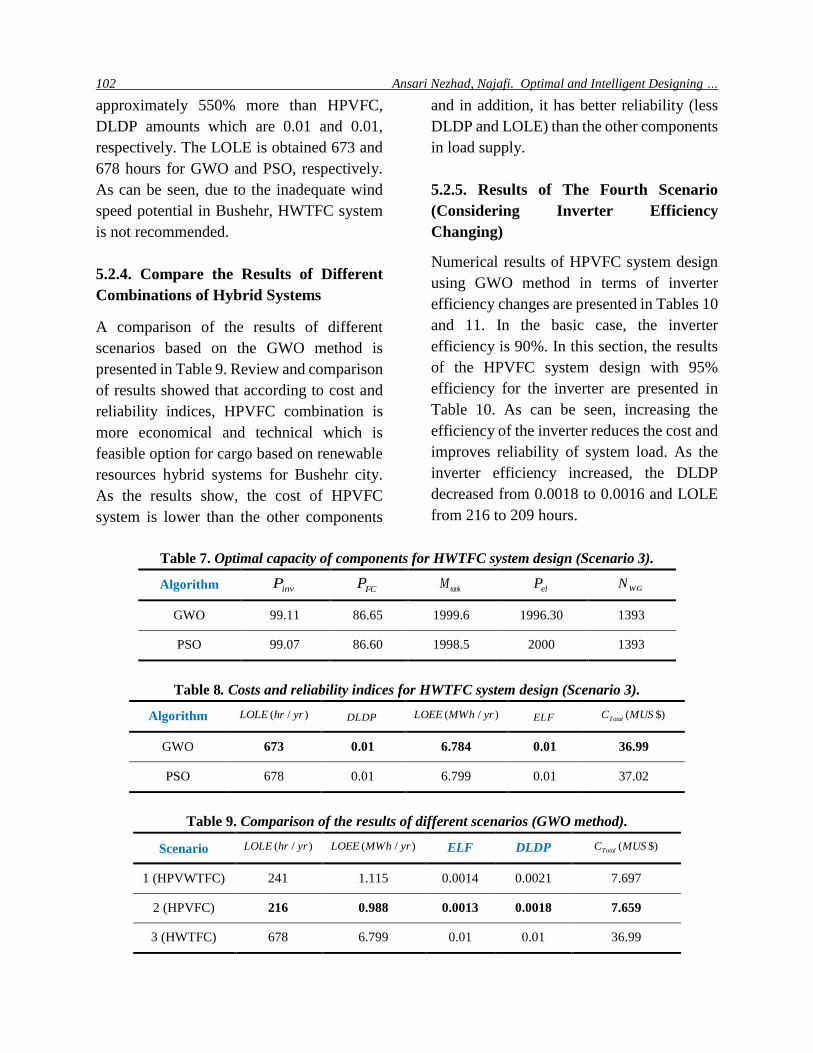
Numerical results of HWTFC system
design based on GWO and PSO methods
including optimum components capacity and
cost and reliability indices are presented in
Tables 7 and 8, respectively. The
contribution of wind turbines in both GWO
and PSO methods has been similar. GWO
optimization variables are obtained as 1393
turbines, 1996.30 kW electrolyzer, 1999.99
kg hydrogen tank mass, 86.65 kW fuel cell
power and 99.11 kW inverter transmission
power. Costs for GWO and PSO methods are
36.99 and 37.02 M$, respectively which is
102 Ansari Nezhad, Najafi. Optimal and Intelligent Designing …
approximately 550% more than HPVFC,
DLDP amounts which are 0.01 and 0.01,
respectively. The LOLE is obtained 673 and
678 hours for GWO and PSO, respectively.
As can be seen, due to the inadequate wind
speed potential in Bushehr, HWTFC system
is not recommended.
5.2.4. Compare the Results of Different
Combinations of Hybrid Systems
A comparison of the results of different
scenarios based on the GWO method is
presented in Table 9. Review and comparison
of results showed that according to cost and
reliability indices, HPVFC combination is
more economical and technical which is
feasible option for cargo based on renewable
resources hybrid systems for Bushehr city.
As the results show, the cost of HPVFC
system is lower than the other components
and in addition, it has better reliability (less
DLDP and LOLE) than the other components
in load supply.
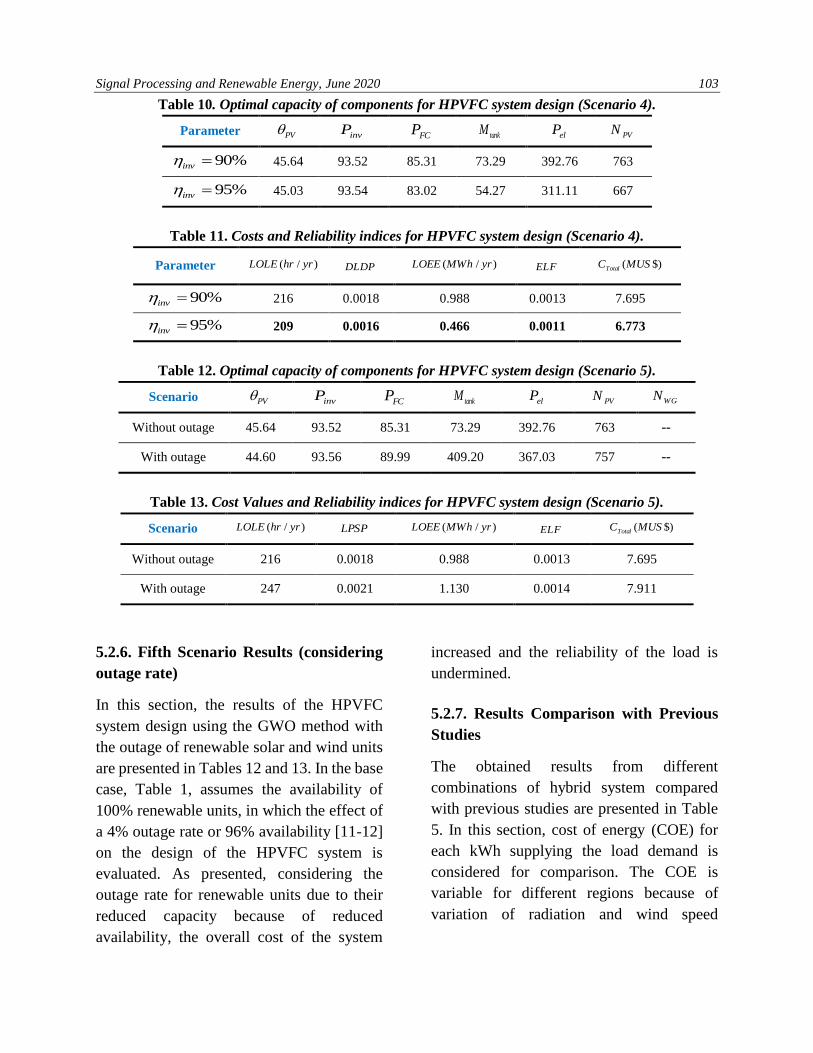
5.2.5. Results of The Fourth Scenario
(Considering Inverter Efficiency
Changing)
Numerical results of HPVFC system design
using GWO method in terms of inverter
efficiency changes are presented in Tables 10
and 11. In the basic case, the inverter
efficiency is 90%. In this section, the results
of the HPVFC system design with 95%
efficiency for the inverter are presented in
Table 10. As can be seen, increasing the
efficiency of the inverter reduces the cost and
improves reliability of system load. As the
inverter efficiency increased, the DLDP
decreased from 0.0018 to 0.0016 and LOLE
from 216 to 209 hours.
Table 7. Optimal capacity of components for HWTFC system design (Scenario 3).
WGN elP tankM FCP invP Algorithm
1393 1996.30 1999.6 86.65 99.11 GWO
1393 2000 1998.5 86.60 99.07 PSO
Table 8. Costs and reliability indices for HWTFC system design (Scenario 3).
( $)TotalC MUS ELF ( )/MWL E hE yrO DLDP ( )/hL E rL yrO
Algorithm
36.99 0.01 6.784 0.01 673 GWO
37.02 0.01 6.799 0.01 678 PSO
Table 9. Comparison of the results of different scenarios (GWO method).
( $)TotalC MUS DLDP ELF ( )/MWL E hE yrO ( )/hL E rL yrO Scenario
7.697 0.0021 0.0014 1.115 241 1 (HPVWTFC)
7.659 0.0018 0.0013 0.988 216 2 (HPVFC)
36.99 0.01 0.01 6.799 678 3 (HWTFC)
Signal Processing and Renewable Energy, June 2020 103
Table 10. Optimal capacity of components for HPVFC system design (Scenario 4).
PVN elP tankM FCP invP PV Parameter
763 392.76 73.29 85.31 93.52 45.64 90%inv =
667 311.11 54.27 83.02 93.54 45.03 95%inv =
Table 11. Costs and Reliability indices for HPVFC system design (Scenario 4).
( $)TotalC MUS ELF ( )/MWL E hE yrO DLDP ( )/hL E rL yrO
Parameter
7.695 0.0013 0.988 0.0018 216 90%inv =
6.773 0.0011 0.466 0.0016 209 95%inv =
Table 12. Optimal capacity of components for HPVFC system design (Scenario 5).
WGN PVN elP tankM FCP invP PV Scenario
-- 763 392.76 73.29 85.31 93.52 45.64 Without outage
-- 757 367.03 409.20 89.99 93.56 44.60 With outage
Table 13. Cost Values and Reliability indices for HPVFC system design (Scenario 5).
( $)TotalC MUS ELF ( )/MWL E hE yrO LPSP ( )/hL E rL yrO
Scenario
7.695 0.0013 0.988 0.0018 216 Without outage
7.911 0.0014 1.130 0.0021 247 With outage
5.2.6. Fifth Scenario Results (considering
outage rate)
In this section, the results of the HPVFC
system design using the GWO method with
the outage of renewable solar and wind units
are presented in Tables 12 and 13. In the base
case, Table 1, assumes the availability of
100% renewable units, in which the effect of
a 4% outage rate or 96% availability [11-12]
on the design of the HPVFC system is
evaluated. As presented, considering the
outage rate for renewable units due to their
reduced capacity because of reduced
availability, the overall cost of the system
increased and the reliability of the load is
undermined.
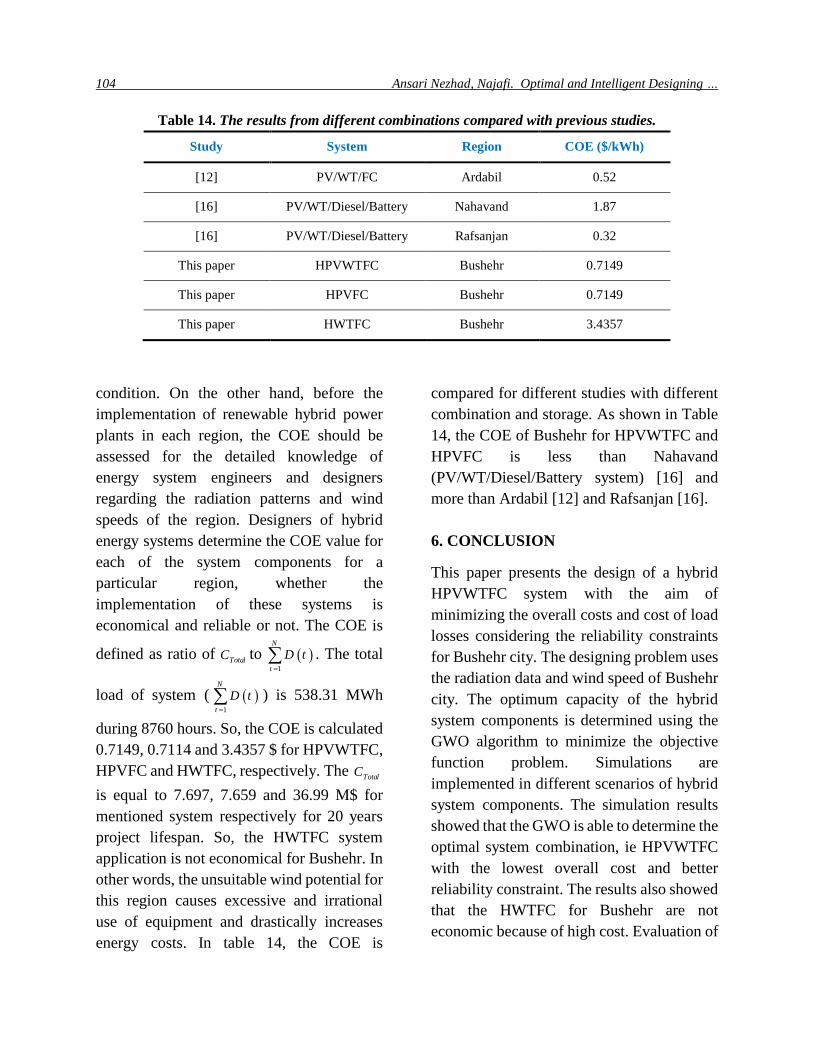
5.2.7. Results Comparison with Previous
Studies
The obtained results from different
combinations of hybrid system compared
with previous studies are presented in Table
5. In this section, cost of energy (COE) for
each kWh supplying the load demand is
considered for comparison. The COE is
variable for different regions because of
variation of radiation and wind speed
104 Ansari Nezhad, Najafi. Optimal and Intelligent Designing …
Table 14. The results from different combinations compared with previous studies.
Study System Region COE ($/kWh)
[12] PV/WT/FC Ardabil 0.52
[16] PV/WT/Diesel/Battery Nahavand 1.87
[16] PV/WT/Diesel/Battery Rafsanjan 0.32
This paper HPVWTFC Bushehr 0.7149
This paper HPVFC Bushehr 0.7149
This paper HWTFC Bushehr 3.4357
condition. On the other hand, before the
implementation of renewable hybrid power
plants in each region, the COE should be
assessed for the detailed knowledge of
energy system engineers and designers
regarding the radiation patterns and wind
speeds of the region. Designers of hybrid
energy systems determine the COE value for
each of the system components for a
particular region, whether the
implementation of these systems is
economical and reliable or not. The COE is
defined as ratio of TotalC to ( )
1
N
t
D t=
. The total
load of system ( ( )1
N
t
D t=
) is 538.31 MWh
during 8760 hours. So, the COE is calculated
0.7149, 0.7114 and 3.4357 $ for HPVWTFC,
HPVFC and HWTFC, respectively. The TotalC
is equal to 7.697, 7.659 and 36.99 M$ for
mentioned system respectively for 20 years
project lifespan. So, the HWTFC system
application is not economical for Bushehr. In
other words, the unsuitable wind potential for
this region causes excessive and irrational
use of equipment and drastically increases
energy costs. In table 14, the COE is
compared for different studies with different
combination and storage. As shown in Table
14, the COE of Bushehr for HPVWTFC and
HPVFC is less than Nahavand
(PV/WT/Diesel/Battery system) [16] and
more than Ardabil [12] and Rafsanjan [16].
6. CONCLUSION
This paper presents the design of a hybrid
HPVWTFC system with the aim of
minimizing the overall costs and cost of load
losses considering the reliability constraints
for Bushehr city. The designing problem uses
the radiation data and wind speed of Bushehr
city. The optimum capacity of the hybrid
system components is determined using the
GWO algorithm to minimize the objective
function problem. Simulations are
implemented in different scenarios of hybrid
system components. The simulation results
showed that the GWO is able to determine the
optimal system combination, ie HPVWTFC
with the lowest overall cost and better
reliability constraint. The results also showed
that the HWTFC for Bushehr are not
economic because of high cost. Evaluation of
Signal Processing and Renewable Energy, June 2020 105
the GWO in designing different
combinations of the hybrid system compared
to PAO has shown that it performs better in
achieving lower overall cost and better
reliability. In addition, the results showed
that the use of higher efficiency inverters
improves reliability and considering the
outage rate of renewable units undermines
the reliability of the system load.
REFERENCES
[1] Sawle, Y., Gupta, S. C., & Bohre, A. K.
(2018). Review of hybrid renewable
energy systems with comparative
analysis of off-grid hybrid system.
Renewable and Sustainable Energy
Reviews, 81, 2217-2235.
[2] Ackermann, T., Andersson, G., &
Söder, L. (2001). Distributed
generation: a definition. Electric power
systems research, 57(3), 195-204.
[3] Billinton, R., & Allan, R. N. (1992).
Reliability evaluation of engineering
systems (pp. 155-173). New York:
Plenum press.
[4] Shi, Z., Wang, R., & Zhang, T. (2015).
Multi-objective optimal design of
hybrid renewable energy systems using
preference-inspired coevolutionary
approach. Solar Energy, 118, 96-106.
[5] Maleki, A., & Askarzadeh, A. (2014).
Artificial bee swarm optimization for
optimum sizing of a stand-alone
PV/WT/FC hybrid system considering
LPSP concept. Solar Energy, 107, 227-
235.
[6] Prasad, A. R., & Natarajan, E. (2006).
Optimization of integrated
photovoltaic–wind power generation
systems with battery storage. Energy,
31(12), 1943-1954.
[7] [7] Kaabeche, A., & Ibtiouen, R.
(2014). Techno-economic optimization
of hybrid photovoltaic /wind/ diesel/
battery generation in a stand-alone
power system. Solar Energy, 103, 171-
182.
[8] Sharafi, M., & ELMekkawy, T. Y.
(2014). Multi-objective optimal design
of hybrid renewable energy systems
using PSO-simulation based approach.
Renewable Energy, 68, 67-79.
[9] Kaviani, A. K., Riahy, G. H., &
Kouhsari, S. M. (2009). Optimal design
of a reliable hydrogen-based stand-
alone wind/PV generating system,
considering component outages.
Renewable energy, 34(11), 2380-2390.
[10] Heydari, A., & Askarzadeh, A. (2016).
Techno-economic analysis of a
PV/biomass/fuel cell energy system
considering different fuel cell system
initial capital costs. Solar Energy, 133,
409-420.
[11] Gharavi, H., Ardehali, M. M., &
Ghanbari-Tichi, S. (2015). Imperial
competitive algorithm optimization of
fuzzy multi-objective design of a hybrid
green power system with considerations
for economics, reliability, and
environmental emissions. Renewable
Energy, 78, 427-437.
[12] Moghaddam, M. J. H., Kalam, A.,
Nowdeh, S. A., Ahmadi, A.,
Babanezhad, M., & Saha, S. (2019).
Optimal sizing and energy management
of stand-alone hybrid
photovoltaic/wind system based on
hydrogen storage considering LOEE
and LOLE reliability indices using
flower pollination algorithm.
Renewable Energy, 135, 1412-1434.
[13] Kaabeche, A., & Ibtiouen, R. (2014).
Techno-economic optimization of
hybrid photovoltaic/wind/diesel/battery
generation in a stand-alone power
system. Solar Energy, 103, 171-182.
106 Ansari Nezhad, Najafi. Optimal and Intelligent Designing …
[14] Mirjalili, S., Mirjalili, S. M., & Lewis,
A. (2014). Grey wolf optimizer.
Advances in Engineering Software, 69,
46-61.
[15] Iranian Renewable Energy
Organization (SUNA) Tehran, Iran.
Available from:
http://www.suna.org.ir/fa/sun/potential.
[16] Borhanazad, H., Mekhilef, S.,
Ganapathy, V. G., Modiri-Delshad, M.,
& Mirtaheri, A. (2014). Optimization of
micro-grid system using MOPSO.
Renewable Energy, 71, 295-306..