Optically Induced Thermal Gradients for Protein ...discovery.ucl.ac.uk/1399715/1/srep02130.pdf ·...
6
Optically Induced Thermal Gradients for Protein Characterization in Nanolitre-scale Samples in Microfluidic Devices D. M. Sagar 1,2 , Samir Aoudjane 1,2,3 , Matthieu Gaudet 1,2 , Gabriel Aeppli 2 & Paul A. Dalby 1 1 Department of Biochemical Engineering, Torrington Place, University College London, London, WC1E 7JE, U.K, 2 London Centre for Nanotechnology and Department of Physics and Astronomy, University College London, London, WC1H 0AH, U.K, 3 Division of Infection & Immunity, UCL, Cruciform Building, 90 Gower Street, LONDON WC1E 6BT. Proteins are the most vital biological functional units in every living cell. Measurement of protein stability is central to understanding their structure, function and role in diseases. While proteins are also sought as therapeutic agents, they can cause diseases by misfolding and aggregation in vivo. Here we demonstrate a novel method to measure protein stability and denaturation kinetics, on unprecedented timescales, through optically-induced heating of nanolitre samples in microfluidic capillaries. We obtain protein denaturation kinetics as a function of temperature, and accurate thermodynamic stability data, from a snapshot experiment on a single sample. We also report the first experimental characterization of optical heating in controlled microcapillary flow, verified by computational fluid dynamics modelling. Our results demonstrate that we now have the engineering science in hand to design integrated all-optical microfluidic chips for a diverse range of applications including in-vitro DNA amplification, healthcare diagnostics, and flow chemistry. P rotein stability measurement is key to the fundamental understanding of protein structure, folding and function in biology, as well as their role in diseases that result from misfolding and aggregation. The desire to characterise all human proteins and identify those that lead to diseases such as Alzheimer’s and Parkinson’s, as well as novel drugs that target them, is driving the need for low-volume and high throughput assays that can accurately measure protein stability, ligand binding affinity and kinetics of protein unfolding or aggregation 1–7 . We recently established a microfluidic approach to measure the extent of protein unfolding by pre-equilib- rating a series of nanolitre samples with chemical denaturants, and measuring their intrinsic protein fluor- escence 8 . This gave equilibrium stability measurements of the protein FKBP-12, and also the binding affinity of FKBP-12 to a small molecule drug compound, demonstrating the potential for drug discovery. We also used the technique to determine the impact of a mutation upon FKBP-12 stability, illustrating the power of the method for analysing the role of natural protein variations in genetic disorders. However, the use of chemical denaturants limited the throughput of protein stability measurements in nanolitre samples, as each stability curve requires typically 20–25 samples at different denaturant concentrations, and sample pre-equilibration for at least one hour. Here we combine a number of factors synergistically to significantly improve upon this throughput for protein stability, while also increasing the functionality to include kinetic measurements of protein denaturation. Thermal denaturation in classical larger-scale experiments improves throughput by step-wise ramping the temperature of a sample while continuously taking measurements 1,2,9–14 . This also avoids the need to introduce additional chemical denaturants into the sample. Thermal unfolding is also typically faster than chemical denaturation 8,15–17 , which therefore shortens the time to reach equilibrium. Microfluidics can minimise the sample volume and material required, but crucially also allow more rapid equilibration of the fluid temperature to that of the surrounding materials. Finally, optical stimulation provides direct sample heating for instantaneous temperature ramping and thermal control 18 . By contrast, the commonly used Peltier or resistive elements heat samples indirectly by conducting heat through the container walls. Such heating elements themselves take time to reach thermal equilibrium, and require electrical connections. While small but rapid temperature jumps have OPEN SUBJECT AREAS: BIOLOGICAL FLUORESCENCE THERMODYNAMICS LAB-ON-A-CHIP CONFORMATION Received 5 February 2013 Accepted 30 May 2013 Published 4 July 2013 Correspondence and requests for materials should be addressed to P.A.D. (p.dalby@ucl. ac.uk) SCIENTIFIC REPORTS | 3 : 2130 | DOI: 10.1038/srep02130 1
Transcript of Optically Induced Thermal Gradients for Protein ...discovery.ucl.ac.uk/1399715/1/srep02130.pdf ·...

Optically Induced Thermal Gradients forProtein Characterization inNanolitre-scale Samples in MicrofluidicDevicesD. M. Sagar1,2, Samir Aoudjane1,2,3, Matthieu Gaudet1,2, Gabriel Aeppli2 & Paul A. Dalby1
1Department of Biochemical Engineering, Torrington Place, University College London, London, WC1E 7JE, U.K, 2London Centre forNanotechnology and Department of Physics and Astronomy, University College London, London, WC1H 0AH, U.K, 3Division ofInfection & Immunity, UCL, Cruciform Building, 90 Gower Street, LONDON WC1E 6BT.
Proteins are the most vital biological functional units in every living cell. Measurement of protein stability iscentral to understanding their structure, function and role in diseases. While proteins are also sought astherapeutic agents, they can cause diseases by misfolding and aggregation in vivo. Here we demonstrate anovel method to measure protein stability and denaturation kinetics, on unprecedented timescales, throughoptically-induced heating of nanolitre samples in microfluidic capillaries. We obtain protein denaturationkinetics as a function of temperature, and accurate thermodynamic stability data, from a snapshotexperiment on a single sample. We also report the first experimental characterization of optical heating incontrolled microcapillary flow, verified by computational fluid dynamics modelling. Our resultsdemonstrate that we now have the engineering science in hand to design integrated all-optical microfluidicchips for a diverse range of applications including in-vitro DNA amplification, healthcare diagnostics, andflow chemistry.
Protein stability measurement is key to the fundamental understanding of protein structure, folding andfunction in biology, as well as their role in diseases that result from misfolding and aggregation. The desire tocharacterise all human proteins and identify those that lead to diseases such as Alzheimer’s and Parkinson’s,
as well as novel drugs that target them, is driving the need for low-volume and high throughput assays that canaccurately measure protein stability, ligand binding affinity and kinetics of protein unfolding or aggregation1–7.
We recently established a microfluidic approach to measure the extent of protein unfolding by pre-equilib-rating a series of nanolitre samples with chemical denaturants, and measuring their intrinsic protein fluor-escence8. This gave equilibrium stability measurements of the protein FKBP-12, and also the binding affinityof FKBP-12 to a small molecule drug compound, demonstrating the potential for drug discovery. We also used thetechnique to determine the impact of a mutation upon FKBP-12 stability, illustrating the power of the method foranalysing the role of natural protein variations in genetic disorders. However, the use of chemical denaturantslimited the throughput of protein stability measurements in nanolitre samples, as each stability curve requirestypically 20–25 samples at different denaturant concentrations, and sample pre-equilibration for at least onehour.
Here we combine a number of factors synergistically to significantly improve upon this throughput for proteinstability, while also increasing the functionality to include kinetic measurements of protein denaturation.Thermal denaturation in classical larger-scale experiments improves throughput by step-wise ramping thetemperature of a sample while continuously taking measurements1,2,9–14. This also avoids the need to introduceadditional chemical denaturants into the sample. Thermal unfolding is also typically faster than chemicaldenaturation8,15–17, which therefore shortens the time to reach equilibrium. Microfluidics can minimise thesample volume and material required, but crucially also allow more rapid equilibration of the fluid temperatureto that of the surrounding materials. Finally, optical stimulation provides direct sample heating for instantaneoustemperature ramping and thermal control18. By contrast, the commonly used Peltier or resistive elements heatsamples indirectly by conducting heat through the container walls. Such heating elements themselves take time toreach thermal equilibrium, and require electrical connections. While small but rapid temperature jumps have
OPEN
SUBJECT AREAS:BIOLOGICAL
FLUORESCENCE
THERMODYNAMICS
LAB-ON-A-CHIP
CONFORMATION
Received5 February 2013
Accepted30 May 2013
Published4 July 2013
Correspondence andrequests for materials
should be addressed toP.A.D. (p.dalby@ucl.
ac.uk)
SCIENTIFIC REPORTS | 3 : 2130 | DOI: 10.1038/srep02130 1
been induced in mL sample volumes using high-powered IR lasersfor many years18–20, the matching ofmicrofluidic sample volumes to IR laser spot dimensions enablesmuch greater temperature excursions as demonstrated previouslyfor samples between glass plates or in microfluidic chambers18,19.
IR-induced heating has been successfully applied to PCR for staticsamples18, in microcapillaries placed on a Si wafer cooled by Peltierelements. The work described here is different in that we are probingprotein stability in a two-laser experiment, using a plug-and-playoptical fiber connected to a device mountable on a microscope stage.This has allowed us to obtain the first high-resolution three-dimen-sional images of stable thermal gradients in a microcapillary withpoint source IR heating. The technique allows any desired temper-ature profile to be achieved by a combination of controlled mass-flowand optically-induced heating. Thermal gradients radiating awayfrom the point source permit temperature-dependent protein dena-turation curves to be imaged in space, and over the ms-mins time-scales relevant to biological function, protein unfolding oraggregation. As a demonstrator, we measured the kinetics of unfold-ing of the 238 residue green fluorescent protein (GFP) by its char-acteristic fluorescence intensity at 509 nm, while a standard dyesimultaneously reported on the temperature of the solution. Eachsnapshot experiment simultaneously measured the extent of dena-turation from 44 to 85uC, using a single 15.3 nL sample, and just 2.6seconds for image acquisition at each time-point, allowing the timeand temperature-dependence of protein denaturation to be readilyobtained. Analysis of a complete thermal denaturation profile (24 to85uC), from a single time-point at 30 seconds after heating, gaveaccurate thermodynamic parameters in agreement with thoseobtained from a conventional water-bath controlled fluorimeterexperiment taking 170 minutes with a 0.2 mL sample.
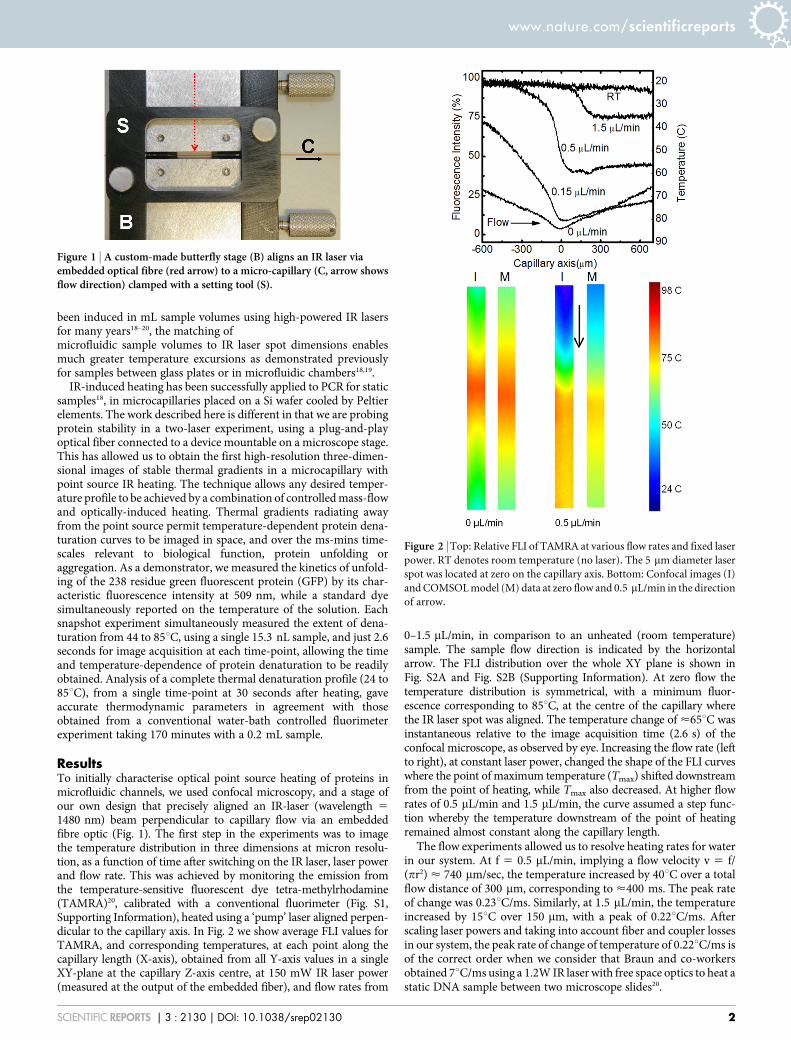
ResultsTo initially characterise optical point source heating of proteins inmicrofluidic channels, we used confocal microscopy, and a stage ofour own design that precisely aligned an IR-laser (wavelength 51480 nm) beam perpendicular to capillary flow via an embeddedfibre optic (Fig. 1). The first step in the experiments was to imagethe temperature distribution in three dimensions at micron resolu-tion, as a function of time after switching on the IR laser, laser powerand flow rate. This was achieved by monitoring the emission fromthe temperature-sensitive fluorescent dye tetra-methylrhodamine(TAMRA)20, calibrated with a conventional fluorimeter (Fig. S1,Supporting Information), heated using a ‘pump’ laser aligned perpen-dicular to the capillary axis. In Fig. 2 we show average FLI values forTAMRA, and corresponding temperatures, at each point along thecapillary length (X-axis), obtained from all Y-axis values in a singleXY-plane at the capillary Z-axis centre, at 150 mW IR laser power(measured at the output of the embedded fiber), and flow rates from
0–1.5 mL/min, in comparison to an unheated (room temperature)sample. The sample flow direction is indicated by the horizontalarrow. The FLI distribution over the whole XY plane is shown inFig. S2A and Fig. S2B (Supporting Information). At zero flow thetemperature distribution is symmetrical, with a minimum fluor-escence corresponding to 85uC, at the centre of the capillary wherethe IR laser spot was aligned. The temperature change of <65uC wasinstantaneous relative to the image acquisition time (2.6 s) of theconfocal microscope, as observed by eye. Increasing the flow rate (leftto right), at constant laser power, changed the shape of the FLI curveswhere the point of maximum temperature (Tmax) shifted downstreamfrom the point of heating, while Tmax also decreased. At higher flowrates of 0.5 mL/min and 1.5 mL/min, the curve assumed a step func-tion whereby the temperature downstream of the point of heatingremained almost constant along the capillary length.
The flow experiments allowed us to resolve heating rates for waterin our system. At f 5 0.5 mL/min, implying a flow velocity v 5 f/(pr2) < 740 mm/sec, the temperature increased by 40uC over a totalflow distance of 300 mm, corresponding to <400 ms. The peak rateof change was 0.23uC/ms. Similarly, at 1.5 mL/min, the temperatureincreased by 15uC over 150 mm, with a peak of 0.22uC/ms. Afterscaling laser powers and taking into account fiber and coupler lossesin our system, the peak rate of change of temperature of 0.22uC/ms isof the correct order when we consider that Braun and co-workersobtained 7uC/ms using a 1.2W IR laser with free space optics to heat astatic DNA sample between two microscope slides20.
Figure 1 | A custom-made butterfly stage (B) aligns an IR laser viaembedded optical fibre (red arrow) to a micro-capillary (C, arrow showsflow direction) clamped with a setting tool (S).
Figure 2 | Top: Relative FLI of TAMRA at various flow rates and fixed laser
power. RT denotes room temperature (no laser). The 5 mm diameter laser
spot was located at zero on the capillary axis. Bottom: Confocal images (I)
and COMSOL model (M) data at zero flow and 0.5 mL/min in the direction
of arrow.
www.nature.com/scientificreports
SCIENTIFIC REPORTS | 3 : 2130 | DOI: 10.1038/srep02130 2

The IR laser-induced heating of a liquid under microfluidic capil-lary flow was modelled in COMSOL Multiphysics by combining theinbuilt heat-transfer and fluid dynamic modules. Experimental con-focal images of TAMRA fluorescence converted into temperaturemaps compare well to corresponding models in COMSOL (Fig. 2;bottom panel). Experimental temperature values were reproduced towithin a few degrees Celsius, correctly predicting the effect of flow onthe temperature distribution. The model therefore shows that heattransport occurs through both diffusion and advection to create theobserved temperature distributions. The agreement with experimentalso indicates its use for engineering future integrated optical/microfluidic chips, where the model can determine combinationsof mass-flow and optical heating to achieve desired time andspace-dependent thermal profiles.
Protein stability measurements. Having established thermal gra-dient control, we demonstrated the rapid measurement of proteinstability to thermal denaturation using the well characterised greenfluorescent protein (GFP), whose intrinsic fluorescence convenientlyreports upon its folded state21–24.
The absorption spectrum of recombinant turbo GFP (rTurbo-GFP) peaks at around 470 nm, and upon denaturation the fluor-escence is quenched by the solvent. The unfolding of GFP due tooptical-heating in a microcapillary was imaged as a fluorescenceintensity decrease using the same stage and confocal microscope asfor the TAMRA experiments. The concentration dependence ofdenaturation at 0.001 mg/ml to 0.05 mg/ml GFP and 100 mW laserpower was found to give 2–10% of the fluorescence intensity relativeto that at 24uC, with no clear trend (Fig. S3, Supporting Information).However, the fluorescence intensity of GFP denaturation showed atime-dependence below 30 seconds at 0.001 mg/ml (Fig. S4, Supple-mentary Information), and typically 1–20 minutes at the higherconcentrations (data not shown). Furthermore, an experiment inwhich stepwise increases in laser power, followed by stepwisedecreases, resulted in up to 50% loss in the recovery of the initialGFP fluorescence intensity (Fig. S5, Supporting Information).Together these experiments indicated that GFP denaturation waspartially irreversible, due to protein aggregation, irreversible misfold-ing, or capillary fouling in which proteins adhere to the capillaryinner walls. All subsequent experiments were carried out at the low-est GFP concentration of 0.001 mg/ml, while retaining a cleaningprotocol between tests as previously described8.
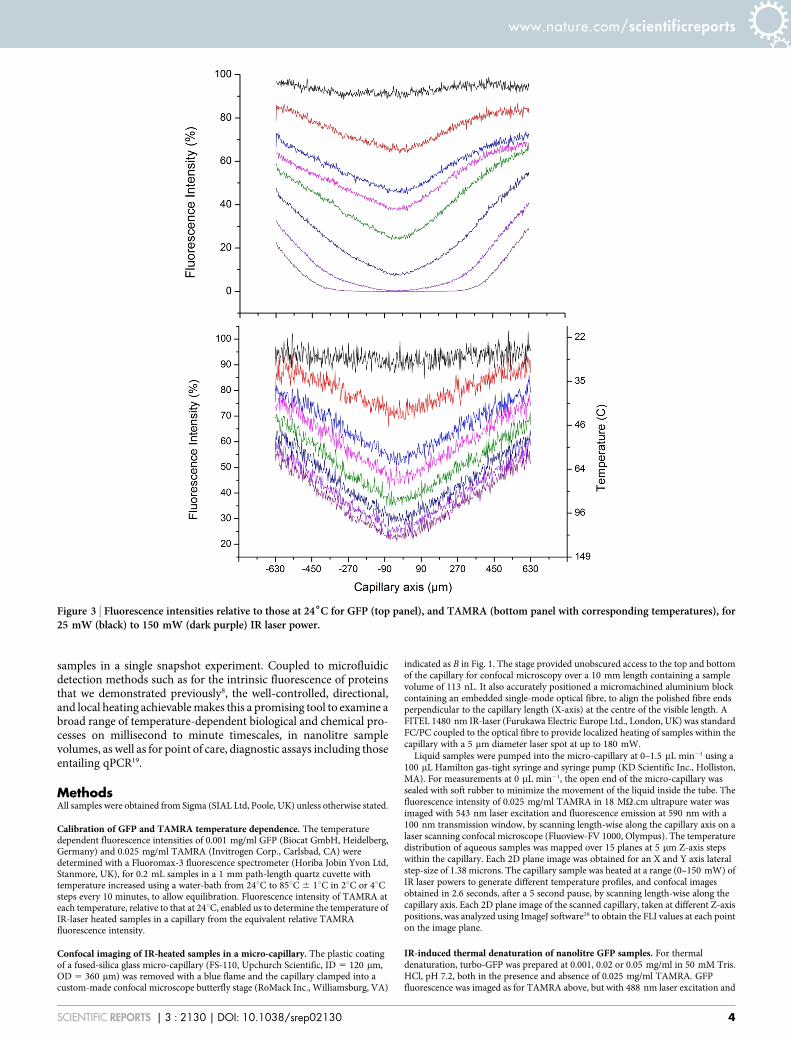
Various temperature profiles, at zero flow, were achieved using theIR laser at a range of input powers using either TAMRA and0.001 mg/ml GFP separately (data not shown), or with both samplescombined and using multicolour imaging, to confirm that TAMRAdid not alter the temperature dependence of GFP fluorescence. Theoptically induced heating of TAMRA and GFP combined in a singlesample enabled more convenient and precise determination of GFPdenaturation curves by circumventing variations in laser power, orerrors due to different mechanical alignments of the capillary.Figure 3 shows typical data for eight laser powers increasing from0–150 mW. Confocal images, acquired in 2.6 seconds for high reso-lution, were obtained before and after IR-induced heating com-menced by scanning length-wise along the capillary axis. Theconfocal images were acquired every 30 seconds, typically for up to5–20 minutes. Each image was then analysed to give a temperatureprofile of GFP fluorescence as a function of time (Fig. S4, SupportingInformation). No time-dependence was observed for TAMRA fluor-escence with this method, nor at a lower resolution image acquisitionof ,1 second, indicating that the IR-induced response of TAMRAwas faster than that timescale.
The FLI for TAMRA and GFP both decreased as the laser power,and temperature were increased, and their profiles remained sym-metrical at all laser powers. The TAMRA fluorescence was usedto directly determine the temperatures associated with the GFP
fluorescence intensity at the same location in the capillary. Time-dependent GFP fluorescence decay curves were obtained using thesedata, over the range 44 to 85uC (Fig. 4), and fit to Eq. 1 to give the rateconstant, k, for GFP denaturation as a function of temperature(Fig. 4), for a single 15.3 nL sample. The initial GFP fluorescenceintensities (Fig. 4, top panel) for various temperatures are all normal-ized to 100%. At lower temperatures, the rate of decrease of FLI isslower than at higher temperatures.
The logarithm of the unfolding rate constant, log(ku), obtained(Fig. 4, bottom panel) was non-linearly dependent upon temper-ature, with a kink at approximately 60uC, indicating a mechanisticchange at that temperature. This is likely to be due to the shift fromreversible to irreversible unfolding at 60uC. Our unfolding rate at70uC, pH 7.5, as well as the loss of complete recovery upon re-coolingis in excellent agreement with previous work at pH 7.2 using con-ventional water-bath control25.
In an alternative experiment, data from three confocal imagesacquired after 30 seconds of heating at different laser powers, butreaching temperatures spanning overlapping ranges, were combinedto obtain a single complete thermal denaturation profile for GFP(Fig. 5). The transition region itself (60–70uC) was obtainable withina single scan covering 44 to 85uC from just one laser power. Thethermal dependence of TAMRA and GFP FLI obtained was com-pared to that acquired with a conventional water-bath controlledfluorimeter. The conventionally obtained denaturation profile took0.2 ml of sample and a total of 170 mins, due to the equilibration ofthe water bath and sample requiring 10 mins between each 2uC or4uC step. By contrast, the microfluidic method measured a 15.3 nLsample and acquired the whole thermal denaturation curve after asingle 30 seconds incubation, without requiring sequential step-wisetemperature increases of the sample.
The two denaturation curves in Figure 5 were fit to a standardequilibrium two-state thermal denaturation equation (despiteobserving up to 50% loss of reversibility above the transition region),to give indicative thermal transition midpoint temperatures, Tm, of66.3 6 0.1uC and 65.5 6 0.9uC, respectively for the optical and waterbath heating methods. These matched to within 0.5uC and the twounfolding curves were in excellent agreement. The degree of fluor-escence quenching above the Tm was slightly lower for the opticalheating experiment. This is due to the significantly shorter totalincubation time, and thus greater protection from slow irreversiblemisfolding, aggregation or fouling processes.
This demonstrates another potential advantage of the techniqueover standard water-bath based instruments, where reversibleunfolding stability and kinetic measurements could now be obtainedrapidly for certain proteins, such that slower irreversible aggregationdoes not yet predominate.
DiscussionIn this study we have developed a novel ‘all-optical’ technique thatcombines optically-induced ‘point of contact’ heating, controlledmass-flow with nanoliter volume samples and computational fluiddynamics to account quantitatively for the experimental phenom-enology. The observed systematic variation in temperature (Fig. 2) ofthe test sample TAMRA with flow rate is modelled using COMSOLto unprecedented accuracy and is further supported by back of envel-ope calculations (Supplementary Information). Upon the successfulunderstanding of the physics behind these experiments, we haveapplied this technique to demonstrate denaturation of a prototypicalprotein –GFP. The thermal denaturation temperature Tm obtainedusing this technique is in agreement with the literature. Anothersignificant application of this technique is the measurement of rateconstants of protein denaturation (Fig. 4) at various temperatures.
Further, our technique shows for the first time that it is possible toobtain protein stability parameters, and the temperature dependenceof unfolding kinetics, by optically induced heating of nanolitre
www.nature.com/scientificreports
SCIENTIFIC REPORTS | 3 : 2130 | DOI: 10.1038/srep02130 3
samples in a single snapshot experiment. Coupled to microfluidicdetection methods such as for the intrinsic fluorescence of proteinsthat we demonstrated previously8, the well-controlled, directional,and local heating achievable makes this a promising tool to examine abroad range of temperature-dependent biological and chemical pro-cesses on millisecond to minute timescales, in nanolitre samplevolumes, as well as for point of care, diagnostic assays including thoseentailing qPCR19.
MethodsAll samples were obtained from Sigma (SIAL Ltd, Poole, UK) unless otherwise stated.
Calibration of GFP and TAMRA temperature dependence. The temperaturedependent fluorescence intensities of 0.001 mg/ml GFP (Biocat GmbH, Heidelberg,Germany) and 0.025 mg/ml TAMRA (Invitrogen Corp., Carlsbad, CA) weredetermined with a Fluoromax-3 fluorescence spectrometer (Horiba Jobin Yvon Ltd,Stanmore, UK), for 0.2 mL samples in a 1 mm path-length quartz cuvette withtemperature increased using a water-bath from 24uC to 85uC 6 1uC in 2uC or 4uCsteps every 10 minutes, to allow equilibration. Fluorescence intensity of TAMRA ateach temperature, relative to that at 24uC, enabled us to determine the temperature ofIR-laser heated samples in a capillary from the equivalent relative TAMRAfluorescence intensity.
Confocal imaging of IR-heated samples in a micro-capillary. The plastic coatingof a fused-silica glass micro-capillary (FS-110, Upchurch Scientific, ID 5 120 mm,OD 5 360 mm) was removed with a blue flame and the capillary clamped into acustom-made confocal microscope butterfly stage (RoMack Inc., Williamsburg, VA)
indicated as B in Fig. 1. The stage provided unobscured access to the top and bottomof the capillary for confocal microscopy over a 10 mm length containing a samplevolume of 113 nL. It also accurately positioned a micromachined aluminium blockcontaining an embedded single-mode optical fibre, to align the polished fibre endsperpendicular to the capillary length (X-axis) at the centre of the visible length. AFITEL 1480 nm IR-laser (Furukawa Electric Europe Ltd., London, UK) was standardFC/PC coupled to the optical fibre to provide localized heating of samples within thecapillary with a 5 mm diameter laser spot at up to 180 mW.
Liquid samples were pumped into the micro-capillary at 0–1.5 mL min21 using a100 mL Hamilton gas-tight syringe and syringe pump (KD Scientific Inc., Holliston,MA). For measurements at 0 mL min21, the open end of the micro-capillary wassealed with soft rubber to minimize the movement of the liquid inside the tube. Thefluorescence intensity of 0.025 mg/ml TAMRA in 18 MV.cm ultrapure water wasimaged with 543 nm laser excitation and fluorescence emission at 590 nm with a100 nm transmission window, by scanning length-wise along the capillary axis on alaser scanning confocal microscope (Fluoview-FV 1000, Olympus). The temperaturedistribution of aqueous samples was mapped over 15 planes at 5 mm Z-axis stepswithin the capillary. Each 2D plane image was obtained for an X and Y axis lateralstep-size of 1.38 microns. The capillary sample was heated at a range (0–150 mW) ofIR laser powers to generate different temperature profiles, and confocal imagesobtained in 2.6 seconds, after a 5 second pause, by scanning length-wise along thecapillary axis. Each 2D plane image of the scanned capillary, taken at different Z-axispositions, was analyzed using ImageJ software26 to obtain the FLI values at each pointon the image plane.
IR-induced thermal denaturation of nanolitre GFP samples. For thermaldenaturation, turbo-GFP was prepared at 0.001, 0.02 or 0.05 mg/ml in 50 mM Tris.HCl, pH 7.2, both in the presence and absence of 0.025 mg/ml TAMRA. GFPfluorescence was imaged as for TAMRA above, but with 488 nm laser excitation and
Figure 3 | Fluorescence intensities relative to those at 246C for GFP (top panel), and TAMRA (bottom panel with corresponding temperatures), for25 mW (black) to 150 mW (dark purple) IR laser power.
www.nature.com/scientificreports
SCIENTIFIC REPORTS | 3 : 2130 | DOI: 10.1038/srep02130 4

fluorescence emission at 520 nm with a 100 nm transmission window. Thermaldenaturation curves for GFP were obtained in two parallel ways in a micro-capillary.In one, fluorescence images were obtained for separate GFP and TAMRA samplesusing the same set of IR-laser powers, and the two datasets aligned afterwards. Thesecond method eliminated potential systematic errors by using multi-colorfluorescence imaging on samples containing both TAMRA and GFP. Two lasersprovided excitation of TAMRA and GFP and images of their respective fluorescenceemissions obtained sequentially. Image scans, taking 2.6 seconds, were repeated every30 seconds to obtain time-resolved data. The GFP fluorescence intensity data andspatially corresponding TAMRA fluorescence data for each time-point wereconverted to temperature, and pooled from scans performed at up to seven IR laserpowers from 0 mW to 150 mW, and XY-plane images taken at a Z-axis depthcorresponding to the capillary centre. The GFP FLI relative to the value at 24uC wasthen plotted against the corresponding TAMRA-derived temperature values for agiven time point, or otherwise plotted as GFP FLI as a function of time at eachtemperature.
For time-dependent GFP FLI, the rate constant for denaturation were obtained byfitting the data to equation S1 in Sigmaplot (Systat Software Inc, Chicago, IL, USA), asshown in Figure S6.
y~a exp {k=tð Þzc ð1Þ
where a is the signal amplitude, c is the fluorescence signal decay endpoint, and k isthe rate constant for the fluorescence signal decay associated with GFP denaturation.
The thermal denaturation profiles for GFP at a given time-point were fit inSigmaplot to a two-state folding model, using Equations 2 and 3 combined.
FLImeasured~ A1zA2 expDGRT
� �� ��1z exp
DGRT
� �� �ð2Þ
DG~DHm 1{T
Tm
� �{DCp Tm{Tð ÞzT: ln
TTm
� �� �ð3Þ
where A1 and A2 are linear pre- and post-transition baseline functions, R is theuniversal gas constant, and DCp 5 2856 cal/mol/deg assuming DCp 5 12 cal/mol/deg/residue27,28.
CFD model of IR-induced fluid heating in a microcapillary. The laser-inducedoptical heating in the microfluidic capillary was modeled using COMSOL v3.5(COMSOL Inc., Burlington, MA) by combining the inbuilt heat-transfer and fluiddynamic modules, with the experimentally determined laser power first modeled as aheat source with power decaying as per an extinction coefficient of 21.2 cm21 at1480 nm over the 120 mm inside capillary diameter. The weakly compressibleNavier-Stokes equation for non-isothermal fluid flow (Eq. 4) was combined with thestandard heat-diffusion equation31 (Eq. 5), assuming non-isothermal flow:
r u:+ð Þu~+: {PIzg +uz +uð ÞT� �h i
{2g
3{kdv
� �+:uð ÞIzF ð4Þ
rCpLTLt
z+: {k+Tð Þ~Q{rCpu:+T ð5Þ
where, r is the density of water, Cp is the specific heat, T is temperature, Q is the heatsource, u is the velocity of flow, I denotes a unit vector, g is the dynamic viscosity, kdv isthe dilational viscosity, and F is the volume force.
The coupled equations were solved simultaneously in COMSOL using parametervalues provided in the standard COMSOL library, for density and viscosity of water,etc., unless otherwise stated below. The heat transfer coefficient h 5 10 W/m2.K(water to glass), surface emissivity, e 5 0.8 (glass surface to ambient air), Tin and Tamb
5 24uC (ambient and initial temperature), the inner-diameter of the capillary 5 120microns, and the Radiation type ‘surface-to-ambient’ switch was on. A rough estimateof heat-diffusion time of 30 ms can be obtained by29,
t~d2CrP
2k ð6Þ
where d is the capillary wall thickness, C is the heat capacity of water, r thedensity, and k the thermal conductivity (0.54 W/K m). This is much faster thanthe image acquisition timescale, thus ensuring thermal equilibrium. At typicalflow rates used (0.5 mL/min), the flow velocity of 7 3 1024 m/s is much greaterthan the maximum thermal convection velocity of 1.4 mm/s30. Thus, our obser-vations are not affected by thermophoresis. Further, we believe that the possibleinfluence of thermophoresis on our protein denaturation experiments is eitherminimal or nil due to the following reasons: a) As the temperature increased from25 to 60uC the GFP fluorescence intensity in the cooler regions did not increase aswould be expected if the GFP concentration increases by movement into thecooler regions; b) the slope of FLI vs T over 25 to 60uC (Fig. 5) is exactlycoincident with that from the water bath method for which thermophoresis is notrelevant; c) the GFP unfolding rate constant measured in this study (Fig. 4)matches previous bulk equilibrium measurements at pH7 and 70uC (Alkaabi et al.2005). However, we cannot completely discard the effect of temperature-dependent diffusion on thermophoresis.
Figure 4 | Top: GFP denaturation decay curves at selected temperatures
from 46–81uC obtained by fluorescence image scanning at 30 s intervals
for a single IR-heated capillary region. Lines were best fit to equation Eq. 1,
and shown at 46uC (red), 49uC (dark yellow), 51.5uC (cyan), 54uC (blue),
56.5uC (green), 60.5uC (pink), 65uC (dark green), 69.5uC (dark blue),
74.5uC (dark pink), 81uC (grey). Bottom: Temperature dependence of the
logarithm of the rate constant, log(ku), of GFP denaturation, obtained
using the optical heating method, and fitting decay data to Eq. 1.
Figure 5 | Thermal denaturation of GFP fluorescence, using optical andconventional water-bath heating methods. Data are fit to Eqs. 2 and 3.
www.nature.com/scientificreports
SCIENTIFIC REPORTS | 3 : 2130 | DOI: 10.1038/srep02130 5

1. Pantoliano, M. W. et al. High-density miniaturized thermal shift assays as ageneral strategy for drug discovery. J. Biomol. Screen. 6, 429–440 (2001).
2. Aucamp, J. P., Cosme, A. M., Lye, G. J. & Dalby, P. A. High-throughputmeasurement of protein stability in microtiter plates. Biotechnol. Bioeng. 89,599–607 (2005).
3. Hau, J. C. et al. Leveraging the contribution of thermodynamics in drug discoverywith the help of fluorescence-based thermal shift assays. J. Biomol. Screen. 16,552–556 (2011).
4. Layton, C. J. & Hellinga, H. W. Thermodynamic analysis of ligand-inducedchanges in protein thermal unfolding applied to high-throughput determinationof ligand affinities with extrinsic fluorescent dyes. Biochemistry 49, 10831–10841(2010).
5. Bommarius, A. S., Broering, J. M., Chaparro-Riggers, J. F. & Polizzi, K. M. High-throughput screening for enhanced protein stability. Curr. Opin. Biotechnol. 17,606–610 (2006).
6. Bhambure, R., Kumar, K. & Rathore, A. S. High-throughput process developmentfor biopharmaceutical drug substances. Trends Biotechnol. 29, 127–135 (2011).
7. Magliery, T. J., Lavinder, J. J. & Sullivan, B. J. Protein stability by number: high-throughput and statistical approaches to one of protein science’s most difficultproblems. Curr. Opin. Chem. Biol. 15, 443–451 (2011).
8. Gaudet, M., Remtulla, N., Jackson, S. E., Main, E. R. G., Bracewell, D. G., Aeppli, G.& Dalby, P. A. Protein denaturation and protein:drugs interactions fromintrinsic protein fluorescence measurements at the nanolitre scale. Protein Sci. 19,1544–1554 (2010).
9. Lavinder, J. J., Hari, S. B., Sullivan, B. J. & Magliery, T. J. High-throughput thermalscanning: A general, rapid dye-binding thermal shift screen for proteinengineering. J. Am. Chem. Soc. 131, 3794–3795 (2009).
10. Layton, C. J. & Hellinga, H. W. Quantitation of protein–protein interactions bythermal stability shift analysis. Protein Sci. 20, 1439–1450 (2011).
11. Santoro, M. M. & Bolen, D. W. Unfolding free energy changes determined by thelinear extrapolation method. 1. Unfolding of phenylmethanesulfonyl alpha-chymotrypsin using different denaturants. Biochemistry 27, 8063–8068 (1988).
12. Herrmann, L. M. & Bowler, B. E. Thermal denaturation of iso-1-cytochrome cvariants: Comparison with solvent denaturation. Protein Sci. 6, 657–665 (1997).
13. Mahendrarajah, K., Dalby, P. A., Wilkinson, B., Jackson, S. E. & Main, E. R. G. Ahigh-throughput fluorescence chemical denaturation assay as a general screen forprotein–ligand binding. Anal. Biochem. 411, 155–157 (2011).
14. Matulis, D., Kranz, J. K., Raymond Salemme, F. & Todd, M. J. Thermodynamicstability of carbonic anhydrase: Measurements of binding affinity andstoichiometry using ThermoFluor. Biochemistry 44, 5258–5266 (2005).
15. Anderson, D. E., Becktel, W. J. & Dahlquist, F. W. pH-Induced denaturation ofproteins: a single salt bridge contributes 3–5 kcal/mol to the free energy of foldingof T4 lysozyme. Biochemistry 29, 2403–2408 (1990).
16. Bennion, B. J. & Daggett, V. The molecular basis for the chemical denaturation ofproteins by urea. Proc. Natl. Acad. Sci. USA 100, 5142–5147 (2003).
17. Enoki, S., Saeki, K., Maki, K. & Kuwajima, K. Acid denaturation and refolding ofgreen fluorescent protein. Biochemistry 43, 14238–14248 (2004).
18. Mast, C. B. & Braun, D. Thermal trap for DNA replication. Phys. Rev. Lett. 104,188102–188106 (2010).
19. Braun, D., Goddard, N. L. & Libchaber, A. Exponential DNA replication bylaminar convection. Phys. Rev. Lett. 91, 158103–158106 (2003).
20. Baaske, P., Duhr, S. & Braun, D. Melting curve analysis in a shapshot. Appl. Phys.Lett. 91, 133901–133903 (2007).
21. Enoki, S., Saeki, K., Maki, K. & Kuwajima, K. Acid denaturation and refolding ofgreen fluorescent protein. Biochemistry 43, 14238–14248 (2004).
22. Zimmer, M. Green Fluorescent Protein (GFP): Applications, structure, andrelated photophysical behavior. Chem. Rev. 102, 759–782 (2002).
23. Bokman, S. H. & Ward, W. W. Renaturation of aequorea green-fluorescentprotein. Biochem. Biophys. Res. Comm. 101, 1372–1380 (1981).
24. Vessoni Penna, T. C., Ishii, M., Cholewa, O. & Souza, L. C. Thermal characteristicsof recombinant green fluorescent protein (GFPuv) extracted from Escherichia coli.Letts. Appl. Microbiol. 38, 135–139 (2004).
25. Alkaabi, K. M., Yafea, A. & Ashraf, S. S. Effect of pH on thermal- and chemical-induced denaturation of GFP. Appl. Biochem. Biotechnol. 126, 149–156 (2005).
26. Abramoff, M. D., Magalhaes, P. J. & Ram, S. J. Image processing with ImageJ.Biophotonics Intl. 11, 36–42 (2004).
27. Becktel, W. J. & Schellman, J. A. Protein stability curves. Biopolymers 26,1859–1877 (1987).
28. Lytle, B., Myers, C., Kruus, K. & Wu, J. H. Interactions of the CelS binding ligandwith various receptor domains of the Clostridium thermocellum cellulosomalscaffolding protein, CipA. J. Bacteriol. 178, 1200–1203 (1996).
29. Baaske, P., Duhr, S. & Braun, D. Melting curve analysis in a snapshot. Appl. Phys.Lett. 91, 133901 (2007).
30. Duhr, S., Arduini, S. & Braun, D. Thermophoresis and DNA determined bymicrofluidic fluorescence. Eur. Phys. J. E. 15, 277–286 (2004).
31. Desjardins, B., Grenier, E., Lions, P. L. & Masmoudi, N. Incompressible limit forsolutions of the isentropic Navier-Stokes equations with Dirichlet boundaryconditions. J. Math. Pur. Appl. 78, 461–471 (1998).
AcknowledgmentsWe thank the ISMB Biophysics Centre at Birkbeck, London, UK for access to theirfluorimeter. M.G. and D.M.S. were supported by BBSRC grants (BB/E005942/1 and BB/FOF/272).
Author contributionsThe manuscript was written through contributions of all authors.
Additional informationSupplementary information accompanies this paper at http://www.nature.com/scientificreports
Competing financial interests: Three of the authors (MG, GA and PB) have filed a patent(US Application number 20120152006) for which the current experiment is a proof ofconcept.
How to cite this article: Sagar, D.M., Aoudjane, S., Gaudet, M., Aeppli, G. & Dalby, P.A.Optically Induced Thermal Gradients for Protein Characterization in Nanolitre-scaleSamples In Microfluidic Devices. Sci. Rep. 3, 2130; DOI:10.1038/srep02130 (2013).
This work is licensed under a Creative Commons Attribution 3.0 Unported license.To view a copy of this license, visit http://creativecommons.org/licenses/by/3.0
www.nature.com/scientificreports
SCIENTIFIC REPORTS | 3 : 2130 | DOI: 10.1038/srep02130 6