
Optical spectroscopy of Condensed MatterOptical spectroscopy of Condensed Matter ... Broadband IR...
39
Optical spectroscopy of Condensed Matter Maglab Users Summer School 21 May 2015 Komalavalli Thirunavukkuarasu 1
Transcript of Optical spectroscopy of Condensed MatterOptical spectroscopy of Condensed Matter ... Broadband IR...

Optical spectroscopy of Condensed Matter
Maglab Users Summer School 21 May 2015
Komalavalli Thirunavukkuarasu
1

OUTLINE
Principles of spectroscopy – What? Why? How? Experimental realization
Infrared (IR) spectroscopy Raman scattering and Photoluminescence
CW optical spectroscopy at Maglab Introduction to Lab Practicals
2

Optical Spectroscopy
3
Principles

Optical Spectroscopy – What?
4
Study of interaction of matter with electromagnetic radiation
Spectrum : Response of matter to radiation as a function of energy
Photon (or light) has • Energy (wavelength or frequency) • Momentum • Polarization (helicity or spin) • Intensity (or flux) • Coherence length and time

Optical Spectroscopy – What?
5
THE ELECTROMAGNETIC SPECTRUM

Optical Spectroscopy – What?
6
Wavelength (µm) Wavenumbers (cm-1)
Energy (meV)
Frequency (THz) Temperature (K)
THE ELECTROMAGNETIC SPECTRUM
𝜆𝜆−1 =𝑐𝑐𝜈𝜈
𝐸𝐸 = ℎ𝜈𝜈 = 𝑘𝑘𝐵𝐵𝑇𝑇 = eV 1 meV = 8.064 cm-1

Optical Spectroscopy – Why?
7

Optical Spectroscopy – Why?
8
Probe various structural, electronic and magnetic states/excitations in matter
Basov et al., Rev. Mod. Phys., 83, 471 (2011)

Optical Spectroscopy – How?
9
Pressure
Temperature Electric and Magnetic Fields
Types of cw optical spectroscopy
ℎ𝜈𝜈𝑖𝑖𝑖𝑖 = ℎ𝜈𝜈𝑜𝑜𝑜𝑜𝑜𝑜 Reflection and Transmission
THz, IR, Visible, UV
ℎ𝜈𝜈𝑖𝑖𝑖𝑖 ≠ ℎ𝜈𝜈𝑜𝑜𝑜𝑜𝑜𝑜 Raman scattering
Photoluminescence Chemical doping
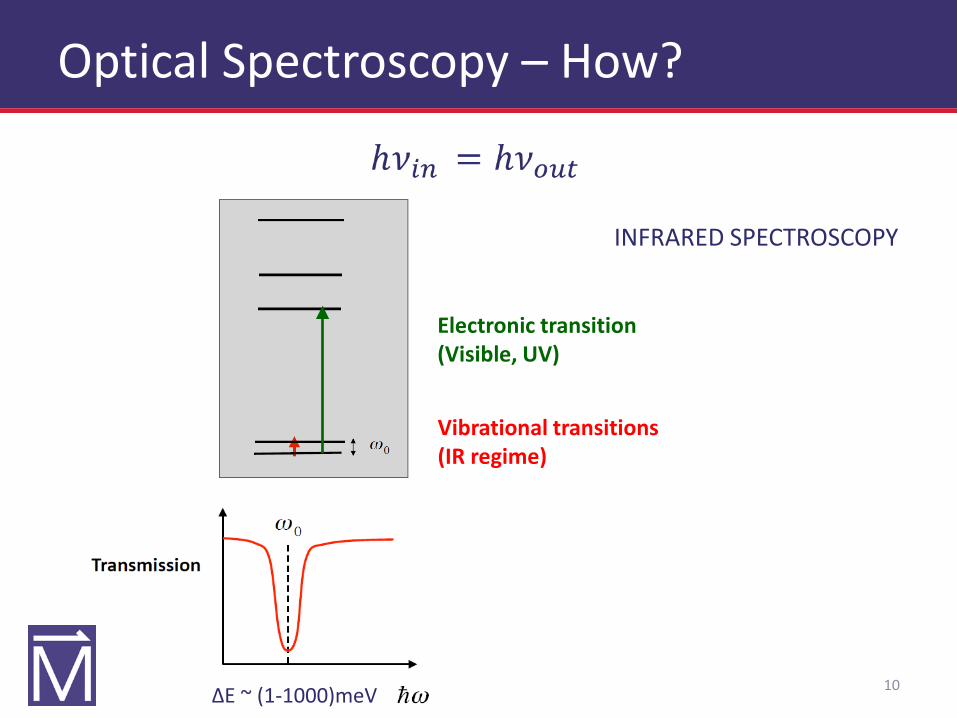
Optical Spectroscopy – How?
10
Vibrational transitions (IR regime)
Electronic transition (Visible, UV)
ΔE ~ (1-1000)meV
INFRARED SPECTROSCOPY

Optical Spectroscopy – How?
11
ℎ𝜈𝜈𝑖𝑖𝑖𝑖 ≠ ℎ𝜈𝜈𝑜𝑜𝑜𝑜𝑜𝑜 PHOTOLUMINESCENCE
ΔE ~ 1eV
RAMAN SCATTERING
ΔE ~ (1-100)meV

Optical Spectroscopy – How?
12
SELECTION RULES IR activity: Induced dipole moment due to change in atomic position
Raman Activity: Induced dipole moment due to deformation of electron shell
Induced polarization 𝑃𝑃 = 𝛼𝛼𝐸𝐸 𝜕𝜕𝛼𝛼𝜕𝜕𝜕𝜕 0
≠ 0
𝜕𝜕𝜇𝜇𝜕𝜕𝜕𝜕 0
≠ 0
𝛼𝛼 – Polarizability E – Electric Field
𝜇𝜇 is dipole moment
𝜕𝜕 is the normal coordinate at the equilibrium configuration
RULE OF MUTUAL EXCLUSION In a centrosymmetric molecule (i.e., one with a center of inversion symmetry) a vibrational mode may be either IR active or Raman active but not both.
IR modes: “Asymmetrical” (Eu, A1u etc.,)
Raman modes: “Symmetrical” (Eg, A1g etc.,)

Optical Spectroscopy – How?
13
SELECTION RULES – CO2

Optical Spectroscopy
14
Experimental Realization

Optical Spectroscopy – Techniques
15 Slough Bus Station inspired by Herschel’s infrared experiment

Optical Spectroscopy – Techniques
16
What is special about IR spectroscopy? Broadband IR spectroscopy – Not a one
source/detector system! Brightness of sources Sensitivity of Detectors Optical components – All materials have
absorption in IR Vacuum needed for even RT measurements Delivery losses Working close to diffraction limit in FIR
Transmittance of various optical materials
Spectral response of various IR detectors

Optical Spectroscopy – Techniques
17
Dispersive spectrometer Double beam infrared spectrometer

Optical Spectroscopy – Techniques
18
Fourier Transform Spectrometer

Optical Spectroscopy – Techniques
19
Fourier Transform Spectrometer
Aperture
Mirror Scanner
Beam splitter
Sample compartment
sample
DTGS
MCT/InSb
Bolometer
Sources
Control Electronics
BRUKER IFS 66v/S
Polarizer
Range: 20-20000 cm-1 (600 GHz to 600 THz or 1 meV – 2.5 eV)

Optical Spectroscopy – Techniques
20
ℎ𝜈𝜈𝑖𝑖𝑖𝑖 = ℎ𝜈𝜈𝑜𝑜𝑜𝑜𝑜𝑜
Transmission
Transmission, 𝑇𝑇(𝜈𝜈) = 𝐼𝐼𝑇𝑇(𝜈𝜈)𝐼𝐼0(𝜈𝜈)
𝐴𝐴𝐴𝐴𝐴𝐴𝐴𝐴𝐴𝐴𝐴𝐴𝐴𝐴𝐴𝐴𝐴𝐴𝐴𝐴,𝐴𝐴 = − log10 𝑇𝑇(𝜈𝜈)
Materials : Insulators, Semiconductors, Thin films etc.,

Optical Spectroscopy – Techniques
21
ℎ𝜈𝜈𝑖𝑖𝑖𝑖 = ℎ𝜈𝜈𝑜𝑜𝑜𝑜𝑜𝑜 Transmission
Transmission, 𝑇𝑇(𝜈𝜈) = 𝐼𝐼𝑇𝑇(𝜈𝜈)𝐼𝐼0(𝜈𝜈)
100 200 300 400 500 600 7000.00
0.05
0.10
0.15
Reference (I0) Sample (IT)
Inte
nsity
(arb
. uni
ts)
Frequency (cm-1)
C70 fullerene
100 200 300 400 500 600 7000.0
0.2
0.4
0.6
0.8
1.0
Tran
smitt
ance
Frequency (cm-1)

Optical Spectroscopy – Techniques
22
ℎ𝜈𝜈𝑖𝑖𝑖𝑖 = ℎ𝜈𝜈𝑜𝑜𝑜𝑜𝑜𝑜 Reflection
Reflection, R(𝜈𝜈) = 𝐼𝐼𝑅𝑅(𝜈𝜈)𝐼𝐼0(𝜈𝜈)

Optical Spectroscopy – Techniques
23
ℎ𝜈𝜈𝑖𝑖𝑖𝑖 = ℎ𝜈𝜈𝑜𝑜𝑜𝑜𝑜𝑜 Reflection
Reflection, R(𝜈𝜈) = 𝐼𝐼𝑅𝑅(𝜈𝜈)𝐼𝐼0(𝜈𝜈)
oxygen atom lanthanum atom
••
a
c
c
b

Optical Spectroscopy – Techniques
24
Complex Optical functions
M. Dressel and G. Gruener, Electrodynamics of Solids (2002)

Optical Spectroscopy – Techniques
25
Optical conductivity

Optical Spectroscopy – Techniques
26
RAMAN SPECTROSCOPY TIMELINE 1923 – Inelastic light scattering is predicted by A. Smekel 1928 – Landsberg and Mandelstam see unexpected frequency shifts in scattering from quartz 1928 – C.V. Raman and K.S. Krishnan see “feeble fluorescence” neat solvents 1930 – C.V. Raman wins Nobel Prize in Physics
1960 – Invention of laser made Raman spectroscopy more effective and meaningful 1964 – Townes, Basov and Prochorov win Nobel Prize in Physics for maser and laser (Here again, Ted Maiman was the first to have a working laser!)

Optical Spectroscopy – Techniques
27
Czerny-Turner spectrometer for Raman scattering and PL
1. Deliver high quality beam Low loss, clean excitation beam
2. Efficiently scatter light 3. Efficiently collect scattered
light, thereby have increased sensitivity
Advantages of dispersive Raman spectrometer

Optical Spectroscopy – Techniques
28
Raman scattering
Inelastic light scattering from correlated electrons, Devereaux and Hackl, RMP 79, 175 (2007)
Ca-doped YBCO
10-7
< 10-9
Only 1 in every 107-109 photons scatters inelastically Very low signal

Magneto-Optical Spectroscopy at MagLab
29

Optical Spectroscopy @ MagLab
30
FTIR Magneto-spectroscopy
SPECTROMETERS: Bruker Vertex 80v Bruker IFS 66v/s Bruker IFS 113
MAGNETS: 18 T SCMs 31 T-35 T Resistive Magnets 45 T (Noisy!!)

Optical Spectroscopy @ MagLab
31
FTIR Magneto-spectroscopy: Examples
monolayer graphene exfoliated on to Si/SiO2 wafer substrates
cyclotron resonance (CR) transitions to and from the n = 0 Landau level (LL) in monolayer graphene.
B=18T
E. A. Henriksen et al., Phys. Rev. Letters 104, 067404 (2010)

Optical Spectroscopy @ MagLab
32
Spatially-resolved PL and Raman spectroscopy
Diameters of optical heads 23 mm > d ≥ 16 mm

Optical Spectroscopy @ MagLab
33
Spatially-resolved PL and Raman spectroscopy

Optical Spectroscopy @ MagLab
34
Spatially-resolved PL and Raman spectroscopy: Examples

LAB PRACTICALS – Optical spectroscopy of Al2O3
35
I. Probing phonons by Raman spectroscopy
Two Al2O3 groups per unit cell
Phonon modes (1st order, Γ-point):
Γ = A2u + Eu + 2A1g + 5Eg + 2A2u + 4Eu + 3A2g + 2A1u
acoust. Raman IR silent

LAB PRACTICALS – Optical spectroscopy of Al2O3
36
I. Probing phonons by Raman spectroscopy
Raman active modes: 7
2A1g + 5Eg = A1g + A1g + 5Eg
∥c ⊥c ⊥c

LAB PRACTICALS – Optical spectroscopy of Al2O3
37
II. Excitation Spectroscopy: PL vs Raman spectroscopy
532nm excitation
PL Raman

LAB PRACTICALS – Optical spectroscopy of Al2O3
38
II. Excitation Spectroscopy: PL vs Raman spectroscopy
Cr+
R1 (694nm)
R2 (693nm)
Ruby PL (and laser !!!)
R1 R2
gree
n
blue
Cr+ E4
E3 E2
E1