Optical sol-gel coatings: ellipsometry of film formation · Measurements on TiO2 and SiO2...
10
HAL Id: jpa-00210768 https://hal.archives-ouvertes.fr/jpa-00210768 Submitted on 1 Jan 1988 HAL is a multi-disciplinary open access archive for the deposit and dissemination of sci- entific research documents, whether they are pub- lished or not. The documents may come from teaching and research institutions in France or abroad, or from public or private research centers. L’archive ouverte pluridisciplinaire HAL, est destinée au dépôt et à la diffusion de documents scientifiques de niveau recherche, publiés ou non, émanant des établissements d’enseignement et de recherche français ou étrangers, des laboratoires publics ou privés. Optical sol-gel coatings : ellipsometry of film formation Alan J. Hurd, C. Jeffrey Brinker To cite this version: Alan J. Hurd, C. Jeffrey Brinker. Optical sol-gel coatings : ellipsometry of film formation. Journal de Physique, 1988, 49 (6), pp.1017-1025. 10.1051/jphys:019880049060101700. jpa-00210768
Transcript of Optical sol-gel coatings: ellipsometry of film formation · Measurements on TiO2 and SiO2...
HAL Id: jpa-00210768https://hal.archives-ouvertes.fr/jpa-00210768
Submitted on 1 Jan 1988
HAL is a multi-disciplinary open accessarchive for the deposit and dissemination of sci-entific research documents, whether they are pub-lished or not. The documents may come fromteaching and research institutions in France orabroad, or from public or private research centers.
L’archive ouverte pluridisciplinaire HAL, estdestinée au dépôt et à la diffusion de documentsscientifiques de niveau recherche, publiés ou non,émanant des établissements d’enseignement et derecherche français ou étrangers, des laboratoirespublics ou privés.
Optical sol-gel coatings : ellipsometry of film formationAlan J. Hurd, C. Jeffrey Brinker
To cite this version:Alan J. Hurd, C. Jeffrey Brinker. Optical sol-gel coatings : ellipsometry of film formation. Journal dePhysique, 1988, 49 (6), pp.1017-1025. �10.1051/jphys:019880049060101700�. �jpa-00210768�
1017
Optical sol-gel coatings : ellipsometry of film formation
Alan J. Hurd and C. Jeffrey Brinker
Sandia National Laboratories, Albuquerque, NM 87185, U.S.A.
(Requ le 7 septembre 1987, révisé le 2 décembre 1987, accepté le 3 décembre 1987)
Résumé. 2014 On présente une méthode permettant de visualiser par ellipsométrie une région d’un film en trainde sécher dans le procédé de dépôt par immersion ; cette méthode donne l’épaisseur du film et son indice deréfraction en fonction de la position. Les mesures préliminaires effectuées sur des sols alcooliques deTiO2 et de SiO2 indiquent que le film tend vers une fraction volumique d’environ 0,2 à l’état humide etsuggèrent que le film résiste à une densification ultérieure pour des raisons cinétiques. Dans les films denses, lepassage du front de séchage final produit un effondrement rapide du film sous l’effe des forces capillaires ;dans les films poreux formés de grands agrégats de SiO2, l’affaiblissement final du film est plus lent parce queles forces capillaires sont plus faibles. Les profils d’épaisseur indiquent que l’amincissement du film résulted’une combinaison de l’évaporation et de l’écoulement gravitationnel.
Abstract. 2014 A method was developed to image an area of a drying, steady-state film during dip-coating usingellipsometry, thereby obtaining the film’s thickness and refractive index as a function of position.Measurements on TiO2 and SiO2 alcohol-based sols indicate that the film approaches a volume fraction03A6 ~ 0.2 in the wet state and suggests that the film resists densifying further for kinetic reasons. In dense films,as the final drying front passes, the film undergoes a rapid collapse owing to capillary forces ; porous filmsformed from relatively large SiO2 aggregates appear to collapse more slowly in the final stage due to smallercapillary forces. The thickness profiles are consistent with thinning by a combination of evaporation andgravitational draining.
J. Phys. France 49 (1988) 1017-1025 JUIN 1988,
Classification
Physics Abstracts07.60F - 68.15 - 81.15L - 82.70G
1. Sol-gel coatings.
Sol-gel coatings are applied to a wide variety ofmaterials requiring high quality optical films [1, 2].Since the coating can be formed simply by controlleddipping of the work followed by drying, difficult
shapes and large sizes can be accommodated. Bycontrolling the chemistry and the structure of theprecursor sol, unusual materials can be applied andfinal film characteristics can be tailored to the
requirements of a given application. A good exampleof the use of sol-gel dip coating is the application ofinterference coatings to large (1 m diameter) laseroptics for which spin coating is not feasible and
evaporative coatings are expensive. Another
example of more industrial importance is the produc-tion of reflective window glass often seen in high-riseoffice buildings.An important feature of sol-gel coatings is the
ability to control the refractive index through vari-
ations of the sol ; this is particularly important whensome interference condition is desired, e.g. mul-
tilayer dielectric coatings. Physical and chemical
parameters can be used to vary the film. For
example, by pre-aggregating the sol, a porous filmwith a low index results [3].When a sol film dries, it passes through states of
increasing solids concentration. In many cases thedrying drives the film rapidly to gelation. In the
precision dip-coating of photographic film, for
example, a gelatin is used that quickly sets into athick gel film. In the optical films studied here, thewet film dries quickly into a relatively thin layer andmay pass through a transient gel-like state justbefore the final drying front passes [4]. By analogyto other colloidal systems, the film’s viscosity andelastic modulus are expected to increase. This statedetermines many of the properties of the dry film ;in particular, the porosity is a function of the abilityof the « gel » state to withstand collapse under the
Article published online by EDP Sciences and available at http://dx.doi.org/10.1051/jphys:019880049060101700
1018
capillary forces of the drying front. A major goal ofthis study is to understand the nature of this fleetinggel-like state and how the microstructure of the finalfilm evolves from it.A second interesting goal is the measurement of
film drainage thickness in the presence of vigorousevaporation. The great importance of dip coating inmany aspects of manufacturing has spawned anextensive literature on the theory [5-7] and measure-ment [8, 9] of gravitational draining of plates andwires. The drainage problem arises in such disparatefields as volumetric measurement and nuclear reac-tor safety (where the cooling of reactor walls dependson a draining film). It appears that no one has yetaddressed the case of draining with evaporationtheoretically, although it is clearly an important dip-coating situation.
Since the instantaneous volume fraction is a keyparameter in the film properties, a natural quantityto measure is the refractive index, which can berelated to the volume fraction through a number ofoptical models. Although ellipsometry is well suitedfor thin, locally homogeneous layers of unknownindex and thickness, the common methods of using asmall localized beam to probe the sample are
inadequate due to fluctuations in the film from dustand convection. For this reason, a specialized ellip-someter was developed to probe many points andmany combinations of index and thickness at once.The purpose of this paper is mainly to describe the
apparatus. Data on optical films are given althoughtheir analysis is not exhaustive.
2. The film.
Good quality films were made with the film-drawingapparatus shown in figure 1. In this apparatus, a
long narrow substrate (1 cm x 10 cm) cut from a
silicon wafer was slowly drawn out of a sol reservoirby the smooth hydraulic action of draining a largecylinder through a controlled orifice. A float on thedraining liquid’s surface pulled the substrate via apulley system. The speed V of withdrawal could bevaried from 0 to 0.3 cm s-1.With volatile solvents, a steady-state film profile
was rapidly achieved for which the velocity of thedrying front matched the withdrawal velocity ; thisstate lasted long enough (1 min) to make measure-ments. The substrate was enclosed to reduce convec-tion and to maintain a well defined level of solventsaturation above the sol reservoir.
The chemical flexibility of the sol-gel coatingprocess allows for a wide variety of materials to bedeposited. In these studies, we have used titanateand silica sols, which are both widely employed inoptical applications.
Titania sols (4.9 % equivalent wt. Ti02) wereprepared by partially hydrolyzing titanium ethoxide,
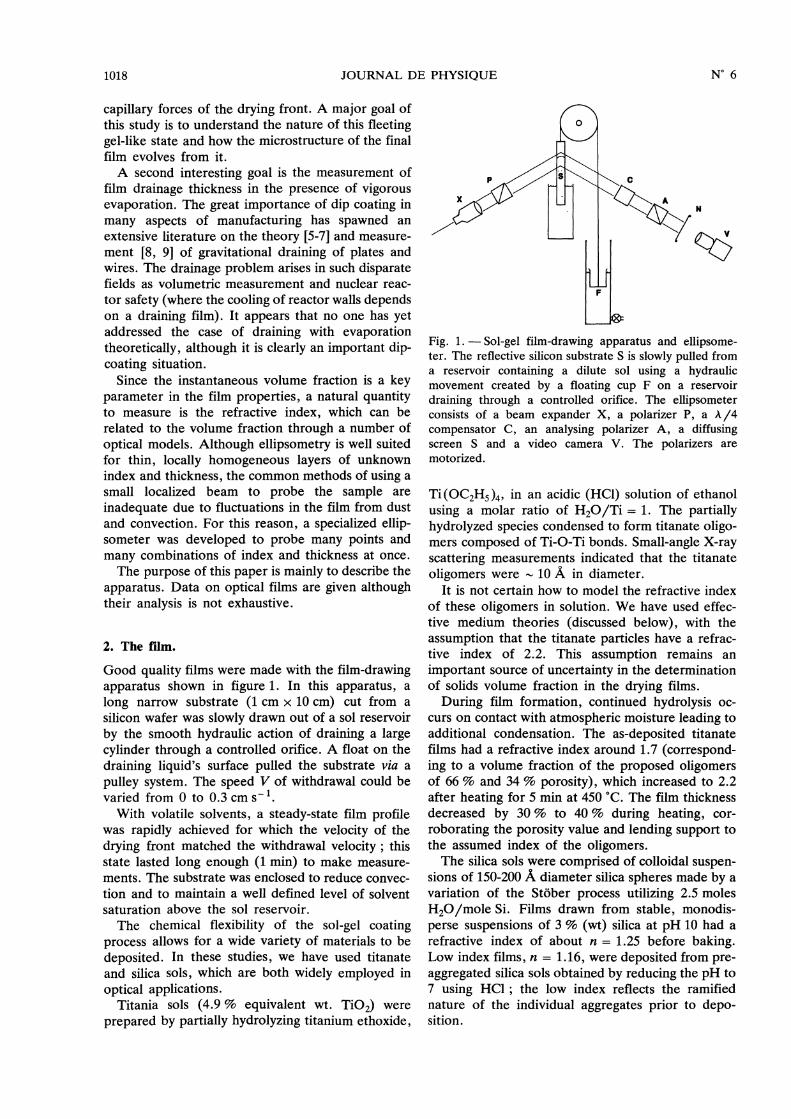
Fig. 1. - Sol-gel film-drawing apparatus and ellipsome-ter. The reflective silicon substrate S is slowly pulled froma reservoir containing a dilute sol using a hydraulicmovement created by a floating cup F on a reservoirdraining through a controlled orifice. The ellipsometerconsists of a beam expander X, a polarizer P, a A/4compensator C, an analysing polarizer A, a diffusingscreen S and a video camera V. The polarizers are
motorized.
Ti (OC2H5 )4, in an acidic (HCI) solution of ethanolusing a molar ratio of H20/Ti = 1. The partiallyhydrolyzed species condensed to form titanate oligo-mers composed of Ti-O-Ti bonds. Small-angle X-rayscattering measurements indicated that the titanateoligomers were - 10 A in diameter.
It is not certain how to model the refractive indexof these oligomers in solution. We have used effec-tive medium theories (discussed below), with theassumption that the titanate particles have a refrac-tive index of 2.2. This assumption remains an
important source of uncertainty in the determinationof solids volume fraction in the drying films.During film formation, continued hydrolysis oc-
curs on contact with atmospheric moisture leading toadditional condensation. The as-deposited titanatefilms had a refractive index around 1.7 (correspond-ing to a volume fraction of the proposed oligomersof 66 % and 34 % porosity), which increased to 2.2after heating for 5 min at 450 °C. The film thicknessdecreased by 30 % to 40 % during heating, cor-
roborating the porosity value and lending support tothe assumed index of the oligomers.The silica sols were comprised of colloidal suspen-
sions of 150-200 A diameter silica spheres made by avariation of the St6ber process utilizing 2.5 molesH20/mole Si. Films drawn from stable, monodis-perse suspensions of 3 % (wt) silica at pH 10 had arefractive index of about n = 1.25 before baking.Low index films, n = 1.16, were deposited from pre-aggregated silica sols obtained by reducing the pH to7 using HCI1 ; the low index reflects the ramifiednature of the individual aggregates prior to depo-sition.
1019
3. The ellipsometer.
A beam of light reflecting from a surface suffersdifferent amplitude and phase shifts in its « s »
(polarization parallel to surface) and « p » (polariz-ation perpendicular to surface) waves. In ellipsomet-ry [10], these amplitude and phase shifts are
measured then interpreted by an appropriate model.A typical ellipsometer consists of a laser, a polarizerto prepare a known polarization, the reflectingsample, a A/4 compensator plate that resolves the sand p waves, and an analysing polarizer. The
analyser and polarizer are adjusted until the reflectedbeam is extinguished.The angle of the polarizer determines the relative
amplitudes of the incident s and p waves ; its angle atextinction compensates for the difference in s and preflection amplitudes. With the compensator’s fastaxis at 45° to the plane of incidence, the analysingpolarizer, when tuned to extinction, measures theangle at which the reflected light must pass throughthe A/4 plate to compensate for the phase shift
difference suffered by the s and p waves. With thetwo polarizer angles measured at extinction, it is
possible to calculate both the index n and thickness hof a film covering a substrate with a known index.Since each polarizer has two equivalent positions,there are four possible extinction conditions, or four« zones ».
In the case of the silicon wafers used here, thesubstrate index is complex. Periodically, two-zonemeasurements were made on uncoated substrates tocheck the real and imaginary index values, whichwere found to be Re (n ) = 3.856 and K =
Im (n )/Re (n ) = 0.052, and to monitor the precisionof the apparatus. Although these values are withinthe range of accepted values for clean silicon, thesilicon surface inevitably has an oxide layer thatendows the substrate with the wetting properties ofsilica appropriate for many optical applications.
In these experiments the angle of incidence wasfixed at 67.5° and the wavelength was 6 328 A.The usual methods of narrow-beam ellipsometry
were found to be unsatisfactory in our initial at-
tempts to study films because of fluctuations in
thickness. Furthermore, it was desirable to obtaindata from many points on the film at once ratherthan one point per dip coating. Hence, the laser wasexpanded and collimated to illuminate approxi-mately 1 cm2 of the film (an area limited mainly bythe apertures of the polarizing optics). In a sense,each ray in the expanded beam defined its own
ellipsometer, probing the film point-by-point (dif-fraction notwithstanding) and forming a « phase »image of the film.The fluctuations appeared to be mainly the result
of residual atmospheric convection near the samplein spite of our attempts to isolate the sample in a
chamber. (Occasionally dust on the substrate wasalso a problem.) The drying front would recede andadvance randomly by ± 100 )JL from its averageposition in the laser beam on time scales of 5-10 s.Since the wedge angle of the drying film was10- 3 radians, these fluctuations corresponded to
thickness variations of ± 100 A at a given spot on thefilm (in the lab frame of reference) and were enoughto destroy the interference conditions for extinction.It was too difficult to find the polarizer angles for anextinction in the short time that the film was steady.With the expanded beam, however, clear images
were seen of the drying film. These images, seen infigure 2, consisted of nonlocalized fringes, like
shadows, whose sharpness was degraded by diffrac-tion to a greater degree the further out the imagewas projected from the sample. By intercepting theimage with a diffuse screen as close to the substrateas possible, however, good spatial resolution
(~ 50 um ) was possible. Although better resolutioncould be attained by using focusing lenses [11, 12],the gains would require introducing a spread inincident angle and an attendant uncertainty in themeasured index [12] as well as additional opticalelements to complicate our analysis.For arbitrary polarizer settings, the corresponding
thickness and index required for a null would bepresent somewhere in the image only by chance. Theproblem was to find polarizer settings that gaveextinctions somewhere on the continuously varyingfilm. Obviously it is difficult, if not impossible, toexplore all polarizer-analyser settings (correspondingto index-thickness combinations) on such short-livedfilms but strategies could be devised to look for nullsin certain ranges of thickness.
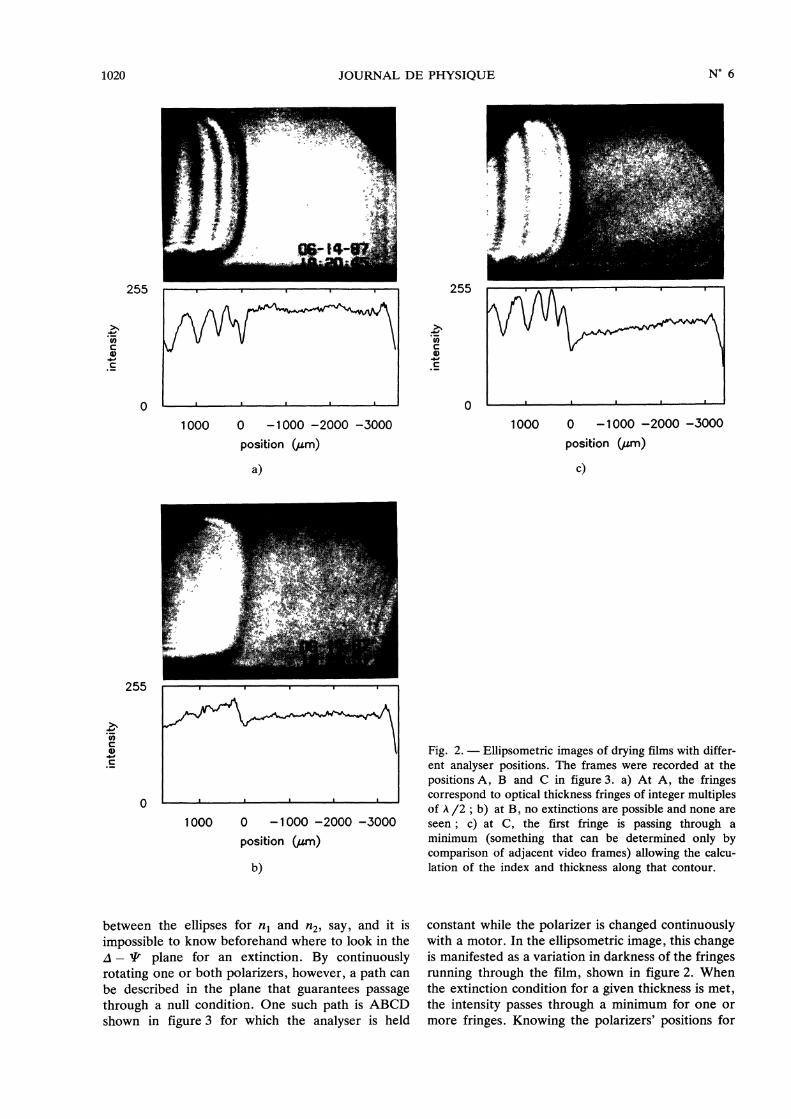
The idea is best illustrated by figure 3, showingthe locus of extinctions in the A - T plane, where Aand T are the classical ellipsometric angles and arerelated in simple ways to the angles of the analyserAp and polarizer Pp [13]. (When the analyser andpolarizer angles are between 0° and 90° from theplane of incidence, A = - 90’ - 2 Ap (mod 360°)and 41 = Pp.) A roughly elliptical figure in the.d - 1ft plane defines those polarizer settings at
which an extinction is expected for a given film indexnl. As the film thickness increases, the null pointsprogress counterclockwise around the ellipse, start-ing with the leftmost point A at zero thickness. Aftera certain thickness is exceeded, the optical conditionsrepeat ; therefore it is impossible to distinguishbetween thicknesses differing by integer multiples ofthis optical phase thickness (one-half the wavelengthinside the medium, approximately 2 500 A) withoutadditional information as to the order of the extinc-tion. For another index of refraction n2, the ellipse isdistinct except at point A where all ellipses meet.Now, a drying sol-gel film consists of continuously
varying thicknesses and indexes falling somewhere
1020
between the ellipses for n, and n2, say, and it is
impossible to know beforehand where to look in theA - AP plane for an extinction. By continuouslyrotating one or both polarizers, however, a path canbe described in the plane that guarantees passagethrough a null condition. One such path is ABCDshown in figure 3 for which the analyser is held
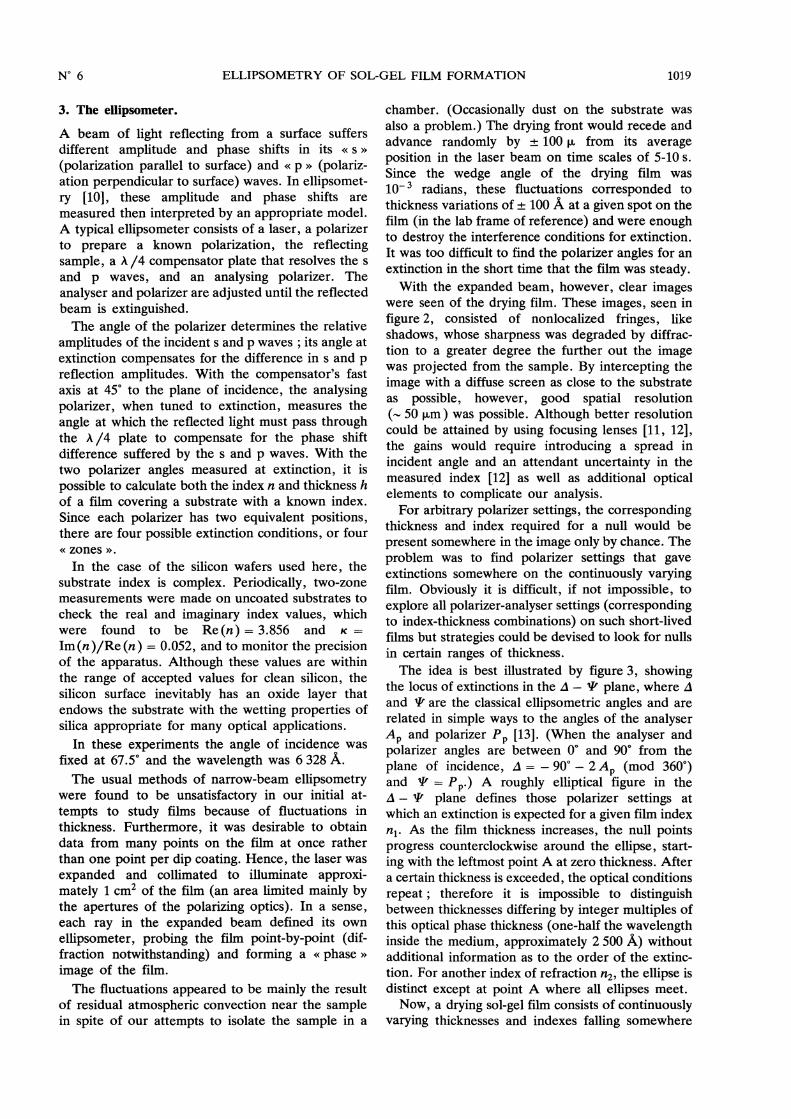
Fig. 2. - Ellipsometric images of drying films with differ-ent analyser positions. The frames were recorded at thepositions A, B and C in figure 3. a) At A, the fringescorrespond to optical thickness fringes of integer multiplesof A /2 ; b) at B, no extinctions are possible and none areseen ; c) at C, the first fringe is passing through a
minimum (something that can be determined only bycomparison of adjacent video frames) allowing the calcu-lation of the index and thickness along that contour.
constant while the polarizer is changed continuouslywith a motor. In the ellipsometric image, this changeis manifested as a variation in darkness of the fringesrunning through the film, shown in figure 2. Whenthe extinction condition for a given thickness is met,the intensity passes through a minimum for one ormore fringes. Knowing the polarizers’ positions for
1021
Fig. 3. - Locus of extinctions as function of ellipsometricangles 4 and T (related to polarizer angles) for indexesnl and n2 (solid curves, with nl n2) and spatially varyingfilm index (dashed curve). Motorized polarizers allow
searching along paths that guarantee crossing an extinctionin the film.
this condition, along with the order of the fringe,allows the calculation of both the index and thethickness unambiguously.
In practice it is not easy to identify the points ofminimum intensity. Image processing was used onvideo recordings of the ellipsometric image to ac-complish this. The intensity profile normal to thefringes was calculated by averaging up to 10 pixels(~ 70 J-Lm) on either side of a line perpendicular tothe fringes. Thus the resolution perpendicular to thedipping direction was coarse (> 150 um ) but fairlyhigh (- 50 um ) along the dipping direction. Thisaveraging procedure provided a smooth represen-tation of the fringe profile. Each profile was nor-malized by the average image intensity in order toremove gain changes introduced automatically bythe video camera electronics when the overall inten-
sity changed. By monitoring the depth of the fringesas a function of time, the intensity minimum couldbe identified and correlated with the polarizer settingto within 1°. Using a one-layer optical model [10],the thickness and index uncertainties were typically1 %. The fringe position along the substrate wasreferred to an intensity peak or valley near thedrying front tip rather than to the absolute pixelcoordinates in the video image because the film’sposition would often fluctuate while its profile wouldremain constant.
Different paths in the A - 1/1’ plane providedinformation at different thicknesses in the film.
Hence, the path BD in figure 3 gave fringes at
thicknesses of approximately 1 200 A, 3 600 A,6 000 A, ... whereas the path BE gave fringes atapproximately 600 A, 3 000 A, 5 400 A, ...
Only at places on the film corresponding to one
set of thicknesses at a time can null ellipsometryprovide the refractive index. In principle, the inten-sity can be used to evaluate the index and thicknesswithout finding a null condition [10, 12] ; but thenecessary measurements require absolute intensitycalibration which was not possible with the automaticgain circuitry in our video camera. This remains apromising avenue of improvement.
4. Results.
Knowing the index of refraction for the constituentsof the film, various optical models can be used tocalculate the volume fraction of solids [14]. A wellknown theory is the effective medium model byMaxwell Garnett, which assumes that there are
identifiable particles of one material inside a matrixof another and takes their (optical) interactions intoaccount by a mean-field procedure. Another modelat the same order of approximation is the Bruggemantheory, developed to describe two-component mix-tures rather than a particulate medium. Presumably,the Maxwell Garnett theory is more appropriate forthe silica colloidal sols whereas the Bruggemantheory is better for the titania polymeric sols. Inpractice, however, both theories gave the sameanswers to within experimental error for the data athand. A third possibility, the Lorentz-Lorentz re-lation, also agrees well with these approximations.For our purposes, only the Maxwell Garnett predic-tions are discussed. The particle volume fraction isgiven in this theory by
where na and nb are the indexes of the particles andsolvent, respectively, and n is the measured index ofthe film.
Figure 4 shows the Ti02 film’s index as a functionof thickness, and figure 5 is the thickness as a
function of position on the film using a path of thetype ABCD and a withdrawal speed of V =
0.096 cm/s. From equation (1), the volume fractionof titania could be calculated assuming a completelywet film. 0 is plotted in figure 6 using an index of 2.2for the titania sol particles and 1.35 for the solventindex.Shown in figures 4-6 are solid curves correspond-
ing to constant removal of solvent by evaporationand, in figure 5, a dashed curve for a case of
interrupted gravitational draining (discussed below).The thickness profile is curved in a way that impliesa combination of evaporation and gravitationaldraining.Note that there is an offset of 63.8 um implied by
the x-intercept of the solid line : the position alongthe film was measured against an arbitrary optical
1022
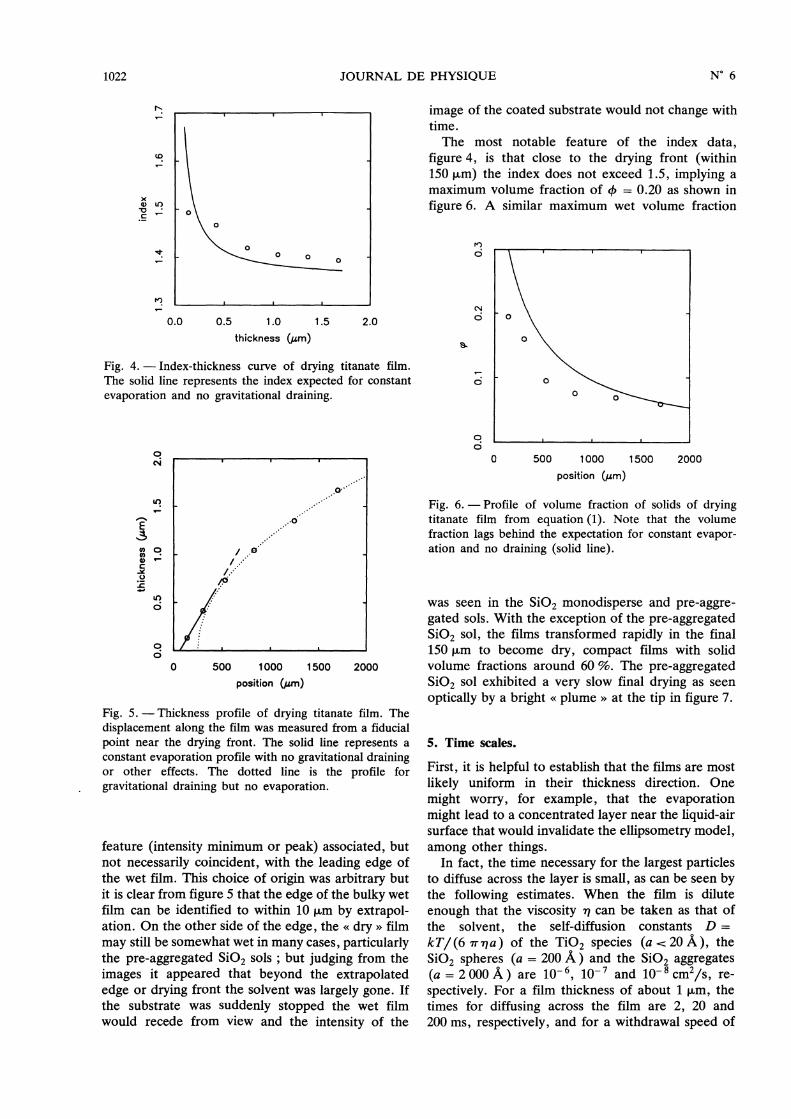
Fig. 4. - Index-thickness curve of drying titanate film.
The solid line represents the index expected for constantevaporation and no gravitational draining.
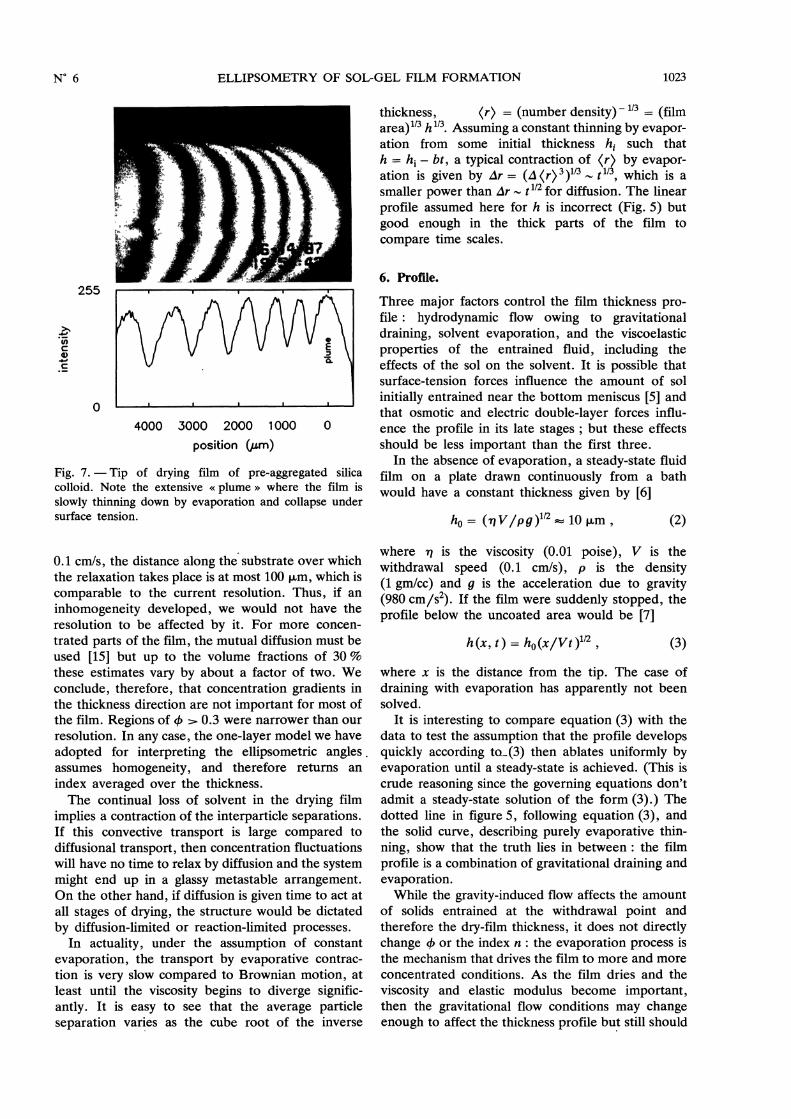
Fig. 5. - Thickness profile of drying titanate film. Thedisplacement along the film was measured from a fiducialpoint near the drying front. The solid line represents aconstant evaporation profile with no gravitational drainingor other effects. The dotted line is the profile for
gravitational draining but no evaporation.
feature (intensity minimum or peak) associated, butnot necessarily coincident, with the leading edge ofthe wet film. This choice of origin was arbitrary butit is clear from figure 5 that the edge of the bulky wetfilm can be identified to within 10 f.Lm by extrapol-ation. On the other side of the edge, the « dry » filmmay still be somewhat wet in many cases, particularlythe pre-aggregated Si02 sols ; but judging from theimages it appeared that beyond the extrapolatededge or drying front the solvent was largely gone. Ifthe substrate was suddenly stopped the wet filmwould recede from view and the intensity of the
image of the coated substrate would not change withtime.The most notable feature of the index data,
figure 4, is that close to the drying front (within150 Vtm) the index does not exceed 1.5, implying amaximum volume fraction of 0 = 0.20 as shown infigure 6. A similar maximum wet volume fraction
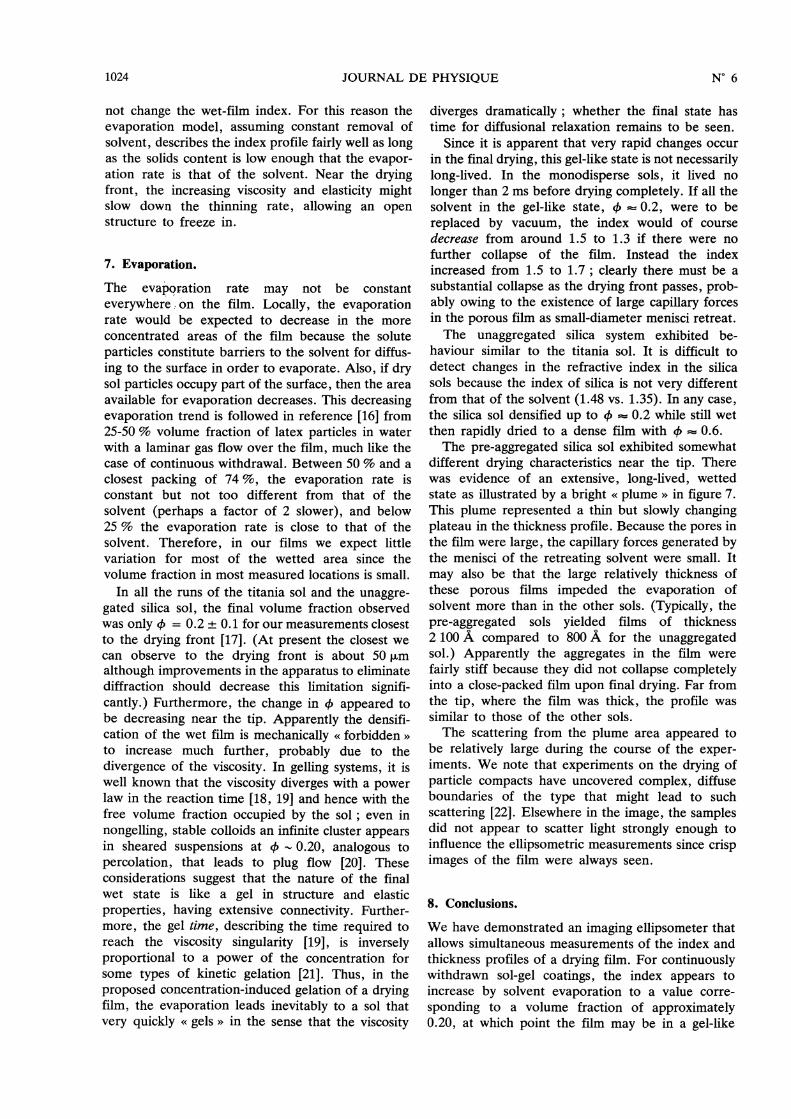
Fig. 6. - Profile of volume fraction of solids of dryingtitanate film from equation (1). Note that the volumefraction lags behind the expectation for constant evapor-ation and no draining (solid line).
was seen in the Si02 monodisperse and pre-aggre-gated sols. With the exception of the pre-aggregatedSi02 sol, the films transformed rapidly in the final150 Rm to become dry, compact films with solidvolume fractions around 60 %. The pre-aggregatedSi02 sol exhibited a very slow final drying as seenoptically by a bright « plume » at the tip in figure 7.
5. Time scales.
First, it is helpful to establish that the films are mostlikely uniform in their thickness direction. One
might worry, for example, that the evaporationmight lead to a concentrated layer near the liquid-airsurface that would invalidate the ellipsometry model,among other things.
In fact, the time necessary for the largest particlesto diffuse across the layer is small, as can be seen bythe following estimates. When the film is dilute
enough that the viscosity q can be taken as that ofthe solvent, the self-diffusion constants D =
kTI(6,7r,qa) of the Ti02 species (a : 20 Å), theSi02 spheres (a = 200 A ) and the Si02 aggregates(a = 2 000 A ) are 10- 6, 10-7 and 10- 8 cm2/s, re-spectively. For a film thickness of about 1 jjbm, thetimes for diffusing across the film are 2, 20 and200 ms, respectively, and for a withdrawal speed of
1023
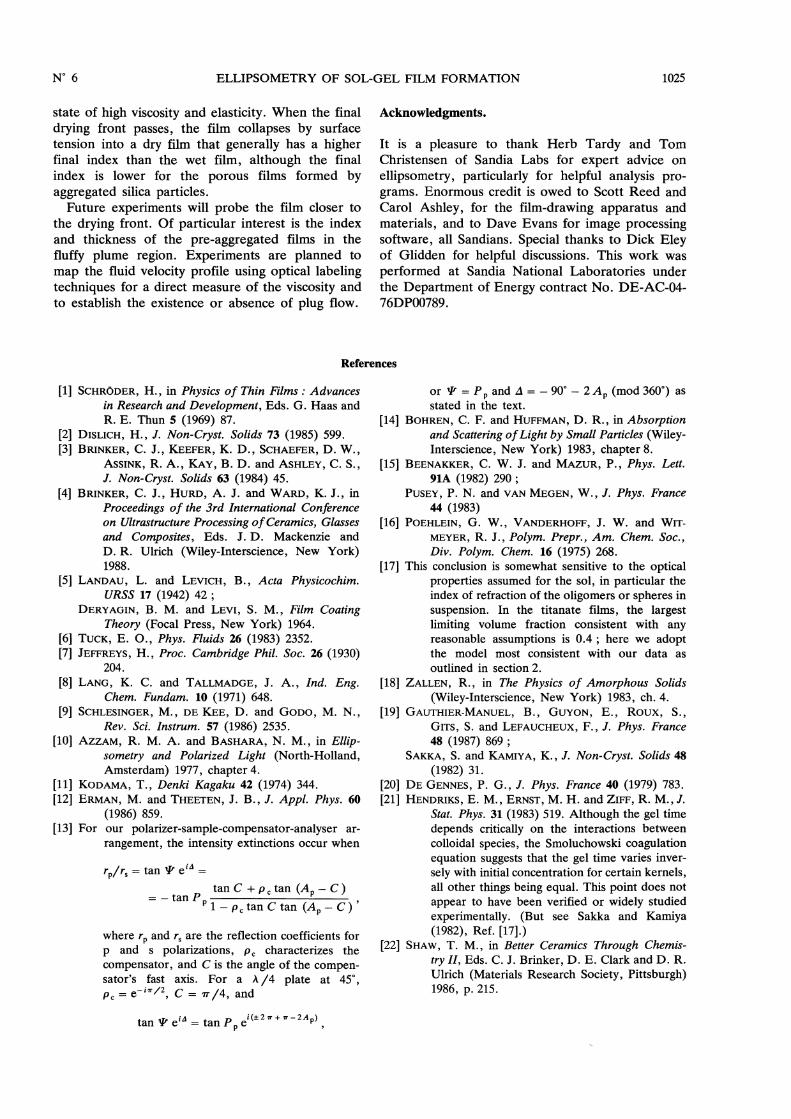
Fig. 7. - Tip of drying film of pre-aggregated silica
colloid. Note the extensive « plume » where the film is
slowly thinning down by evaporation and collapse undersurface tension.
0.1 cm/s, the distance along the substrate over whichthe relaxation takes place is at most 100 um, which iscomparable to the current resolution. Thus, if an
inhomogeneity developed, we would not have theresolution to be affected by it. For more concen-
trated parts of the film, the mutual diffusion must beused [15] but up to the volume fractions of 30 %these estimates vary by about a factor of two. Weconclude, therefore, that concentration gradients inthe thickness direction are not important for most ofthe film. Regions of 0 > 0.3 were narrower than our
resolution. In any case, the one-layer model we haveadopted for interpreting the ellipsometric angles.assumes homogeneity, and therefore returns an
index averaged over the thickness.The continual loss of solvent in the drying film
implies a contraction of the interparticle separations.If this convective transport is large compared todiffusional transport, then concentration fluctuationswill have no time to relax by diffusion and the systemmight end up in a glassy metastable arrangement.On the other hand, if diffusion is given time to act atall stages of drying, the structure would be dictatedby diffusion-limited or reaction-limited processes.
In actuality, under the assumption of constantevaporation, the transport by evaporative contrac-tion is very slow compared to Brownian motion, atleast until the viscosity begins to diverge signific-antly. It is easy to see that the average particleseparation varies as the cube root of the inverse
thickness, (r) = (number density) -1/3 = (filmarea)1/3 h1/3. Assuming a constant thinning by evapor-ation from some initial thickness hi such that
h = hi - bt, a typical contraction of (r) by evapor-ation is given by Ar = (,A r) 3 )1/3 - t1/3, which is asmaller power than Ar - t
112 for diffusion. The linear
profile assumed here for h is incorrect (Fig. 5) butgood enough in the thick parts of the film to
compare time scales.
6. Profile.
Three major factors control the film thickness pro-file : hydrodynamic flow owing to gravitationaldraining, solvent evaporation, and the viscoelasticproperties of the entrained fluid, including theeffects of the sol on the solvent. It is possible thatsurface-tension forces influence the amount of sol
initially entrained near the bottom meniscus [5] andthat osmotic and electric double-layer forces influ-ence the profile in its late stages ; but these effectsshould be less important than the first three.
In the absence of evaporation, a steady-state fluidfilm on a plate drawn continuously from a bathwould have a constant thickness given by [6]
where q is the viscosity (0.01 poise), V is thewithdrawal speed (0.1 cm/s), p is the density(1 gm/cc) and g is the acceleration due to gravity(980 CM/S2). If the film were suddenly stopped, theprofile below the uncoated area would be [7]
where x is the distance from the tip. The case ofdraining with evaporation has apparently not beensolved.
It is interesting to compare equation (3) with thedata to test the assumption that the profile developsquickly according to_(3) then ablates uniformly byevaporation until a steady-state is achieved. (This iscrude reasoning since the governing equations don’tadmit a steady-state solution of the form (3).) Thedotted line in figure 5, following equation (3), andthe solid curve, describing purely evaporative thin-ning, show that the truth lies in between : the filmprofile is a combination of gravitational draining andevaporation.While the gravity-induced flow affects the amount
of solids entrained at the withdrawal point andtherefore the dry-film thickness, it does not directlychange 0 or the index n : the evaporation process isthe mechanism that drives the film to more and moreconcentrated conditions. As the film dries and the
viscosity and elastic modulus become important,then the gravitational flow conditions may changeenough to affect the thickness profile but still should
1024
not change the wet-film index. For this reason theevaporation model, assuming constant removal ofsolvent, describes the index profile fairly well as longas the solids content is low enough that the evapor-ation rate is that of the solvent. Near the dryingfront, the increasing viscosity and elasticity mightslow down the thinning rate, allowing an openstructure to freeze in.
7. Evaporation.
The evaporation rate may not be constant
everywhere on the film. Locally, the evaporationrate would be expected to decrease in the moreconcentrated areas of the film because the solute
particles constitute barriers to the solvent for diffus-ing to the surface in order to evaporate. Also, if drysol particles occupy part of the surface, then the areaavailable for evaporation decreases. This decreasingevaporation trend is followed in reference [16] from25-50 % volume fraction of latex particles in waterwith a laminar gas flow over the film, much like thecase of continuous withdrawal. Between 50 % and aclosest packing of 74 %, the evaporation rate isconstant but not too different from that of thesolvent (perhaps a factor of 2 slower), and below25 % the evaporation rate is close to that of thesolvent. Therefore, in our films we expect littlevariation for most of the wetted area since thevolume fraction in most measured locations is small.
In all the runs of the titania sol and the unaggre-gated silica sol, the final volume fraction observedwas only 0 = 0.2 ± 0.1 for our measurements closestto the drying front [17]. (At present the closest wecan observe to the drying front is about 50 umalthough improvements in the apparatus to eliminatediffraction should decrease this limitation signifi-cantly.) Furthermore, the change in 0 appeared tobe decreasing near the tip. Apparently the densifi-cation of the wet film is mechanically « forbidden »to increase much further, probably due to the
divergence of the viscosity. In gelling systems, it iswell known that the viscosity diverges with a powerlaw in the reaction time [18, 19] and hence with thefree volume fraction occupied by the sol ; even innongelling, stable colloids an infinite cluster appearsin sheared suspensions at .0 - 0.20, analogous topercolation, that leads to plug flow [20]. Theseconsiderations suggest that the nature of the finalwet state is like a gel in structure and elastic
properties, having extensive connectivity. Further-
more, the gel time, describing the time required toreach the viscosity singularity [19], is inverselyproportional to a power of the concentration forsome types of kinetic gelation [21]. Thus, in the
proposed concentration-induced gelation of a dryingfilm, the evaporation leads inevitably to a sol thatvery quickly « gels » in the sense that the viscosity
diverges dramatically ; whether the final state hastime for diffusional relaxation remains to be seen.
Since it is apparent that very rapid changes occurin the final drying, this gel-like state is not necessarilylong-lived. In the monodisperse sols, it lived no
longer than 2 ms before drying completely. If all thesolvent in the gel-like state, 0 o-- 0.2, were to bereplaced by vacuum, the index would of coursedecrease from around 1.5 to 1.3 if there were nofurther collapse of the film. Instead the indexincreased from 1.5 to 1.7 ; clearly there must be asubstantial collapse as the drying front passes, prob-ably owing to the existence of large capillary forcesin the porous film as small-diameter menisci retreat.The unaggregated silica system exhibited be-
haviour similar to the titania sol. It is difficult todetect changes in the refractive index in the silicasols because the index of silica is not very differentfrom that of the solvent (1.48 vs. 1.35). In any case,the silica sol densified up to 0 -. 0.2 while still wetthen rapidly dried to a dense film with 0 -- 0.6.The pre-aggregated silica sol exhibited somewhat
different drying characteristics near the tip. Therewas evidence of an extensive, long-lived, wettedstate as illustrated by a bright « plume » in figure 7.This plume represented a thin but slowly changingplateau in the thickness profile. Because the pores inthe film were large, the capillary forces generated bythe menisci of the retreating solvent were small. It
may also be that the large relatively thickness ofthese porous films impeded the evaporation of
solvent more than in the other sols. (Typically, thepre-aggregated sols yielded films of thickness2 100 A compared to 800 A for the unaggregatedsol.) Apparently the aggregates in the film were
fairly stiff because they did not collapse completelyinto a close-packed film upon final drying. Far fromthe tip, where the film was thick, the profile wassimilar to those of the other sols.The scattering from the plume area appeared to
be relatively large during the course of the exper-iments. We note that experiments on the drying ofparticle compacts have uncovered complex, diffuseboundaries of the type that might lead to such
scattering [22]. Elsewhere in the image, the samplesdid not appear to scatter light strongly enough toinfluence the ellipsometric measurements since crispimages of the film were always seen.
8. Conclusions.
We have demonstrated an imaging ellipsometer thatallows simultaneous measurements of the index andthickness profiles of a drying film. For continuouslywithdrawn sol-gel coatings, the index appears to
increase by solvent evaporation to a value corre-sponding to a volume fraction of approximately0.20, at which point the film may be in a gel-like
1025
state of high viscosity and elasticity. When the finaldrying front passes, the film collapses by surfacetension into a dry film that generally has a higherfinal index than the wet film, although the finalindex is lower for the porous films formed byaggregated silica particles.
Future experiments will probe the film closer tothe drying front. Of particular interest is the indexand thickness of the pre-aggregated films in the
fluffy plume region. Experiments are planned to
map the fluid velocity profile using optical labelingtechniques for a direct measure of the viscosity andto establish the existence or absence of plug flow.
Acknowledgments.
It is a pleasure to thank Herb Tardy and TomChristensen of Sandia Labs for expert advice onellipsometry, particularly for helpful analysis pro-grams. Enormous credit is owed to Scott Reed andCarol Ashley, for the film-drawing apparatus andmaterials, and to Dave Evans for image processingsoftware, all Sandians. Special thanks to Dick Eleyof Glidden for helpful discussions. This work wasperformed at Sandia National Laboratories underthe Department of Energy contract No. DE-AC-04-76DP00789.
References
[1] SCHRÖDER, H., in Physics of Thin Films : Advancesin Research and Development, Eds. G. Haas andR. E. Thun 5 (1969) 87.
[2] DISLICH, H., J. Non-Cryst. Solids 73 (1985) 599.[3] BRINKER, C. J., KEEFER, K. D., SCHAEFER, D. W.,
ASSINK, R. A., KAY, B. D. and ASHLEY, C. S.,J. Non-Cryst. Solids 63 (1984) 45.
[4] BRINKER, C. J., HURD, A. J. and WARD, K. J., inProceedings of the 3rd International Conferenceon Ultrastructure Processing of Ceramics, Glassesand Composites, Eds. J. D. Mackenzie and
D. R. Ulrich (Wiley-Interscience, New York)1988.
[5] LANDAU, L. and LEVICH, B., Acta Physicochim.URSS 17 (1942) 42 ;
DERYAGIN, B. M. and LEVI, S. M., Film CoatingTheory (Focal Press, New York) 1964.
[6] TUCK, E. O., Phys. Fluids 26 (1983) 2352.[7] JEFFREYS, H., Proc. Cambridge Phil. Soc. 26 (1930)
204.
[8] LANG, K. C. and TALLMADGE, J. A., Ind. Eng.Chem. Fundam. 10 (1971) 648.
[9] SCHLESINGER, M., DE KEE, D. and GODO, M. N.,Rev. Sci. Instrum. 57 (1986) 2535.
[10] AZZAM, R. M. A. and BASHARA, N. M., in Ellip-sometry and Polarized Light (North-Holland,Amsterdam) 1977, chapter 4.
[11] KODAMA, T., Denki Kagaku 42 (1974) 344.[12] ERMAN, M. and THEETEN, J. B., J. Appl. Phys. 60
(1986) 859.[13] For our polarizer-sample-compensator-analyser ar-
rangement, the intensity extinctions occur when
where rp and rs are the reflection coefficients forp and s polarizations, 03C1c characterizes the
compensator, and C is the angle of the compen-sator’s fast axis. For a 03BB/4 plate at 45°,03C1c = e-i03C0/2, C = 03C0/4, and
tan 03A8 ei0394 = tan Pp ei(±203C0 + 03C0 - 2Ap),
or 03A8 = Pp and 0394 = - 90° - 2Ap (mod 360°) asstated in the text.
[14] BOHREN, C. F. and HUFFMAN, D. R., in Absorptionand Scattering of Light by Small Particles (Wiley-Interscience, New York) 1983, chapter 8.
[15] BEENAKKER, C. W. J. and MAZUR, P., Phys. Lett.91A (1982) 290 ;
PUSEY, P. N. and VAN MEGEN, W., J. Phys. France44 (1983)
[16] POEHLEIN, G. W., VANDERHOFF, J. W. and WIT-MEYER, R. J., Polym. Prepr., Am. Chem. Soc.,Div. Polym. Chem. 16 (1975) 268.
[17] This conclusion is somewhat sensitive to the opticalproperties assumed for the sol, in particular theindex of refraction of the oligomers or spheres insuspension. In the titanate films, the largestlimiting volume fraction consistent with anyreasonable assumptions is 0.4 ; here we adoptthe model most consistent with our data as
outlined in section 2.
[18] ZALLEN, R., in The Physics of Amorphous Solids(Wiley-Interscience, New York) 1983, ch. 4.
[19] GAUTHIER-MANUEL, B., GUYON, E., ROUX, S.,GITS, S. and LEFAUCHEUX, F., J. Phys. France48 (1987) 869 ;
SAKKA, S. and KAMIYA, K., J. Non-Cryst. Solids 48(1982) 31.
[20] DE GENNES, P. G., J. Phys. France 40 (1979) 783.[21] HENDRIKS, E. M., ERNST, M. H. and ZIFF, R. M., J.
Stat. Phys. 31 (1983) 519. Although the gel timedepends critically on the interactions betweencolloidal species, the Smoluchowski coagulationequation suggests that the gel time varies inver-sely with initial concentration for certain kernels,all other things being equal. This point does notappear to have been verified or widely studiedexperimentally. (But see Sakka and Kamiya(1982), Ref. [17].)
[22] SHAW, T. M., in Better Ceramics Through Chemis-try II, Eds. C. J. Brinker, D. E. Clark and D. R.Ulrich (Materials Research Society, Pittsburgh)1986, p. 215.


![[FlhJ16fa] Film thickness by interference pattern and optical characterization of polyaniline by spectroscopic ellipsometry](https://static.fdocuments.in/doc/165x107/589982551a28abb97c8b592f/flhj16fa-film-thickness-by-interference-pattern-and-optical-characterization.jpg)