optical recording of action potentials in mammalian...
19
© 2011 Nature America, Inc. All rights reserved. ARTICLES NATURE METHODS | ADVANCE ONLINE PUBLICATION | Reliable optical detection of single action potentials in mammalian neurons has been one of the longest-standing challenges in neuroscience. Here we achieved this goal by using the endogenous fluorescence of a microbial rhodopsin protein, Archaerhodopsin 3 (Arch) from Halorubrum sodomense, expressed in cultured rat hippocampal neurons. This genetically encoded voltage indicator exhibited an approximately tenfold improvement in sensitivity and speed over existing protein- based voltage indicators, with a roughly linear twofold increase in brightness between −50 mV and +50 mV and a sub- millisecond response time. Arch detected single electrically triggered action potentials with an optical signal-to-noise ratio >0. Arch(D95N) lacked endogenous proton pumping and had 50% greater sensitivity than wild type but had a slower response (4 ms). Nonetheless, Arch(D95N) also resolved individual action potentials. Microbial rhodopsin–based voltage indicators promise to enable optical interrogation of complex neural circuits and electrophysiology in systems for which electrode-based techniques are challenging. To study the dynamics of a complex neural circuit, one would like to record action potentials from many neurons simultane- ously. Optical imaging promises to realize this goal 1–5 , and volt- age indicators have been developed based on small molecules 6,7 , fluorescent proteins 8,9 and hybrid protein-dye systems 10,11 . Single action potentials with high signal-to-noise ratio (SNR) have been recorded recently in individual spines of mammalian neurons in slices using an organic voltage-indicating dye, but this approach required intracellular injection of dye and cumulative illumina- tion of less than 2 s to avoid phototoxicity 12 . Action potentials in mammalian neurons have been recorded in vivo using a geneti- cally encoded voltage indicator, but this required averaging over multiple trials 4 . Signals suggestive of single spikes have been reported when the optical signal was aligned with an electro- physiology trace, but the SNR was inadequate for all-optical spike identification. Calcium imaging is widely used as an indirect rea- dout of electrical activity but is only useful when slower readouts (hundreds of milliseconds) are acceptable 13 . Despite this progress, Optical recording of action potentials in mammalian neurons using a microbial rhodopsin Joel M Kralj 1,5 , Adam D Douglass 2,5 , Daniel R Hochbaum 3,5 , Dougal Maclaurin 4 & Adam E Cohen 1,4 direct and sensitive optical measurement of membrane potential remains elusive. All approaches have one or more serious limita- tions, including slow response, lack of sensitivity, difficulty in tar- geting or phototoxicity. No genetically encoded voltage indicator has had adequate sensitivity and speed to reliably identify action potentials from mammalian neurons on a single-trial basis. We recently developed a fast and sensitive voltage indicator based on green-absorbing proteorhodopsin 14 . This proteorho- dopsin optical proton sensor (PROPS) revealed electrical spiking in Escherichia coli, but efforts to use PROPS in eukaryotic cells failed because the protein did not localize to the plasma mem- brane. Addition of targeting and localization sequences to PROPS did not help. Thus we decided to test other microbial rhodopsins as putative voltage sensors, focusing on proteins known to localize to the eukaryotic plasma membrane. Archaerhodopsin 3 (Arch) from Halorubrum sodomense is a light-driven outward proton pump that captures solar energy for its host 15 . Recently Arch has been expressed in mammalian neurons, where it enabled optical silencing of neural activity and was minimally perturbative to endogenous function in the dark 16 . We hypothesized that Arch could be ‘run’ in reverse: that a membrane potential could alter the optical properties of the protein and thereby provide a volt- age sensor that functioned through a mechanism similar to that of PROPS. We found that Arch resolved individual action potentials in mammalian neurons in vitro, with high SNR and low phototox- icity. Arch enabled mapping of neuronal action potentials with sub-millisecond temporal resolution and subcellular spatial reso- lution. However, the wild-type form of Arch generated a hyper- polarizing photocurrent upon exposure to the imaging laser. The mutation D95N in Arch eliminated this photocurrent but also slowed the response to 41 ms. RESULTS Photophysics of Arch At neutral pH, bacterially expressed Arch was pink, but at high pH the protein turned yellow (Fig. 1a), with a pK a for the transi- tion of 10.1. Based on homology to other microbial rhodopsins 17 , 1 Department of Chemistry and Chemical Biology, Harvard University, Cambridge, Massachusetts, USA. 2 Department of Molecular and Cellular Biology, Harvard University, Cambridge, Massachusetts, USA. 3 Applied Physics Program, School of Engineering and Applied Science, Harvard University, Cambridge, Massachusetts, USA. 4 Department of Physics, Harvard University, Cambridge, Massachusetts, USA. 5 These authors contributed equally to this work. Correspondence should be addressed to A.E.C. ([email protected]). RECEIVED 10 JUNE; ACCEPTED 25 OCTOBER; PUBLISHED ONLINE 27 NOVEMBER 2011; DOI:10.1038/NMETH.1782
-
Upload
truongcong -
Category
Documents
-
view
217 -
download
2
Transcript of optical recording of action potentials in mammalian...

©20
11 N
atu
re A
mer
ica,
Inc.
All
rig
hts
res
erve
d.
Articles
nAture methods | ADVANCE ONLINE PUBLICATION |
reliable optical detection of single action potentials in mammalian neurons has been one of the longest-standing challenges in neuroscience. here we achieved this goal by using the endogenous fluorescence of a microbial rhodopsin protein, Archaerhodopsin 3 (Arch) from Halorubrum sodomense, expressed in cultured rat hippocampal neurons. this genetically encoded voltage indicator exhibited an approximately tenfold improvement in sensitivity and speed over existing protein-based voltage indicators, with a roughly linear twofold increase in brightness between −50 mV and +50 mV and a sub-millisecond response time. Arch detected single electrically triggered action potentials with an optical signal-to-noise ratio >0. Arch(d95n) lacked endogenous proton pumping and had 50% greater sensitivity than wild type but had a slower response (4 ms). nonetheless, Arch(d95n) also resolved individual action potentials. microbial rhodopsin–based voltage indicators promise to enable optical interrogation of complex neural circuits and electrophysiology in systems for which electrode-based techniques are challenging.
To study the dynamics of a complex neural circuit, one would like to record action potentials from many neurons simultane-ously. Optical imaging promises to realize this goal1–5, and volt-age indicators have been developed based on small molecules6,7, fluorescent proteins8,9 and hybrid protein-dye systems10,11. Single action potentials with high signal-to-noise ratio (SNR) have been recorded recently in individual spines of mammalian neurons in slices using an organic voltage-indicating dye, but this approach required intracellular injection of dye and cumulative illumina-tion of less than 2 s to avoid phototoxicity12. Action potentials in mammalian neurons have been recorded in vivo using a geneti-cally encoded voltage indicator, but this required averaging over multiple trials4. Signals suggestive of single spikes have been reported when the optical signal was aligned with an electro-physiology trace, but the SNR was inadequate for all-optical spike identification. Calcium imaging is widely used as an indirect rea-dout of electrical activity but is only useful when slower readouts (hundreds of milliseconds) are acceptable13. Despite this progress,
optical recording of action potentials in mammalian neurons using a microbial rhodopsinJoel M Kralj1,5, Adam D Douglass2,5, Daniel R Hochbaum3,5, Dougal Maclaurin4 & Adam E Cohen1,4
direct and sensitive optical measurement of membrane potential remains elusive. All approaches have one or more serious limita-tions, including slow response, lack of sensitivity, difficulty in tar-geting or phototoxicity. No genetically encoded voltage indicator has had adequate sensitivity and speed to reliably identify action potentials from mammalian neurons on a single-trial basis.
We recently developed a fast and sensitive voltage indicator based on green-absorbing proteorhodopsin14. This proteorho-dopsin optical proton sensor (PROPS) revealed electrical spiking in Escherichia coli, but efforts to use PROPS in eukaryotic cells failed because the protein did not localize to the plasma mem-brane. Addition of targeting and localization sequences to PROPS did not help. Thus we decided to test other microbial rhodopsins as putative voltage sensors, focusing on proteins known to localize to the eukaryotic plasma membrane. Archaerhodopsin 3 (Arch) from Halorubrum sodomense is a light-driven outward proton pump that captures solar energy for its host15. Recently Arch has been expressed in mammalian neurons, where it enabled optical silencing of neural activity and was minimally perturbative to endogenous function in the dark16. We hypothesized that Arch could be ‘run’ in reverse: that a membrane potential could alter the optical properties of the protein and thereby provide a volt-age sensor that functioned through a mechanism similar to that of PROPS.
We found that Arch resolved individual action potentials in mammalian neurons in vitro, with high SNR and low phototox-icity. Arch enabled mapping of neuronal action potentials with sub-millisecond temporal resolution and subcellular spatial reso-lution. However, the wild-type form of Arch generated a hyper-polarizing photocurrent upon exposure to the imaging laser. The mutation D95N in Arch eliminated this photocurrent but also slowed the response to 41 ms.
resultsPhotophysics of ArchAt neutral pH, bacterially expressed Arch was pink, but at high pH the protein turned yellow (Fig. 1a), with a pKa for the transi-tion of 10.1. Based on homology to other microbial rhodopsins17,
1Department of Chemistry and Chemical Biology, Harvard University, Cambridge, Massachusetts, USA. 2Department of Molecular and Cellular Biology, Harvard University, Cambridge, Massachusetts, USA. 3Applied Physics Program, School of Engineering and Applied Science, Harvard University, Cambridge, Massachusetts, USA. 4Department of Physics, Harvard University, Cambridge, Massachusetts, USA. 5These authors contributed equally to this work. Correspondence should be addressed to A.E.C. ([email protected]).Received 10 June; accepted 25 OctObeR; published Online 27 nOvembeR 2011; dOi:10.1038/nmeth.1782

©20
11 N
atu
re A
mer
ica,
Inc.
All
rig
hts
res
erve
d.
| ADVANCE ONLINE PUBLICATION | nAture methods
Articles
we attributed the pH-induced color change to deprotonation of the Schiff base, which links the retinal chromophore to the protein core. We reasoned that a change in membrane potential might change the local electrochemical potential of the proton at the Schiff base, tipping the acid-base equilibrium and inducing a similar color shift. This mechanism of voltage-induced color shift has been reported previously in dried films of bacteriorho-dopsin18 and formed the hypothesized basis of voltage-sensitivity in PROPS14.
Changes in optical absorption would be challenging to detect in a single cell, owing to the small quantity of protein in the membrane. However, most microbial rhodopsins are weakly fluorescent19, so we characterized Arch as a prospective fluorescent indicator (Table 1). At neutral pH, Arch emitted far-red fluorescence (emis-sion wavelength, λem, was 687 nm), whereas at high pH Arch was not fluorescent (Fig. 1b and Supplementary Fig. 1). The fluores-cence quantum yield of Arch was low (9 × 10⁻⁴) but the photo-stability was comparable to that of members of the GFP family20. We found that laser illumination and electron-multiplying charge-coupled device (EMCCD) detection were necessary for observing Arch fluorescence. A comparison of photobleaching rates of Arch (excited at 640 nm) with those of enhanced (e)GFP (excited at 488 nm), in a 1:1 Arch-eGFP fusion, showed that the mean numbers of photons emitted per molecule before photobleach-ing were ~1:3.9 (Arch:eGFP). The broad absorption peak enabled excitation of Arch at λ = 640 nm, a wavelength where few other cellular components absorb, and the far red emission occurred in a spectral region of little background autofluorescence.
We imaged fluorescence of Arch in HEK 293 cells supplemented with 5 µM all-trans retinal in an inverted fluorescence microscope
with red illumination (λ = 640 nm, 20 mW, intensity (I) = 540 W cm−2), a high-numerical-aperture objective, a Cy5 filter set and an EMCCD camera (Online Methods and Supplementary Fig. 2). The cells exhibited fluorescence predominantly localized to the plasma membrane. Cells not expressing Arch were not fluores-cent. Cells showed 17% photobleaching over a continuous 10-min exposure and retained normal morphology during this interval.
The fluorescence of HEK 293 cells expressing Arch was highly sensitive to membrane potential, as determined via whole-cell voltage clamp (Supplementary Video 1). Fluorescence of Arch in the plasma membrane increased by a factor of two between −150 mV and +150 mV, with a nearly linear response through-out this range (Fig. 1c). The response of fluorescence to a step in membrane potential occurred within the 500 µs time resolution of our imaging system on both the rising and falling edge (Fig. 1d). Application of a sinusoidally varying membrane potential led to sinusoidally varying fluorescence; at a frequency (f) of 1 kHz, the fluorescence oscillations retained 55% of their low-frequency amplitude (Supplementary Fig. 3). Arch retained its endogenous proton-pumping capability, and illumination with the imaging laser generated outward photocurrents of 10–20 pA.
Fluorescent voltage indicators are often characterized by the fractional change in fluorescence, ∆F/F, per 100 mV of membrane potential. This metric suffers from subjectivity in the choice of which pixels are chosen to represent ‘signal’ and which are chosen for ‘background’. The quantity ∆F/F also does not indicate temporal stability of the signal, nor information about the SNR (except in the rarely achieved case of shot noise–limited detection). Thus we sought an objective measure of the precision with which small changes in membrane voltage (Vm) could be detected.
pH 7.3
a
c d e
bpH 11.1
1.0 pH 7.3pH 11.1
0.8
Absorption Emission
0.6
Sig
nal
Flu
ores
cenc
e (a
.u.)
Flu
ores
cenc
e (a
.u.)
Flu
ores
cenc
e (a
.u.)
0.4
0.2
0500
–150 –50 50Voltage (mV)
150 0 0.2
–70 mV
+30 mV
1.2
1.1
1.0
–5 0 5 10Time (ms)
0.4 0.6Time (s)
0.8 1.0
2.01.2
1.1
1.0
1.8
1.6
1.4
1.2
1.0
550 600Wavelength (nm)
700 750650
Positive Vm
Vm
– + –+
Negative Vm
Vm
Figure | Arch is a fluorescent voltage indicator. (a) Model of Arch as a voltage sensor, in which pH and membrane potential can both alter the protonation of the Schiff base. The cuvettes contain intact E. coli expressing Arch. (b) Absorption and fluorescence emission spectra of Arch at neutral and high pH. (c) Fluorescence of Arch (divided by the value at −150 mV) as a function of membrane potential (recorded over six consecutive sweeps). (d) Dynamic response of Arch to steps in membrane potential between −70 mV and +30 mV. The overshoots on the rising and falling edges were an artifact of electronic compensation circuitry. The smaller amplitude compared to c is because background subtraction was not performed in d. Data were averaged over 20 cycles. Inset, step response occurred in less than the 500 µs resolution of the imaging system. (e) Fluorescence micrograph of an HEK 293 cell expressing Arch (top) and pixel-weight matrix showing regions of voltage-dependent fluorescence (bottom). a.u., arbitrary units. Scale bar, 10 µm.
table 1 | Optical and electrical response of Arch and Arch(D95N)λmax absorbance
(nm)λmax emission
(nm)aε633
(M−1 cm−1)b QYcPhotostability
relative to eGFPdpKa of Schiff
basee τresponse (ms)fNoise in VFL (µV Hz−0.5)g Photo-current
Arch 558 687 6,300 9 × 10⁻⁴ 0.25 10.1 <0.5 625 YesArch(D95N) 585 687 37,500 4 × 10⁻⁴ 0.1 8.9 41 260 NoaExcitation at λ=532 nm. bAbsorption spectra calibrated assuming the same peak extinction coefficient as bacteriorhodopsin, 63,000 M−1 cm−1 (ref. 30 and Online Methods). cQuantum yield (QY) determined via comparison to Alexa Fluor 647 with excitation at λ = 633 nm. dMeasured in a 1:1 fusion with eGFP. eDetermined via singular value decomposition on absorption spectra. fDetermined from step response. Arch(D95N) has a minor component of its response (20%) that is fast (<500 µs). gVFLis the membrane potential estimated from fluorescence. Noise determined at frequencies f ≥ 0.1 Hz in HEK 293 cells.
©20
11 N
atu
re A
mer
ica,
Inc.
All
rig
hts
res
erve
d.
nAture methods | ADVANCE ONLINE PUBLICATION | 3
Articles
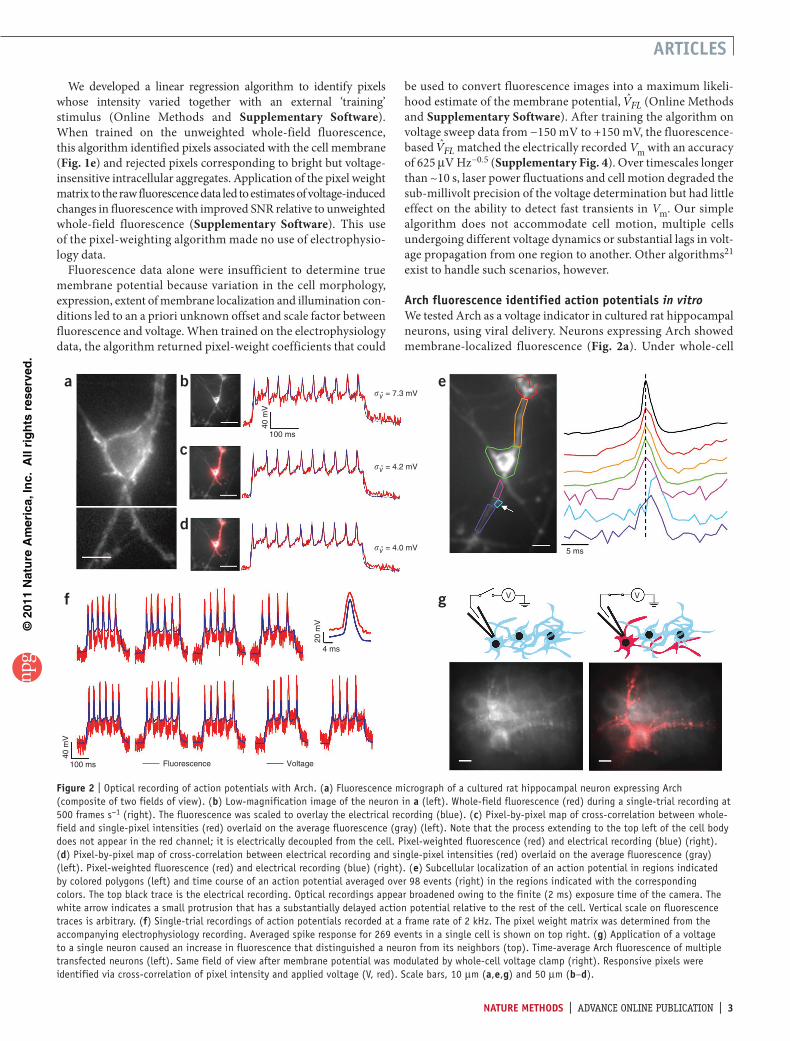
We developed a linear regression algorithm to identify pixels whose intensity varied together with an external ‘training’ stimulus (Online Methods and Supplementary Software). When trained on the unweighted whole-field fluorescence, this algorithm identified pixels associated with the cell membrane (Fig. 1e) and rejected pixels corresponding to bright but voltage- insensitive intracellular aggregates. Application of the pixel weight matrix to the raw fluorescence data led to estimates of voltage-induced changes in fluorescence with improved SNR relative to unweighted whole-field fluorescence (Supplementary Software). This use of the pixel-weighting algorithm made no use of electrophysio-logy data.
Fluorescence data alone were insufficient to determine true membrane potential because variation in the cell morphology, expression, extent of membrane localization and illumination con-ditions led to an a priori unknown offset and scale factor between fluorescence and voltage. When trained on the electrophysiology data, the algorithm returned pixel-weight coefficients that could
be used to convert fluorescence images into a maximum likeli-hood estimate of the membrane potential, VFL (Online Methods and Supplementary Software). After training the algorithm on voltage sweep data from −150 mV to +150 mV, the fluorescence-based VFL matched the electrically recorded Vm with an accuracy of 625 µV Hz−0.5 (Supplementary Fig. 4). Over timescales longer than ~10 s, laser power fluctuations and cell motion degraded the sub-millivolt precision of the voltage determination but had little effect on the ability to detect fast transients in Vm. Our simple algorithm does not accommodate cell motion, multiple cells undergoing different voltage dynamics or substantial lags in volt-age propagation from one region to another. Other algorithms21 exist to handle such scenarios, however.
Arch fluorescence identified action potentials in vitroWe tested Arch as a voltage indicator in cultured rat hippocampal neurons, using viral delivery. Neurons expressing Arch showed membrane-localized fluorescence (Fig. 2a). Under whole-cell
a b e
g
c
d
f
100 ms
4 ms
20 m
V
40 m
V
100 ms Fluorescence Voltage
40 m
V
V = 7.3 mV
V = 4.2 mV
V = 4.0 mV 5 ms
V V
Figure | Optical recording of action potentials with Arch. (a) Fluorescence micrograph of a cultured rat hippocampal neuron expressing Arch (composite of two fields of view). (b) Low-magnification image of the neuron in a (left). Whole-field fluorescence (red) during a single-trial recording at 500 frames s−1 (right). The fluorescence was scaled to overlay the electrical recording (blue). (c) Pixel-by-pixel map of cross-correlation between whole-field and single-pixel intensities (red) overlaid on the average fluorescence (gray) (left). Note that the process extending to the top left of the cell body does not appear in the red channel; it is electrically decoupled from the cell. Pixel-weighted fluorescence (red) and electrical recording (blue) (right). (d) Pixel-by-pixel map of cross-correlation between electrical recording and single-pixel intensities (red) overlaid on the average fluorescence (gray) (left). Pixel-weighted fluorescence (red) and electrical recording (blue) (right). (e) Subcellular localization of an action potential in regions indicated by colored polygons (left) and time course of an action potential averaged over 98 events (right) in the regions indicated with the corresponding colors. The top black trace is the electrical recording. Optical recordings appear broadened owing to the finite (2 ms) exposure time of the camera. The white arrow indicates a small protrusion that has a substantially delayed action potential relative to the rest of the cell. Vertical scale on fluorescence traces is arbitrary. (f) Single-trial recordings of action potentials recorded at a frame rate of 2 kHz. The pixel weight matrix was determined from the accompanying electrophysiology recording. Averaged spike response for 269 events in a single cell is shown on top right. (g) Application of a voltage to a single neuron caused an increase in fluorescence that distinguished a neuron from its neighbors (top). Time-average Arch fluorescence of multiple transfected neurons (left). Same field of view after membrane potential was modulated by whole-cell voltage clamp (right). Responsive pixels were identified via cross-correlation of pixel intensity and applied voltage (V, red). Scale bars, 10 µm (a,e,g) and 50 µm (b–d).

©20
11 N
atu
re A
mer
ica,
Inc.
All
rig
hts
res
erve
d.
4 | ADVANCE ONLINE PUBLICATION | nAture methods
Articles
current clamp, cells exhibited spiking upon injection of current pulses of 200 pA. Individual spikes were accompanied by clearly identifiable increases of whole-field fluorescence (Fig. 2b and Supplementary Video 2). After scaling of the fluorescence trace to overlay on the voltage, the root-mean-square (r.m.s.) deviation between the two was sV = 7.2 mV. Training the pixel-weighting algorithm on the whole-field fluorescence led to a 74% improve-ment in SNR, with an r.m.s. deviation between the predicted and measured voltage (after scaling and offset adjustment) of sV = 4.2 mV (Fig. 2c). This training procedure made no use of the electrical recording. Training the pixel-weighting algorithm on the electrical recording led to an additional 5% increase in SNR, to sV = 4.0 mV, and did not require adjustment of scaling and offset (Fig. 2d).
We imaged the dynamics of action potentials with subcellu-lar resolution (Supplementary Fig. 5). To improve the SNR we averaged multiple temporally registered movies of single spikes (Fig. 2e and Supplementary Video 3). Action potentials appeared to occur nearly simultaneously throughout most regions of the cell, as expected given the field of view (100 µm) and exposure time (2 ms). However, in localized regions the action potential lagged by 2–3 ms. The pixel-weighting algorithm did not detect the cellular regions with delayed action potentials, but the lag was readily seen in Supplementary Video 3. These results suggest that Arch may be used to map intracellular dynamics of action potentials in genetically specified neurons, in a manner similar to a recent demonstration with voltage-sensitive dyes12.
We created single-trial optical and electrical recordings (Fig. 2f). At a 2-kHz frame rate, the SNR in the fluorescence (spike ampli-tude:baseline noise) was 10.5. A spike-finding algorithm correctly identified 99.6% of the spikes (based on comparison to simulta-neously recorded membrane potential), with a false positive rate of 0.7% (n = 269 spikes; Online Methods). The average action potential waveform determined by fluorescence coincided with the waveform recorded electrically. We observed single cells for up to 4 min of cumulative exposure, with no detectable change in resting potential or spike frequency.
We developed a procedure to electrically tag a single cell in an otherwise overgrown field of neurons, similar to that in refer-ence 22. The average fluorescence of the population of cells, all
expressing Arch, did not show clearly resolved cellular structures (Fig. 2g). We formed a whole-cell patch on one cell, which we then subjected to a voltage clamp triangle wave of amplitude 150 mV, under video observation. The weight matrix, indicating which pixels contained information about the applied voltage, yielded a clear image of the target cell and its processes. Electrical tagging provides a complement to genetic23 and chemical24 methods that are currently used to label single neurons.
In the absence of added retinal, neurons expressing Arch showed clearly identifiable fluorescence flashes accompanying indi-vidual spikes (Supplementary Fig. 6a), indicating that neurons contained sufficient endogenous retinal to populate some of the protein. Addition of supplemental retinal led to a 30–60% increase in fluorescence over 30 min (Supplementary Fig. 6b). Experiments with Arch and other microbial rhodopsins in vivo have shown that endogenous retinal is sufficient for optogenetic control of neural activity25. Thus, Arch may function as a voltage indicator in vivo without exogenous retinal.
Arch(d95n) is a nonpumping voltage indicatorIllumination at 640 nm was far from the peak of the Arch absorp-tion spectrum (λ = 558 nm), but the imaging laser nonetheless induced photocurrents of 10–20 pA in HEK 293 cells express-ing Arch (Fig. 3a). We sought to develop a mutant which did not perturb the membrane potential, yet which maintained
c 1.6
1.4
1.4
1.2
1.2
1.0
1.0
0
0
–70 mV
+30 mV
0.2
20 40 60
0.4 0.6 0.8Time (s)
Time (ms)
1.0
Flu
ores
cenc
e (a
.u.)
Flu
ores
cenc
e (a
.u.)
a10
pA
10 2 3Time (s)
4 5
WT
D95N
Laser
b 3.0
Flu
ores
cenc
e (a
.u.)
2.5
2.0
1.5
1.0
–150 –50 50Voltage (mV)
150
d
0
0 5 10
20
40
Vol
tage
(m
V)
60
Time (s)
FluorescenceVoltage
Figure 3 | Arch(D95N) shows voltage-dependent fluorescence but no photocurrent. (a) Photocurrents in Arch and Arch(D95N), expressed in HEK 293 cells clamped at V = 0. Cells were illuminated with pulses of light (λ = 640 nm; I = 1,800 W cm−2). (b) Fluorescence of Arch(D95N) as a function of membrane potential. Inset, map of voltage sensitivity. Scale bar, 5 µm. (c) Dynamic response of Arch(D95N) to steps in membrane potential between −70 mV and +30 mV. Data were averaged over 20 cycles. Inset, step response comprised a component faster than 500 µs (20% of the response) and a component with a time constant of 41 ms. (d) Response of Arch(D95N) to 10-mV steps in membrane potential.
a b
d
40
Vol
tage
(m
V)
–40
–800 0.5
Time (s) Time (s)1.0 1.5 2.0 0
Vol
tage
0.4 0.8
Arch(D95N)Arch
1.2
0
Flu
ores
cenc
e
c
100 ms40 m
V
200 pA
Figure 4 | Optical recording of action potentials with Arch(D95N). (a,b) Electrically recorded membrane potential of a neuron expressing Arch (a) or Arch(D95N) (b), subjected to pulses of current injection and laser (red bars) illumination. (c) Fluorescence micrograph of a neuron expressing Arch(D95N), showing Arch(D95N) fluorescence (gray) and regions of voltage-dependent fluorescence (red). Scale bar, 10 µm. (d) Single-trial recording of whole-cell membrane potential (blue) and weighted Arch(D95N) fluorescence (red) during a train of action potentials.

©20
11 N
atu
re A
mer
ica,
Inc.
All
rig
hts
res
erve
d.
nAture methods | ADVANCE ONLINE PUBLICATION | 5
Articles
voltage sensitivity. The mutation D85N in bacteriorhodopsin eliminated proton pumping26, so we introduced the homologous mutation, D95N, into Arch. This mutation eliminated the photocurrent (Fig. 3a) and shifted several other photophysical properties of importance to voltage sensing (Table 1, Fig. 3 and Supplementary Fig. 7). Arch(D95N) was more sensitive to volt-age than Arch and displayed a threefold increase in fluorescence between −150 mV and +150 mV, with nearly linear sensitivity from −120 to +120 mV, but had a slower response (Fig. 3b–d and Supplementary Videos 4–5). After calibration with a voltage ramp, Arch(D95N) resolved voltage steps of 10 mV, with a noise in the voltage estimated from fluorescence of 260 µV Hz−0.5 over timescales < 12 s.
Under illumination conditions typically used for imaging neu-ral activity (I = 1,800 W cm−2 and λ = 640 nm), the light-induced outward photocurrent was typically 10 pA in neurons expressing Arch. Under current-clamp conditions this photocurrent shifted the resting potential of the neurons by up to −20 mV. For neurons near their activation threshold, this photocurrent could suppress firing (Fig. 4a), so we explored the nonpumping Arch(D95N) var-iant as a voltage indicator in neurons. Illumination of Arch(D95N) did not perturb membrane potential in neurons (Fig. 4b).
Arch(D95N) reported neuronal action potentials on a single-trial basis (Fig. 4c). The response to a depolarizing current pulse was dominated by the slow component of the step response, yet the fast component of the response was sufficient to indicate action potentials. Efforts are underway to identify a nonpump-ing mutant with speed comparable to that of Arch.
discussionWe compared Arch and Arch(D95N) to other fluorescent voltage indicators, plotted according to sensitivity and response speed (Fig. 5; data and references are in Supplementary Table 1). Data for existing indicators are approximate, and we obtained them from literature. The most sensitive fluorescent proteins, the VSFP 2.x family, have changes in fluorescence of ~10% per 100 mV of voltage, with a response time of approximately 100 ms. The sodium channel protein–based activity reporting construct (SPARC) family of voltage sensors has a 1 ms response time and shows a fluorescence change of <1% per 100 mV. Microbial rhodopsin–based indicators are notably more sensitive than other probes. The most sensitive microbial rhodopsin–based indicator is PROPS, but PROPS only functions in prokaryotes14. Fluorescent voltage-sensitive dyes have enabled optical record-ing of action potentials in brain slices with SNR exceeding that of Arch12,27, though phototoxicity and challenges with delivery prevent widespread use.
Arch is one of ~5,000 known microbial rhodopsins28. We sug-gest that this family of proteins should be explored for its ability to label biological membranes with a color-tunable, photostable and environmentally-sensitive chromophore, with no homology to GFP. The fluorescence and voltage-sensing properties of micro-bial rhodopsins are orthogonal to their native biological function, suggesting that these properties can be improved through minor changes to the protein sequence. Screens of wild-type and mutated microbial rhodopsins will be essential for identifying variants that are fast, like Arch, but that lack pumping, like Arch(D95N). Efforts to increase the brightness or to find other nonfluores-cent imaging modalities are also of paramount importance.
Initial efforts to observe two-photon fluorescence from Arch were not successful; but the excitation of Arch is red-shifted relative to most two-photon fluorophores, so additional studies with spec-trally tuned two-photon excitation are warranted. Simultaneous imaging of fluorescence from Arch and eGFP in a fusion protein may enable ratiometric voltage measurements, with improved robustness to variations in expression or to movement, relative to single-band measurements. Care will be needed to avoid arti-facts from environmental and statistical noise in the reference channel as well as from differential photobleaching. Fusions with other fluorescent indicator proteins may enable simultaneous mea-surements of voltage and pH or Ca2+ concentration. We expect the combination of optogenetic voltage measurement with the recently established techniques of optogenetic voltage control29 to enable progress toward all-optical electrophysiology.
methodsMethods and any associated references are available in the online version of the paper at http://www.nature.com/naturemethods/.
Note: Supplementary information is available on the Nature Methods website.
AcknowledgmentsWe thank F. Engert (Harvard University) for generously providing support to A.D.D., providing laboratory space during the early stages of this work, and for facilitating this collaboration, E. Boyden (Massachusetts Institute of Technology), K. Rothschild (Boston University) and A. Ting (Massachusetts Institute of Technology) for discussions and contributions of equipment and reagents, and G. Lau, B. Lilley and H. Inada for technical assistance. This work was supported by the Harvard Center for Brain Science, US National Institutes of Health grants 1-R01-EB012498-01 and New Innovator grant 1-DP2-OD007428, the Harvard–Massachusetts Institute of Technology Joint Research Grants Program in Basic Neuroscience, an Intelligence Community postdoctoral fellowship (J.M.K.), a National Science Foundation Graduate Fellowship (D.R.H.), a Helen Hay Whitney Postdoctoral Fellowship (A.D.D.) and Charles A. King Trust Postdoctoral Fellowship (A.D.D.).
Author contriButionsA.E.C. conceived the project. J.M.K., A.D.D. and D.R.H. carried out experiments. D.M. designed and built the imaging system used in Figure . All authors designed experiments, analyzed data and wrote the paper.
1,000
∆F/F
per
100
mV
(%
) 100
10
VSFP 2.x,Mermaid
FlaSh
Arch (D95N)
PROPS
Arch
Organicdyes
VSFP 3.1
FLARE SPARC
1
0.110 100 1,000
Response speed (s–1)10,000
Figure 5 | Optical indicators of membrane potential classified by speed and sensitivity. Green marks represent indicators based on fusions of GFP homologs to membrane proteins. Pink marks represent indicators based on microbial rhodopsins. Blue diamonds represent organic dyes and hybrid dye-protein indicators. Extended bars denote indicators where two time constants have been reported. PROPS is homologous to Arch(D95N) but only functions in bacteria. The speeds of most organic dyes are not known precisely; but they respond in less than 500 µs.
©20
11 N
atu
re A
mer
ica,
Inc.
All
rig
hts
res
erve
d.
| ADVANCE ONLINE PUBLICATION | nAture methods
Articles
comPeting FinAnciAl interestsThe authors declare competing financial interests: details accompany the full-text HTML version of the paper at http://www.nature.com/naturemethods/.
Published online at http://www.nature.com/naturemethods/. reprints and permissions information is available online at http://www.nature.com/reprints/index.html.
1. Cohen, L.B., Keynes, R.D. & Hille, B. Light scattering and birefringence changes during nerve activity. Nature 8, 438–441 (1968).
2. Tasaki, I., Watanabe, A., Sandlin, R. & Carnay, L. Changes in fluorescence, turbidity, and birefringence associated with nerve excitation. Proc. Natl. Acad. Sci. USA , 883–888 (1968).
3. Peterka, D.S., Takahashi, H. & Yuste, R. Imaging voltage in neurons. Neuron 9, 9–21 (2011).
4. Akemann, W., Mutoh, H., Perron, A., Rossier, J. & Knopfel, T. Imaging brain electric signals with genetically targeted voltage-sensitive fluorescent proteins. Nat. Methods 7, 643–649 (2010).
5. Scanziani, M. & Hausser, M. Electrophysiology in the age of light. Nature 4, 930–939 (2009).
6. Homma, R. et al. Wide-field and two-photon imaging of brain activity with voltage-and calcium-sensitive dyes. Philos. Trans. R. Soc. Lond. B Biol. Sci. 34, 2453–2467 (2009).
7. Jiang, J. & Yuste, R. Second-harmonic generation imaging of membrane potential with photon counting. Microsc. Microanal. 4, 526–531 (2008).
8. Tsutsui, H., Karasawa, S., Okamura, Y. & Miyawaki, A. Improving membrane voltage measurements using FRET with new fluorescent proteins. Nat. Methods 5, 683–685 (2008).
9. Siegel, M.S. & Isacoff, E.Y. A genetically encoded optical probe of membrane voltage. Neuron 9, 735–741 (1997).
10. Sjulson, L. & Miesenbock, G. Rational optimization and imaging in vivo of a genetically encoded optical voltage reporter. J. Neurosci. 8, 5582–5593 (2008).
11. Bradley, J., Luo, R., Otis, T.S. & DiGregorio, D.A. Submillisecond optical reporting of membrane potential in situ using a neuronal tracer dye. J. Neurosci. 9, 9197–9209 (2009).
12. Popovic, M.A., Foust, A.J., McCormick, D.A. & Zecevic, D. The spatio-temporal characteristics of action potential initiation in layer 5 pyramidal neurons: a voltage imaging study. J. Physiol. (Lond.) 589, 4167–4187 (2011).
13. Tian, L. et al. Imaging neural activity in worms, flies and mice with improved GCaMP calcium indicators. Nat. Methods , 875–881 (2009).
14. Kralj, J.M., Hochbaum, D.R., Douglass, A.D. & Cohen, A.E. Electrical spiking in Escherichia coli probed with a fluorescent voltage indicating protein. Science 333, 345–348 (2011).
15. Ihara, K. et al. Evolution of the archaeal rhodopsins: evolution rate changes by gene duplication and functional differentiation. J. Mol. Biol. 85, 163–174 (1999).
16. Chow, B.Y. et al. High-performance genetically targetable optical neural silencing by light-driven proton pumps. Nature 43, 98–102 (2010).
17. Lanyi, J.K. Bacteriorhodopsin. Annu. Rev. Physiol. , 665–688 (2004).18. Kolodner, P., Lukashev, E.P., Ching, Y. & Rousseau, D.L. Electric-field-
induced Schiff-base deprotonation in D85N mutant bacteriorhodopsin. Proc. Natl. Acad. Sci. USA 93, 11618–11621 (1996).
19. Lenz, M.O. et al. First steps of retinal photoisomerization in proteorhodopsin. Biophys. J. 9, 255–262 (2006).
20. Shaner, N.C., Steinbach, P.A. & Tsien, R.Y. A guide to choosing fluorescent proteins. Nat. Methods , 905–909 (2005).
21. Mukamel, E.A., Nimmerjahn, A. & Schnitzer, M.J. Automated analysis of cellular signals from large-scale calcium imaging data. Neuron 3, 747–760 (2009).
22. Borst, A., Heck, D. & Thomann, M. Voltage signals of individual Purkinje cell dendrites in rat cerebellar slices. Neurosci. Lett. 38, 29–32 (1997).
23. Livet, J. et al. Transgenic strategies for combinatorial expression of fluorescent proteins in the nervous system. Nature 450, 56–62 (2007).
24. Novikova, L., Novikov, L. & Kellerth, J.O. Persistent neuronal labeling by retrograde fluorescent tracers: a comparison between Fast Blue, Fluoro-Gold and various dextran conjugates. J. Neurosci. Methods 74, 9–15 (1997).
25. Boyden, E.S., Zhang, F., Bamberg, E., Nagel, G. & Deisseroth, K. Millisecond-timescale, genetically targeted optical control of neural activity. Nat. Neurosci. 8, 1263–1268 (2005).
26. Tittor, J., Schweiger, U., Oesterhelt, D. & Bamberg, E. Inversion of proton translocation in bacteriorhodopsin mutants D85N, D85T, and D85, 96N. Biophys. J. 7, 1682–1690 (1994).
27. Obaid, A.L. & Salzberg, B.M. Optical recording of electrical activity in guinea-pig enteric networks using voltage-sensitive dyes. J. Vis. Exp. 34, 1631 (2009).
28. Venter, J.C. et al. Environmental genome shotgun sequencing of the Sargasso Sea. Science 304, 66–74 (2004).
29. Fenno, L., Yizhar, O. & Deisseroth, K. The development and application of optogenetics. Annu. Rev. Neurosci. 34, 389–412 (2011).
30. Rehorek, M. & Heyn, M.P. Binding of all-trans-retinal to the purple membrane. Evidence for cooperativity and determination of the extinction coefficient. Biochemistry 8, 4977–4983 (1979).

©20
11 N
atu
re A
mer
ica,
Inc.
All
rig
hts
res
erve
d.
doi:10.1038/nmeth.1782 nAture methods
online methodsProtein constructs and membrane fractionation. All experi-ments were performed with an Arch-eGFP fusion. A lentiviral backbone plasmid encoding Arch-eGFP (FCK-Arch-EGFP; BAA09452; Addgene plasmid 22217) was used to clone the Arch gene into the pet28b vector using the restriction sites EcoRI and NcoI. The sequence encoding the D95N mutation was cre-ated separately in the pet28b and FCK backbones, using the QuikChangeII kit (Agilent) and the same DNA primers for both backbones (Supplementary Table 2).
Arch and its D95N mutant were expressed in E. coli, as previously described31. Briefly, E. coli (strain BL21, pet28b plasmid) was grown in 1 l of LB with 100 µg ml−1 kanamycin, to an optical density at 600 nm of 0.4 at 37 °C. All-trans retinal (5 µM) and inducer (iso-propyl b-d-1-thiogalactopyranoside (IPTG), 0.5 mM) were added, and cells were grown for an additional 3.5 h in the dark. Cells were collected by centrifugation and resuspended in 50 mM Tris with 2 mM MgCl2 at pH 7.3 and lysed with a tip sonicator for 5 min. The lysate was centrifuged and the pellet was resuspended in PBS (pH 7.2) supplemented with 1.5% dodecyl maltoside. The mixture was homogenized with a glass and teflon Potter Elvehjem homog-enizer and centrifuged again. The solubilized protein in the super-natant was used for experiments.
Spectroscopic characterization of Arch and Arch(D95N). The absorption spectra of fractionated E. coli membranes contain-ing Arch and Arch(D95N) were determined using an Ocean Optics USB4000 spectrometer with a DT-MINI-2-GS light source (Supplementary Fig. 1). The peak extinction coeffi-cients of microbial rhodopsins vary across rhodopsin types from 48,000 M−1 cm−1 to 63,000 M−1 cm−1 (refs. 30,32–34). Owing to the high homology between Arch and bacteriorhodopsin, we used the bacteriorhodopsin extinction coefficient, 63,000 M−1 cm−1, for Arch. The differing wavelengths of maximum absorption of Arch (558 nm) and Arch(D95N) (585 nm) led to different extinc-tion coefficients at 633 nm (Table 1). For Arch, 633 nm was in the tail of the absorption, whereas for Arch(D95N) 633 nm lay half way down the shoulder. The relative extinction coefficients of Arch and Arch(D95N) at 633 nm are independent of our choice to use bacteriorhodopsin as the reference for the peak extinction coefficient. Absorption spectra for Arch and Arch(D95N) were measured as a function of pH between pH 6 and 11.
The fluorescence emission spectra of Arch and Arch(D95N) were determined in bulk samples using illumination with a 100 mW, 532 nm laser (Dragon Lasers, 532GLM100) or a 25 mW, 633 nm HeNe laser (Spectra-Physics) (Supplementary Fig. 1). Scattered laser light was blocked with a 532 nm Raman notch filter (Omega Optical, XR03) or a 710/100 emission filter (Chroma), and fluores-cence was collected perpendicular to the illumination with a 1,000 µm fiber, connected to an Ocean Optics QE65000 spectro-meter. Spectra were integrated for 2 s. Arch and Arch(D95N) both had emission maxima at 687 nm. We do not know why the two proteins have such different peak absorption wavelengths but the same peak emission wavelength.
The fluorescence quantum yields of Arch and Arch(D95N) were determined by comparing the integrated emission intensity to emis-sion of a sample of the dye Alexa Fluor 647 (Invitrogen). Briefly, the concentrations of micromolar solutions of dye and protein were determined using a visible absorption spectrum. We used the
extinction coefficients of 270,000 M−1 cm−1 for Alexa Fluor 647 and 63,000 M−1 cm−1 for Arch and Arch(D95N), assuming that these microbial rhodopsins have the same peak extinction coefficient as bacteriorhodopsin. The dye solution was then diluted 1:1,000 to yield a solution with comparable fluorescence emission to that of Arch. The fluorescence emission spectra of dye and protein samples were measured with 633-nm excitation. The quantum yield (QY) was then determined by the formula
QY QYArchArch
Arch Arch= × × ×FlFl
ccAlexa
Alexa AlexaAlexa
ee
where Fl is the integrated fluorescence from 660 nm to 760 nm, ε is the extinction coefficient at 633 nm, c is the concentration, and Alexa stands for Alexa Fluor 647.
Relative photostability of Arch and eGFP. To directly compare photostability of Arch and eGFP, we studied the photobleaching of the Arch-eGFP fusion. This strategy guaranteed a 1:1 stoichio-metry of the two fluorophores, simplifying the analysis. The exper-iments were performed on permeabilized cells, in the microscope, with video recording as the cells photobleached. We first recorded a movie of photobleaching of Arch under 640-nm illumination; then on the same field of view we recorded photobleaching of eGFP under 488-nm illumination, with illumination intensity adjusted to yield approximately the same initial count rate as for Arch. Fluorescence background levels were obtained from nearby protein-free regions of each movie and were subtracted from the intensity of the protein-containing regions. The area under each photobleaching time trace was calculated, yielding an estimate of the total number of detected photons from each fluorophore. The eGFP emission (λmax = 509 nm) and the Arch emission (λmax = 687 nm) were collected through different emission filters, so the raw counts were corrected for the transmission spectra of the filters and the wavelength-dependent quantum yield of the EMCCD camera. The result was that the relative number of photons emitted before photobleaching for eGFP:Arch was 3.9:1, and for eGFP:Arch(D95N) this ratio was 10:1.
HEK 293 cell culture. HEK 293 (HEK) cells were grown at 37 °C, 5% CO2, in Dulbecco’s modified Eagle medium (DMEM) supple-mented with 10% FBS and penicillin-streptomycin. Plasmids were transfected using Lipofectamine and PLUS reagent (Invitrogen) following the manufacturer’s instructions, and assayed 48–72 h later. The day before recording, cells were replated onto glass- bottom dishes (MatTek) at a density of ~5,000 cells cm−2.
The concentration of endogenous retinal in the HEK cells was not known, so the cells were supplemented with retinal by dilut-ing stock retinal solutions (40 mM, DMSO) in growth medium to a final concentration of 5 µM and then placing the cells back in the incubator for 1–3 h. All imaging and electrophysiology were performed in Tyrode buffer (containing 125 mM NaCl, 2 mM KCl, 3 mM CaCl2, 1 mM MgCl2, 10 mM HEPES, 30 mM glucose (pH 7.3) and adjusted to 305–310 mOsm with sucrose). Only HEK cells having reversal potentials between −10 mV and −40 mV were included in the analysis.
Microscopy. Simultaneous fluorescence and whole-cell patch-clamp recordings were acquired on a home-built, inverted

©20
11 N
atu
re A
mer
ica,
Inc.
All
rig
hts
res
erve
d.
doi:10.1038/nmeth.1782nAture methods
epifluorescence microscope, operated at room temperature (24 °C). Here we summarize the design considerations; a detailed specifi-cation is given in Supplementary Figure 2. A key challenge was to collect fluorescence with high efficiency while also achiev-ing a large enough field of view to image an entire neuron and its processes. Typically, microscope objectives offer a trade-off between magnification and light-gathering capacity (numerical aperture), which we sought to avoid. Additionally, we wanted the ability to change magnification while maintaining a patch on a single cell. The vibrations associated with switching objectives, particularly water- or oil-immersion objectives, are incompatible with simultaneous patch clamp. Finally, we wanted the capability to split the field of view into two wavelength bands and to change magnification without changing the registration of the two halves of the image.
To achieve these goals simultaneously, we designed our micro-scope around a 60× numerical aperture (NA) 1.45 oil-immersion objective (Olympus 1-U2B616), with variable zoom camera lenses to change illumination area and magnification. The magnification was continuously variable between 10× and 66×, without touching the objective. The microscope readily converted between single-band and dual-band imaging, with only minor realignment.
On an upright electrophysiology setup retrofitted with a laser and EMCCD camera, a dipping objective (Olympus LUMPlanFl 40× W/IR; NA 0.8) collected enough light to record voltage-dependent fluorescence of HEK cells. However, recording of action potentials with high SNR required a high-NA objective (for example, Olympus 1-U2B893 60× water, NA 1.2 or 1-U2B616 60× oil, NA 1.45).
Electrophysiology. Filamented glass micropipettes (WPI) were pulled to a tip resistance of 3–10 MΩ, fire-polished and filled with internal solution (containing 125 mM potassium gluconate, 8 mM NaCl, 0.6 mM MgCl2, 0.1 mM CaCl2, 1 mM EGTA, 10 mM HEPES, 4 mM Mg-ATP, 0.4 mM Na-GTP (pH 7.3); adjusted to 295 mOsm with sucrose). The micropipettes were positioned with a Burleigh PCS 5000 micromanipulator. Whole-cell, voltage-clamp recordings were acquired using an AxoPatch 200B ampli-fier (Molecular Devices), filtered at 2 kHz with the internal Bessel filter and digitized with a National Instruments PCIE-6323 acqui-sition board at 10 kHz. Ambient 60 Hz noise was removed using a HumBug Noise Eliminator (AutoMate Scientific). For experi-ments requiring rapid modulation of transmembrane potential, series resistance and whole-cell capacitance were predicted to 95% and corrected to ~50%. Electrical stimuli were generated using the PCIE-6323 acquisition board and sent to the AxoPatch, which then applied these signals in either constant-current or constant-voltage mode.
Measurements of photocurrents were performed on HEK cells held in voltage clamp at 0 mV while being exposed to brief (200 ms) pulses of illumination at 640 nm at an intensity of 1,800 W cm−2.
All experiments were performed at 24 °C.
Ramp and step response of Arch and Arch(D95N). To meas-ure fluorescence as a function of membrane potential, a triangle wave was applied, with amplitude from −150 mV to +150 mV and period 12 s, with video recording at 100 ms per frame. A pixel weight matrix was calculated according to equation (2)
(see below) and applied to the movie images to generate a fluo-rescence number for each frame. These fluorescence values were divided by their minimum value (at V = −150 mV). The result is plotted as a function of V in Figures 2 and 3. This procedure preferentially weighted data from pixels at the cell membrane but did not entail any background subtraction. Comparable results were obtained by manually selecting pixels corresponding to a region of plasma membrane and plotting their intensity as a func-tion of V, without background subtraction. Background subtrac-tion from the raw fluorescence would have yielded considerably larger values of ∆F/F.
The step response was measured in a similar manner, except that test waveforms consisted of a series of voltage pulses, from −70 mV to +30 mV with duration 300 ms and period 1 s. Cells were subjected to 20 repetitions of the waveform, and the fluo-rescence response was averaged over all iterations.
Frequency-dependent response functions of Arch and Arch(D95N). Test waveforms consisted of a concatenated series of sine waves, each of duration 2 s, amplitude 100 mV, zero mean and frequencies uniformly spaced on a logarithmic scale between 1 Hz and 1 kHz (31 frequencies total). The waveforms were dis-cretized at 10 kHz and applied to the cell, while fluorescence mov-ies were acquired at a frame rate of 2 kHz.
The model parameters for extracting ˆ ( )V tFL were calculated from the fluorescence response to low frequency voltages. These parameters were then used to calculate an estimated voltage at all frequencies.
The applied voltage was downsampled to 2 kHz to mimic the response of a voltage indicator with instantaneous response. For each applied frequency, the Fourier transform of ˆ ( )V tFL was cal-culated and divided by the Fourier transform of the downsampled V(t). The amplitude of this ratio determined the response sensi-tivity. It was crucial to properly compensate pipette resistance and cell membrane capacitance to obtain accurate response spectra. Control experiments on cells expressing membrane-bound eGFP showed no voltage-dependent fluorescence.
The power spectrum of ˆ ( )V tFL under constant V = 0 was also measured to enable calculations of SNR for any applied V(t).
Estimates of membrane potentials from fluorescence images. A common practice in characterizing fluorescent voltage indicators is to report a value of ∆F/F per 100 mV of membrane potential. We feel that this parameter is of limited use, for several reasons. First, the value of ∆F/F is highly sensitive to the method of back-ground subtraction, particularly for indicators in which the value of F approaches zero at some voltage. Second, ∆F/F contains no information about SNR, which depends on absolute fluorescence levels, background, and membrane targeting of the indicator. Third, the ratio ∆F/F contains no information about the tem-poral stability of the fluorescence. Fluctuations may arise owing to intracellular transport, photobleaching or other photophysics. Fourth, definitions of absolute fluorescence are often subjective, depending on a user-defined region of interest that might or might not include pieces of internal membranes or other cells.
We therefore sought a measure of the performance of a voltage indicator that reported the information content of the fluores-cence signal. We sought an algorithm to infer membrane poten-tial from fluorescence images. We used the accuracy with which

©20
11 N
atu
re A
mer
ica,
Inc.
All
rig
hts
res
erve
d.
doi:10.1038/nmeth.1782 nAture methods
the estimated membrane potential matched the true membrane potential (as reported by patch clamp recording) as a measure of indicator performance. The algorithm described below is imple-mented in our analysis (Supplementary Software).
The estimated membrane potential, ˆ ( )V tFL , was determined from the fluorescence in two steps. First we trained a model relat-ing membrane potential to fluorescence at each pixel. We used the highly simplified model that the fluorescence signal, Si(t), at pixel i and time t, is given by:
S t a bV t ti i i i( ) ( ) ( )= + + e
where ai and bi are position-dependent but time-independent constants, the membrane potential V(t) is time-dependent but position independent, and εi(t) is spatially and temporally uncor-related Gaussian white noise with pixel-dependent variance:
e e s d di j i i jt t t t( ) ( ) ( ),1 22
1 2= −
where indicates an average over time.This model neglects nonlinearity in the fluorescence response
to voltage, finite response time of the protein to a change in volt-age, photobleaching, cell-motion or stage drift and the fact that if εi(t) is dominated by shot-noise then its variance should be proportional to Si(t), and its distribution should be Poisson, not Gaussian. Despite these simplifications, the model of equation (1) provided good estimates of membrane potential when calibrated from the same dataset to which it was applied.
The pixel-specific parameters in equation (1) are determined by a least-squares procedure, as follows. We define the deviations from the mean fluorescence and mean voltage by
dS t S t S ti i i( ) ( ) ( )= −
dV t V t V t( ) ( ) ( )= −
Then the estimate for the slope bi is:
bS V
Vi
i=d d
d 2
and the offset is: ˆ ˆa S b Vi i i= −
A pixel-by-pixel estimate of the voltage is formed from
ˆ ( )( )ˆ
ˆˆV t
S t
b
a
bi
i
i
i
i
= −
The accuracy of this estimate is measured by
Vi iV t V t2 2= −( )ˆ ( ) ( )
A maximum likelihood weight matrix is defined by:
wii
ii
≡∑11
2
2//V
V
This weight matrix favors pixels whose fluorescence is an accu-rate estimator of voltage in the training set.
(1)(1)
(2)(2)
To estimate the membrane potential, the pixel-by-pixel esti-mates are combined according to:
ˆ ( ) ˆ ( )V t w V tFL i ii
= ∑
Within the approximations underlying equation (1), equation (3) is the maximum likelihood estimate of V(t).
In cases where the membrane potential is not known, one can replace V(t) by the total intensity of the entire image I(t), provided that there is only a single cell with varying membrane potential in the image. In this case, the algorithm preferentially weights pixels whose intensity varies with the mean intensity. Such pixels are associated with the membrane. This modified procedure yields an estimate of the underlying intensity variations in the membrane. The output resembles the true membrane potential, apart from an unknown offset and scale factor. A key feature of this modified procedure is that it enables spike identification without a patch pipette.
On a video record of 30,000 frames taken (for example, 30 s of data at 1,000 frames s−1), the training phase of the algorithm took approximately 3 min to run on a desktop PC. Application of the weighting coefficients to incoming video data could be performed in close to real time. Small shifts in the field of view owing to stage drift or bumps of the apparatus are compensated by using image registration techniques to translate the pixel weight map. Large changes in focus or movement to a new field of view required retraining of the algorithm.
Molecular biology and virus production. Plasmids encoding Arch-eGFP (FCK-Arch-eGFP) were either used directly for exper-iments in HEK cells or first used to produce VSVg-pseudotyped virus according to published methods16. For pseudotyping, HEK cells were transfected together with pDelta 8.74, VSVg and either of the Arch backbone plasmids using Lipofectamine and PLUS reagent. Viral supernatants were collected 48 h later and filtered using a 0.45-µm membrane. The virus medium was used to infect neurons without additional concentration.
Neuronal cell culture. Embryonic day 18 (E18) rat hippocampi (BrainBits) were mechanically dissociated in the presence of 1 mg ml−1 papain (Worthington) before plating at 5,000–30,000 cells per dish on poly(l-lysine)– and Matrigel-coated (BD Biosciences) glass-bottom dishes. At this density synaptic inputs did not gener-ate spontaneous firing. Cells were incubated in N+ medium (100 ml Neurobasal medium, 2 ml B27 supplement, 0.5 mM glutamine, 25 µM glutamate and penicillin-streptomycin) for 3 h. An addi-tional 300 µl virus medium was added to the cells and incubated overnight, then brought to a final volume of 2 ml N+ medium. After 2 d, cells were fed with 1.5 ml N+ medium. Cells were fed with 1 ml N+ medium without glutamate at 4 days in vitro (DIV), and fed 1 ml every 3–4 d after. Cells were allowed to grow until 10–14 DIV. Cells were supplemented with retinal by diluting stock retinal solutions (40 mM, DMSO) in growth medium to a final concentration of 5 µM, and then placing the cells back in the incu-bator for 1–3 h, after which they were used for experiments.
Whole-cell current clamp recordings were obtained from neurons under the same conditions used for HEK cells recordings. Series resistance and pipette capacitance were corrected. Only neurons with resting potentials between −50 mV and −70 mV were used in the analysis.
(3)(3)

©20
11 N
atu
re A
mer
ica,
Inc.
All
rig
hts
res
erve
d.
doi:10.1038/nmeth.1782nAture methods
Spike sorting. We used a simple spike identification algorithm that could be applied either to electrically recorded V(t) or to optically determined ˆ ( )V tFL . The input trace was convolved with a reference spike. Sections of the convolved waveform that crossed a user-defined threshold were identified as putative spikes. Multiple spikes that fell within 10 ms (a consequence of noise-induced glitches near threshold) were clustered and identified as one.
31. Bergo, V., Spudich, E.N., Spudich, J.L. & Rothschild, K.J. Conformational changes detected in a sensory rhodopsin II-transducer complex. J. Biol. Chem. 78, 36556–36562 (2003).
32. Scharf, B., Hess, B. & Engelhard, M. Chromophore of sensory rhodopsin II from Halobacterium halobium. Biochemistry 3, 12486–12492 (1992).
33. Oesterhelt, D., Meentzen, M. & Schuhmann, L. Reversible dissociation of the purple complex in bacteriorhodopsin and identification of 13-cis and all-trans-retinal as its chromophores. Eur. J. Biochem. 40, 453–463 (1973).
34. Vogeley, L. et al. Crystal structure of the Anabaena sensory rhodopsin transducer. J. Mol. Biol. 37, 741–751 (2007).
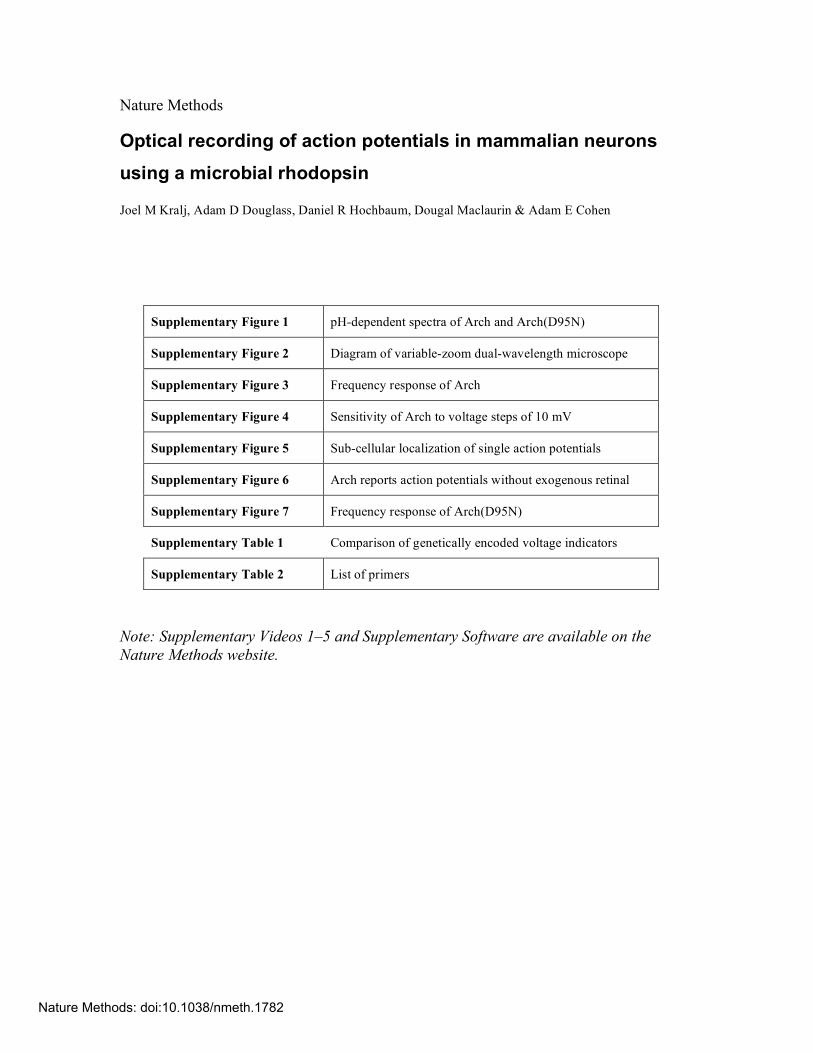
Nature Methods
Optical recording of action potentials in mammalian neurons
using a microbial rhodopsin
Joel M Kralj, Adam D Douglass, Daniel R Hochbaum, Dougal Maclaurin & Adam E Cohen
Supplementary Figure 1 pH-dependent spectra of Arch and Arch(D95N)
Supplementary Figure 2 Diagram of variable-zoom dual-wavelength microscope
Supplementary Figure 3 Frequency response of Arch
Supplementary Figure 4 Sensitivity of Arch to voltage steps of 10 mV
Supplementary Figure 5 Sub-cellular localization of single action potentials
Supplementary Figure 6 Arch reports action potentials without exogenous retinal
Supplementary Figure 7 Frequency response of Arch(D95N)
Supplementary Table 1 Comparison of genetically encoded voltage indicators
Supplementary Table 2 List of primers
Note: Supplementary Videos 1–5 and Supplementary Software are available on the Nature Methods website.
Nature Methods: doi:10.1038/nmeth.1782

Supplementary Figure 1. pH-dependent spectra of Arch and Arch(D95N). (a) Arch(D95N)
absorption at neutral (blue) and high (green) pH. At neutral pH, Arch(D95N) absorbed
maximally at 585 nm. Fluorescence emission (red dashed line) was recorded on 2 M protein
solubilized in 1% DM, with exc = 532 nm. (b) Absorption spectra were recorded on solubilized
protein between pH 6 – 11. Singular Value Decomposition of absorption spectra between 400 –
750 nm was used to calculate the fraction of the SB in the protonated state as a function of pH.
The result was fit to a Hill function to determine the pKa of the SB.
b
0
0.2
0.4
0.6
0.8
1
6 7 8 9 10 11 12pH
pKa = 8.9
0
0.1
0.2
0.3
0.4
400 500 600 700
Emission pH 7.3pH 11.1
Arch(D95N) pH 7.3
Wavelength (nm)
Abs
orba
nce/
Flu
ores
cenc
e aArch(D95N)Arch
Fra
ctio
n pr
oton
ated
pKa = 10.1
1Nature Methods: doi:10.1038/nmeth.1782

Supplementary Figure 2. Diagram of fluorescence microscope Illumination sources: S1 – 488 nm, 60 mW (Omicron PhoxX). S2 – 640 nm, 100 mW (CrystaLaser, DL638-100-O, ultra-stable option). Dichroic mirrors: D1 - 405/488/561/635 quad pass (Semrock). D2, D3 - 662 long pass, imaging flatness (Semrock). D4 - 503 long pass (Semrock). Broadband mirrors: M1, M2 and M3 are Ø2" broadband dielectic mirrors. All other mirrors shown are Ø1". Fixed lenses (all achromatic doublets): L1 - Ø1" f = 25 mm, L2 - Ø1" f = 60 mm, L3 Ø2" f = 150 mm, L4, L6, L7, L8, L9 - Ø2" f = 100 mm, L5 - Ø1" f = 100 mm. Filters: F1 - 700/75 bandpass (Chroma). F2 - 580/60 bandpass (Chroma). Zoom lenses: Z1 - 18-200 mm f/3.5-6.3 (Sigma). Z2 - 18-200mm f/3.6-5.6 (Nikon). Objective: Olympus 1-U2B616 60X oil NA 1.45. Wide-field illumination was provided by diode lasers S1 and S2. A variable zoom camera lens, Z1, set the beam diameter entering the microscope, and thereby the diameter and intensity of the illumination spot (50 - 500 µm; 40 – 4000 W/cm2). A quad-band dichroic mirror, D1, enabled simultaneous illumination at 640 nm and 488 nm, with collection at other wavelengths. To minimize background from out-of-focus debris, illumination was often performed in through-the-objective total internal reflection fluorescence (TIRF) mode, although in the absence of debris conventional epifluorescence illumination provided similar signal-to-noise ratio. A mirror, M1, placed 1f away from the wide-field lens, L4, enabled switching between TIRF and epifluorescence modes.
2Nature Methods: doi:10.1038/nmeth.1782

Fluorescence emission was collected through the same objective, passed through the dichroic mirror, and re-imaged through a second variable zoom camera lens, Z2, onto an adjustable slit. The image was split by a dichroic mirror, D2, passed through emission filters (F1 for Arch fluorescence and F2 for eGFP fluorescence), recombined on a second dichroic mirror, D3, and imaged onto an EMCCD camera. For fast imaging of dynamic fluorescence responses and APs, images were acquired on an Andor iXon+ 860 EMCCD operating at up to 2,000 frames/s (using a small region of interest and pixel binning). Slower images with higher spatial resolution were acquired on an Andor iXon+ 897 EMCCD. Custom software written in LabView (National Instruments) was used to synchronize illumination, collection of images, recording of membrane potential and cell current, and application of electrical stimuli to the cell.
3Nature Methods: doi:10.1038/nmeth.1782

1
0.8
Supplementary Figure 3. Frequency response of Arch. A chirped sine wave with amplitude
50 mV and frequency from 1 Hz – 1 kHz was applied to the cell. Membrane potential was
determined from fluorescence and the Fourier transform of was calculated. The uptick at 1
kHz is an artifact of electronic compensation circuitry. Inset: power spectrum of noise in , under voltage clamp at constant V = 0 mV shows a shot-noise limited noise floor of 470 V/(Hz)1/2 at frequencies above 10 Hz. The noise figures reported here are specific to our imaging system and serve primarily as an indicator of the possible sensitivity of Arch.
FLV
VFLV
FLˆ
/ V
0
0.2
0.4
0.6 -
-
10 0
10 1
102
103
Frequency (Hz)
10 0 101
102
10310 -
10
10
Freq.
4Nature Methods: doi:10.1038/nmeth.1782

Supplementary Figure 4. Sensitivity of Arch to voltage steps of 10 mV. Whole-cell membrane potential determined via direct voltage recording, V, (blue) and weighted Arch
fluorescence, , (red). FLV
Supplementary Figure 5. Sub-cellular localization of action potentials on a single-trial basis. The vertical scale on the fluorescence traces is arbitrary. The lower regions of the cell, shown in Fig. 2e, did not have adequate SNR to indicate APs on a single-trial basis.
60
0 5 10
0
20
40
Time (s)
Vol
tage
(m
V) V
100 ms
5Nature Methods: doi:10.1038/nmeth.1782

Supplementary Figure 6. Arch reports action potentials without exogenous retinal. A) Single-trial recording of APs from a 14 DIV neuron expressing Arch, without exogenous retinal, showing electrical (blue) and fluorescence (red) traces. APs are clearly resolved. B) Fluorescence of a single neuron as a function of time after addition of 10 M retinal. To avoid conflation of voltage dynamics with the effects of retinal incorporation, the neuron was depolarized by treatment with CCCP prior to the experiment.
Supplementary Figure 7. Frequency response of Arch(D95N), measured in the same manner as for Arch (Supplementary Fig. 2).
/ V
0
0.2
0.4
0.6
0.8
1
Freq. (Hz)100 101 102 103
1-6
10 -4 1
-2
100 101 102 103
Frequency (Hz)
50 ms
40 m
V
V
A B
0 20 40 60 800.9
1
1.1
1.2
1.3
1.4
Flu
ores
cenc
e (A
.U.)
Time (minutes)
6Nature Methods: doi:10.1038/nmeth.1782
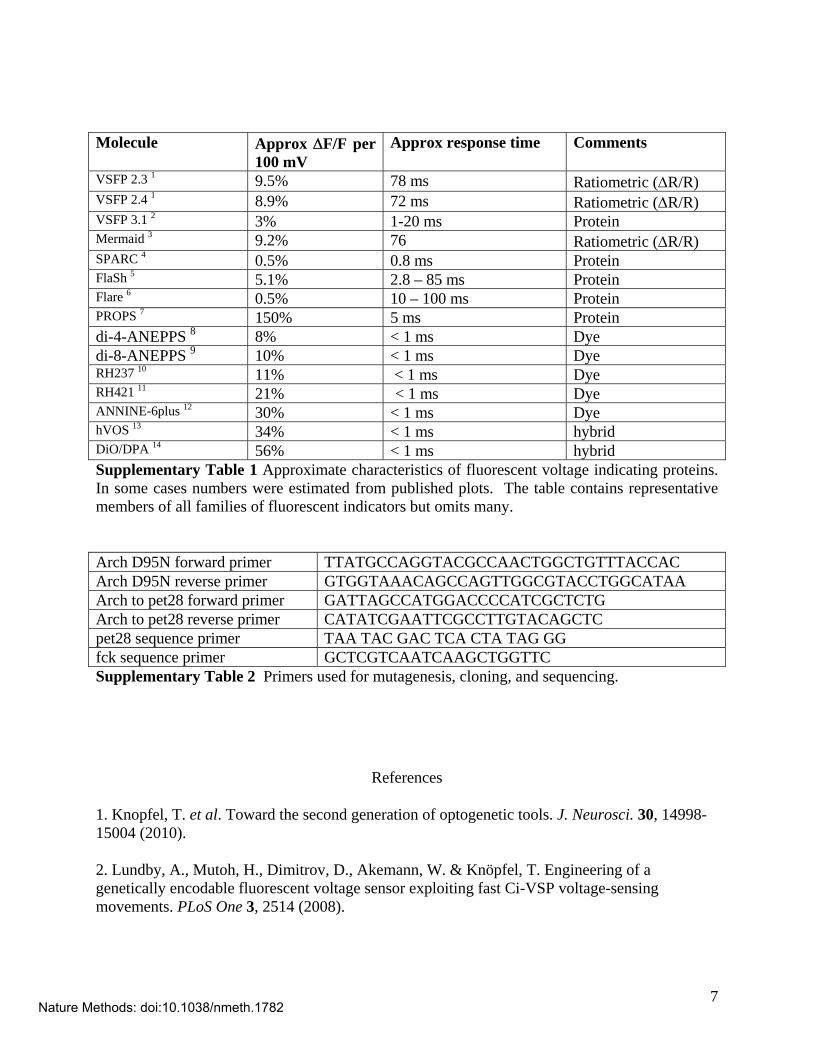
Molecule Approx F/F per
100 mV Approx response time Comments
VSFP 2.3 1 9.5% 78 ms Ratiometric (R/R) VSFP 2.4 1 8.9% 72 ms Ratiometric (R/R) VSFP 3.1 2 3% 1-20 ms Protein Mermaid 3 9.2% 76 Ratiometric (R/R) SPARC 4 0.5% 0.8 ms Protein FlaSh 5 5.1% 2.8 – 85 ms Protein Flare 6 0.5% 10 – 100 ms Protein PROPS 7 150% 5 ms Protein di-4-ANEPPS 8 8% < 1 ms Dye di-8-ANEPPS 9 10% < 1 ms Dye RH237 10 11% < 1 ms Dye RH421 11 21% < 1 ms Dye ANNINE-6plus 12 30% < 1 ms Dye hVOS 13 34% < 1 ms hybrid DiO/DPA 14 56% < 1 ms hybrid Supplementary Table 1 Approximate characteristics of fluorescent voltage indicating proteins. In some cases numbers were estimated from published plots. The table contains representative members of all families of fluorescent indicators but omits many. Arch D95N forward primer TTATGCCAGGTACGCCAACTGGCTGTTTACCAC Arch D95N reverse primer GTGGTAAACAGCCAGTTGGCGTACCTGGCATAA Arch to pet28 forward primer GATTAGCCATGGACCCCATCGCTCTG Arch to pet28 reverse primer CATATCGAATTCGCCTTGTACAGCTC pet28 sequence primer TAA TAC GAC TCA CTA TAG GG fck sequence primer GCTCGTCAATCAAGCTGGTTC Supplementary Table 2 Primers used for mutagenesis, cloning, and sequencing.
References
1. Knopfel, T. et al. Toward the second generation of optogenetic tools. J. Neurosci. 30, 14998-15004 (2010).
2. Lundby, A., Mutoh, H., Dimitrov, D., Akemann, W. & Knöpfel, T. Engineering of a genetically encodable fluorescent voltage sensor exploiting fast Ci-VSP voltage-sensing movements. PLoS One 3, 2514 (2008).
7Nature Methods: doi:10.1038/nmeth.1782

8
3. Perron, A. et al. Second and third generation voltage-sensitive fluorescent proteins for monitoring membrane potential. Front Mol Neurosci. 2, 1-8 (2009).
4. Ataka, K. & Pieribone, V. A. A genetically targetable fluorescent probe of channel gating with rapid kinetics. Biophys. J. 82, 509-516 (2002).
5. Siegel, M. S. & Isacoff, E. Y. A Genetically Encoded Optical Probe of Membrane Voltage. Neuron 19, 735-741 (1997).
6. Baker, B. J. et al. Three fluorescent protein voltage sensors exhibit low plasma membrane expression in mammalian cells. J. Neurosci. Methods 161, 32-38 (2007).
7. Kralj, J. M., Hochbaum, D. R., Douglass, A. D. & Cohen, A. E. Electrical spiking in Escherichia coli probed with a fluorescent voltage indicating protein. Science 333, 345-348 (2011).
8. Montana, V., Farkas, D. L. & Loew, L. M. Dual-wavelength ratiometric fluorescence measurements of membrane potential. Biochemistry (N. Y. ) 28, 4536-4539 (1989).
9. Gross, E., Bedlack Jr, R. S. & Loew, L. M. Dual-wavelength ratiometric fluorescence measurement of the membrane dipole potential. Biophys. J. 67, 208-216 (1994).
10. Fromherz, P. & Müller, C. O. Voltage-sensitive fluorescence of amphiphilic hemicyanine dyes in neuron membrane. BBA-Biomembranes 1150, 111-122 (1993).
11. Grinvald, A., Fine, A., Farber, I. C. & Hildesheim, R. Fluorescence monitoring of electrical responses from small neurons and their processes. Biophys. J. 42, 195-198 (1983).
12. Fromherz, P., Hübener, G., Kuhn, B. & Hinner, M. J. ANNINE-6plus, a voltage-sensitive dye with good solubility, strong membrane binding and high sensitivity. Eur. Biophys. J. 37, 509-514 (2008).
13. Sjulson, L. & Miesenbock, G. Rational optimization and imaging in vivo of a genetically encoded optical voltage reporter. J. Neurosci. 28, 5582 (2008).
14. Bradley, J., Luo, R., Otis, T. S. & DiGregorio, D. A. Submillisecond Optical Reporting of Membrane Potential In Situ Using a Neuronal Tracer Dye. J. Neurosci. 29, 9197-9209 (2009).
Nature Methods: doi:10.1038/nmeth.1782