Optical correlator as a tool for physicists and engineers...
10
Optical correlator as a tool for physicists and engineers training in signal processing A. Márquez, J. Barbé, MI. J. Yzuel, and J. Campos Departamento de FIsica, Universidad Autónoma de Barcelona, 08193 Bellaterra, SPAIN ABSTRACT In many fields of Physics and Engineering the linear systems are studied. The Fourier Transform is a powerftu[ tool for analyzing their behaviour in terms of the frequency contents, both for the input signal and the output signal. The concept of Fourier Transform is generally intrOdUced by mathematical tools. An optical correlator is a set-up that allows to display the decomposition of a signal (1D or 2D) and the processing of this signal. In this communication we use an optical correlator with two arms that gives the display of the Fourier plane and the final plane simultaneously. In the first arm, we can visualize the decomposition ofthe signal in the Fourier space with the application of a given filter. The effect of the filter on the signal is observed in the second arm. The detection is performed by means of CCD cameras and displayed on the computer monitor. Binary filters help to understand the frequency contents of a signal by substraction of frequencies. Gray level ifiters and complex valued filters allow the synthesis of any transfer function. In particular we show the application to pattern recognition. Keywords: Fourier Transfonu, Image Processing, Optical Correlator, Linear System 1. INTRODUCTION Optical Signal Processing deals with two dimensional functions: the images. These two dimensions are the spatial coordinates that locate the value of brightness of the image at a particular point. The information content of the image can be visualized in two different ways: the direct space and the frequency space. Mathematically the Fourier Transform connects both points ofview' . The important point is that optically, by talcing profit of the diffraction properties oflight it is very simple to visualize the image in any of the two spaces. In each space different properties of the image are emphasized, and in many tasks of optical signal processing the frequency space serves to operate on the image in a simpler and more intuitive way than it would be done in direct space. Optical Signal Processing provides us with a visual way of learning different concepts of the general theory of Sial Processing, that is both applied for Optical and for Electrical Signal Processing. The latter deals with one dimensional signals (time-dependent signals) while in Optics the functions are two dimensional (spatial-dependent signals). Nevertheless, the mathematical structure is analogous for both cases. One of the advantages of Optical Signal Processing versus Electrical Signal Processing is the inherent Fourier transforming properties of light propagation3 that helps the student to directly visualize the results of the signal processing just making use of a light source and some lenses. In conclusion, taking into account the educational point ofview "an image is worth a thousand words". Due to the wave nature oflight, when light is perturbed by any kind of inhomogeneity in its way of propagation the result is that the wavefront is modified in some way by this perturbation. We say that the wavefront has been diffracted by the inhomogeneity, that may consist in a modulation of the absorption or in a modulation in the phase in the light beam. Normally, Scalar Diffraction Theory is enough to calculate the perturbed wavefront4. Making use of the Scalar Diffraction Theory we find that applying the Fraimhofer approximation we obtain the Fourier Transform of the inhomogeneity in a certain plane (in the infinite when it is illuminated by a plane wave). Nonetheless, the use of lenses approximates to a finite distance this Fourier plane. In Sixth International Conference on Education and Training in Optics and Photonics, J. Javier Sánchez-Mondragán, Editor, SPIE Vol. 3831 (2000) • 0277-786X1001$15.0O 297
Transcript of Optical correlator as a tool for physicists and engineers...

Optical correlator as a tool forphysicists and engineers training in signal processing
A. Márquez, J. Barbé, MI. J. Yzuel, and J. Campos
Departamento de FIsica, Universidad Autónoma de Barcelona, 08193 Bellaterra, SPAIN
ABSTRACT
In many fields of Physics and Engineering the linear systems are studied. The Fourier Transform is a powerftu[ tool foranalyzing their behaviour in terms of the frequency contents, both for the input signal and the output signal. The concept ofFourier Transform is generally intrOdUced by mathematical tools. An optical correlator is a set-up that allows to display thedecomposition of a signal (1D or 2D) and the processing of this signal. In this communication we use an optical correlatorwith two arms that gives the display of the Fourier plane and the final plane simultaneously. In the first arm, we canvisualize the decomposition ofthe signal in the Fourier space with the application of a given filter. The effect of the filter onthe signal is observed in the second arm. The detection is performed by means of CCD cameras and displayed on thecomputer monitor. Binary filters help to understand the frequency contents of a signal by substraction of frequencies. Graylevel ifiters and complex valued filters allow the synthesis of any transfer function. In particular we show the application topattern recognition.
Keywords: Fourier Transfonu, Image Processing, Optical Correlator, Linear System
1. INTRODUCTION
Optical Signal Processing deals with two dimensional functions: the images. These two dimensions are the spatialcoordinates that locate the value of brightness of the image at a particular point. The information content of the image canbe visualized in two different ways: the direct space and the frequency space. Mathematically the Fourier Transformconnects both points ofview' . The important point is that optically, by talcing profit of the diffraction properties oflight it isvery simple to visualize the image in any of the two spaces. In each space different properties of the image are emphasized,and in many tasks of optical signal processing the frequency space serves to operate on the image in a simpler and moreintuitive way than it would be done in direct space.
Optical Signal Processing provides us with a visual way of learning different concepts of the general theory of SialProcessing, that is both applied for Optical and for Electrical Signal Processing. The latter deals with one dimensionalsignals (time-dependent signals) while in Optics the functions are two dimensional (spatial-dependent signals).Nevertheless, the mathematical structure is analogous for both cases. One of the advantages of Optical Signal Processingversus Electrical Signal Processing is the inherent Fourier transforming properties of light propagation3 that helps thestudent to directly visualize the results of the signal processing just making use of a light source and some lenses. Inconclusion, taking into account the educational point ofview "an image is worth a thousand words".
Due to the wave nature oflight, when light is perturbed by any kind of inhomogeneity in its way of propagation the result isthat the wavefront is modified in some way by this perturbation. We say that the wavefront has been diffracted by theinhomogeneity, that may consist in a modulation of the absorption or in a modulation in the phase in the light beam.Normally, Scalar Diffraction Theory is enough to calculate the perturbed wavefront4. Making use of the Scalar DiffractionTheory we find that applying the Fraimhofer approximation we obtain the Fourier Transform of the inhomogeneity in acertain plane (in the infinite when it is illuminated by a plane wave). Nonetheless, the use of lenses approximates to a finitedistance this Fourier plane.
In Sixth International Conference on Education and Training in Optics and Photonics,J. Javier Sánchez-Mondragán, Editor, SPIE Vol. 3831 (2000) • 0277-786X1001$15.0O 297

An optical correlator is a very powerful information processing system. The information is processed in parallel and at thespeed of light. In a correlator a series of lenses projects the Fourier Transform of an input image at specific distances. At thesame time different processing operations can be applied to this input image. In Section 2 we are going to explain in moredetail the way a correlator works. This will help to explain the possibilities that it provides in Signal Processing Education.In Section 3 we describe the optical correlator with two arms that we use in our students laboratory. Different examples ofthe possibilities of the optical correlator are presented in Section 4. The application to Optical Pattern Recognition isdiscussed in Section 5.
2. CONVERGENT CORRELATOR
We are specially interested in the Vander Lugt convergent correlator5, shown in figure 1. The Vander Lugt converginggeometry is a variant ofthe classical 4fcorrelator. The system is illuminated with a monochromatic point source 0. Lens Liwith focal length F1 produces a converging wave that gives the image 0' of the point source. If an optical transparency withtransmission f(x,y) is inserted behind the lens, the complex amplitude A(u,v) in the Fourier plane is given by
I \ (. it I, 2 2' (Au,v)=CexpI i—u +v )IFI I (1)
?JJ3 ) D3D3)where C is a constant, (u,v) represents the spatial coordinates at the Fourier plane, 2. is the wavelength of the light, D3 is the
distance between the scene transparency and the Fourier plane, and the function F(1u,v) is the Fourier transform of the
function f(x,y).
P1(r,s) P2(,1) P3(x,y) P4(u,v)P5(a,3) P(x',y')
. FourierPoint Li Scene plane
L2 Correlation
A'
6(r,s) w*(,1; f1) f(x,y)G*(u,v)
Dl D2 D3 D4 D54 4 *4 4
Fig. 1 . Geometry ofthe optical convergent correlator. L1 and L are convergent lenses.0 is the image ofO given by L1, and A' is the image ofA given by L.
The spatial frequencies of the Fourier transform are 1u =u/AD3 and v =v/AD3. Consequently changing the distance D3produces a scaling of the Fourier transform of the scene. The possibility of scaling the Fourier transform without changingthe lens Li inserted in the set-up gives a great flexibility to this geometry.
298
source
F(u,v) v*(a,IE;f2) c(x',y')
A second converging lens L2 with focal length F2 produces the real image of the scene A in the correlation plane A'. A ifiterwith a function G *(u,v) is placed in the Fourier plane, being g(x,y) its impulse response. Then the complex amplitudedistribution A(x',y') in the correlation plane is given by
A(x',y') =x',y',d5
—
d4 +d — f2J(2)
J G*(u,v)exp[i4d (ux'+iy')where d, represents the inverse of the distances D1 defined in figure 1, andj are the inverse of the focal lengths F1. Thefunction V is a phase factor defined as
'+'(x,y,d) =exp[i2(x2 + y2)]
(3)
Except for the phase factor, A(x',y') represents the Fourier transform of the product of F(d3u /2, d3v/2) and G *(u,v).Consequently it is the correlation of the functions f(x,y) and g(x,y). The correlation operation measures the similarity
between the two functions f(x,y) and g(x,y). Correlation is one of the basic procedures in pattern recognitionapplications. if instead of introducing G *(u,v) in the Fourier plane we consider the Fourier Transfonn G(u,v) we are
dealing with the convolution of the functions f(x,y) and g(x,y).
He-Ne Stop
laser
Beam-Li Scene Fourier splitter L2 CCD
L3
Computer wth frame-grabber and imageacquisition software
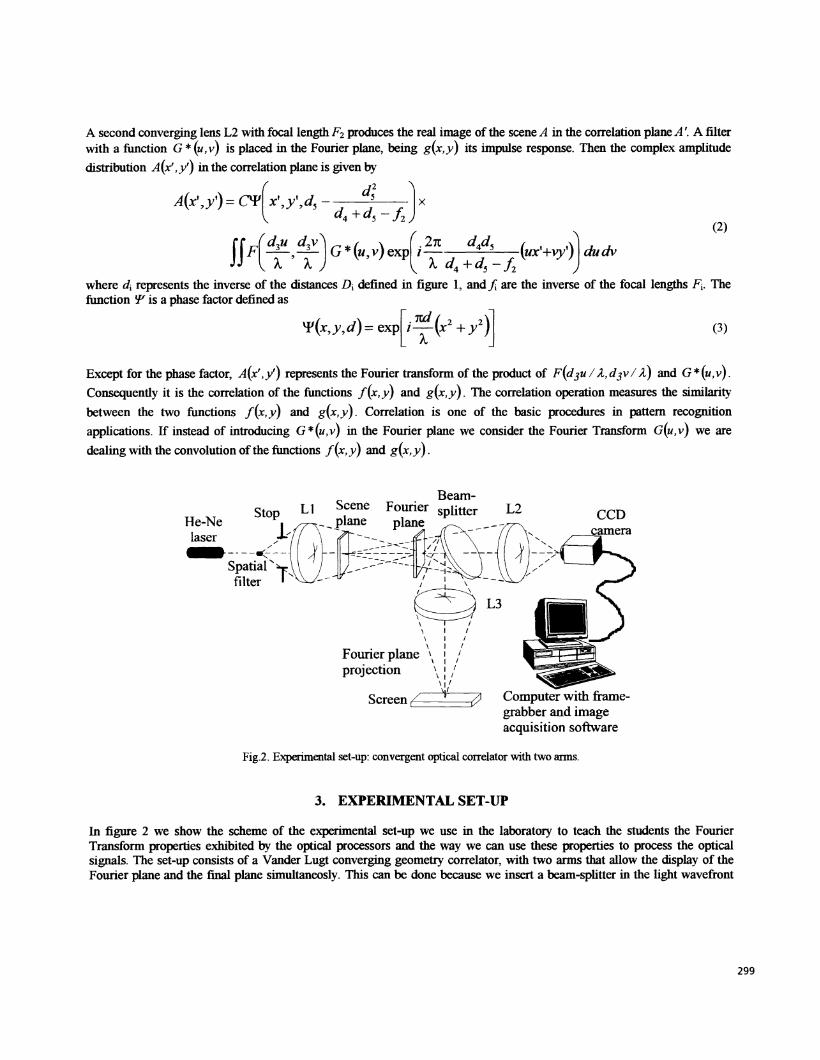
Fig.2. Experimental set-up: convergent optical conelator with two aims.
3. EXPERIMENTAL SET-UP
In figure 2 we show the scheme of the experimental set-up we use in the laboratory to teach the students the FourierTransform properties exhibited by the optical processors and the way we can use these properties to process the opticalsignals. The set-up consists of a Vander Lugt converging geometry correlator, with two arms that allow the display of theFourier plane and the final plane simultaneosly. This can be done because we insert a beam-splitter in the light wavefront
299

trajectory. This beam-splitter is an aluminum coated glass which is partially transmissive. By means 01 the lens Li we
project the Fourier plane onto the screen or onto a CCD camera. With the aid of the lens L3 we can also control themagnification of the Fourier pattern of the scene on the screen. We use the coherent light beam emitted by a He-Ne laser (2.= 632.8 nm). which is expanded and filtered with a spatial filter. Instead of using a collimated beam of light we locate thelens Li to produce the image of the pinhole of the spatial filter at a finite distance. Lens L2 produces the Fourier Transformof the Fourier plane onto the CCD camera.
The scenes we use are recorded on photographic film. The filters we have inserted in the Fourier plane are in general binaryfilters but we have also made complex valued filters for optical pattern recognition tasks. These optical pattern recogmlionfilters are computer-generated holograms6 in which the complex values have been codified on an absorption substrate(photolite) or on a phase material (bleached photographic emulsion)8. The focal length of the lenses Li. L2 and L3 arcrespectively 12 cm. 15 cm and 12 cm. We have used a monochrome 8 bits CCD camera, a Matrox Meteor-Il frame-grabberand the software intellicam provided by Matrox for image acquisition.
4. IMAGE ANALYSIS AND PROCESSING
In Section 2. we have shown mathematically the way the correlator works. Depending on the filter that we introduce in theFourier plane we can process the input signal. that is to say the input image. for different purposes. In the next subsectionswe are going to show different signal analysis and processing operations that the optical correlator permits.
4.1. Frequency content
When the student gets in contact with signal processing one important point for him is to be able to interpret the frequencyspectrum of a given signal Possibly the most basic image to be understood is the diffraction grating. In figure 3(a) we showa collection of diffraction gratings. each one with a different spatial period. In figure 3(b) we show the image of the Fourierspectrum of the scene that the student can see on the screen. We perceive the corresponding diffraction orders associatedwith the frequenc' of each diffraction grating. We must say that we are dealing with binary gratings. therefore theirfrequency spectrum is composed of the zero order, and an infinite number of harmonics. Nevertheless, the first harmonichas notably more mtensth than the others. and figure 3(b) is composed basically of the first harmonics.
300
(a)
1111 LIII 11111
11111 11111 111111 111111
rni RFig. 3 (a) Collection of diffraction gratings with different frequencies; (b) Founer spectrum.
The substraction of first harmonics will make apparent to which diffraction gratings they are associated with. In figure 4(a)a low pass filter has been applied Therefore what we see is that the lowest frequency diffraction gratings are reconstructedin the correlation plane while the highest ones have disappeared. In figure 4(b) a low pass filter with a very short cuttoffrequency has been applied. We can see that all the gratings have disappeared, and the only periodic feature that remains isthe spacing between gratings as this corresponds to the shortest frequency in the scene. The other operation we address in

Iouner piane is nign pass flltcnng. In Iigure 4(C) we see tue results. Now, the gratmgs that remain are those with a highfrequency (third row). The fourth row is not well represented even in the original image projected onto the CCD camera(figure 3).
dIII1It !I1llLRJfl!
Fig.4. Reconstructed signal after application of a filter. (a) Low pass filter (b) Low pass filter witha shorter cuttof frequency m companson with the low pass filter (a) (c) thgh pass filter.
We still have another consideration to make. In figure 5 we can see the reconstruction provided when the scene is tilted withrespect to figure 3(a). Now we observe clearly one diffraction grating more than in figure 3(a). where it was not wellresolved. This is due to the fact that the matrix of the CCD camera is a pixelated structure, that has a limitation in theresolution of the image that can capture. When the period of the grating is shorter than the pixel spacing the grating is notwell sampled and moire effects appear. Then we can see that the cutoff frequencies of the different optical elements in theset-up play a decisive role in the different steps of image processing. In this case we can see the effect of the cutofffrequency due to the pixelated structure of the CCD camera. When the gratings are tilted the period in the horizontaldirection is bigger and can be resolved by the CCD camera. Nevertheless, the two gratings in the right part of the fourth roware still not resolved by the CCD camera.
FigS. Tilted gratings with respect to the pixel ordering in the CCD camera.
4.2. Directional infonnation
From the Fraunhofer diffraction pattern we can also extract information on the spatial orientation of the periodic featuresthat appear in the scene. In figure 6(a) we show a diffraction pattern. The first harmonics are forming a circle around thezero frequenc's. The second harmonics are also slightly visible. In figure 6(b) we show the scene corresponding to theprevious diffraction pattern. It is a collection of diffraction gratings. all of them have the same period but differentorientation of the fringes.
301

In figure 7(a) and (b) we show the result of substracting the harmonics corresponding to specific orientations. We clearlydistinguish the gratings that are removed by this filtering operation.
302
4.3. Combining frequencies and orientations
If we look at figure 8(a) we see that this diffraction pattern has one characteristic (the longitudinal disposition of diffractionorders) that resembles the previous diffraction pattern in figure 3(b) while another characteristic (the circular disposition ofdiffraction orders) resembles the figure 6(a). Certainly, in the scene to which this diffraction pattern corresponds (shown infigure 8(b). there exist both kinds of information, frequency and orientation. The scene is composed by four quadrants withfive circles inside each one of them. The quadrants and the circles contain fringes with different periods and orientations.
In figure 9(a) we apply a low pass filter in the Fourier plane. The result is that we remove two circles in the top left quadrantand the whole top right quadrant. In figure 9(b) we show the effect of applying a directional filter that allows to pass the lowfrequencies. In this way there are three circles in the top right quadrant that disappear. but the rest of the penodicities in thisquadrant remain unaltered, although they have the same frequency. The reason is that the orientations of the fringes are ina
different direction from the ones selected by the filter.
Fig.ô. (a) I)iffraction pattern; (b) Scene.
Fig.7. Reconstructed signal when applying onentational filters. (a) +900, 750 and -75°orientations are removed; (b) I50 and -30° onentations are removed

4.4. Sampling effects
Instead of geometrical images as the ones shown in the previous subsections, now we are going to examine a more realisticimage. It consists. figure 10(a). in the photograph of a fireman going down a staircase. This photograph has been taken froma computer monitor. We know that computer screens are pixelated devices, then the image recorded on the photograph is infact a sampled image. In figure 10(b) we show the diffraction pattern of the scene. The hexagonal periodicitv in thediffraction orders is due to the hexagonal distribution of the pixels in the monitor we used.
303
Fig.8. (a) Diffraction pattern; (b) Scene.
Fig.9. Reconstructed images. (a) Low pass filter: (b) Low pass filter with orientation discrimination.
Fig. 10. (a) Scene; (b) Diffraction pattern; (c) Magnified diffraction pattern.

When we make the Fourier Transform of a sampled image the result we obtain is the convolution of the Fourier Transformof the image by the Fourier Transform of the sampling function1. Then, in each one of the diffraction orders of thehexagonal pattern shown in figure 10(b) we have the Fourier Transform of the image. If we examine the zero frequency ofthe hexagonal pattern with a higher magnification, figure 10(c). we find that this zero frequency has an internal structure.We appreciate diffraction orders along three different directions (vertical, horizontal, and at approximately 30°). This isprecisely the Fourier Transform of the image. In the scene. figure 10(a). we find the three periodicities: spacing between thesteps of the staircase, spacing between the shadow of the steps. and spacing between the bars of the handrail.
Fig. 11. Reconstructed signal when only the zero frequency of the hexagonal diffunction patternpasses (a), and when only one of the harmonics of the hexagonal diffraction pattern passes (b).
From the sampling theorem we know that if the sampling frequency is high enough we can recover the original continuoussignal from its discrete counterpart with no loss of information4. In the Fourier plane we have applied two different filters.On one side we have applied a blocking filter that blocks all the Fourier spectrum with the exception of the zero frequencyof the hexagonal pattern. The reconstructed signal is shown in figure 11(a). On the other side we have applied a blockingfilter that blocks all the Fourier spectrum with the exception of one of the harmonics of the hexagonal pattern. Thereconstructed signal is shown in figure 11(b). We can see in figure 11(a) and in figure 11(b) that we recover another timethe original input scene, although in figure 11(b) ii is recovered with more noise.
5. OPTICAL PATTERN RECOGNITION
In Optical Pattern Recognition the goal is to detect and to determine the position of an object inside an input scene. Theoptical correlator has been widely used in optical pattern recognition. In Section 2 we told that the correlation provides ameasure of the similarity between two functions. In this case the filter that is used in the Fourier plane is complex valuedand it is related to the Fourier Transform of the target object to be detected. The complex transparency can be produced byholographic interference, as in the case of the Vander Lugt filter", or it can also be produced by digital methods like acomputer-generated hologram.
Thc phase of a complex field is a magnitude that can not be directly visualized because the detectors simply measureintensity. It is in this sense that the application of the optical correlator to pattern recognition dern.mands a larger maturity ofthe student in signal processing concepts. as now we are dealing with a filtering operation that not only modifies theintensity of the Fourier Spectrum of the scene but also alteres its phase. Then we think that this is an application that canserve the student to have an idea of the large number of possibilities that Signal Processing offers to him.
The filters we use are designed by digital methods and they are recorded by means of a resolution graphic device on aphotolite. which is an absorption substrate. We do also have correlation filters made on bleached photographic emulsion.which is a phase material. In figure 12 we show a magnified image of this filter made on a photolite. The complex
304

amputuac miormation 01 me iourier I ransiorm oi tile 0bjCt 10 be aetecteu is coaiflecl by means 01 ttlC position and tile areaof rectangular apertures. The codification method that we follow was proposed by Burckhardt9. In figure 13 we show thescene we work with. It consists of two butterflies, and the one we want to recognize is butterfly (B).
.&)
Fig.13. Scene.
If we put the filter in the scene plane and we look at its Fourier Transform we obtain the image presented in figure 14. Wecan see that we recover the butterfly with the edges enhanced. In fact in the digital design of the filter we have simplyconsidered the information about the phase distribution in the Fourier Transform of butterfly (B). this is what we call aphase-only filter. It results in an enhancement of the higher frequencies. and it emphasizes the edges of the butterfly. Wecan also see that the butterfly is repeated with a squared penodicitv. This is a consequence that the information contained inthe computer-generated hologram is sampled with this squared periodicitv.
Fig. 14. Impulse response of the correlation filter. Fig. 15. 3-D representation of the correlation plane.
305
Fig. 12. Magnified image of the correlation filter.

In figure 15 we have represented the result obtained from the correlation operation using the scene and the filter describedpreviously. It is a three dimensional representation of the correlation plane. The higher peak indicates the location ofbutterfly (B) inside the scene. Then, butterfly (B) have been clearly discriminated from butterfly (A).
6. SUMMARY
In the present discussion we have presented the possibilities that an Optical Correlator set-up offers as a tool for studentsiraining in Signal Processing. The processing of both optical and electrical signals follows the same theoretical principles,and therefore an Optical Correlator can be useful for teaching these principles not only for people working on Optics butalso for electrical engineers and people working on other signal processing areas. We have mainly concentrated on theimportance of understanding the Fourier spectrum of a signal, and we have given different examples of filtering operationsthat can be applied to the Fourier spectrum. Our Optical Correlator setup with two arms enables the display of the Fourierplane and the final plane simultaneously. As a more sofisticated signal filtering operation we have introduced theapplication ofthe optical correlator to optical pattern recognition.
ACKNOWLEDGMENTS
We would like to thank Dr. I. Moreno for useful discussions. A. Márquez wishes to thank the Comissionat per aUmversitats i Recerca de Ia Generalitat de Catalunya for a grant. This work was partly supported by the Dirección Generalde Ensefianza Superior del Ministerio de Educación y Cultura (project PB96-1 134-C02-O1).
REFERENCES
1 . W. T. Cathey, Optical Information Processing and Holography, John Wiley & Sons, New York, 1973.2. S. H. Lee, "Basic Principles", in Optical Information Processing. Fundamentals, S. H. Lee ed., Topics in Applied
Physics, Vol. 48, Springer-Verlag, Berlin, 1981.3. A. Maréchal and M. Françon, Diffiaction. Structure des Images, Editions de Ia Revue d'Optique Theónque et
Instruinentale, Paris, 1960.4. J. W. Goodman, Introduction to Fourier Optics, McGraw4{ill, 1996.5. A. Vander Lugt, Optical Signal Processing, John Wiley & Sons, New York, 1992.6. R B. Collier, C. B. Burckhardt and L. H. Lin, Optical Holography, pp. 224-226, Academic Press, London, 1971.7. I. Moreno, C. Gorecki, J. Canipos and M. J. Yzuel, "Comparison of computergenerated holograms produced by laser
printers and lithography: application to pattern recognition", Opt. Eng. 34(12), 3520-3525, 1995.8. A. Màrquez, J. Campos, M. J. Yzuel, I. Pascual, A. Fimia and A. Beléndez, "Production of computer-generated phase
holograms using graphic devices. Application to correlation filters", sent to Opt. Eng.9. C. B. Burckhardt, "A simplification of Lee's method of generating holograms by compute?', Appl. Opt. 9(8), 1949,
1970.
306