Optical Constants of Sulfuric Acid; Application to the ...€¦ · Optical Constants of Sulfuric...
12
Optical Constants of Sulfuric Acid; Application to the Clouds of Venus? Kent F. Palmer and Dudley Williams With the purpose of obtaining the real and imaginary parts of the complex refractive index 1S = n + ik, we have made quantitative measurements of spectral transmission and reflection of sulfuric acid solutions in the visible and near infrared. On the basis of the results, we have obtained values for n throughout the en- tire region and values of k in the near infrared together with upper limits for k in the visible region. These optical constants can be used to interpret the results of polarization studies of solar radiation that has been scattered by the clouds of Venus. We have Kramers-Kronig phase-shift analysis to obtain values of n and k from reflection measurements in the intermediate infrared region (400-4000 cm-'). Our mea- surements were made at 300 K on sulfuric acid solutions having concentrations by weight of 95.6, 84.5, 75, 50, 38, and 25%. If the particles in the Venus clouds consist of liquid droplets of sulfuric acid at a tempera- ture of 250 K, comparison of existing Venus data with our data suggests that the acid concentration is probably higher than 70%. Various possibilities are discussed. Introduction From balloon soundings, Rosen 1 has found that sulfuric acid particles are the most abundant aerosols in the earth's stratosphere. The sizes and shapes of these particles as well as the phases of the H 2 SO4- n H 2 0 involved have not yet been definitely estab- lished. In order to provide laboratory data for com- parison with aerosol spectra in the 800-1250 cm- 1 at- mospheric window, Remsberg 2 has used ATR tech- niques to obtain values of the complex index of re- fraction IV = n + ik in this spectral region. Because of strong sulfuric acid bands in this atmospheric win- dow, Neumann 3 has pointed out that variations in the abundance of H 2 SO 4 aerosols in the stratosphere could have an influence on climatic conditions. On the basis of polarization studies of scattered ra- diation in the visible region, along with estimates of pressure, temperature, and relative humidity based on infrared studies of the planet, Young 4 and Sill 5 have independently suggested that the clouds of Venus may well consist of H 2 SO 4 - n H 2 0 particles. More recently, Hansen and Hovenier 6 have shown that measured values of the polarization of solar ra- diation scattered by the Venus clouds can be ac- counted for on the basis of spherical particles with a size distribution sharply peaked at a radius of ap- The authors are with the Physics Department, Kansas State University, Manhattan, Kansas 66506. Received 12 July 1974. proximately 1 Am with the following values of refrac- tive index n: 1.46 at 365 nm, 1.44 at 550 nm, and 1.43 at 990 nm. The acceptable limit of uncertainty n is +0.015 at each of these wavelengths. The tem- perature 4 at the top of the main cloud bank is ap- proximately 250 K; the optical thickness of the cloud cover is unity in a region where the pressure is 50 mbars. 6 In order to obtain more detailed information from existing and future observational data, it is desirable to obtain laboratory measurements of n and k for sulfuric acid solutions in the entire spectral region from the ultraviolet to the remote infrared. In the present study, we have attempted to supply the needed laboratory data for a wide range of sulfuric acid concentrations. All our work has been done at 300 K; Lorentz-Lorenz corrections can be applied to obtain values of n and k for liquid samples at other temperatures. We have not yet attempted to deter- mine optical constants for the crystal hydrates of sul- furic acid; work on the solid hydrates involves formi- dable experimental difficulties. The general experimental techniques employed are similar to those used in our earlier studies of water. 7 - 12 They involve quantitative measurements of re- flectance at near-normal incidence and measure- ments of the transmittance of samples in carefully constructed cells of known thickness. Kramers-Kro- nig phase-shift analysis of the reflectance data gives values of n with a fractional uncertainty bn/n = ±0.01 over most of the spectral range of measure- ment and corresponding values of k having an uncer- tainty 6k = ±0.03 in most regions. 208 APPLIED OPTICS / Vol. 14, No. 1 / January 1975
Transcript of Optical Constants of Sulfuric Acid; Application to the ...€¦ · Optical Constants of Sulfuric...
Optical Constants of Sulfuric Acid; Application to theClouds of Venus?
Kent F. Palmer and Dudley Williams
With the purpose of obtaining the real and imaginary parts of the complex refractive index 1S = n + ik, we
have made quantitative measurements of spectral transmission and reflection of sulfuric acid solutions in
the visible and near infrared. On the basis of the results, we have obtained values for n throughout the en-
tire region and values of k in the near infrared together with upper limits for k in the visible region.
These optical constants can be used to interpret the results of polarization studies of solar radiation that
has been scattered by the clouds of Venus. We have Kramers-Kronig phase-shift analysis to obtain values
of n and k from reflection measurements in the intermediate infrared region (400-4000 cm-'). Our mea-
surements were made at 300 K on sulfuric acid solutions having concentrations by weight of 95.6, 84.5, 75,
50, 38, and 25%. If the particles in the Venus clouds consist of liquid droplets of sulfuric acid at a tempera-
ture of 250 K, comparison of existing Venus data with our data suggests that the acid concentration is
probably higher than 70%. Various possibilities are discussed.
Introduction
From balloon soundings, Rosen1 has found thatsulfuric acid particles are the most abundant aerosolsin the earth's stratosphere. The sizes and shapes ofthese particles as well as the phases of the H2SO4-n H20 involved have not yet been definitely estab-
lished. In order to provide laboratory data for com-parison with aerosol spectra in the 800-1250 cm- 1 at-mospheric window, Remsberg2 has used ATR tech-niques to obtain values of the complex index of re-fraction IV = n + ik in this spectral region. Becauseof strong sulfuric acid bands in this atmospheric win-dow, Neumann3 has pointed out that variations inthe abundance of H2SO4 aerosols in the stratospherecould have an influence on climatic conditions.
On the basis of polarization studies of scattered ra-diation in the visible region, along with estimates ofpressure, temperature, and relative humidity basedon infrared studies of the planet, Young4 and Sill5
have independently suggested that the clouds ofVenus may well consist of H2 SO4 - n H2 0 particles.More recently, Hansen and Hovenier 6 have shownthat measured values of the polarization of solar ra-diation scattered by the Venus clouds can be ac-counted for on the basis of spherical particles with asize distribution sharply peaked at a radius of ap-
The authors are with the Physics Department, Kansas State
University, Manhattan, Kansas 66506.Received 12 July 1974.
proximately 1 Am with the following values of refrac-tive index n: 1.46 at 365 nm, 1.44 at 550 nm, and1.43 at 990 nm. The acceptable limit of uncertaintyn is +0.015 at each of these wavelengths. The tem-
perature4 at the top of the main cloud bank is ap-proximately 250 K; the optical thickness of the cloudcover is unity in a region where the pressure is 50mbars. 6
In order to obtain more detailed information fromexisting and future observational data, it is desirableto obtain laboratory measurements of n and k forsulfuric acid solutions in the entire spectral regionfrom the ultraviolet to the remote infrared. In thepresent study, we have attempted to supply theneeded laboratory data for a wide range of sulfuricacid concentrations. All our work has been done at300 K; Lorentz-Lorenz corrections can be applied toobtain values of n and k for liquid samples at othertemperatures. We have not yet attempted to deter-mine optical constants for the crystal hydrates of sul-furic acid; work on the solid hydrates involves formi-dable experimental difficulties.
The general experimental techniques employed aresimilar to those used in our earlier studies of water.7-12 They involve quantitative measurements of re-flectance at near-normal incidence and measure-ments of the transmittance of samples in carefullyconstructed cells of known thickness. Kramers-Kro-nig phase-shift analysis of the reflectance data givesvalues of n with a fractional uncertainty bn/n =
±0.01 over most of the spectral range of measure-ment and corresponding values of k having an uncer-tainty 6k = ±0.03 in most regions.
208 APPLIED OPTICS / Vol. 14, No. 1 / January 1975
0.042
C034
0.030Ray)
0026
0022
0.018
0014
0s357 0417 O500X~ym)
28 24 20 16 12 8 4
V (cm-l)
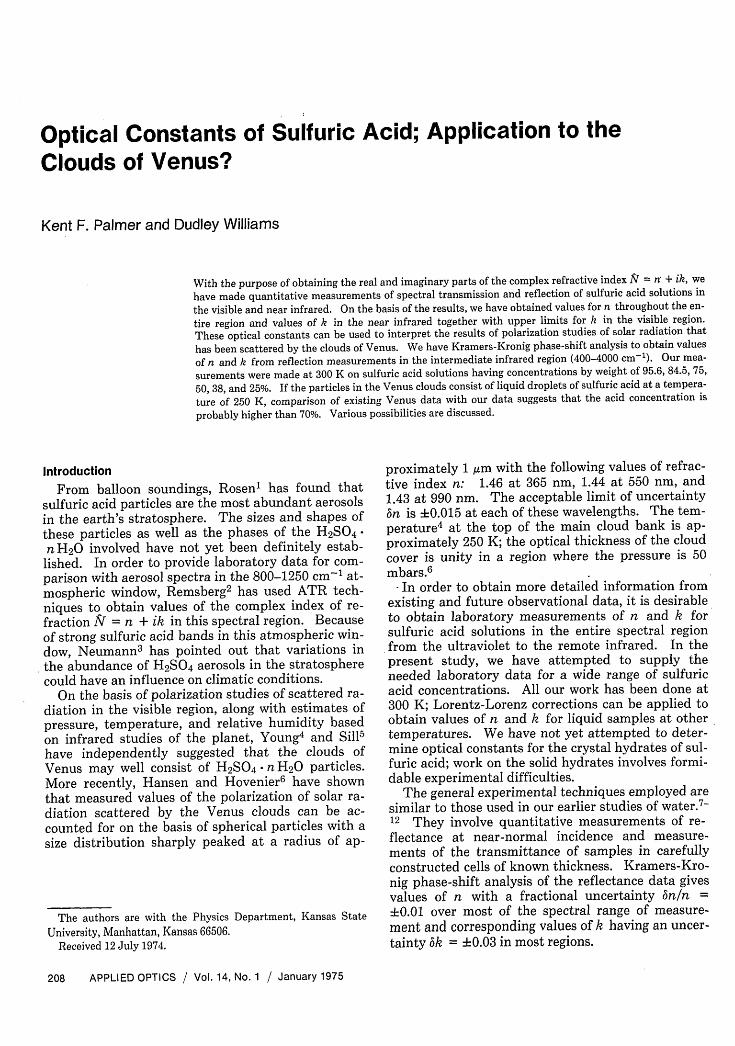
Fig. 1. Spectral reflectance of H 2SO4 solutions in the 4000-28,000cm- 1 region.
Results in the Visible and Near InfraredIn the visible and near infrared, we used the com-
bination of reflection and transmission measure-ments described in our earlier paper.12 In the reflec-tion measurements, we first compared the radiantflux reflected from the free surface of an acid samplewith the flux reflected from a reference mirror, theabsolute reflectance of which had been measured bymeans of a Strong reflectometer. From these mea-surements, the near-normal fractional spectral reflec-tance R of the acid sample can be obtained with frac-tional uncertainty 3R/R of approximately ±0.02.
Because of hygroscopic properties of sulfuric acid,the concentration of the free surface layer of a sulfu-ric acid sample changes when the sample is exposedto air. We were careful to use freshly preparedsolutions in each set of reflection measurements andto reject data sets in which reflectance had measura-bly changed in the course of a series of separate runs.
The spectral reflectances R for 95.6, 84.5, 75, 50,38, and 25% H2 SO4 solutions are summarized in Fig.1 for the spectral range 4800-28000 cm-'; the uncer-tainties 3R in various spectral regions given on thecurve for the 50% solution are typical of those for theother solutions. In most of the visible region, spec-tral reflectance increases monotonically with increas-ing concentration, except for the 84.5% solution forwhich the spectral reflectance curve crosses that ofthe 95.6% solution. The spectral reflectance curvesfor all solutions fall rapidly at frequencies below 6000cm -1 because of the proximity of strong absorptionbands associated with molecules containing OHgroups; these strong fundamental bands appear inthe 3600-3000 cm-1 region.
Although the absorption index k is very smallthroughout the visible and near infrared, the radiantflux from the sun is large in these spectral regions.Hence, it is possible that absorption of insolation as-sociated with weak bands in these regions could havean influence on planetary heat balances. Therefore,we have made quantitative measurements of theLambert absorption coefficient a throughout the
near infrared region and have established upper lim-its of a in the visible region.
At a given frequency, the spectral transmittance T= I/lo giving the ratio flux I transmitted by a liq-uid-filled absorption cell to the incident flux 1 isgiven by the expression
T = (1 - A')(1 - R') exp(-ax), (1)
where A' is the spectral absorptance of the cell win-dows, R' is the reflectance at the outer and inner sur-faces of the cell windows, a is the Lambert coeffi-cient, x is the thickness of the absorbing layer of liq-uid. Accurate determination of A' and R' presentsformidable experimental difficulties that can happilybe avoided by the use of cells equipped with identicalwindows but with different thicknesses. By takingratios of the transmittances of cells of different thick-ness, it is possible to determine a without actualmeasurement of A' and R'.
In the present study we used a set of eight preci-sion cells of Infrasil quartz ranging in length x from 1mm to 5 cm, fabricated from a single batch of Infras-il. At lower frequencies in the near infrared we useda Beckman variable-pathlength cell equipped withquartz windows. This cell provided path lengths xin the range 1 mm to 30 Aim. Although the Beckmancell is fabricated from stainless steel and is equippedwith a Teflon lining, we were unable to use it in stud-ies of the 50, 38, and 25% solutions, all of which arehighly corrosive. Collimated beams were employedin measuring spectral transmittance throughout theregion.
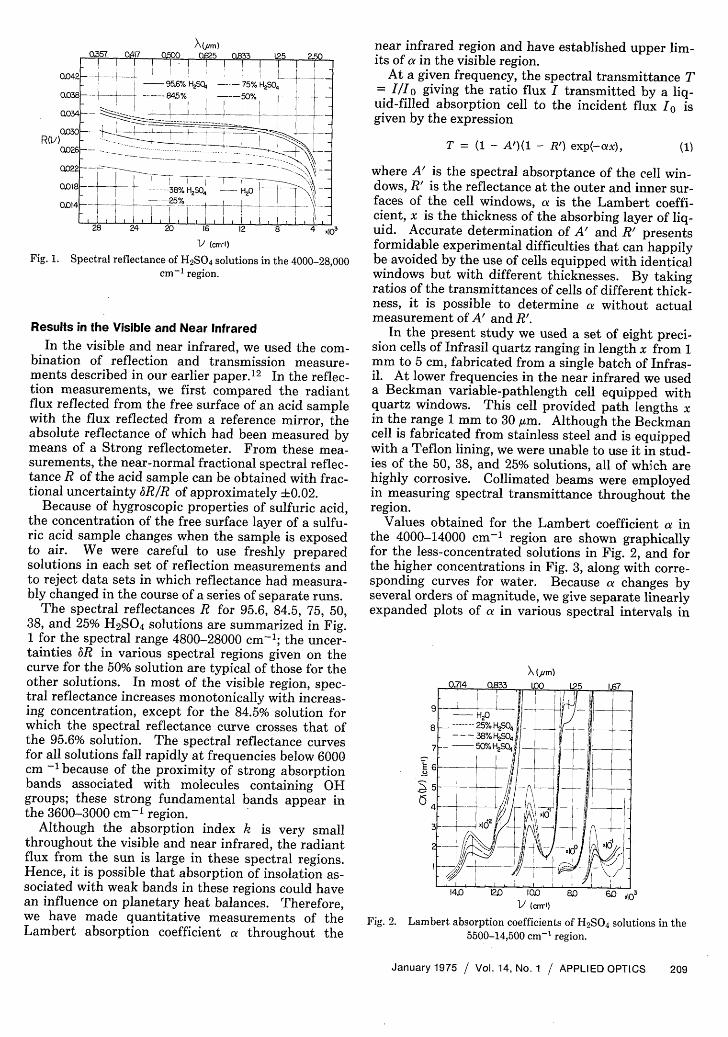
Values obtained for the Lambert coefficient a inthe 4000-14000 cm-1 region are shown graphicallyfor the less-concentrated solutions in Fig. 2, and forthe higher concentrations in Fig. 3, along with corre-sponding curves for water. Because a changes byseveral orders of magnitude, we give separate linearlyexpanded plots of a in various spectral intervals in
\ (Pm)0.714 0.833 125 167
__H 208 -- 25% 1HS0 -
- 38%I-l~S04
--
2-
14.0 12a0 100 0 13V (cm-')
Fig. 2. Lambert absorption coefficients of H 2SO4 solutions in the5500-14,500 cm- 1 region.
January 1975 / Vol. 14, No. 1 / APPLIED OPTICS 209
II I X 1 1 1 I I
95.6% H2S04 --- 75% H2SO,845% _50%/ -e-- ----- --1 - ------
----- , I H20 ILJ WLIWLL-25IIIII
X(m)
4.0 V. (cm-')
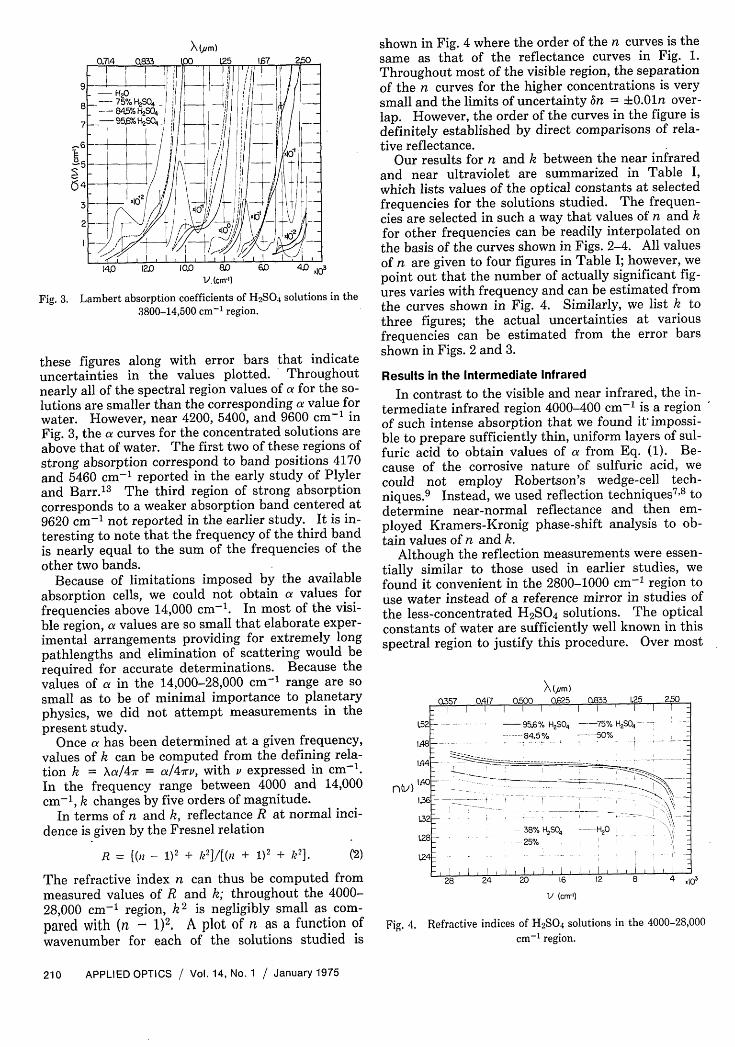
Fig. 3. Lambert absorption coefficients of H2 SO4 solutions in the3800-14,500 cm- 1 region.
these figures along with error bars that indicateuncertainties in the values plotted. Throughoutnearly all of the spectral region values of a for the so-lutions are smaller than the corresponding a value forwater. However, near 4200, 5400, and 9600 cm- 1 inFig. 3, the a curves for the concentrated solutions areabove that of water. The first two of these regions ofstrong absorption correspond to band positions 4170and 5460 cm-1 reported in the early study of Plylerand Barr.13 The third region of strong absorptioncorresponds to a weaker absorption band centered at9620 cm-1 not reported in the earlier study. It is in-teresting to note that the frequency of the third bandis nearly equal to the sum of the frequencies of theother two bands.
Because of limitations imposed by the availableabsorption cells, we could not obtain a values forfrequencies above 14,000 cm- 1 . In most of the visi-ble region, a values are so small that elaborate exper-imental arrangements providing for extremely longpathlengths and elimination of scattering would berequired for accurate determinations. Because thevalues of a in the 14,000-28,000 cm-1 range are sosmall as to be of minimal importance to planetaryphysics, we did not attempt measurements in thepresent study.
Once a has been determined at a given frequency,values of k can be computed from the defining rela-tion k = Xa/47r = a/47rv, with v expressed in cm-'.In the frequency range between 4000 and 14,000cm-1 , k changes by five orders of magnitude.
In terms of n and k, reflectance R at normal inci-dence is given by the Fresnel relation
R = ((n - 1)2 + k2]/[( + 1)2 + 2]. (2)
The refractive index n can thus be computed frommeasured values of R and k; throughout the 4000-28,000 cm- 1 region, k2 is negligibly small as com-
pared with (n - 1)2. A plot of n as a function ofwavenumber for each of the solutions studied is
shown in Fig. 4 where the order of the n curves is thesame as that of the reflectance curves in Fig. 1.Throughout most of the visible region, the separationof the n curves for the higher concentrations is verysmall and the limits of uncertainty An = +0.Oln over-lap. However, the order of the curves in the figure isdefinitely established by direct comparisons of rela-tive reflectance.
Our results for n and k between the near infraredand near ultraviolet are summarized in Table I,which lists values of the optical constants at selectedfrequencies for the solutions studied. The frequen-cies are selected in such a way that values of n and kfor other frequencies can be readily interpolated onthe basis of the curves shown in Figs. 2-4. All valuesof n are given to four figures in Table I; however, wepoint out that the number of actually significant fig-ures varies with frequency and can be estimated fromthe curves shown in Fig. 4. Similarly, we list k tothree figures; the actual uncertainties at variousfrequencies can be estimated from the error barsshown in Figs. 2 and 3.
Results in the Intermediate Infrared
In contrast to the visible and near infrared, the in-termediate infrared region 4000-400 cm-' is a regionof such intense absorption that we found it, impossi-ble to prepare sufficiently thin, uniform layers of sul-furic acid to obtain values of a from Eq. (1). Be-cause of the corrosive nature of sulfuric acid, wecould not employ Robertson's wedge-cell tech-niques.9 Instead, we used reflection techniques7 '8 todetermine near-normal reflectance and then em-ployed Kramers-Kronig phase-shift analysis to ob-tain values of n and k.
Although the reflection measurements were essen-tially similar to those used in earlier studies, wefound it convenient in the 2800-1000 cm-1 region touse water instead of a reference mirror in studies ofthe less-concentrated H2SO4 solutions. The opticalconstants of water are sufficiently well known in thisspectral region to justify this procedure. Over most
X(m )-1R nine I- -ss
L52
1.48
1.44
4C
1.3E
1.3
L2E
1.24
F 1 I I I I I I I I I
- 95.6% HS04 -- 75% H2SO4--- 84.5% --- 50%
38% H2SO4 -H2025%
28 24 20 16 .2 . . . lO-
28 24 20 16 12 8 14 leo
V (cm-)
Fig. 4. Refractive indices of H2 SO 4 solutions in the 4000-28,000
cm- 1 region.
210 APPLIED OPTICS / Vol. 14, No. 1 / January 1975
195; 250n1 QW1
nW)
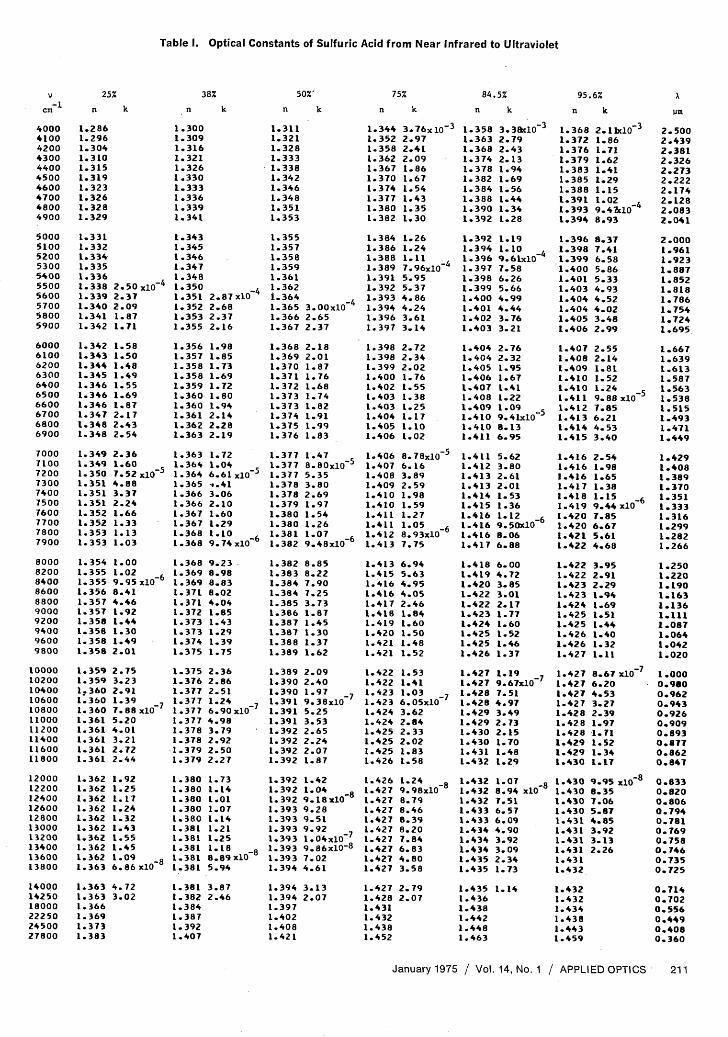
Table I. Optical Constants of Sulfuric Acid from Near Infrared to Ultraviolet
25%
n k
1.2861.2961.3041.3101.3151.3191.3231.3261.3281.329
1.3311.3321.3341.3351.3361.338 2.50 xl041.339 2.371.340 2.091.341 1.871.342 1.71
1.342 1.581.343 1.501.344 1.481.345 1.491.346 1.551.346 1.691.346 1.871.347 2.171.348 2.431.348 2.54
1.349 2.361.349 1.601.350 7.52x10 51.351 4.881.351 3.371.351 2.241.352 1.661.352 1.331.353 1.131.353 1.03
1.354 1.001.355 1.021.355 9.95 1061.356 8.411.357 4.461.357 1.921.358 1.441.358 1.301.358 1.491.358 2.01
1.359 2.751.359 3.231.360 2.911.360 1.391.360 7.88x 101.361 5.201.361 4.011.361 3.211.361 2.721.361 2.44
1.362 1.921.362 1.251.362 1.171.362 1.241.362 1.321.362 1.431.362 1.551.362 1.451.362 1.091.363 6.86 X10⁸
1.363 4.721.363 3.021.3661.3691.3731.383
38%
n k
1.3001.3091.3161.3211.3261 .3301.3331.3361.3391.341
1.3431.3451.3461.3471.3481.3501.3511.3521.3531 .355
1.3561.3571 .3581.3581.3591.3601.3601.3611.3621.363
.3631.3641.3641.3651.3661.3661.3671.3671.368.368
1.3681.3691.3691.3711.3711.3721 .3731.3731.3741.375
1.3751.3761 .3771.3771.3771 .3771.3781.378I .3791.379
1.3801.380I.3801 .3801 .380I .3811.3811.3811.3811 .381
50%n k
1.3111.3211.3281.3331.3381.3421.3461.3481.3511.353
1.3551.3571.3501.3591.361
_4 1.3622.8A7 xO t -,364J2.682.372.16
1.981.851.731.691.721.801.942.142.282.19
1.721.046.61 X105
i *.413.062.101.601.291.10 -69.74 x10
9.238.988.838.024*041.851.431.291.391.75
2.362.862.511 .246.90 x107
4.983.792.922.502.27
1.731.141.011.071.141.211.251.18 -88.89 xlO5.94
1.381 3.871.382 2.461.384I .3871.3921.407
- - - - . -41.365 3.00xlO1.366 2.651.367 2.37
1.368 2.181.369 2.011.370 1.871.371 1.761.372 1.681.373 1.741.373 1.821.374 1.911.375 1.991.376 1.83
1.377 1.471.377 8.80xl 51.377 5.351.378 3.801.378 2.691.379 1.971.380 1.541.380 1.261.381 1.07 -61.382 9.48x10
1.382 8.851.383 8.221.384 7.901.384 7.251.385 3.731.386 1.871.387 1.451.387 1.301.388 1.371.389 1.62
1.389 2.091.390 2.401.390 1.97 71.391 9.38x101.391 5.251.391 3.531.392 2.651.392 2.241.392 2.071.392 1.87
1.392 1.421.392 1.04 -81.392 9.18 x1O1.393 9.281.393 9.511.393 9.921.393 1.04 xlO 1.393 9.86x10-81.393 7.021.394 4.61
1.394 3.131.394 2.071.3971.4021.4081.421
75%
n k
1.344 3.76x10 3
1.352 2.971.358 2.411.362 2.091.367 1.861.370 1.671.374 1.541.377 1.431.380 1.351.382 1.30
1.384 1.261.386 1.241.388 1.111.389 7.96x1041.391 5.951.392 5.371.393 4.861.394 4.241.396 3.611.397 3.14
1.398 2.721.398 2.341.399 2.021.400 1.761.402 1.551.403 1.381.403 1.251.404 1.171.405 1.101.406 1.02
1.406 8.78xlO151.407 6.161.408 3.891.409 2.591.410 1.981.410 1.591.411 1.271.411 1.05 -61.412 8.93x101.413 7.75
1.413 6.941.415 5.631.416 4.951.416 4.051.417 2.461.418 1.841.419 1.601.420 1.501.421 1.481.421 1.52
1.422 1.531.422 1.411.423 1.03 71.423 6. 05xlO1.424 3.621.424 2.841.425 2.331.425 2.021.425 1.831.426 1.58
1.426 1.241.427 9.98xlO81.427 8.791.427 8.461.427 8.391.427 8.201.427 7.841.427 6.83I.427 4 .801.427 3.58
1.427 2.791.428 2.07I.4311.4321.4381.452
84.5%
n k
1.3581.3631.3681.3741.3781.3821.3841.3881.3901.392
1.3921.3941.3961.3971.3981.3991.4001.4011.4021.403
3. 38x10 3
2.792.432.131.941.691.561.441.341.28
1.191.109 .61xO47.586.265.664.994.443.763.21
1.404 2.761.404 2.321.405 1.951.406 1.671.407 1.411.408 1.221.409 1.091.410 9.41xlO 5
1.410 8.131.411 6.95
1.411 5.621.412 3.801.413 2.611.413 2.011.414 1.531.415 1.361.416 1.12 -61.416 9.50x101.416 8.061.417 6.88
1.418 6.001.419 4.721.420 3.851.422 3.011.422 2.171.423 1.771.424 1.601.425 1.521.425 1.461.426 1.37
1.427 1.191.427 9.67xlO71.428 7.511.428 4.971.429 3.491.429 2.731.430 2.151.430 1.701.431 1.481.432 1.29
1.432 1.07 -81.432 8.94 xlO1.432 7.511.433 6.571.433 6.091.434 4.901.434 3.921.434 3.091.435 2.341.435 1.73
1.435 1.141.4361.4381.4421.4481.463
January 1975 / Vol. 14, No. 1 / APPLIED OPTICS 211
95.6%
n k
V
-1cm
4000410042004300440045004600470048004900
5000510052005300540055005600570058005900
6000610062006300640065006600670068006900
7000710072007300740075007600770078007900
8000820084008600880090009200940096009800
10000102001040010600108001100011200I14001160011800
12000122001240012600128001300013200134001360013800
140001425018000222502450027800
2.11xlO 3
1.86i 1.711.621.41i 1.291.15I 1.02 49.4x108.93
8.377.416.585.865.334.934.524.023.482.99
2.552.141.811.521 249.88 x10 5
7.856.214.533.40
2.541.981.651.381.15 -69.44 x107.856.675.614.68
3.952.912.291.941.691.51I *44
1.401.321.11
lm
2.5002.4392.3812.3262.2732.2222.1742.1282.0832.041
2.0001.9611.9231.8871.8521.8181.7861.7541.7241.695
1.6671.6391.6131.5871.5631.5381.5151.4931.4711.449
1.4291.4081.3891.3701.3511.3331.3161.2991.2821.266
1.2501.2201.1901.1631.1361.1111.0871.0641.0421.020
1.0000.9800.9620.9430.9260.9090.8930.8770.8620.847
1.3681.3721.3761.3791.3831.3851.3881.3911.3931.394
1.3961.3981.3991.4001.4011.4031.4041.4041.4051.406
1.4071.4081.4091.4101.4101.4111.4121.4131.4141.415
1.4161.4161.4161.4171.4181.419I .4201.4201.4211.422
1.4221.4221.4231.4231.4241.4251.4251.4261.4261.427
1.4271.4271 .*4271.427I .4281.42 81.4281.4291.4291.430
1.4301.4301.4301.4301.4311.4311.4311.4311.4311.432
1.4321.4321.4341.4381.4431.459
-78.67 xlO6.204.533.272.391.971.711.521.341.17
9.958.357.065.874.853.923.132.26
xlO 8 0.8330.8200.8060.7940.7810.7690.7580.7460.7350.725
0.7140.7020.5560.*490.4080.360
R (V)
Q
C
n (V)
V (cm-')
(m)
1,
V (cm-')
(m)
k
V (cm-)
R (V)
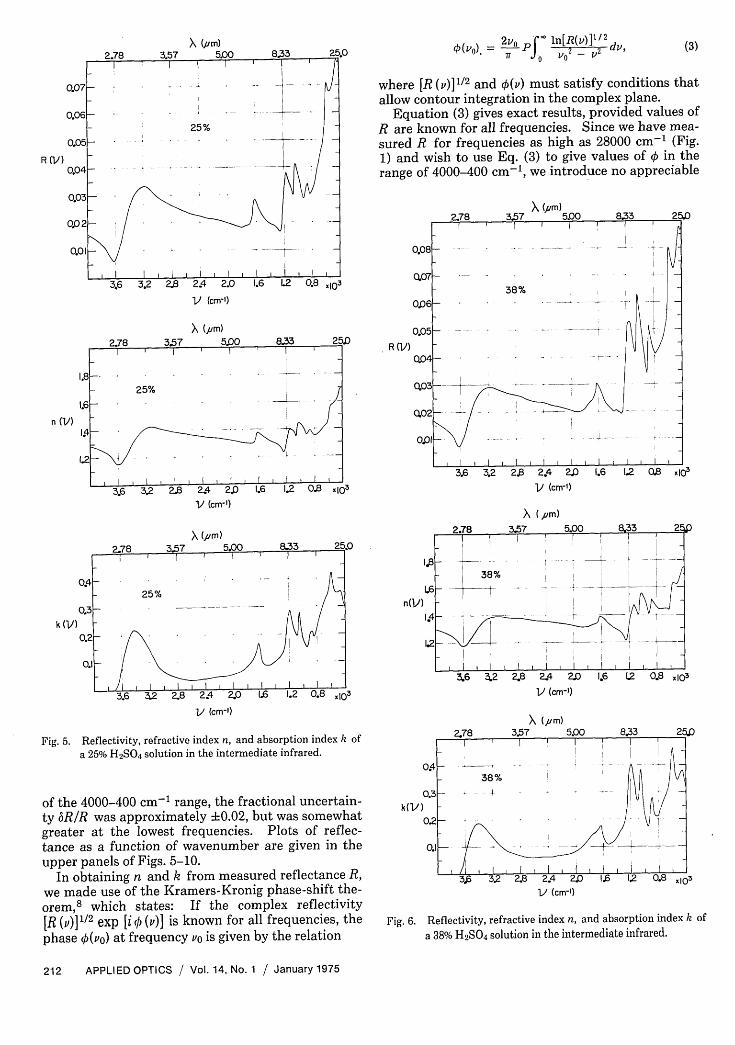
Fig. 5. Reflectivity, refractive index n, and absorption index k of
a 25% H 2SO4 solution in the intermediate infrared.
of the 4000-400 cm-1 range, the fractional uncertain-ty 6RIR was approximately ±0.02, but was somewhatgreater at the lowest frequencies. Plots of reflec-tance as a function of wavenumber are given in theupper panels of Figs. 5-10.
In obtaining n and k from measured reflectance R,we made use of the Kramers-Kronig phase-shift the-orem,8 which states: If the complex reflectivity[R (v)]1 /2 exp [i p (v)] is known for all frequencies, the
phase O(vo) at frequency Po is given by the relation
k(V)
¢p =2vo -J ln[R(v)]Il 3(O.=7 P? AO 2 -i 2 dv, (3)
where [R ()]1/2 and 0(v) must satisfy conditions thatallow contour integration in the complex plane.
Equation (3) gives exact results, provided values ofR are known for all frequencies. Since we have mea-sured R for frequencies as high as 28000 cm-' (Fig.1) and wish to use Eq. (3) to give values of 0 in therange of 4000-400 cm-1, we introduce no appreciable
(m)
V (cm-')
X (Pm)
V (cm-')
(m)
V (cm-')
Fig. 6. Reflectivity, refractive index n, and absorption index k of
a 38% H 2 SO4 solution in the intermediate infrared.
212 APPLIED OPTICS / Vol. 14, No. 1 / January 1975

(M)
RMV)
V (cm-')
X (m)
n(V)
X1033.6 3.2 2U 2V4 c)
V (-l)
k (V)
Fig. 7. Reflectivity, refractive index n, and absorption index ofa 50% H2SO4 solution in the intermediate infrared.
computational error in replacing infinity by 28000cm-1 as the upper limit of the integral. This relativeinsensitivity to the upper limit is the result of theterm (vo2 - 2) in the denominator of the integral,which becomes increasingly large as the upper limit isapproached. Since we have no information regard-ing R for frequencies lower than 350 cm-', where ourmeasurements ended, we are forced to make assump-tions regarding reflectance in the far infrared. Inevaluating Eq. (3), we have assumed that R in the re-mote infrared has a constant value equal to the mea-
k(V)
V (cm-l)
X pM) -
V (cr-')
\(Pm)
V (cm-')
Fig. 8. Reflectivity, refractive index n, and absorption index k ofa 75% H2 SO4 solution in the intermediate infrared.
sured value of R at 350 cm-1 . The influence of thisvalue on (vo) is greatest at low frequencies in the vi-cinity of 400 cm-1 , but in view of the term ( 2 -v 2)
January 1975 / Vol. 14, No. 1 / APPLIED OPTICS 213
R(V)
B
- w -Z - Z
_7 � _1I I I , � I
I- I__ T 50%
;_ I
r , � , I I I , I , I , I , I I I I
) (m)
83 '.".;; 9 so
1.6 1.2 0.8
\ Upm)X (Pm)
RV))R(V)
V (cm-l)V (an-)
V (cml))(pm)
x&V (cr')
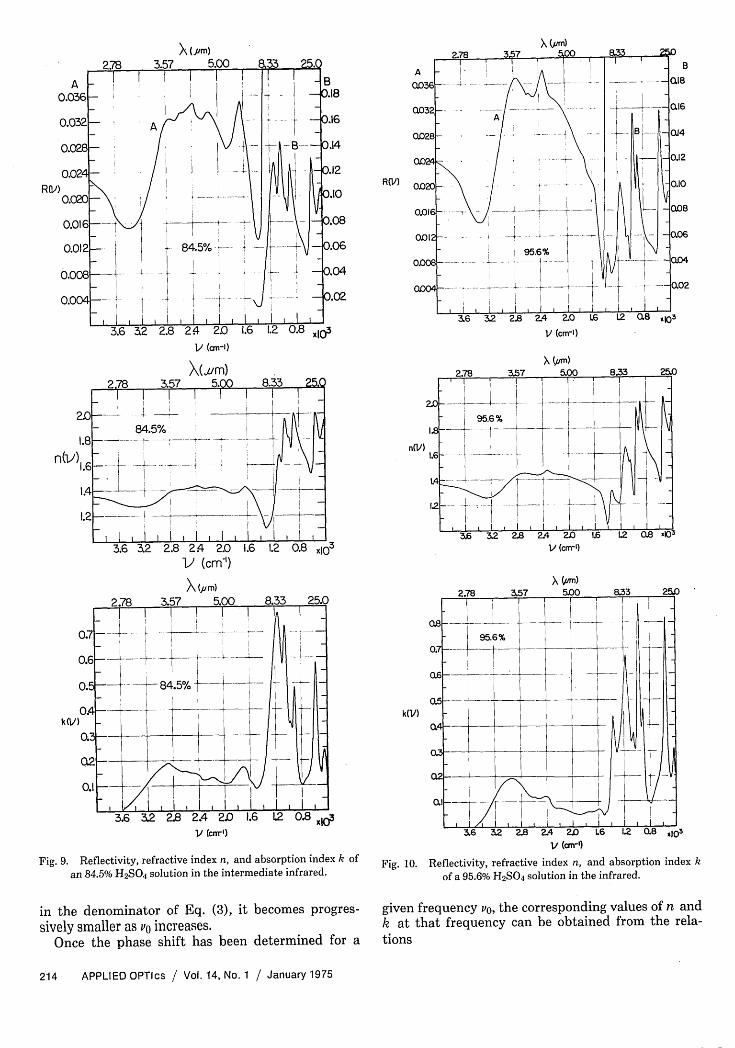
Fig. 9. Reflectivity, refractive index n, and absorption index k of
an 84.5% H2 SO4, solution in the intermediate infrared.
in the denominator of Eq. (3), it becomes progres-sively smaller as Po increases.
Once the phase shift has been determined for a
X (m)
n(V)
k(V)
V (cmrl)
X (m)
.lo3V (-')
Fig. 10. Reflectivity, refractive index n, and absorption index k
of a 95.6% H 2SO4 solution in the infrared.
given frequency vo, the corresponding values of n andk at that frequency can be obtained from the rela-tions
214 APPLIED OPTIcs / Vol. 14, No. 1 / January 1975
n = (1 - R)/(1 + R - 2R1?/2 cos4),
k = (-2R'/ 2 sino)/(1 + R - 2R1 /2 cosp). (4)
The values of the optical constants n and k for theH2SO4 solutions are plotted as a function of wave-number in the two lower panels of Figs. 5-10. Thefractional uncertainty an/n is approximately 0.01over most of the range but becomes larger at lowfrequencies because of increasing uncertainties in Rand because of our extrapolation of R to frequencieslower than 350 cm-'. The uncertainty bk is estimat-ed as ±0.03 over most of the range, but increases as400 cm- 1 is approached.
The spectral features of H2SO4 solutions in the in-termediate infrared show marked changes with con-centration. As a result of a beautiful study by Gig-uere and Savoie'4 covering the absorption spectrumin the range 5000-500 cm-1 , we can correlate most ofthe spectral features observed in the present studywith the presence of H2SO4, HS0 4-, SO4--, H30+,H20, and various hydrates of H2SO4. Giguere andSavoie were primarily interested in an interpretationof their spectra in terms of various molecular andionic species, and made no attempt to make quanti-tative measurements of intensity. Therefore, al-though our results are entirely compatible withtheirs, we cannot make quantitative comparisons.
We summarize our present values of n and k inTable II, which lists n to four figures and k to threefigures at various frequencies in the intermediate in-frared. We emphasize once again that the uncertain-ties stated above should be considered by anyonemaking use of the tables in the interpretation ofplanetary or telluric spectra. The curves shown inFigs. 5-10 can be used to provide interpolated valuesof n and k at frequencies not listed in the table.
Discussion of Results
The values of n and k obtained in the presentstudy can be compared with several other earlierstudies. Our values for n covering the range fromthe near ultraviolet to the near infrared are in goodagreement in the visible region with early measure-ments of n at discrete wavelengths in the visible re-gion.15 The early refractometer measurements of n,taken at several different temperatures by differentinvestigators, have smaller uncertainties n than thepresent values based upon spectral scans of reflec-tance. When Lorentz-Lorenz corrections are appliedto earlier measurements in order to give values of nat 300 K, the resulting values fall within the range ofuncertainty for our present values.
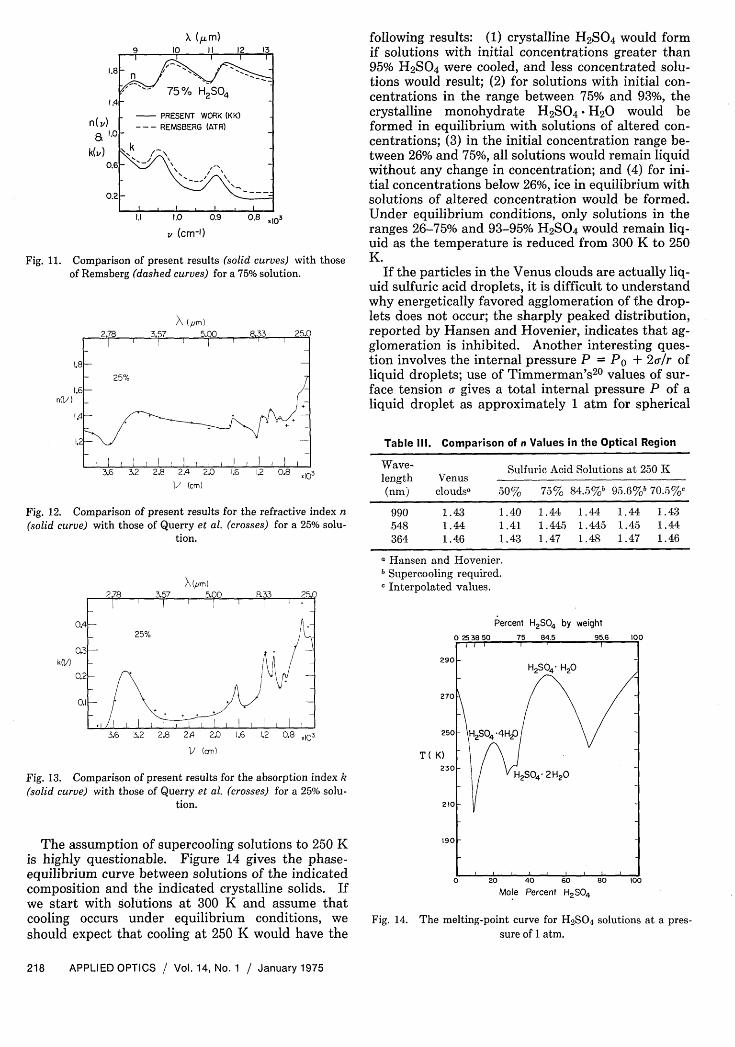
In Fig. 11 we give a comparison of our values, of nand k for a 75% solution with those of Remsberg 2 inthe region of the earth's atmospheric window in the800-1200 cm-' region. There is fair general agree-ment between major spectral features, as revealed inthe two studies. Over most of the range, theRemsberg values fall within our stated range ofuncertainties. Greater precision is usually claimedfor ATR results than we claim for results based uponmeasurements of reflectance at a free liquid surface.
It would therefore be desirable to extend the ATRmeasurements to the broad range of frequencies cov-ered in our present survey.
In Figs. 12 and 13 we compare our results for the25% solution with the recent results of Querry'etal., 16 based upon a Kramers-Kronig analysis of mea-surements of reflectance at nonnormal incidence inthe spectral range 5000-500 cm-'. There is goodagreement between the studies, except in the low fre-quency region; lack of agreement in this region is notsurprising, since the low frequency limits of the twostudies were different and different extrapolations tozero frequency were made in the Kramers-Kroniganalyses.
In this connection, we might note that bettervalues of n and k could be obtained from our presentreflectance measurements if reflectances could be ex-tended to the submillimeter spectral region by theFourier transform techniques developed by Cham-berlain and his colleagues.17"8 Use of reflectancevalues generated from values of n and k in Tables Iand II, together with additional measurements be-tween 400 cm-1 and 10 cm-', would virtually elimi-nate computational uncertainties in the evaluation ofthe integral in Eq. (3).
Because analyses of polarization data indicate thatthe particles in the Venus clouds are spherical, earlierworkers have suggested that the particles consist ofliquid droplets.4 If this suggestion is correct, and ifwe assume that sulfuric acid solutions of all concen-trations can be supercooled at 250 K, we can applyLorentz-Lorenz corrections to convert our presentvalues of n into equivalent values at 250 K, and wecan compare our results with the values of n given bythe recent analysis of Hansen and Hovenier6; in theLorentz-Lorenz correction we used density valueslisted by Timmermans.19 The results of such a com-parison are summarized in Table III, in which wecompare the Hansen-Hovenier values of n at threewavelengths with values of n for liquid samples ofsulfuric acid solutions at 250 K. By recalling theuncertainties n ±0.015 acceptable to Hansen andHovenier, we can eliminate the sulfuric acid solutionsof 50% or lower concentrations as having values of nbelow those acceptable. Within the limits of uncer-tainty, the 75, 84.5, and 95.6% solutions would be ac-ceptable; however, for each of these solutions, ourbest values are higher than those of Hansen and Ho-venier.
On the basis of a linear interpolation in values of nbetween the values for the 50 and 75% solutions, wehave attempted to find the best match between ourdata and the results of the analysis of polarizationdata. A linear interpolation in this concentrationrange seems justified by early measurements of n inthe visible region.4 The best match is achieved for aconcentration of 70.5%, which gives the values of nlisted in the last column of Table III. Although thisbest-fit concentration is somewhat lower thanYoung's 4 early estimate of 75%, the two estimates arecompatible within the limits of uncertainty.
January 1975 / Vol. 14, No. 1 / APPLIED OPTICS 215
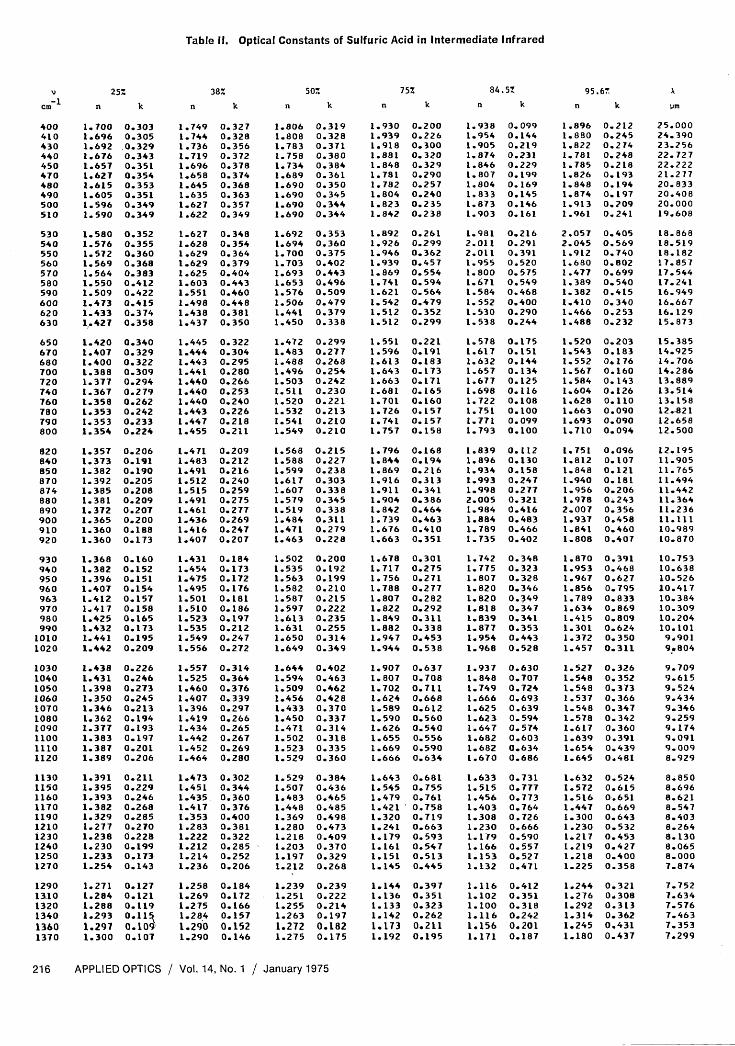
Table II. Optical Constants of Sulfuric Acid in Intermediate Infrared
400 1.700 0.303410 1.696 0.305430 1.692 0.329440 1.676 0.343450 1.657 0.351470 1.627 0.354480 1.615 0.353490 1.605 0.351500 1.596 0.349510 1.590 0.349
530 1.580 0.352540 1.576 0.355550 1.572 0.360560 1.569 0.368570 1.564 0.383580 1.550 0.412590 1.509 0.422600 1.473 0.415620 1.433 0.374630 1,.427 0.358
650 1.420 0.340670 1.407 0.329680 1.400 0.322700 1.388 0.309720 1.377 0.294740 1.367 0.279760 1.358 0.262780 1.353 0.242790 1.353 0.233800 1.354 0.224
820 1.357 0.206840 1.373 0.191850 1.382 0.190870 1.392 0.205874 1.385 0.208880 1.381 0.209890 1.372 0.207900 1.365 0.200910 1.360 0.188920 1.360 0.173
930 1.368 0.160940 1.382 0.152950 1.396 0.151960 1.407 0.154963 1.412 0.157970 1.417 0.158980 1.425 0.165990 1.432 0.173
1010 1.441 0.1951020 1.442 0.209
1030 1.438 0.2261040 1.431 0.2461050 1.398 0.2731060 1.350 0.2451070 1.346 0.2131080 1.362 0.1941090 1.377 0.1931100 1.383 0.1971110 1.387 0.2011120 1.389 0.206
1130 1.391 0.2111150 1.395 0.2291160 1.393 0.2461170 1.382 0.2681190 1.329 0.2851210 1.277 0.2701230 1.238 0.2281240 1.230 0.1991250 1.233 0.1731270 1.254 0.143
1290 1.271 0.12713.10 1.284 0.1211320 1.288 0.1191340 1.293 0.111360 1.297 0.1091370 1.300 0.107
38%
1.749 0.3271.744 0.3281.736 0.3561.719 0.3721.696 0.3781.658 0.3741.645 0.3681.635 0.3631.627 0.3571.622 0.349
1.627 0.3481.628 0.3541.629 0.3641.629 0.3791.625 0.4041.603 0.4431.551 0.4601.498 0.4481.438 0.3811.437 0.350
1.445 0.3221.444 0.3041.443 0.2951.441 0.2801.440 0.2661.440 0.2531.440 0.2401.443 0.2261.447 0.2181.455 0.211
1.471 0.2091.483 0.2121.491 0.2161.512 0.2401.515 0.2591.491 0.2751.461 0.2771.436 0.2691.416 0.2471.407 0.207
1.431 0.1841.454 0.1731.475 0.1721.495 0.1761.501 0.1811.510 0.1861.523 0.1971.535 0.2121.549 0.2471.556 0.272
1.557 0.3141.525 0.3641.460 0.3761.407 0.3391.396 0.2971.419 0.2661.434 0.2651.442 0.2671.452 0.2691.464 0.280
1.473 0.3021.451 0.3441.435, 0.3601.417 0.3761.353 0.4001.283 0.3811.222 0.3221.212 0.2851.214 0.2521.236 0.206
1.258 0.184
50%.
n
75%
1.806 0.319 1.930 0.2001.808 0.328 1.939 0.2261.783 0.371 1.918 0.3001.758 0.380 1.881 0.3201.734 0.384 1.848 0.3291.689 0.361 1.781 0.2901.690 0.350 1.782 0.2571.690 0.345 1.804 0.2401.690 0.344 1.823 0.2351.690 0.344 1.842 0.238
1.692 0.353 1.892 0.2611.694 0.360 1.926 0.2991.700 0.375 1.946 0.3621.703 0.402 1.939 0.4571.693 0.443 1.869 0.5541.653 0.496 1.741 0.5941.576 0.509 1.621 0.5641.506 0.479 1.542 0.4791.441 0.379 1.512 0.3521.450 0.338 1.512 0.299
1.472 0.299 1.551 0.2211.483 0.277 1.596 0.1911.488 0.268 1.613 0.1831.496 0.254 1.643 0.1731.503 0.242 1.663 0.1711.511 0.230 1.681 0.1651.520 0.221 1.701 0.1601.532 0.213 1.726 0.1571.541 0.210 1.741 0.1571.549 0.210 1.757 0.158
1.568 0.2151.588 0.2271.599 0.2381.617 0.3031.607 0.3381.579 0.3451.519 0.3381.484 0.3111.471 0.2791.463 0.228
1.502 0.2001.535 0.1921.563 0.1991.582 0.2101.587 0.2151.597 0.2221.613 0.2351.631 0.2551.650 0.3141.649 0.349
1.644 0.4021.594 0.4631.509 0.4621.456 0.4281.433 0.3701.450 0.3371.471 0.3141.502 0.3181.523 0.3351.529 0.360
1.529 0.3841.507 0.4361.483 0.4651.448 0.4851.369 0.4981.280 0.4731.218 0.4091.203 0.3701.197 0.3291.212 0.268
1.239 0.2391.269 0.172 1.251 0.2221.275 0.166 1.255 0.2141.284 0.157 1.263 0.1971.290 0.152 1.272 0.1821.290 0.146 1.275 0.175
1.796 0.1681.844 0.1941.869 0.2161.916 0.3131.911 0.3411.904 0.3861.842 0.4641.739 0.4631.676 0.4101.663 0.351
1.678 0.3011.717 0.2751.756 0.2711.788 0.2771.807 0.2821.822 0.2921.849 0.3111.882 0.3381.947 0.4531.944 0.538
1.907 0.6371.807 0.7081.702 0.7111.624 0.6681.589 0.6121.590 0.5601.626 0.5401.655 0.5561.669 0.5901.666 0.634
1.643 0.6811.545 0.7551.479 0.7611.421 0.7581.320 0.7191.241 0.6631.179 0.5931.161 0.5471.151 0.5131.145 0.445
1.144 0.3971.136 0.3511.133 0.3231.142 0.2621.173 0.2111.192 0.195
216 APPLIED OPTICS / Vol. 14, No. 1 / January 1975
vcm-1
25%
n k n k95.684 5%
n k
1.938 0.0991.954 0.1441.905 0.2191.874 0.2311.846 0.2291.807 0.1991.804 0.1691.833 0.1451.873 0.1461.903 0.161
1.981 0.2162.011 0.2912.011 0.3911.955 0.5201.800 0.575.671 0.549
1.584 0.4681.552 0.4001.530 0.2901.538 0.244
1.578 0.1751.617 0.1511.632 0.1441.657 0.1341.677 0.1251.698 0.1161.722 0.1081.751 0.1001.771 0.0991.793 0.100
1.839 0.1121.896 0.1301.934 0.1581.993 0.2471.998 0.2772.005 0.3211.984 0.4161.884 0.4831.789 0.4661.735 0.402
1.742 0.3481.775 0.3231.807 0.3281.820 0.3461.820 0.3491.818 0.3471.839 0.3411.877 0.3531.954 0.4431.968 0.528
1.937 0.6301.848 0.7071.749 0.7241.666 0.6931.625 0.6391.623 0. 5941.647 0.5741.682 0.6031.682 0.6341.670 0.686
1.633 0.7311.515 0.7771.456 0.7731.403 0.7641.308 0.7261.230 0.6661.179 0.5901.166 0.5571.153 0.5271.132 0.471
1.116 0.4121.102 0.3511.100 0.3181.116 0.2421.156 0. 2011.171 0.187
n
1.896 0.2121.880 0.2451.822 0.2741.781 0.2481.785 0.2181.826 0.1931.848 0.1941.874 0.1971.913 0.2091.961 0.241
2.057 0.4052.045 0.5691.912 0.7401.680 0.8021.477 0.6991.389 0.5401.382 0.4151.410 0.3401.466 0.2531.488 0.232
1.520 0.2031.543 0.1831.552 0.1761.567 0.1601.584 0.1431.604 0.1261.628 0.1101.663 0.0901.693 0.0901.710 0.094
1.751 0.0961.812 0.1071.848 0.1211.940 0.1811.956 0.2061.978 0.2432.007 0.3561.937 0.4581.841 0.4601.808 0.407
1.870 0.3911.953 0.4681.967 0.6271.856 0.7951.789 0.8331.634 0.8691.415 0.8091.301 0.6241.372 0.3501.457 0.311
1.527 0.3261.548 0.3521.548 0.3731.537 0.3661.548 0.3471.578 0.3421.617 0.3601.639 0.3911.654 0.4391.645 0.481
1.632 0.5241.572 0.6151.516 0.6511.447 0.6691.300 0.6431.230 0.5321.217 0.4531.219 0.4271.218 0.4001.225 0.358
1.244 0.3211.276 0.3081.292 0.3131.314 0.3621.245 0.4311.180 0.437
Jim
25.00024.3902 3.2 5622.7 722.22221.2 7720.83320.40 820. 00019.608
18. 86818. 51918.18217.85717.54417. 24116.94916.66716.12915. 873
15.38514.92514. 70614.28613. 88913. 51413. 15812.82112.65812. 500
12. 19511.90511. 76511.49411.44211. 36411. 23611.11110.98910.870
10.75310.63810.52610.41710. 38410.30910.20410. 1019.9019.804
9.7099.6159.5249.4349.3469.2599.1749.0919.0098.929
8.8508.6968.6218.5478.4038.2648.1308.0658.0007.874
7.7527.6347.5767.4637.3537.299
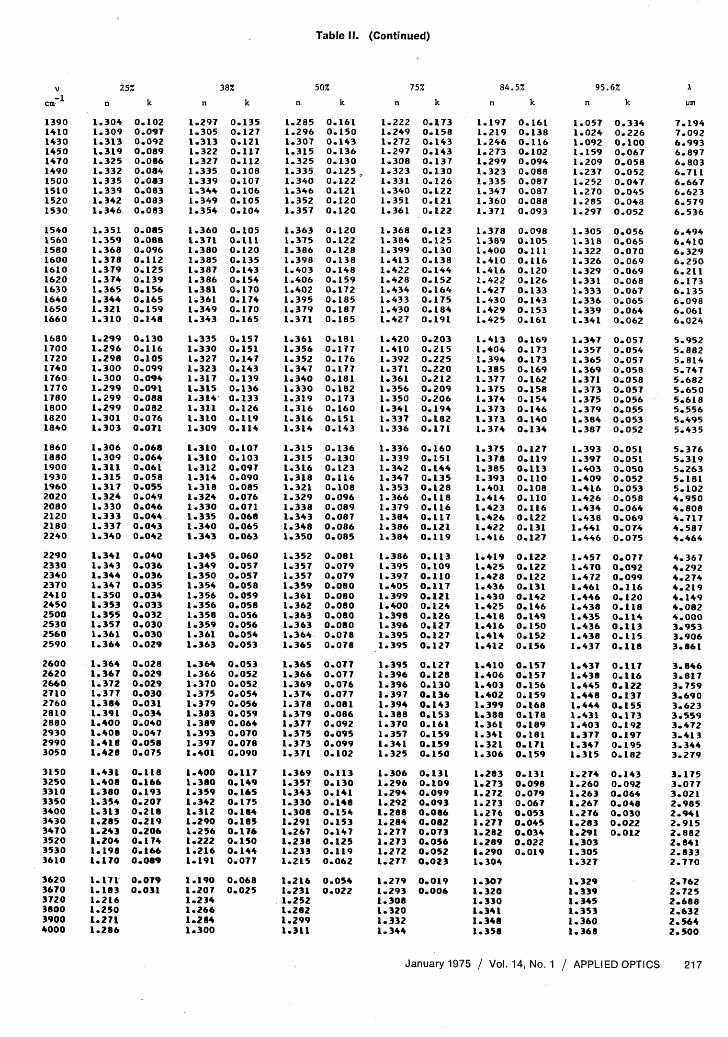
Table II. (Continued)
2 5% 38% 50%
n k n k n k
0.1020.0970.*0920.*0890.0860.0840.*0830.*0830.0830.083
0.0850.0880.0960.1120.1250.1390.1560.1650.1590.148
0.1300.1160.1050.0990.0940.*0910.0880.0820.0760.071
0.*0680.*0640.0610.0580.0550.0490.0460.*0440.0430.042
0.0400.0360.0360.0350.0340.0330.*0320.0300.0300.029
0.0280.0290.0290.*0300.0310.0340.0400.0470.0580.075
0.1180.1660.1930.2070.2 180.2 190.2060.1740.1660.089
0.0790.031
1.2971.3051.3131.3221.3271.3351.3391.3441.3491.3 54
1.3601.3711.3801.3851.3871.3861.3811.3611.3491.*343
1.3351.3301.3271.3231.3171.3151.314'
1.*3111.*3101.309
1.310.1.3 101.*3121.3141.3181.3241.3301.3351.3401.343
1.3451.3491.3501.3541.3561.3561.3581.3591.3611.363
1.*3641.*3661.3701.3751.*3791.3831.*3891.3931.3971.401
1.4001.3601.3591.*3421.*312L.*2901.*2561.2221.2161.191
1.*1901.2071.2341.2661.2 841.300
0.1350.1270.1210.1170.1120.1080.1070.1060.1050.104
0.1050.1110.1200.1350.1430.1540.1700.1740.1700.165
0.1570.1510.1470.1430.1390.1360. 1330.1260.1190.114
0.1070.1030.0970.0900.0850.0760.07 10.*0680.0650.063
0.0600.0570.0570.0580.0590.0580.0560.0560.0540.053
0.0530.0520.0520.0540.0560.0590.0640.0700.0780.090
0.1170.1490.1650.1750.16840.1850.1760.1500.1440.077
0.0680.025
1.2851.2961.*3071.3151.3251.3351.3401.3461.*3521.357
1.3631.3751.3861.3981.4031.4061.*4021.3951.*3791.371
1.*3611.3561.*3521.3471.3401.3301.3191.3161.3161.314
1.3151.3151.3161.3181.3211.3291.3381.3431.3481.*350
1.352L.3571.3571.359L.3611.*3621.3631.3631.3641.365
L.3651.3661.*3691.*3741.3781.3791.3771.3751.3731.37L
1.*3691.*357L.*3431.*3301.3081.2911.267L.238L.233L.215
1.2161.2311.*252
1.2991.311
0.1610.1500.1430.1360.1300.125,0.1220.1210.1200.120
0.1200.1220.1280.1380.1480.1590.1720.1850.1870. 185
0.1810.1770.1760.1770.1810.1820.1730.1600.1510.143
0.1360.1300.1230.1160.1080.0960.0890.0870.0860.085
0.0810.0790.0790.*0800.0800.0800.0800.0800.0780.078
0.0770.0770.0760.0770.*0810.0860.0920.0950.0990.102
0.1130.1300.1410.1480.1540.1530.1470.1250.1190.062
0.0540.*022
1.22 21.2491.2721.2971.3081.3231.3311.3401.3511.361
1.3681.3841.3991.4131.*4221.4281.4341.4331.4301.*427
1.4201.4101.3921.37 11.3611.3561. 3501.3411.3371.336
1.3361.3391.*3421.3471.3531.3661.*3791.3841.3861.384
1.3861.3951.3971.4051.3991.4001.3981.3961.3951. 395
1.3951.3961.3961.3971.3941.3881.3701.3571. 34 11.325
1.3061.2961.2941.2921.2881.2841.2771.2731.*272L.277
1.2791.2931.3081.*3201.3321.344
75% 84.5% 95.6%k n k n k
0.1730.1580.1430.1430.1370.1300.1260.L22
0.1210.122
0.12 30.1250.1300.1380.1440.1520.1640.1750.1840.191
0.2030.2 150.2250.2200.2 120.2090.2060.1940.1820.171
0.1600.151 0.1440.1350.1280.1180.1160.1170.1210.119
0.1L130.1090.1100.1170.1210.1240.1260.12 70.1270.127
0.1270.1280.1300.1360.1430.1530.1610.1590.1590.150
0.1310.1090.0990.0930.0860.0820.0730.0560.0520.023
0.0190.006
1 .1971.2191.2461.2 731.2991.3231. 3351.3471.3601.371
1.3781.3891.4001.410t.4161.4221.4271.4301.4291.42 5
1.4131.4041.3941.3851.*3771.3751.3741.3731.3731. 374
1.3751.3781.3851.3931.4011.4141.4231.4261.4221.416
1.4191.4251.4281.4361.4301.4251.4181.4161.4141.412
1.4101.*4061.4031.*4021.3991.3881. 3611.34 11. 3211.306
1.*2631.2731.2721.2731.276
1.2771.2821.2891.2901. 304
1.*3071.3201. 330L.*3411.*3481.358
0.1610.1380.1160.1020.0940.0880.0870.0870.0880.093
0.0980.1050.1110.1160. 1200.1260.1330.1430.1530.161
0.1690.1730.1730.1690.1620.1580.1540.1460.1400.134
0.1270.1190.1130.1100.1080.1100.1160.1220.1310.127
0.1220.1220.1220.1310.1420.1460.1t490.1500.1520.156
0.1570.1570.1560.1590.1680.1780.1890.1810.17 10.159
0.1310.0980.0790.0670.0530.0450.0340.0220.019
1.0571.0241.0921.1t591.2091.2371.2 521.2701.2851.297
1.3051.3181. 3221.3261.3291.33 11.3331.3361.3391.341
1.3471.3571.3651.3691.3711.3731.3751.3791.3841.387
1.3931.3971.4031.4091.4 161.4261.4341.4381.4411.446
1.4571.4701.472I *461
1.4461.*4381.4351.4361.4381.437
1.4371.4381.4451.*4481.4441.4311.4031.*3771.3471.315
1.*2741.2601.2631.2671.2761.283I *291
1.3031.3051.327
1.3291.3391.*3451.3531.3601.368
0.3340.2260.*1000.0670.0580.0520.0470.0450.0480.052
0.0 560.0650.0700.0690.0690.0680.0670.0650.*0640.062
0.0570.*0540.0570.0580.0 580.0570.0560.0550.0530.052
0.05t0.0510.0500.*0520.0530.0580.0640.0690.0740.075
0.0770.0920.0990.1160.1200.1180.1140.1130.1150.118
0.1170.1160.1220.1370.1550.1730.1920.1970.1t950.182
0.1430.0920.0640.0480.0300.*0220.012
Jrn
7.1947.0926.9936.8976.8036.7116.6676.6236.5796.536
6.4946.4106.3296.2506.2116.1736.1356.0986.0616.024
5.9525.8825.8145.7475.6825.*6505.6185.5565.*4955.435
5.3765.3195.2635.18 15.1024.9504.8084.7174.5874.464
4. 3674.2924.2744.2194.1494.0824.0003.9533.9063.86 1
3.8463.8173.7593.6903.62 33.5593.4723.4133.3443.279
3.1753.0773.02 12.9852.*9412.9152.8822.8412.8332.*770
2.7622.7252.6882.6322. 5642.500
January 1975 / Vol. 14, No. 1 / APPLIED OPTICS 217
cm.
1390141014301450147014901500151015201530
1540156015801600161016201630164016501660
16001700172017401760177017801800182018-40
1860188019001930196020202080212021802240
2290233023402370241024502500253025602590
2600262026602710276028102880293029903050
3150325033103350340034303470352035303610
362036703720360039004000
1.*3041.3091.3131.3191.3251.3321.3351.3391.3421.346
1.3511.3591.3681.3781.3791.3741.3651.3441.3211.310
1.2991.2961.2981.3001. 3001.*2991.2991.2991.3011.303
1.3061. 3091.3111.3151.3171.3241. 3301.3331. 3371.*340
1.*3411. 34 31.3441.3471.3501.3531.3551.3571.36 11.364
1.3641.3671.3721.3771.3841.39t1.4001.4081.4181.428
1.4311.*4081.3801.354t.3131.2851.*2431.2041.1981.170
I * 171'1.1831.2161.2501.2711.286
1.8
1.4
n(v)& .0
k(')0.6
0.2
X (m)9 JO 1 12 13
1.1 1.0 0.9 0.8 x10³
v (cm-')
Fig. 11. Comparison of present results (solid curves) with thoseof Remsberg (dashed curves) for a 75% solution.
1.8
.6n(V/)
1.4
(m)2.78 3.57 5.00 8.33 25.0
3.6 3.2 2.8 2.4 2.0 1.6 1.2 0.8 xic3
1 (cm)
Fig. 12. Comparison of present results for the refractive index n(solid curve) with those of Querry et al. (crosses) for a 25% solu-
tion.
klV)
0.3
0.I
2.78 3.57 5.00 833 25.0
3.6 3.2 2.8 2.4 2.0 1.6 1.2 0.8 X10³
V (cm)
following results: (1) crystalline H2SO4 would formif solutions with initial concentrations greater than95% H2 SO4 were cooled, and less concentrated solu-tions would result; (2) for solutions with initial con-centrations in the range between 75% and 93%, thecrystalline monohydrate H2SO4 H20 would beformed in equilibrium with solutions of altered con-centrations; (3) in the initial concentration range be-tween 26% and 75%, all solutions would remain liquidwithout any change in concentration; and (4) for ini-tial concentrations below 26%, ice in equilibrium withsolutions of altered concentration would be formed.Under equilibrium conditions, only solutions in theranges 26-75% and 93-95% H2SO4 would remain liq-uid as the temperature is reduced from 300 K to 250K.
If the particles in the Venus clouds are actually liq-uid sulfuric acid droplets, it is difficult to understandwhy energetically favored agglomeration of the drop-lets does not occur; the sharply peaked distribution,reported by Hansen and Hovenier, indicates that ag-glomeration is inhibited. Another interesting ques-tion involves the internal pressure P = Po + 2cr/r ofliquid droplets; use of Timmerman's20 values of sur-face tension ai gives a total internal pressure P of aliquid droplet as approximately 1 atm for spherical
Table 111. Comparison of n Values in the Optical Region
Wave- Sulfuric Acid Solutions at 250 Klength Venus(nm) cloudsa 50% 75% 8 4. 5 %b 9 5.6 %b 70.5%c
990 1.43 1.40 1.44 1.44 1.44 1.43548 1.44 1.41 1.445 1.445 1.45 1.44364 1.46 1.43 1.47 1.48 1.47 1.46
a Hansen and Hovenier.b Supercooling required.
Interpolated values.
Percent H2SO4 by weight
290
270
501
T K)2301
Fig. 13. Comparison of present results for the absorption index k(solid curve) with those of Querry et al. (crosses) for a 25% solu-
tion.
The assumption of supercooling solutions to 250 Kis highly questionable. Figure 14 gives the phase-equilibrium curve between solutions of the indicatedcomposition and the indicated crystalline solids. Ifwe start with solutions at 300 K and assume thatcooling occurs under equilibrium conditions, weshould expect that cooling at 250 K would have the
2101
1901
Mole Percent H2S04
Fig. 14. The melting-point curve for H 2 SO4 solutions at a pres-sure of 1 atm.
218 APPLIED OPTICS / Vol. 14, No. 1 / January 1975
~~~~~~~~~I I I~~~~~~~~~~~~~~~~~~~~~~~~~~~~~~~~~~~~~
- - PRESENT WORK (KK)--- REMSBERG (ATR)
_ I I
I I I . I I~~~~~~~~~~~
I I j I T 1 - -- I
25%
+1/ I I I I I
. . . . I I . � I I I I
I I I I i I I I
25%
I
I I , I , I , I , I , I , I , I �

particles in a region where the external pressure Pois only 50 mbars. The possibility of particles withsolid nuclei cannot be entirely ignored; if the solidnuclei consisted of crystalline hydrates of H2SO4, thedifference in n between the solid nucleus and thesurrounding liquid might be so small as to escape de-tection in the analysis of scattering and polarization.The presence of solid nuclei might also serve to in-hibit agglomeration.
Spectra of Venus in the intermediate infrared, asobserved from ground-based observatories, has beenlimited to regions observable through the earth's at-mospheric windows. Young 21has recently comparedobserved Venus spectra with Remsberg's laboratorydata2 in the 800-1200 cm-' window; Young reportssimilarity between the observed spectra and the spec-tra predicted on the basis of a model involving liquiddroplets of sulfuric acid with a concentration of 75%.Pollack22 and his associates have recently comparedVenus spectra in the 3-Atm region, as observed fromhigh altitude jet aircraft, with predictions based uponpreliminary values of our optical constants; concen-trations of 75% and 90% seem to be compatible withthe observed spectrum.
Improved intermediate infrared spectra of Venuscould provide definitive evidence regarding the possi-bility of sulfuric acid as a major component of theplanet's cloud cover. We hope that our presentvalues of optical constants will be useful in the inter-pretation of future Venus spectra in both the solar-reflectance and thermal-emission regions. If futureobservations show that sulfuric acid is indeed thedominant component and the observations can fur-ther narrow the ranges of possible H2SO4 concentra-tions, further laboratory studies of H2SO4 solutionswithin these ranges should be conducted at reducedtemperatures.
On the basis of our present work, along with the as-sumption that the Venus clouds do consist of spheri-cal liquid droplets of sulfuric acid at 250 K, our bestestimate is that the H2SO4 solution has a concentra-tion of 70.5%. However, some of the difficulties out-
lined above must be resolved before our conclusioncan be seriously regarded. Meanwhile, we also ex-press the hope that our present work may prove use-ful to investigations of the earth's major stratospher-ic aerosol.
We gratefully acknowledge helpful discussionswith J. B. Pollack and J. W. Hovenier. This workwas supported in part by the National Aeronauticsand Space Administration.References1. J. M. Rosen, J. Appl. Meterol. 10, 1044 (1971).2. E. E. Remsberg, J. Geophys. Res. 78, 1401 (1973).3. J. Neumann, J. Atmos. Sci. 30, 95 (1973).4. A. T. Young, Icarus 18, 564 (1973).5. G. T. Sill, Commun. Lun. Plan. Lab. 9, 191 (1972).6. J. E. Hansen and J. W. Hovenier, J. Atmos. Sci. 31, 1137
(1974).7. A. N. Rusk, D. Williams, and M. R. Querry, J. Opt. Soc. Am.
59, 1299 (1971).8. G. M. Hale, M. R. Querry, A. N. Rusk, and D. Williams, J. Opt.
Soc. Am. 62, 1103- (1972).9. C. W. Robertson and D. Williams. J. Opt. Soc. Am. 61, 1316
(1971).10. J. W. Schaaf and D. Williams, J. Opt. Soc. Am. 63, 726 (1973).11. C. W. Robertson, B. Curnutte, and D. Williams, Mol. Phys. 26,
183 (1973).12. K. F. Palmer and D. Williams, J. Opt. Soc. Am. 64, 1107
(1974).13. E. K. Plyler and E. S. Barr, J. Chem. Phys. 2, 306 (1936).14. P. A, Giguere and R. Savoie, Can. J. Chem. 38, 2467 (1960).15. J. Timmermans, The Physico-Chemical Constants of Binary
Systems in Concentrated Solutions (Interscience, New York,1960) Vol. 4, pp. 569-571.
16. M. R. Querry, R. C. Waring, W. E. Holland, L. M. Earls, M. D.Herrman, W. P. Nijm, and G. M. Hale, J. Opt. Soc. Am. 64, 39(1974).
17. M. Davies, G. W. F. Pardoe, J. Chamberlain, and H. A. Gebbie,Trans. Faraday Soc. 66, 273 (1970).
18. M. S. Zafur, J. B. Hasted, and J. Chamberlain, Nature: Phys.Sci. 243, 106 (1973).
19. Ref. 15, pp. 561-562.20. Ref. 15, pp. 568-569.21. A. T. Young, Science 183, 407 (1974).22. J. B. Pollack (private communication).
Arctic Bulletin
Arctic Bulletin, Vol. 1, No. 4, published by NSF for theInteragency Arctic Research Coordinating Commit-tee, contains articles on the Arctic Ice Dynamics JointExperiment, the Beaufort Sea Symposium, theEnvironmental Data Service's arctic informationsystem, and other subjects. Single copies or subscrip-tions to the quarterly magazine are free from the Of-fice of Polar Programs, NSF, Wash., D.C. 20550.
January 1975 / Vol. 14, No. / APPLIED OPTICS 219