Optical Code Division Multiple Access · Optical Code Division Multiple Access ABSTRACT Optical...
92
Optical Code Division Multiple Access ONG CHIA JYE A project report submitted in partial fulfillment of the Requirements for the award of the degree of Bachelor of Engineering (Hons) of Electronics and Communication Engineering Faculty of Engineering and Science University Tunku Abdul Rahman MAY 2011
Transcript of Optical Code Division Multiple Access · Optical Code Division Multiple Access ABSTRACT Optical...

Optical Code Division Multiple Access
ONG CHIA JYE
A project report submitted in partial fulfillment of the
Requirements for the award of the degree of
Bachelor of Engineering (Hons) of Electronics and Communication Engineering
Faculty of Engineering and Science
University Tunku Abdul Rahman
MAY 2011

ii
DECLARATION
I hereby declare that this project report is based on my original work except for
citations and quotations which have been duly acknowledged. I also declare that it
has not been previously and concurrently submitted for any other degree or award at
UTAR or other institutions.
Signature : _________________________
Name : _________________________
ID No. : _________________________
Date : _________________________

iii
APPROVAL FOR SUBMISSION
I certify that this project report entitled “Optical Code Division Multiple Access”
was prepared by ONG CHIA JYE has met the required standard for submission in
partial fulfillments of the requirements for the award of Bachelor (Hons.) of
Electronic and Communication Engineering at University Tunku Abdul Rahman.
Approved by,
Signature : _________________________
Supervisor : Mr Shee Yu Gang
Date : _________________________

iv
The copyright of this report belongs to the author under the terms of the
copyright Act 1987 as qualified by Intellectual Property Policy of University Tunku
Abdul Rahman. Due acknowledgement shall always be made of the use of any
material contained in, or derived from, this report.
© 2011, Ong Chia Jye. All right reserved.

v
Specially dedicated to
my beloved parent who nurture me to who I am today

vi
ACKNOWLEDGEMENTS
I would like to thank everyone who had contributed to the successful completion of
this project. I would like to express my gratitude to my research supervisor, Mr Shee
Yu Gang, for his invaluable advice, guidance and his enormous patience throughout
the development of the research.
In addition, I would also like to express my gratitude to my loving parent and
friends who had helped and given me encouragement.
vii
OCDMA
Optical Code Division Multiple Access
ABSTRACT
Optical communication for multiple access has become the mainstream for
researchers as the utility rate in optical communication nowadays is increasing
rapidly. As multiple accesses, the more users uses the network, date rate, capacity
and security have become the critical issue for the optical system. The maturity of
wireless communication with code-division multiple access (CDMA) technique have
motivated the integration of CDMA technique in to optical network, as it is much
more attractive since it allows multiple users in a local area network (LAN)
environment to access the same fiber channel asynchronously at all times.
Furthermore, the robustness of CDMA technique in wireless network is yet to prove
that OCDMA offers security advantages over other multiple access systems by
maintaining the quality of services.
In this thesis, the study on OCDMA is based on a conference paper that is
mainly demonstrating an experiment on Optical Spectral-Amplitude Code (SAC)
OCDMA structured with circulator free fiber bragg gratings array. It demonstrates a
three-user SAC-OCDMA with the Walsh Hadamard code, by describing every detail
in his experiment. That is why the first simulation on SAC-OCDMA is easily
simulated. The simulation shows an error free transmission on all the three users,
with a bit rate of 200mbps, and a transmission length that is up to 10km. From that I
found out that the Fiber Bragg Gratings array shows an important role in the SAC-
OCDMA network.
Finally, an increase of the number of users up to seven users in the SAC-
OCDMA network, by changing the coding methods is achieved, studied and
simulated. As the results came out are investigated and discussed.
viii
TABLE OF CONTENTS
DECLARATION ii
APPROVAL FOR SUBMISSION iii
ACKNOWLEDGEMENTS vi
ABSTRACT vii
LIST OF TABLES xi
LIST OF FIGURES xii
LIST OF SYMBOLS / ABBREVIATIONS xv
LIST OF APPENDICES xvi
CHAPTER
1 INTRODUCTION 17
1.1 Background 17
1.2 Motivation 22
1.3 Aims and Objective 22
1.4 Problem Statement 23
1.5 Dissertation Outline 23
2 LITERATURE REVIEW 25
2.1 Overview 25
2.2 Intensity Modulation (IM) Formats 25
2.2.1 Non-return to Zero On/Off Keying (NRZ-OOK) 25
2.2.2 Return to Zero On/Off Keying (RZ-OOK) 26
2.3 OCDMA Encoding methods 27
2.4 OCDMA match filtering and coherent coding/ decoding 28
2.5 OCDMA match filtering and Incoherent Network 30
2.5.1 Delay Line Network 31
2.5.2 Ladder Network Encoder 32
2.5.3 Tunable Delay Lines 33

ix
2.6 Implementation of Fiber Bragg Grating technology in
OCDMA 34
2.6.1 Incoherent WH/TH Optical Encoder and Decoder
Using FBGs 34
2.7 Spectral–Amplitude Incoherent Optical Encoder and Decoder
37
2.8 OCDMA Optical Code 40
2.9 Prime codes 40
2.10 M- Sequence code 41
2.11 Walsh-Hadamard Codes 42
2.12 Fiber Bragg Gratings 43
3 METHODOLOGY 45
3.1 Overview 45
3.2 OptiSystem 45
3.3 Intensity Modulation Network 47
3.4 Spectral Amplitude Coding (SAC) OCMDA 48
3.5 SAC Optical coding and decoding 51
3.5.1 Walsh Hadamard code 52
3.5.2 M-Sequence Code 53
4 RESULTS AND DISCUSSIONS 55
4.1 Overview of Result and Discussion 55
4.2 Intensity modulation 55
4.2.1 Compare between the RZ and NRZ modulation
format 56
4.2.2 Broadband light source for intensity modulation 58
4.3 SAC-OCDMA optical encoding 59
4.3.1 3 Users SAC-OCDMA Optical Encode 60
4.3.2 7 Users SAC-OCDMA Optical Encode 62
4.4 Full characteristic simulation on 3 Users SAC OCDMA 68
4.4.1 One User network with different coding implement
68

x
4.4.2 Simulation on number of users in the OCDMA
network 70
4.4.3 Effects of FBGs cut off frequency bandwidth to the
network 71
4.4.4 The effect of the changes of Room temperature to
the network 72
4.4.5 Effect of deflects FBG to the OCDMA network 74
4.5 Full characteristic simulation on 7 Users SAC-OCDMA with
Walsh Hadamard coding method 76
4.5.1 One user network with different Walsh Hadamard
coding implement 76
4.5.2 Simulation of number of Users in the network 77
4.5.3 The effects of FBG cut off frequency bandwidth to
the network 78
4.5.4 The effects of FBG reflectivity to SAC-OCDMA
network 79
4.6 Full characteristic simulation on 7 users SAC-OCDMA using
M-sequence code. 81
4.6.1 One User network with different M-sequence coding
implement 81
4.6.2 The effects of FBG cut off frequency bandwidth to
the SAC-OCDMA network 82
4.6.3 The effects of FBG reflectivity to SAC-OCDMA
with M-sequence code network 83
5 CONCLUSION AND RECOMMENDATIONS 84
5.1 Conclusion 84
5.2 Recommendations 85
5.3 Future Work 86
REFERENCES 87
APPENDICES 90

xi
LIST OF TABLES
TABLE TITLE PAGE
Table 2-1 Comparison of Ladder CDMA network using
Coherent and Incoherent Decoding 30
Table 3-1 Bipolar Walsh Hadamard code with length of 4 53
Table 3-2 Bipolar Walsh Hadamard code with length of 8 53
Table 4-1 BER for both RZ and NRZ for different optical
fiber length 56
Table 4-6 Encoded Optical Signal from Spectrum analyzer
for 7 Users OCDMA for M- Sequence code 66
Table 4-7 The BER and Eye diagram of one to one
transmission with different coding applied 69
Table 4-8 BER gain by changing the numbers of Users in the
network 70
Table 4-9 BER gain by changing the cut off frequency
bandwidth 71
Table 4-11 Deflects FBGs on the encoder part 75
Table 4-13 Deflects FBGs on the encoder and decoder part 75
Table 4-14 BER gain on the specific Walsh Hadamard code 77
Table 4-15 Effect of number of users in the SAC-OCDMA
network to the BER 78
Table 4-16 Effects of FBG cut off frequency bandwidth on the
BER 78
Table 4-17 The BER for different FBG reflectivity and cut off
frequency bandwidth 80
Table 4-18 BER gain on the specific M- sequence code 81
Table 4-19 Effects of FBG cut off frequency bandwidth on the
BER 82

xii
LIST OF FIGURES
FIGURE TITLE PAGE
Figure 1-1 Schematic of TDMA 18
Figure 1-2 Schematic of WDMA 18
Figure 1-3 Spread Spectrum technique with CDMA network [7]. 19
Figure 1-4 Coherent FH-OCDMA techniques [7] 20
Figure 1-5 FE-OCDMA technique [7]. 21
Figure 1-6 DS-OCDMA technique [7]. 21
Figure 2-1 NRZ modulation scheme: a) Block diagrams of NRZ
transmitter (b) waveform for intensity I(t), (c)
phase 26
Figure 2-2 RZ modulation scheme: a) Block diagrams of NRZ
transmitter (b) waveform for intensity I(t), (c)
phase 27
Figure 2-3 1-channel coherent decoding network 28
Figure 2-4 2-channel coherent decoding network 29
Figure 2-5 Fiber Delay Lines based optical encoder and decoder
for DS-OCDMA 32
Figure 2-6 Ladder Network Encoder [13] 33
Figure 2-7 OCDMA network using tunable delay lines [13]. 34
Figure 2-8 Fixed WH/TS optical encoder/decoder based on serial
FBG [25] 35
Figure 2-9 WH/ TS encoder/ decoder based on parallel FBGs [25]
36
Figure 2-10 Tune able WH/TS encoder/ decoder based on parallel
FBGs [25] 36
Figure 2-11 FE-OCDMA implementation using bulk optics [25] 37

xiii
Figure 2-12 Block diagram of Spectral amplitude encoding
OCDMA system with FBGs [25]. 38
Figure 2-13 Encoder and decoder using a linear array of FBGs
for SAE OCDMA [25] 39
Figure 2-14 r-stage linear feedback shift register 42
Figure 2-15 Common types of fiber gratings as classified by
variation of the induced index change along the
fiber axis, including (a) uniform with positive-only
index change, (b) Gaussian-apodized, (c) raised-
cosined-apodized with zero-dc index change, (d)
chirped, (e) discrete phase shift (of π), and (f)
superstructure. 44
Figure 3-1 Intensity Modulation Network with NRZ modulation
format 47
Figure 3-2 Intensity Modulation Network with RZ modulation
format 47
Figure 3-3 FBG encoder and decoder in the OCDMA network 49
Figure 3-4 SAC OCDMA 3 users network 50
Figure 3-5 SAC OCDMA 7 users network 50
Figure 3-6 Classification of OCDMA networks 51
Figure 3-7 Walsh Hadamard matrix codes for 3 users OCDMA
network 52
Figure 3-8 Walsh Hadamard matrix codes for 7 users OCDMA
network 52
Figure 3-9 3 stage linear feedback shift register 54
Figure 4-1 BER compare between RZ and NRZ in term of optical
fiber length 56
Figure 4-2 Optical Spectrum of White light source (left) Optical
Spectrum of CW laser (right) 58
Figure 4-3 Broadband light source filtered by an FBG with a cut
off frequency of 1550.1nm 60
Figure 4-4 White light source and FBGs setting 62
xiv
Figure 4-5 White light source and FBGs for 7 users Walsh
Hadamard Codes 65
Figure 4-6 White light source and FBGs for 7 users M-sequence
Codes 66
Figure 4-7 A graph of BER versus FBG cut off frequency
bandwidth 72
Figure 4-8 A graph the BER effected by temperature 73
Figure 4-9 FBG cut off frequency shift out of the broadband light
source frequency 74
Figure 4-10 Deflects FBG in OCDMA system 76
Figure 4-11 Effects of FBG cut off frequency bandwidth on the
BER 79
Figure 4-12 (a) FBG with a reflectivity of 99% (b) FBG with a
reflectivity of 99.98% 80
Figure 4-13 Effects of FBG cut off frequency bandwidth on the
BER 82
xv
LIST OF SYMBOLS / ABBREVIATIONS
BER Bit Error Rate
BERT Bit Error Rate Tester
CDMA Code Division Multiple Access
CW Continuous-Wave
DS-OCDMA Direct Sequence Optical Code Division Multiple Access
FBG Fiber Bragg Grating
FDMA Frequency Division Multiple Access
FE-OCDMA Frequency Encoded Optical Code Division Multiple Access
FH-OCDMA Frequency Hopped Optical Code Division Multiple Access
LED Light Emitting Diode
NRZ Non Return to Zero
OCDMA Optical Code Division Multiple Access
OSA Optical Spectrum Analyzer
RZ Return to Zero
SMF Single Mode Fiber
TDMA Time Division Multiple Access
WDMA Wave Division Multiple Access

xvi
LIST OF APPENDICES
APPENDIX TITLE PAGE
APPENDIX A: Simulation Environments 90
17
CHAPTER 1
1 INTRODUCTION
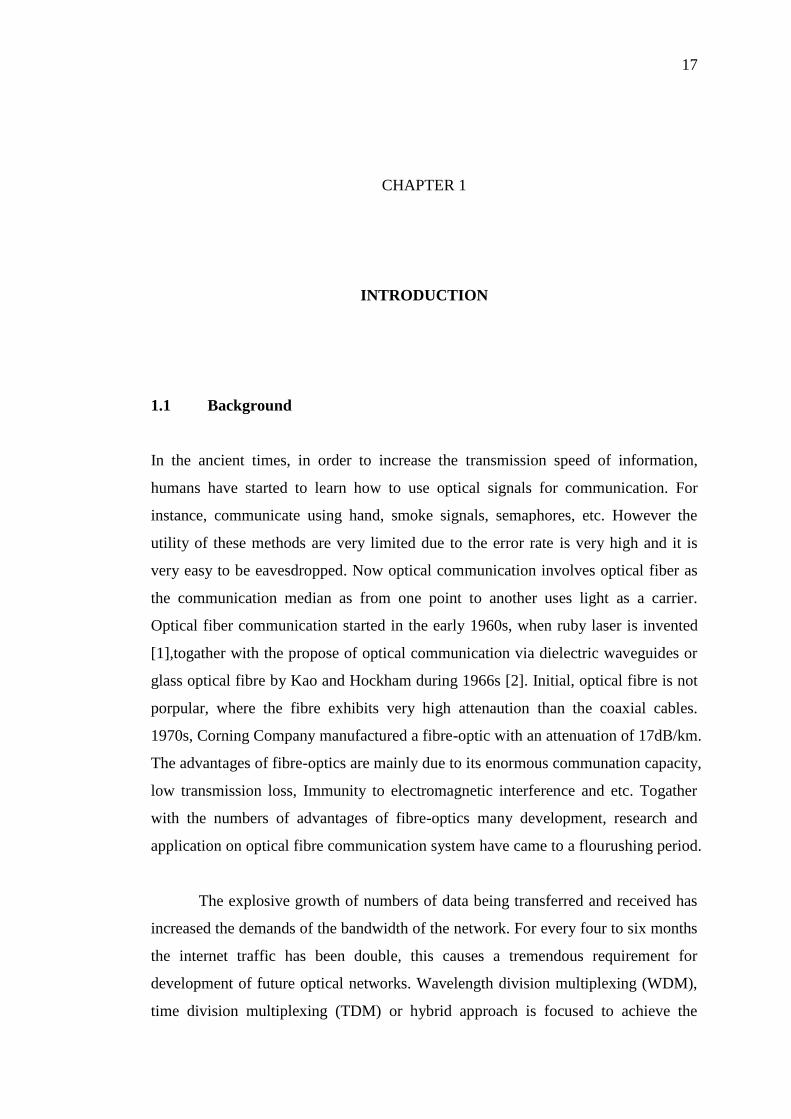
1.1 Background
In the ancient times, in order to increase the transmission speed of information,
humans have started to learn how to use optical signals for communication. For
instance, communicate using hand, smoke signals, semaphores, etc. However the
utility of these methods are very limited due to the error rate is very high and it is
very easy to be eavesdropped. Now optical communication involves optical fiber as
the communication median as from one point to another uses light as a carrier.
Optical fiber communication started in the early 1960s, when ruby laser is invented
[1],togather with the propose of optical communication via dielectric waveguides or
glass optical fibre by Kao and Hockham during 1966s [2]. Initial, optical fibre is not
porpular, where the fibre exhibits very high attenaution than the coaxial cables.
1970s, Corning Company manufactured a fibre-optic with an attenuation of 17dB/km.
The advantages of fibre-optics are mainly due to its enormous communation capacity,
low transmission loss, Immunity to electromagnetic interference and etc. Togather
with the numbers of advantages of fibre-optics many development, research and
application on optical fibre communication system have came to a flourushing period.
The explosive growth of numbers of data being transferred and received has
increased the demands of the bandwidth of the network. For every four to six months
the internet traffic has been double, this causes a tremendous requirement for
development of future optical networks. Wavelength division multiplexing (WDM),
time division multiplexing (TDM) or hybrid approach is focused to achieve the

18
Tbit/s aggregate channel capacity. Multiplexing schemes are to manage the
transmission link between one user, where else multiple access are to manage the
transmission link between multiple users. Time Division Multiple Access (TDMA)
is a multiple access method to divides time axis into different time slots; where each
data packet or burst is assigned to a certain time slot. According to figure 1.1 the
intervals length ΔT has to be inserted between successive slots in order to avoid
interference. Frequency Division Multiple Access (FDMA) is the frequency axis is
divided in to different sub band for the data is distributed on it [3].According to
figure 1.2 Nf is the sub bands that is divided by the frequency axis. With the
combination of TDMA and FDMA, Code Division Multiple Access (CDMA) is
proposed by spectrally spread the data stream with specific sequences called
spreading codes as CDMA allows simultaneous access on the channel in same
frequency.
Figure 1-1 Schematic of TDMA
Figure 1-2 Schematic of WDMA

19
Investigation of CDMA for over 20 years of application in optical and
wireless network, the multiplexing scheme could potentially achieve a throughput of
the rate of Tbit/s. The roots of CDMA are found in Spread Spectrum communication
techniques [4] . During World War , Spread Spectrum communication is applied on
the military communication; as the information can be transmitted in a very rigid
enviroment and mainly Spread Spectrum communication is very secure. Spread
Spectrum was developed during the mid 1950s, where the transmission can
overcome the rigid restrictions in radio bandwidth allocation [5] [6]. A normal
Spread Spectrum communication started on transmitting a noise-like signal to the
receiver which claims as a spreading action, and the received signal is hard to be
recovered as if the receiver side is not authorized. That‟s why Spread Spectrum is
widely being used on military application during the old days. Figure 1.3 shows a
schematic drawing of a wireless spread spectrum network. The conventional PCN
and GSM networks is replace by CDMA. By allocating a unique code to each
individual user and distinguish them from other users CDMA is done by code
division multiplexing and demultiplexing.
Figure 1-3 Spread Spectrum technique with CDMA network [7].
Optical CDMA started during the late 1970s in the area of fiber delays lines
for optical processing that is based on incoherent and coherent optical match filtering
[8]. Coherent OCDMA is based on using interference of the incoming optical signals
to convert electric field values into intensity variations that can then be detected by a
photo receiver [9].Thus it enables cancellation of the undesired user channels
through destructive interference. Incoherent OCDMA detects the signals by
superposition the incoming optical signal. Incoherent OCDMA is impossible to
achieve perfect cancellation between interfering channels, as the optical intensity is a

20
non-negative value. But the benefits of incoherent OCDMA is the system enables the
use to inexpensive broadband source such as light emitting diodes (LED) and
amplified spontaneous noise (ASE). Furthermore, it reduces the sensitivity to both
environmental changes and polarization problems.
Optical encoding/decoding can be performed in frequency domain and time
domain. As for the OCDMA that‟s performing in time domain, it is known as the
frequency –hopping FH-OCDMA. A modulated information signal is changed over a
wide set of discrete frequencies according to a well-defined pseudo random code
sequence. In order to receive the signal, a narrowband frequency filter is
incorporated within the receiver whose tuning sequence is synchronized to that of the
transmitter.
Figure 1-4 Coherent FH-OCDMA techniques [7]
Frequency encoded FE-OCDMA is which the broad spectral bandwidth of
the information signals encoded in to code consisting of a number of discrete spectral
components. This approach is also known as the spectral encoding OCDMA. From
figure 1.5, an amplitude /phase modulated spectral code that is having individual
frequency component is sliced from an input broadband signal. As result, high
intensity input pulse is transform into a long duration, low intensity frequency
encoded signal in time domain.
Direct sequence DS-OCDMA is an alternative to the FH-OCDM A and FE-
OCDMA that performed in the time domain. In DS-OCDMA, a sequence of pulse is
to define each data bit that is transmitted. The individual pulses comprising the coded
bit are commonly referred to as chips. The user might need a receiver that is
designed to unambiguously recognize data bits of the given specific address code,
21
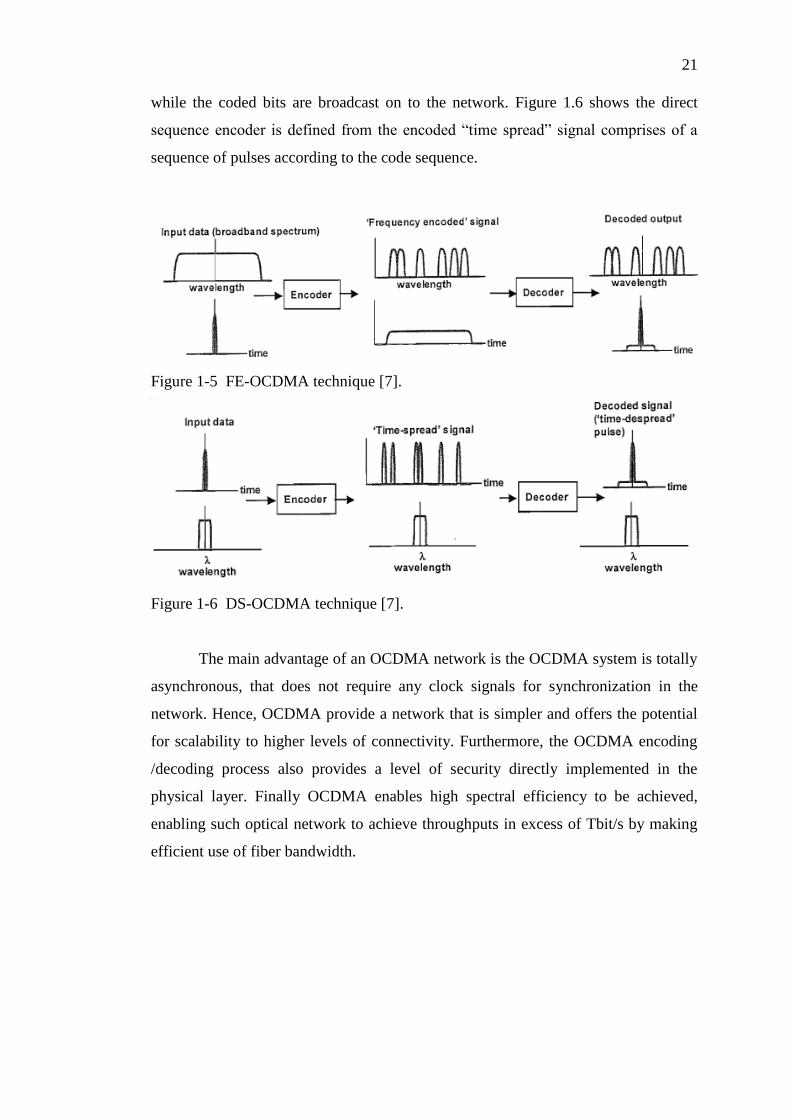
while the coded bits are broadcast on to the network. Figure 1.6 shows the direct
sequence encoder is defined from the encoded “time spread” signal comprises of a
sequence of pulses according to the code sequence.
Figure 1-5 FE-OCDMA technique [7].
Figure 1-6 DS-OCDMA technique [7].
The main advantage of an OCDMA network is the OCDMA system is totally
asynchronous, that does not require any clock signals for synchronization in the
network. Hence, OCDMA provide a network that is simpler and offers the potential
for scalability to higher levels of connectivity. Furthermore, the OCDMA encoding
/decoding process also provides a level of security directly implemented in the
physical layer. Finally OCDMA enables high spectral efficiency to be achieved,
enabling such optical network to achieve throughputs in excess of Tbit/s by making
efficient use of fiber bandwidth.

22
1.2 Motivation
Fiber Optics technology has becomes the new leads for digital communication during
this decade. From communication systems that‟s hybrid between optical domain and
electrical domain, till a full communication system undergoes only optical domain
humans tends to puts a lot of effort on researching, testing and implementing. As is
the demand for speed, data rate, throughput growth rapidly.
As many researches are conducted throughout the world, optical fibre
communication has become the renowned technology. As an undergraduate student,
I‟m keen to learn on the Optical Code Division Multiple Access as before I have a
simple background on Code Division Multiple Access. OCDMA reception is based
on optical light (intensity) converted to an electrical signal in a photo-detector rather
than amplitude (electric field) detection as in radio CDMA.
`For a well-designed OCDMA network, it eliminates channel contention.
This mean that the upstream and downstream connection can be established
asynchronously with no collision or blocking and the interference is well controlled.
Besides that, the OCDMA network is able to supports a large number of users than
TDMA or WDMA that exploit just time or wavelengths dimension, especially for
2D-OCDMA system exploit time and wavelength dimension that having a larger
number codes. Furthermore, OCDMA network may accommodate additional users
with less cost and complexity. Finally, OCDMA exhibits a higher level of security,
where the encryption is done on the optical domain and not at the electrical level.
1.3 Aims and Objective
In fibre optics communication system, various OCDMA systems have been proposed
and improved. In this report, three main objectives are listed as:
To study and understand the operating principles of OCDMA mainly on
SAC-OCDMA.
To study and understand the two coding methods used in incoherent FE-
OCDMA system such as the m-sequence code and Walsh – Hadamard code.

23
To simulate FE- OCDMA base on two kinds of coding methods in
Optisystem and perform the full characterization on both coding methods.
1.4 Problem Statement
Designing various OCDMA formats is the main objective, to perform the OCDMA
system, an adequate and insight knowledge has to be strong. Therefore the basic
operating principles of OCDMA must be studied and understood.
The concept and operating principle of FE-OCDMA or spectral- amplitude
coding (SAC- OCDMA) is studied. A full characterization of the FE- OCDMA is
simulated, in the sense of optical fiber length, Fiber Bragg-grating condition, various
types of coding methods and also number of users in the network.
With the help of the simulation tools, Optisystem, it tends to faster the speed
of investigation of various situations and environment of OCDMA. From that the
simulation software Optisystem, need to be familiarized. Finally the various
architecture of OCDMA will be simulated and studied.
1.5 Dissertation Outline
Chapter one gives a brief introduction to optical communication system. Short
introduction on multiple access communication system background and Optical Code
Division Multiple Access communication system background is introduced and
illustrated with diagrams. With relevant to the report, the motivation, aim and
objective, and problem statement are discussed based on personal finding.
Chapter two will focus on literature review- introduces the basic concept on
fiber optic communication in term of the OCDMA system. The basic characteristic
of intensity modulation formats and OCDMA system and optical codes are briefly
described.
Chapter three will then focus on methodology. Optisystem is the software
used to simulate the intensity modulation network and SAC-OCDMA network. In
this chapter, the studied of SAC OCDMA network is implemented with a schematics

24
diagram with a full configuration consisting optical encoder and decoder, formation
of optical codes.
Chapter four consists of results and discussion of the studied SAC-OCDMA
system. The SAC OCDMA system is characterized in different kinds of situation.
For example number of users, coding methods, Fiber Bragg Grating situation, and etc.
Chapter five discuss about the conclusion and recommendation of the whole
simulation and the thesis. Basically the characterization of SAC-OCDMA system are
concluded and ways to improve my understanding on OCDMA system.

25
CHAPTER 2
2 LITERATURE REVIEW
2.1 Overview
The main focus of this chapter is to introduce optical communication systems
including the basic intensity modulation optical communication based on only one
transmitter and one receiver. For multiple access networks part, chapter two mainly
focusing on OCDMA networks on various methods and principle and summarized of
various optical codes and their characteristic.
2.2 Intensity Modulation (IM) Formats
Intensity modulation is a very basic optical communication system where the
data is carried in the intensity of light. Digital signal of binary „1‟ and „0‟ is
represented by the changing of high to low power from the light source. Two types
of optical modulation formats in intensity modulation are the Non-return to Zero
On/Off Keying (NRZ-OOK) and Return to Zero On/Off Keying (RZ-OOK). Both of
these modulations are introduced on the next section.
2.2.1 Non-return to Zero On/Off Keying (NRZ-OOK)
The simplest way to generate an optical modulation is using NRZ-OOK. It is
normally known as NRZ. Figure 2.1 illustrates the basic schematic configuration of a
NRZ transmitter, whereby the input signal data is modulated in to the optical laser

26
with an external intensity modulator. The intensity modulator can be either Mach-
Zehnder or electro- absorption modulator, which converts the electrical signal to
optical signal at the same date rate.
Figure 2.1a shows the basic block diagram configuration for NRZ transmitter,
whereby the signal is modulated into the laser source with a Mach-Zehner Modulator
(MZM). MZM converts the electrical signal to optical with the same data rate.
Figure 2-1 NRZ modulation scheme: a) Block diagrams of NRZ transmitter (b)
waveform for intensity I(t), (c) phase
For the receiver part of IM system, a direct detection is used. Where a
photodiode is used to detect the intensity of the optical signal; and converts optical
signal to electrical signal.
2.2.2 Return to Zero On/Off Keying (RZ-OOK)
Return to Zero (RZ) optical modulation format show a smaller bit period of optical
signal. Usually a clock signal with the same data rate as electrical signal is used to
carve RZ shape of optical signals.
Figure 2.2a shows the basic block diagram configuration for NRZ transmitter,
the RZ optical signal is generated by two cascading MZMs, whereby the first MZM
modulate the optical light source with data to generate NRZ optical signal; where

27
else the second MZM modulated the NRZ optical signal with a pulse carver to
generate the RZ optical signal. From figure 2.2(b) we observe that the main
difference between NRZ signal and RZ signal is when the representation of binary
„11‟. The electrical signal of NRZ (figure 2.1(b)) will remain the same amplitude,
while the electrical signal of RZ (figure 2.2(b) its amplitude will drop to zero before
presenting the next binary „1‟.
Figure 2-2 RZ modulation scheme: a) Block diagrams of NRZ transmitter (b)
waveform for intensity I(t), (c) phase
The receiver part for RZ modulation is same with the NZR modulation. As
the RZ format require a slightly more complex transmitter structure but are generally
more robust to Intersymbol interference (ISI) [10]. For RZ modulation it is better on
long distance, due to the „return – to-zero‟ characteristic, RZ format exhibits better
tolerance to nonlinearity than NRZ format due to the narrow pulse width that the RZ
format is having.
2.3 OCDMA Encoding methods
The encoding theory and encoding technology of OCDMA have been studied and
developed thoroughly and many research accomplishments have been made, since
the mid 1980‟s [11]. The encoding approaches of OCDMA can be divided into
categories based on the choice of different light sources, different detection schemes
and encoding approaches. For light sources there is coherent and incoherent light
source, narrow and broadband light source. OCDMA can be divided into two broad
categories, which are coherent OCDMA system and incoherent OCDMA system.

28
2.4 OCDMA match filtering and coherent coding/ decoding
Around the 70‟s coherent optical coding and decoding was first introduced to
illustrate that such network can be intergraded in optical processing [12]. Coherent
coding and decoding is based on the network architecture of Ladder network encoder.
The ladder network is an incoherent network and will be discuss on the next
subsection.
The main difference between both networks is that the phase of the optical
pulses is now very much of interested and the decoder network is matched to the
desired encoder by less than the coherence length of the source. Under these
conditions the optical pulses are summed up coherently at the decoder output. The
phases of the individual pulses emerging from the individual pulses emerging from
the encoder, and the phase changes induced when the pulses pass through the
decoder, determine the interference at the optical detector and hence the resulting
detected signal amplitudes [13]. The correlation process in the decoder yields the
same pulse location as in incoherent CDMA but the amplitudes are different. The
central autocorrelation peak amplitude is P2, which are P times higher than the
incoherent counterpart. Conversely it has been shown that the ratio power in the
central autocorrelation peak to the side lobes is higher when compared to the same
code used in an incoherent system. It should be stressed that the signal coming from
the co-users are summed up incoherently since the encoders are not matched up to
the particular decoder. Figure 2.3 shows a schematic drawing of a coherent network
of only 1 channel.
Figure 2-3 1-channel coherent decoding network
a
b
Encoder Decoder
3dB Couplers
c
d f
e

29
Coherent network that involved the usage of both channels is named as 2-
channel coherent decoding or inverse decoding where figure 2.4 illustrated. Inverse
decoding is done by using two fibers themselves as two spatial channels or by
launching the signal from the two outputs of the encoder to the two polarization
states of a single mode fiber by means of a polarization beam splitter (PBS) [14]. A
PBS will split the signal that is from 2 polarization channels to the 2 inputs of the
decoder.
Figure 2-4 2-channel coherent decoding network
The main advantages of inverse decoding are the autocorrelation peak is 4P2,
which reflects an increase by 4 in comparison to the single channel and the signals
from the 2 spatial or polarization channels cancel each other by causing the
autocorrelation side lobes disappear [15] [16].
A perfect and lossless reconstruction of the pulse fed to the encoder is gain from
the network. In fact, inverse decoding provides a mechanism whereby a transmission
to matched receiver occurs as if the encoding or decoding process did not take place.
For the case of the 1-channel scheme, cross correlation will remain the same as in the
incoherent scheme. Whereas for the 2-channel scheme, twice as many pulses is
received as the incoherent scheme or the 1-channel scheme, the cross correlation will
be 4 times larger in term of power. In other words, coherent decoding enhances
largely the autocorrelation process of the receiver, while maintaining the crosstalk at
comparatively low levels, and therefore it exhibits higher SNR. Overall the SNR in
the inverse decoding scheme will be 4P2 better than the incoherent approach. This
shows the performance of coherent network is potentially better than the incoherent
counterpart. This is due to substantial improvement to the autocorrelation
a
b
Encoder Decoder
3dB Couplers
c
d f
e
Adjustable phase shift
30
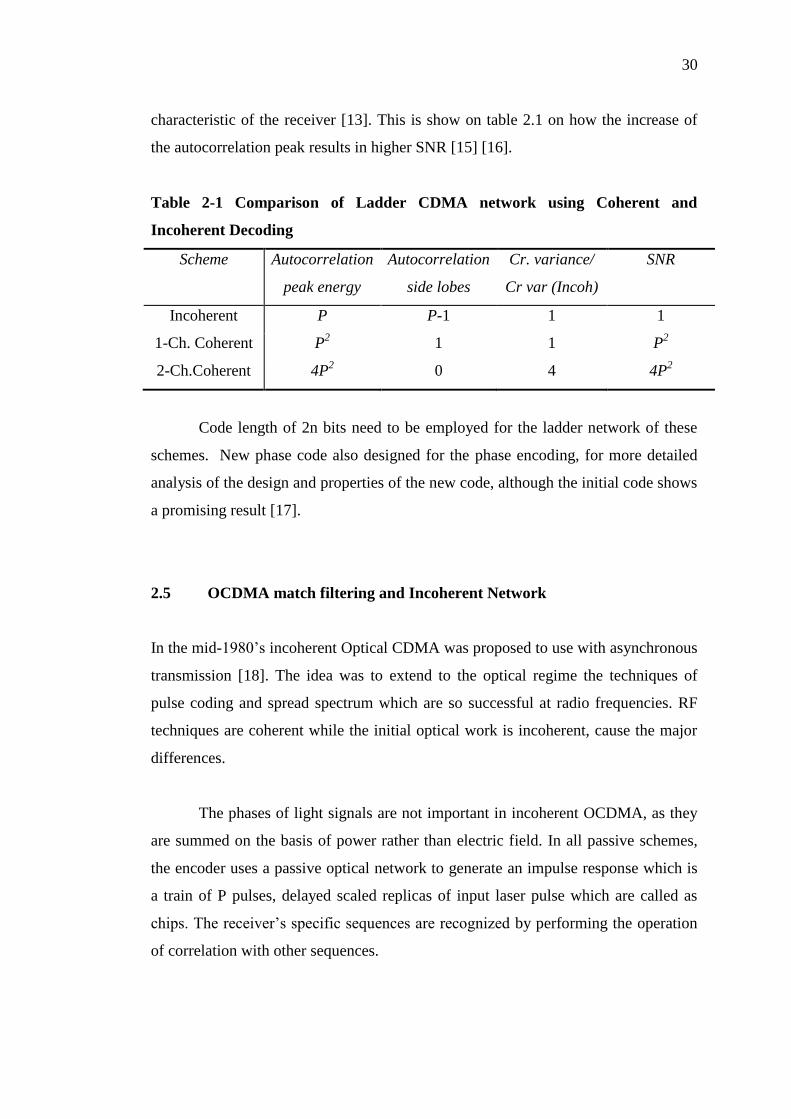
characteristic of the receiver [13]. This is show on table 2.1 on how the increase of
the autocorrelation peak results in higher SNR [15] [16].
Table 2-1 Comparison of Ladder CDMA network using Coherent and
Incoherent Decoding
Scheme Autocorrelation
peak energy
Autocorrelation
side lobes
Cr. variance/
Cr var (Incoh)
SNR
Incoherent P P-1 1 1
1-Ch. Coherent P2 1 1 P
2
2-Ch.Coherent 4P2 0 4 4P
2
Code length of 2n bits need to be employed for the ladder network of these
schemes. New phase code also designed for the phase encoding, for more detailed
analysis of the design and properties of the new code, although the initial code shows
a promising result [17].
2.5 OCDMA match filtering and Incoherent Network
In the mid-1980‟s incoherent Optical CDMA was proposed to use with asynchronous
transmission [18]. The idea was to extend to the optical regime the techniques of
pulse coding and spread spectrum which are so successful at radio frequencies. RF
techniques are coherent while the initial optical work is incoherent, cause the major
differences.
The phases of light signals are not important in incoherent OCDMA, as they
are summed on the basis of power rather than electric field. In all passive schemes,
the encoder uses a passive optical network to generate an impulse response which is
a train of P pulses, delayed scaled replicas of input laser pulse which are called as
chips. The receiver‟s specific sequences are recognized by performing the operation
of correlation with other sequences.

31
Incoherent OCDMA consider as the most attracted research part in the OCDMA
research group. This is due to the practical ease of implementing direct optical
detection based system. Several version of incoherent system have been proposed,
and progressively these systems improve from the original idea. The designs of codes
and encoders/ decoders are the main effort that has been focus on. Few incoherent
OCDMA schemes are the Delay Line Network, Ladder Network encoders and
Tunable Delay Lines network. They are all introduced and discussed in the following
sections.
2.5.1 Delay Line Network
The most common approach is to uses arrays of discrete optical waveguide based
delay lines too temporally, or sometimes spectrally, manipulate the individual data
bits in order to perform the coding and decoding process. Simple optical fibers of
different lengths appropriately coupled together using fiber couplers were
implemented by delay lines. This was 1st proposed during the mid-1980s by Prucnal
and co-workers, to develop a purely asynchronous multiple access network [19]. The
delay line network was illustrated on figure 2.5.
Figure 2.5 shows that the encoder and decoder consist of a delay line network.
At the encoder part, the incident laser pulse splits and produce a train of P pulses
which are appropriately delayed within the data bit period according to the length of
each fiber. While the decoder, it has a reverse impulse response from the encoder, by
reconstruct the data pulse. The highest in the series of output pulses are the
reconstructed pulses, the represents the autocorrelation peak of the matched reception.
There are few issues on this delay network.
First is the main restriction of incoherent techniques that is based on direct
photo detection that cannot perform bipolar correlation. This is due to the bipolar
correlation function is equivalent to the X-NOR logical operation, followed by
integration over the data bit period [4]. Therefore the incoherent CDMA uses the
unipolar correlation where the system is based on power summation.

32
Figure 2-5 Fiber Delay Lines based optical encoder and decoder for DS-OCDMA
Second, the main issue is to maintain the accurate delays that constitute the
code sequence and compensation of the changes in fiber lengths due to
environmental conditions. Few methods have proposed to overcome this problem. A
multistage Mach-Zander interferometer chain fabricated on a silica planar waveguide
to overcome this issue and the receiver used balanced detection scheme to enhance
the code recognition recovery [20]. Arrayed waveguide gratings with a phase filter
also proposed to overcome the issue [21].
2.5.2 Ladder Network Encoder
Every communication network will face with the power budget problem, where this
is also a main problem of the delay line encoder. Due to the use of 3-dB couplers in
the delay line network it waste a large amount of optical power. An alternative to this
approach has been proposed, where a ladder network replaces the parallel delay line
architecture [22].
33
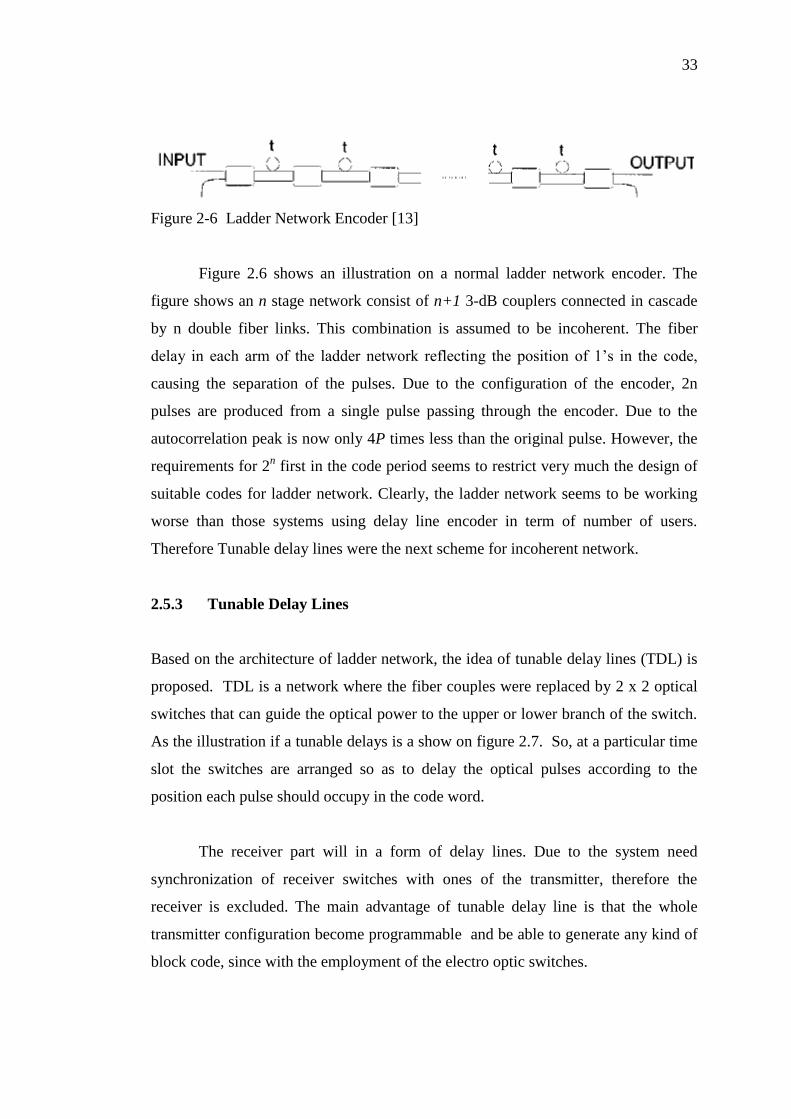
Figure 2-6 Ladder Network Encoder [13]
Figure 2.6 shows an illustration on a normal ladder network encoder. The
figure shows an n stage network consist of n+1 3-dB couplers connected in cascade
by n double fiber links. This combination is assumed to be incoherent. The fiber
delay in each arm of the ladder network reflecting the position of 1‟s in the code,
causing the separation of the pulses. Due to the configuration of the encoder, 2n
pulses are produced from a single pulse passing through the encoder. Due to the
autocorrelation peak is now only 4P times less than the original pulse. However, the
requirements for 2n first in the code period seems to restrict very much the design of
suitable codes for ladder network. Clearly, the ladder network seems to be working
worse than those systems using delay line encoder in term of number of users.
Therefore Tunable delay lines were the next scheme for incoherent network.
2.5.3 Tunable Delay Lines
Based on the architecture of ladder network, the idea of tunable delay lines (TDL) is
proposed. TDL is a network where the fiber couples were replaced by 2 x 2 optical
switches that can guide the optical power to the upper or lower branch of the switch.
As the illustration if a tunable delays is a show on figure 2.7. So, at a particular time
slot the switches are arranged so as to delay the optical pulses according to the
position each pulse should occupy in the code word.
The receiver part will in a form of delay lines. Due to the system need
synchronization of receiver switches with ones of the transmitter, therefore the
receiver is excluded. The main advantage of tunable delay line is that the whole
transmitter configuration become programmable and be able to generate any kind of
block code, since with the employment of the electro optic switches.

34
Figure 2-7 OCDMA network using tunable delay lines [13].
2.6 Implementation of Fiber Bragg Grating technology in OCDMA
In OCDMA, passive „single beam‟ encoding and decoding schemes based on Fiber
Bragg grating (FBG) technology have been proposed and demonstrated . FBG is
implemented on incoherent WH/TH optical encoder network and also on Spectral
Amplitude Incoherent Optical Encoder/Decoder.
2.6.1 Incoherent WH/TH Optical Encoder and Decoder Using FBGs
FBG is used to comprise the incoherent wavelength-hopping or time-spreading
(WT/TS) encoder and decoder, where the FBG is adopt with a series [23] of parallel
[24] structure in the network to reflect the optical signal with different wave length.
The fixed optical encode and decoder using a series structure are shown in
figure 2.8. A broadband light source or a multi-wavelength light source is used for
the output of short pulse trains with the repetition rate 1/T and the width τ, which are
modulated by the input data in an optical modulator. The modulated narrow pulses
are fed into port one of the optical circulator. The optical signals output from port
two of the circulator are reflected back by FBGs with different wavelengths.
Meanwhile two adjacent FBGs are connected with the delay lines with different

35
lengths in order to implement the desired delays in terms of the requirement of a
WH/TS code word.
The operating principle of the optical decoder is similar to its correspondent
encoder. Where the FBGs is put in a reverse order and the delays of fiber optics
delay lines that lay between the two adjacent FBGs is changed, in order to make their
delay values be complementary values of those in its corresponding encoder. The
delay parameters are shows on figure 2.8(b).
Figure 2-8 Fixed WH/TS optical encoder/decoder based on serial FBG [25]
WH/TS network with optical encoder and decoder using parallel FBGs
structure, it consist an arrayed waveguide grating (AWG) wavelength–division de-
multiplexer. Figure 2.9 show that have the schematic of the parallel FBGs based
WH/TS encoder /decoder. Modulated broadband light source goes through a
circulator to the AWG to decompose the optical signals in to parallel output. Optical
signals pass through the fiber delay lines with different lengths and are reflected by
FBGs with different wavelengths, and return into the AWG again. Both encoder and
decoder operating principles are similar and it the component involves in shown on
figure 2.9.

36
Both of the WH/ TS encoder that adopts a series or parallel structure is able
to replace the fiber delay lines with the tunable optical delay line that implement the
required delays determined by the code words under the control of users [26]. Figure
2.10 shows that the replacement of fiber delay lines.
Figure 2-9 WH/ TS encoder/ decoder based on parallel FBGs [25]
Figure 2-10 Tune able WH/TS encoder/ decoder based on parallel FBGs [25]
However, with the replacement of tunable delay lines; it would result in large
optical power loss. Hence, such a structure is only suitable for the implementation of
fixed encoder/decoder. Of course, although the encoder/decoder may be tuned by the

37
piezoelectricity component to strain the fiber Bragg gratings and fiber optic delay
lines to control the reflected wavelengths and delays theoretically, the tuned range is
severely limited as a matter of fact [25].
2.7 Spectral–Amplitude Incoherent Optical Encoder and Decoder
With development and maturation of FBGs, they can be employed as the choosing
wavelength filters to implement in the Spectral Amplitude Encoding (SAE). In
chapter 1 it is introduce that the SAE is also a Frequency Encoded –OCDMA (FE-
OCDMA). The implementation of SAE OCDMA is to overcome the disadvantage of
the bulk-optic spectral amplitude encoder/ decoder. Figure 2.11 illustrate a bulk-
optic spectral amplitude encoder/decoder. The SAE OCDMA employing the FBGs in
series or the linear array of FBGs and the superposition FBGs, is extensively
investigated and demonstrated [27].
Figure 2-11 FE-OCDMA implementation using bulk optics [25]
The spectral amplitude operates where the optical pulse from a broadband
light source is modulated by data; go through the FBGs with different wavelength to
determine the chosen user‟s address code word. Figure 2.12 shows the block diagram
of OCDMA system of spectral amplitude encoding with FBGs. The purpose of using
a 1: α coupler in figure 2.12 is to make MUI (multiple user interference) received by
the photo diode one (PD1) to be equal to MUI received by PD2, so that they
counteract with each other. Figure 2.12(b), shows the reflection spectrum of FBGs

38
that is represented as A (ω) in the figure, as the transmission of spectrum of FBGs is
known as the A (ω) symbol.
Figure 2.13(a) shows the spectral amplitude encoder is formed base on the
array of FBGS. A broadband optical pulse inputs from port 1 of the circulator and
outputs from port 2, and then enters the first array of FBGs. The spectral components
corresponding to A(ω) are reflected back and output from port 3, and then enter the
second optical circulator. After reflected by the second array of FBGs, they output
from port 6 of the second optical circulator at last. In doing so, the spectral amplitude
encoding based on FBGs is achieved. The order of wavelengths reflected by the
second array of FBGs is just opposite to that of wavelengths reflected by the first
array of FBGs in order to compensate the delay differences caused by the different
times of different wavelengths reflected by the first array of FBGs. In this way, the
encoded optical pulses of all wavelengths reflected can be guaranteed to reassemble
into a bigger optical pulse onto the same slot.
Figure 2-12 Block diagram of Spectral amplitude encoding OCDMA system with
FBGs [25].
Figure 2.13 (b) illustrate the spectral amplitude decoder. For multiple user
access network the FBGs in the network should be tunable, that is the center
wavelength of reflected spectrum of each FBG should be able to be tuned. Such a

39
tunable FBG can be implemented by employing a piezoelectricity device to strain the
FBG or by using a heater to adjust the temperature of the FBG. The tunable FBGs
are applicable to both encoder and decoder. The MUI can be counteracted by
employing the transmission spectrum of the first FBG and the balanced detection. In
this spectral amplitude encoding OCDMA system based on the en/decoder of the
arrays of FBGs, the data rate is no longer limited by the length of the array of FBGs
because the delay of each spectral component is the same after the delay is
compensated. Therefore, the bit rate is mainly confined by the maximal modulation
rate of the broadband light source and the bandwidth of photo-detector applied to the
balanced detection.
Figure 2-13 Encoder and decoder using a linear array of FBGs for SAE OCDMA
[25]
40
2.8 OCDMA Optical Code
In OCDMA network, the transmission signal over a fiber-optic channel is formed by
the superimposing of pseudorandom OCDMA signals encoded from multiple
channels. The receiver in the network decodes the signal that is broadcasted from the
transmitter. In order to implement OCDMA communication network, address codes
with sufficient performance are required. When a set of code is chosen, a code
should be constructed that has many code words as necessary and good enough auto-
and cross-correlation so that accurate synchronization can be implement and the
multiple access interference (MAI) from other codes can be suppressed effectively
by decoding the signals. Optical coding for OCDMA network is mainly categorized
in to two parts, unipolar codes and bipolar codes.
Unipolar codes is only suitable for incoherent OCDMA network, that is
Optical orthogonal codes (OOC), Prime codes (PC), Quadratic congruence codes
(QCC) and Hyperbolic congruence codes (HCC). Where else, for bipolar codes it
suits both coherent and incoherent OCDMA network. The optical codes are m
sequence, Gold Code and Walsh Hadamarad Codes.
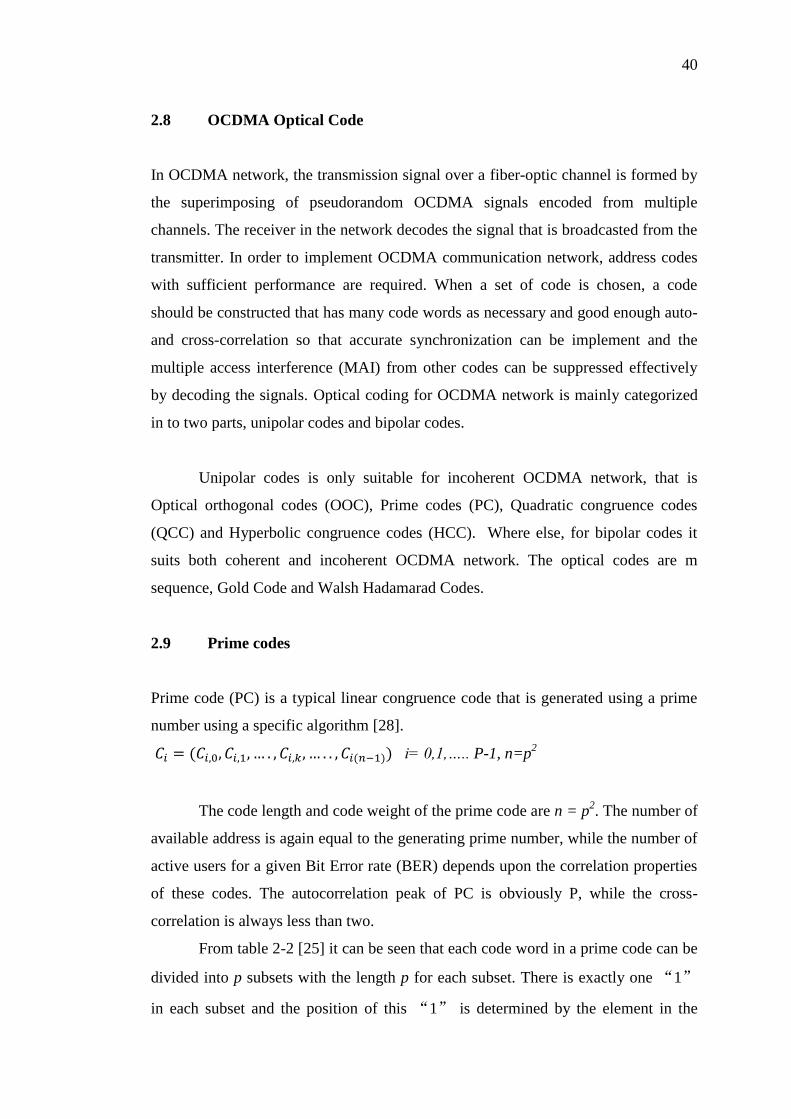
2.9 Prime codes
Prime code (PC) is a typical linear congruence code that is generated using a prime
number using a specific algorithm [28].
i= 0,1,….. P-1, n=p2
The code length and code weight of the prime code are n = p2. The number of
available address is again equal to the generating prime number, while the number of
active users for a given Bit Error rate (BER) depends upon the correlation properties
of these codes. The autocorrelation peak of PC is obviously P, while the cross-
correlation is always less than two.
From table 2-2 [25] it can be seen that each code word in a prime code can be
divided into p subsets with the length p for each subset. There is exactly one “1”
in each subset and the position of this “1” is determined by the element in the

41
corresponding prime sequence. The advantage of the prime code is that its generation
algorithm is very simple and the shortcomings are that it has larger autocorrelation
side lobes equal to ; its cross-correlation is not equal to 1 and the cardinality of
the prime code is only equal to its weight
Table 2-2 Prime codes for P=5
Prime Sequence Si Prime code
S0 =(00000) 10000 10000 10000 10000 10000
S1 =(01234) 10000 01000 00100 00010 00001
S2 =(02413) 10000 00100 00001 01000 00010
S3 =(03142) 10000 00010 01000 00001 00100
S4 =(04321) 10000 00001 00010 00100 01000
2.10 M- Sequence code
M- Sequence is a bipolar code that is able to apply in both coherent and incoherent
OCDMA system using different detection. M-sequence is also known as the
maximal-length sequence in long. Because the bipolar codes are having the negative
components in the code word there for it is better than unipolar codes.
The m-sequence is a pseudorandom sequence in the most common use, which
can be generated by the feedback-shift-registers and has the maximal period.
Therefore, it is called the maximal linear feedback-shift-register sequence. The
period of an m-sequence is not only associated with the number of stages of shift-
registers, but is also related to the linear feedback logic [29]. When an r-stage shift-
register is employed, the period is n=2‟-1. The linear feedback logic is determined by
the equation below.
∑
The m-sequence can be generated by the r-stage linear feedback shift register.
Figure 2.14 shows the r-stage shift register, in which denotes the state if the
shift register and indicates the link state of the feedback
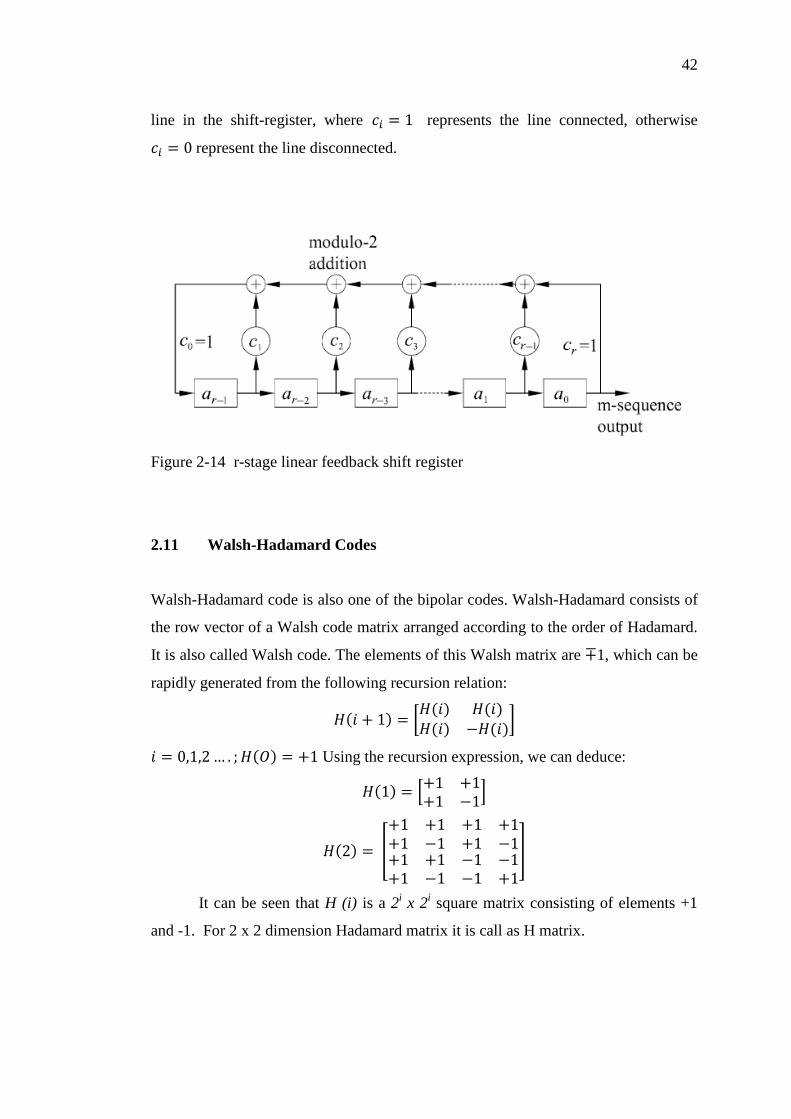
42
line in the shift-register, where represents the line connected, otherwise
represent the line disconnected.
Figure 2-14 r-stage linear feedback shift register
2.11 Walsh-Hadamard Codes
Walsh-Hadamard code is also one of the bipolar codes. Walsh-Hadamard consists of
the row vector of a Walsh code matrix arranged according to the order of Hadamard.
It is also called Walsh code. The elements of this Walsh matrix are 1, which can be
rapidly generated from the following recursion relation:
[
]
Using the recursion expression, we can deduce:
[
]
[
]
It can be seen that H (i) is a 2i x 2
i square matrix consisting of elements +1
and -1. For 2 x 2 dimension Hadamard matrix it is call as H matrix.
43
2.12 Fiber Bragg Gratings
Fiber Bragg Grating (FBG) is a periodic perturbation of the refractive index along
the fiber length which is formed by exposure of the core to an intense optical
interference pattern. The formation of permanent gratings in an optical fiber was first
demonstrated by Hill et al. in 1978 at the Canadian Communications Research
Centre (CRC), Ottawa, Ont., Canada [30]. This was done with a Germania-doped
fiber with an intense Argon-ion laser radiation runs into it. The observation was done
by seeing an increase power with the reflected light intensity until almost all the light
was reflected from the fiber. From that, it leads to the intensive researches on the
photosensitivity of fiber and the development of FBG.
The FBG written by ultraviolet light (UV) into the core of an optical fiber
has developed into a critical component for many applications in fiber-optic
communication and sensor systems. When ultraviolet light radiates an optical fiber,
the refractive index of the fiber is changed permanently; the effect is termed
photosensitivity. The change in refractive index is permanent in the sense that it will
last for decades (life times of 25 years are predicted) if the optical waveguide after
exposure is annealed appropriately, that is by heating for a few hours at a
temperature of 50 C above its maximum operating temperature [31]. Advantages of
fiber gratings over competing technologies include all-fiber geometry, low insertion
loss, high return loss or extinction, and potentially low cost. But the most
distinguishing feature of fiber gratings is the flexibility they offer for achieving
desired spectral characteristics. Numerous physical parameters can be varied,
including: induced index change, length, apodization, period chirp, fringe tilt, and
whether the grating supports counter-propagating or co-propagating coupling at a
desired wavelength. The illustration for the variation of the induced index change
along the fiber axis is shown on figure 2-15.

44
Figure 2-15 Common types of fiber gratings as classified by variation of the induced
index change along the fiber axis, including (a) uniform with positive-only index
change, (b) Gaussian-apodized, (c) raised-cosined-apodized with zero-dc index
change, (d) chirped, (e) discrete phase shift (of π), and (f) superstructure.

45
CHAPTER 3
3 METHODOLOGY
3.1 Overview
In this chapter, the setup of optical communication network of Intensity modulation
and SAC-OCDMA network is shown. Both of the simulations are done based on 3
users and 7 users SAC-OCDMA. All the simulation this is demonstrated in the
environment of Optisystem is shown and described.
3.2 OptiSystem
In an industry where cost effectiveness and productivity are imperative for success,
the award winning OptiSystem can minimize time requirements and decrease cost
related to the design of optical systems, links, and components. OptiSystem is an
innovative, rapidly evolving, and powerful software design tool that enables users to
plan, test, and simulate almost every type of optical link in the transmission layer of a
broad spectrum of optical networks from LAN, SAN, MAN to ultra-long-haul. It
offers transmission layer optical communication system design and planning from
component to system level, and visually presents analysis and scenarios. Its
integration with other Optiwave products and design tools of industry leading
electronic design automation software all contribute to OptiSystem speeding your
product to market and reducing the payback period.

46
OptiSystem enables users to plan, test, and simulate:
WDM/TDM or CATV network design
SONET/SDH ring design
Transmitter, channel, amplifier, and receiver design
Dispersion map design
Estimation of BER and system penalties with different receiver models
Amplified System BER and link budget calculation
OptiSystem is a comprehensive software design suite that enables users to
plan, test and simulate optical links in the transmission layer of modem optical
networks. A comprehensive GUI controls the optical component layout and net list,
component model, and user component.
The OptiSystem Component Library includes hundreds of components that
enable you to enter parameters that can be measured from real devices. It integrates
with test and measurement equipment from different vendors. Users can incorporate
new components based on subsystems and user-defined libraries, or utilize co-
simulation with a third party tool such as MATLAB or SPICE.
User can select component ports to save the data and attach monitors after the
simulation ends. This allows you to process data after the simulation without
recalculating. You can attach an arbitrary number of visualizers to the monitor at the
same port.
To make a simulation tool flexible and efficient, it is essential to provide
models at different abstraction essential to provide models at different abstraction
levels, including the system, subsystem, and component levels. OptiSystem features
a truly hierarchical definition of components and systems, enabling you to employ
specific software tools for integrated and fiber optics at the component level, and
allowing the simulation to be as detailed as the desired accuracy dictates.

47
3.3 Intensity Modulation Network
Intensity modulation is an optical system whereby data is carried in the intensity of
light. Normally the light source uses in basic intensity modulation is continuous
wave (CW) laser. For digital data, intensity of the laser represents the digital signal
of „1‟ and „0‟.
In this simulation a normal Mach-Zehner Modulator is used for intensity
modulation. The schematic diagram of IM modulation is show on figure 3.1 and
figure 3.2. Both figures come with different modulation formats. This is done is to
show which modulation formats it more suitable for OCDMA network. From the
figure, it shows that the modulated signal is sent through a Single Mode Fiber (SMF),
where at the receiver part the modulated signal is received and detected by the photo
detector; where at the electrical part, the data is yet still unable to be retrieve as the
receive data is very noisy, therefore the receive data is passed by a 0.75GHz low pass
filter. This is often known as autocorrelation in communication network.
Figure 3-1 Intensity Modulation Network with NRZ modulation format
Figure 3-2 Intensity Modulation Network with RZ modulation format
SMF

48
Besides that, simulation on changing the CW light source to broadband light
source is done. Based on both simulation schematic diagram of figure 3.1 and figure
3.2, the CW is changed with white light source. This simulation is done to prove that
how suitable is the white light source in intensity modulation network.
3.4 Spectral Amplitude Coding (SAC) OCMDA
The simulation of OCDMA is done base on a conference paper on the topic of
“Optical Spectral-Amplitude Coder/Decoders Structure with Circulator-Free Fiber-
Grating Array.” By Jen-Fa Huang et al [32].
The OCDMA system proposed by Jen Fa Huang is based on an incoherent
OCDMA that uses an incoherent optical light source that offers broadband spectrum,
high emitting power, and lower cost due to high yields in packaging technology.
Figure 3.3 shows the FBG-based optical decoder and encoder network that is
proposed by Jen Fa Huang. The encoder shows on figure 3.3(a) consist a broadband
light source that goes through an intensity modulator and goes through a series of
FBGs. The broadband source is modulated with the information data using
Amplitude Shift Keying (ASK) modulation scheme.
Figure 3.3 (b) show the receive end of the network or also known as the
decoder part. The decoder part consist of a 1x2 power splitter , a pair of series FBGs,
photo detectors on each end of the series of FBGs, and an Bit Error rate detector
(BERT). Both series of Bragg gratings are respectively fabricated in a single fiber to
make CDMA spectral chip pulses. The spectral frequency pattern, with spectral chips
centered about the grating frequencies, is determined by the OCDMA signature
address codes properly written in the FBGs [32].
An OCDMA code will be encoded by the encoder FBGs to form a trans-
missive light field, where the code is denote by the code vector
( ) ; N is the sequence length of the address code. When
there are k users in the OCDMA network, a pair of Nx1 and 1xN passive couplers is
used to connect the local area network (LAN) user in the system. The transmitter

49
broadcast all the encoded data to all the receivers in the network. The receiver
applies a correlating decoder to the incoming signal to extract the desired bit stream.
To reduce the undesirable effects caused by multiple-access interference (MAT)
coming from the other users in the same OCDMA network, an FBG decoder scheme
is configured on the basis of the correlation subtractions of nearly orthogonal
maximal-length sequence (M-sequence) codes or Walsh-Hadamard codes. When the
summed encoded broadband signal is sent to each receiving decoder, the received
optical signal is divided into two branches equally. It is obtained Xk (λ) in the upper
branch and Xk(λ) in the lower branch.
Figure 3-3 FBG encoder and decoder in the OCDMA network
(a) FBG Encoder (b) FBG Decoder [32]
The receiver part of the FBG encoder/ decoder scheme uses a correlation
subtraction scheme ̅
The OCDMA network is an incoherent
OCDMA; which means both unipolar and bipolar coding is applicable. Figure 3.4
shows a schematic drawing of a 3 user OCDMA network. Figure 3.5 shows a
schematic drawing of a 7 users OCDMA network.
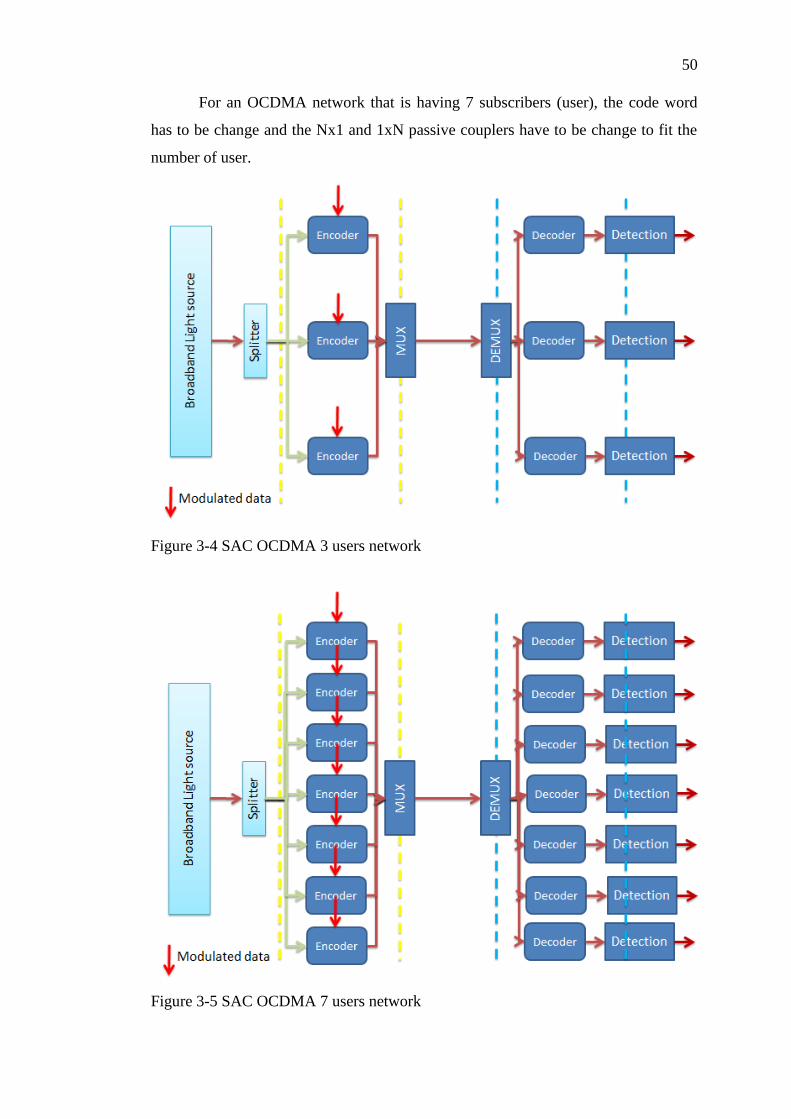
50
For an OCDMA network that is having 7 subscribers (user), the code word
has to be change and the Nx1 and 1xN passive couplers have to be change to fit the
number of user.
Figure 3-4 SAC OCDMA 3 users network
Figure 3-5 SAC OCDMA 7 users network

51
Figure 3.6 shows an overview of the Optical code division multiple access
system that are proposed and experimented. The highlighted part is the main content
in this thesis.
Figure 3-6 Classification of OCDMA networks
3.5 SAC Optical coding and decoding
According to the SAC-OCDMA proposed by Jen Fa Huang, it encodes based on the
passing through of a data modulated broadband light source through a series of
multiple FBGs wavelength with a specified code sequence in order to accomplish the
coding pattern. For decoding the coded broadband signal that is sent to the receiving
part of the decoder; the optical signal is divided into two branches equally with an
1x2 power splitter. The upper part is a series of FBGs that‟s corresponding to the
encoder code vector, while the lower part is also a series of FBGs that is inversely
followed the encoder code vector. While at the detection part, the subtraction
between both upper and lower part of the decoder is brought out and passing it
through the photo-detector; as it is known as match filtering detection.

52
Furthermore, for SAC-OCDMA for 3 users‟ network, Walsh Hadamard codes
are used; as there is a 4x4 Hadamard matrix code vector available. Where else, for 7
users‟ network, M-sequence and Walsh Hadamard codes are used.
3.5.1 Walsh Hadamard code
Walsh-Hadamard consists of the row vector of a Walsh code matrix arranged
according to the order of Hadamard. It is also called Walsh code. The elements of
this Walsh matrix are 1, which can be rapidly generated from the following
recursion relation:
[
]
For 3 users OCDMA network, the code word of H(2) is used. Where else, for
7 users OCDMA network, the code word of H(3) is used. H(2) is a 4x4 Walsh matrix;
while H(3) is a 8x8 Walsh Matrix. But the 1st line of the code from both matrixes is
consisting of a group of logic “1”. The row of logic “1” is not in used, as though the
decoding processing, the data will be extracted out by the FBGs. That why both H(2)
and H(3) matrixes only able to provide 3 users and 7 users in the SAC-OCDMA
network.
[
]
Figure 3-7 Walsh Hadamard matrix codes for 3 users OCDMA network
[
]
Figure 3-8 Walsh Hadamard matrix codes for 7 users OCDMA network
Figure 3.6 and 3.7 shows the code word of both Walsh Hadamard codes for 3
users and 7 users. Walsh Hadamard code is a unipolar code, but to implement into
the SAC-OCDMA network, a bipolar is needed. This means the unipolar Walsh
Hadamard codes have to be converted into a bipolar code. To make the conversion

53
happens, the “-1” is changed to a logical “0”. Table 3-1 show the Bipolar Walsh
Hadamard code with a code length of 4 and showing which wavelength should be
chosen to cut off by the FBGs. Table 3-2 show the Bipolar Walsh Hadamard code
with a code length of 8 and showing which wavelength should be chosen to cut off
by the FBGs.
Table 3-1 Bipolar Walsh Hadamard code with length of 4
Walsh Hadamard codes for 3 Users Cut Off Wavelengths
1010
1100
1001
Table 3-2 Bipolar Walsh Hadamard code with length of 8
Walsh Hadamarad Code Cut Off Wavelenghts
10101010
11001100
10011001
11110000
10100101
11000011
10010110
3.5.2 M-Sequence Code
The m-sequence is a pseudorandom sequence in the most common use, which can be
generated by the feedback-shift-registers and has the maximal period. Therefore, it is
called the maximal linear feedback-shift-register sequence.
To get a code length, n of 7, the number of sequence is from , from
the equation we can get the number of stages r is equal to 3 stages. The 3-stage
primitive polynomial, ; where else the inversely polynomial
. Figure 3.8 shows the 3 stage linear feedback shift register
for generating an m-sequence code with a code length of 7.

54
Figure 3-9 3 stage linear feedback shift register
With the M-sequence having a code length of 7, and yielding (+1 +1 +1 -1 +1
-1 -1) the m-sequence is sequence cyclically six times and a cyclic shift sequence can
be produced from every cyclic shift. Therefore, it is able to obtain a six cyclic shift
sequence in all. By including the original sequence, a total of seven M- sequence
code is generated for the 7 users OCDMA network.
Table 3-3 M-sequence with length 7
M-sequence Code Cut Off Wavelengths
1110100
0111010
0011101
1001110
0100111
1010011
1101001

CHAPTER 4
4 RESULTS AND DISCUSSIONS
4.1 Overview of Result and Discussion
In this chapter, a full characterization of SAC-OCDMA system is simulated and
discussed. The full characterization is done on a 3-users Walsh Hadamard coded
SAC-OCDMA, 7-users Walsh Hadamard coded SAC-OCDMA and a 7-users M-
sequence coded SAC-OCDMA. The full characterization covers on no of users,
different FBG bandwidth, vary of temperature, FBG reflectivity and FBG deflects.
For an error free optical transmission, the BER is always to be lower than 10-9
.
Before conducting simulation on SAC-OCDMA few of small simulations are done
for the confirmation of how optical communication takes place in OCDMA.
4.2 Intensity modulation
In optical communication network, Intensity modulation is the most basic
communication network. Intensity modulation uses ASK modulation scheme for
optical communication. Intensity modulation comes with RZ and NRZ modulation
formats. Bit error rate (BER) is the probability number of bit errors in one data
stream over a communication channel. When the BER is zero means there is zero
error over the data stream, if the BER is one means the probability to get 1 error is 1.
This means by sending 1 bit, it will get 1 bit error; means communication breakdown
on the system. For an error free transmission, is it important to get a log10 BER of
lower than 10^-9.

4.2.1 Compare between the RZ and NRZ modulation format
According to table 4-1, we can notice that during short distance IM transmission
using RZ modulation format, the BER shows a better result if compare with
transmission using NRZ modulation. But for long distance transmission,
transmission using RZ modulation format totally cannot perform at all, where else,
the NRZ modulation format still able to perform optical transmission; although the
BER is not on the error free range.
Table 4-1 BER for both RZ and NRZ for different optical fiber length
Modulation scheme BER
RZ 0
NRZ 0
RZ (10m) 0
NRZ (10m) 4.45E-292
RZ (100m) 1
NRZ (100m) 0.006566
This is due to during long distance the dispersion of the optical signal is high,
but due to the NRZ code length is longer than the RZ format; NRZ performs betters
than the RZ format. Figure 4.1 shows the graph of table 4-1. Table 4-2 shows the eye
diagram of each result that is taken from the table 4-1. In term of length of the fiber,
for both modulation format longer distance the eyes close smaller. For the RZ format
modulation, during 100km transmission, we can observe from that eye diagram; the
eye is totally run off by showing a BER of 1. This means during the simulation, it is
better to chooses NRZ modulation format than RZ modulation format, as the NRZ
shows a better result that the RZ modulation format.
Figure 4-1 BER compare between RZ and NRZ in term of optical fiber length
0
0.2
0.4
0.6
0.8
1
-20 0 20 40 60 80 100 120
BER
Optical fibre length
BER Vs Optical fiber length
RZ
NRZ
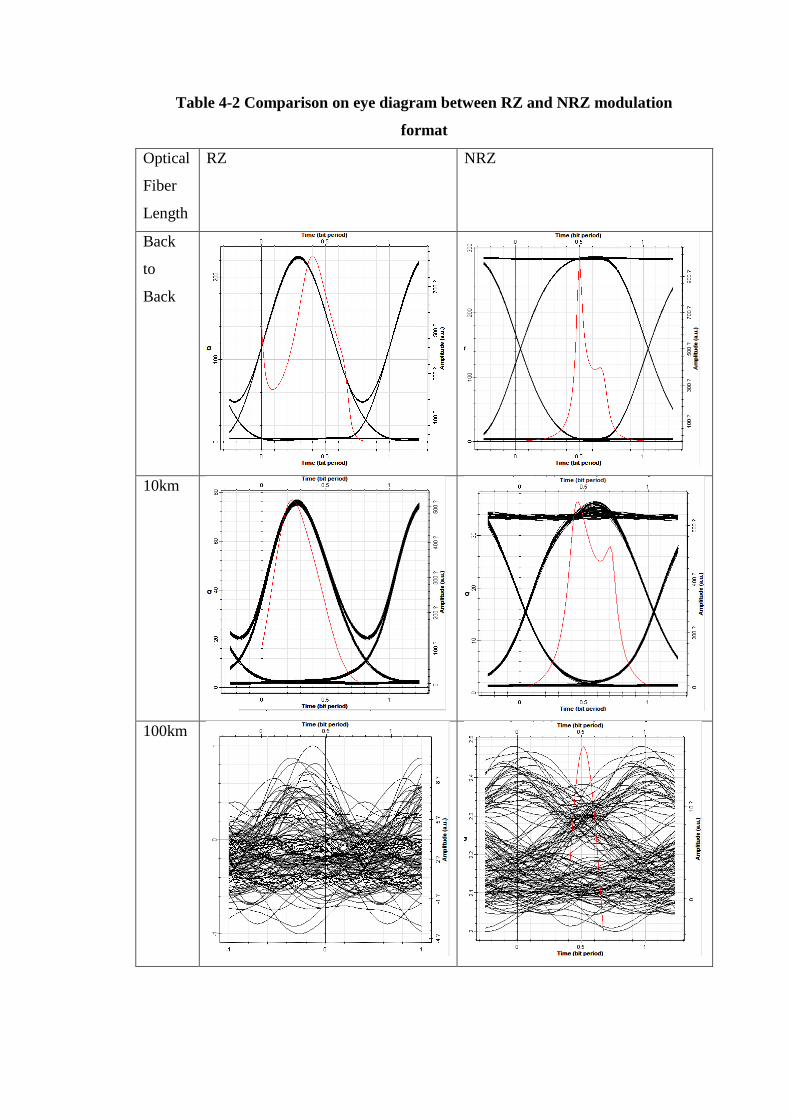
Table 4-2 Comparison on eye diagram between RZ and NRZ modulation
format
Optical
Fiber
Length
RZ NRZ
Back
to
Back
10km
100km

4.2.2 Broadband light source for intensity modulation
Normally during normal IM communication network, broadband light source is not
in use due to the CW laser produce a higher power light on the desired frequency;
while the broadband light source is producing a same power on the laser bandwidth.
For CW laser when the data is modulated on the higher power range, while the noise
floor and the dispersion if the optical signal increases; data is still able to be retrieve
by just filtering off the lower power noise. Figure 4.2 we can see both differences
between white light source and CW laser.
Figure 4-2 Optical Spectrum of White light source (left) Optical Spectrum of CW
laser (right)
To show that the statement is true that broadband source is unable to transmit
data using IM network, simulation is done by changing the optical source to a
broadband light source.
Table 4-3 show the results get from the simulation of intensity modulation
with the optical source of white light. For RZ and NRZ modulation format during
back to back simulation, there is still a possible to gain an error free communication
network; but with the addition of single mode fiber (SMF) with a length of only 2km
the communication totally breakdown by giving an BER of 1.

Table 4-3 Intensity modulation using broadband source with RZ and NRZ
modulation format
Modulation format BER
RZ 1.62E-10
NRZ 2.64E-14
RZ (2km) 1
NRZ (2m) 1
In the communication of multiple accesses, CW laser will not be able to
perform in the communication network. As the data from few users are modulate in
to the broadband light source; and encode for long distance transmission. The data
will treat as noise during the transmission; while the data is retrieve by decoding the
encoded signal. That‟s why this multiple access transmission is known as a CDMA
network. Where else, if OCDMA uses CW laser, only one user data is able to be
modulated into the light source say the power of the light source is not constant. This
concludes why OCDMA uses broadband light source and not CW laser.
4.3 SAC-OCDMA optical encoding
On Chapter 3, shows that the OCDMA network is simulated based on the conference
paper done by Jen Fa Huang. The optical encoding is done by a series of FBGs.
When the broadband light sources goes through the FBG with a cut off frequency, a
certain part of the broadband light source will be cut off. This is shown on the figure
4.3 that the FBG having a 1550.1 cut off frequency and being pass through by a
1550nm broadband light source. The image is taken from the simulated optical
spectrum analyzer. The larger the cut off frequency bandwidth, a wider deep trench
will form on the cut off frequency. A better reflectivity; will form a deeper trench on
the cut off frequency.
For the SAC-OCDMA, two kinds of optical coding are used for 3 users and 7
user OCDMA simulation. As mention in chapter 3, for 3 users OCDMA network it
only uses Walsh Hadamard codes in the simulation, while 7 users OCDMA uses both
M- sequence and Walsh Hadamard. Both M sequence and Walsh Hadamard codes
are bipolar code, means it only consist of one and zero in the code word.
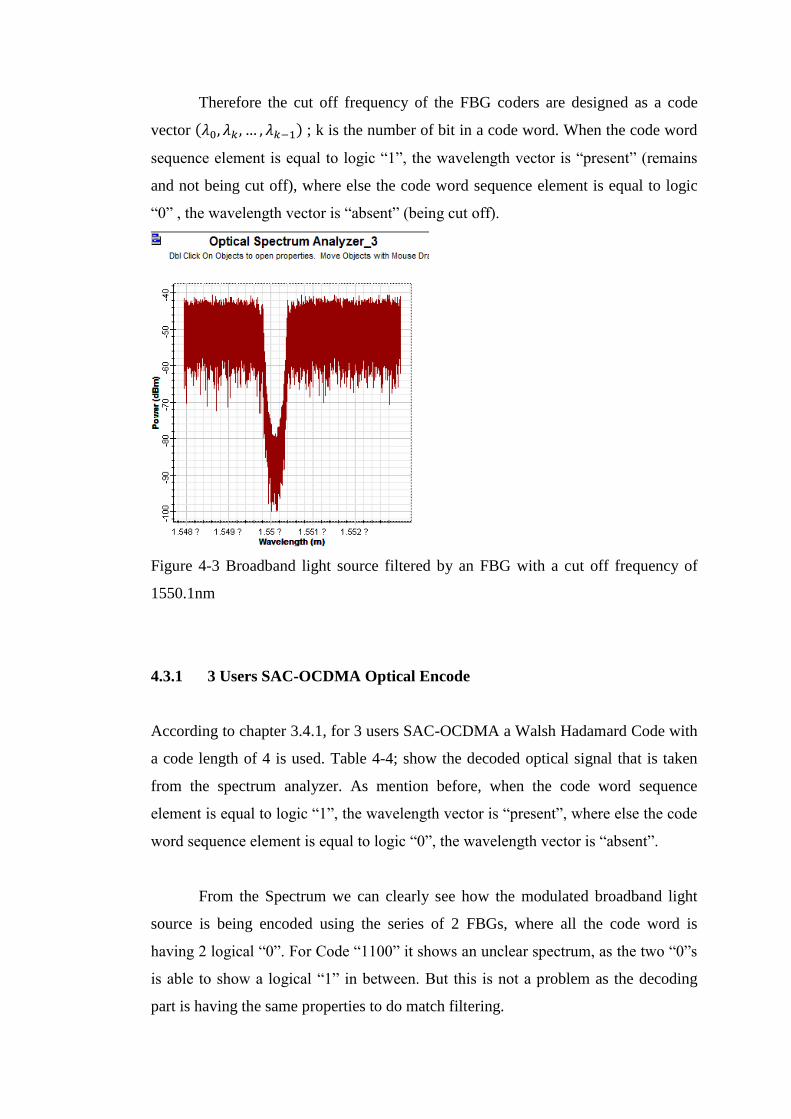
Therefore the cut off frequency of the FBG coders are designed as a code
vector ; k is the number of bit in a code word. When the code word
sequence element is equal to logic “1”, the wavelength vector is “present” (remains
and not being cut off), where else the code word sequence element is equal to logic
“0” , the wavelength vector is “absent” (being cut off).
Figure 4-3 Broadband light source filtered by an FBG with a cut off frequency of
1550.1nm
4.3.1 3 Users SAC-OCDMA Optical Encode
According to chapter 3.4.1, for 3 users SAC-OCDMA a Walsh Hadamard Code with
a code length of 4 is used. Table 4-4; show the decoded optical signal that is taken
from the spectrum analyzer. As mention before, when the code word sequence
element is equal to logic “1”, the wavelength vector is “present”, where else the code
word sequence element is equal to logic “0”, the wavelength vector is “absent”.
From the Spectrum we can clearly see how the modulated broadband light
source is being encoded using the series of 2 FBGs, where all the code word is
having 2 logical “0”. For Code “1100” it shows an unclear spectrum, as the two “0”s
is able to show a logical “1” in between. But this is not a problem as the decoding
part is having the same properties to do match filtering.

Table 4-4 Encoded Optical Signal from Spectrum analyzer
Walsh Hadamard Code Spectrum Analyzer probe after encoding
1010
1100
1001

Figure 4.4 shows what are the setting is to be done for the optical encoding to
be done properly. The FBGs cut off frequency is chosen randomly with in the
broadband light source bandwidth. Furthermore, to take in notice on choosing the cut
off frequency is not to choose a cut off frequency that is close to another bit and not
choosing the cut off frequency that is outside or too near to the upper and lower side
of the broadband lights source bandwidth.
The Specification of the Output from the spectrum is stated below:
White Light Specification
White light source Frequency :
White light source power :
Fiber Bragg Grating Specification
FBGs Cut Off Frequency
Cut Off Frequency
Bandwidth :
Reflectivity : 0.9998
Figure 4-4 White light source and FBGs setting
4.3.2 7 Users SAC-OCDMA Optical Encode
According to chapter 3.4.1, for 7 users SAC-OCDMA a Walsh Hadamard Code with
a code length of 8 and a M-sequence with a code length of 7 is used. Table 4-5; show
the encoded optical signal that is taken from the spectrum analyzer for Walsh
Hadamard code, while table 4-6; shows the encoded optical signal that is taken form
the spectrum analyzer. As mention before, when the code word sequence element is
equal to logic “1”, the wavelength vector is “present”, where else the code word
sequence element is equal to logic “0”, the wavelength vector is “absent”.
Table 3-2 show a group of Walsh Hadamard codes that having a code length
of 8. With the Walsh Hadamard that is generated in a group of seven, the code is
used for optical encoder with FBGs.

Table 4-5 Encoded Optical Signal from Spectrum analyzer for 7 Users OCDMA
for Walsh Hadamard Code
Encoded Broadband source in Spectrum
Analyzer
Encoded Broadband source in Spectrum
Analyzer
User 1
Code:10101010
User 2
Code:11001100
User 3
Code:10011001
User 4
Code:11110000
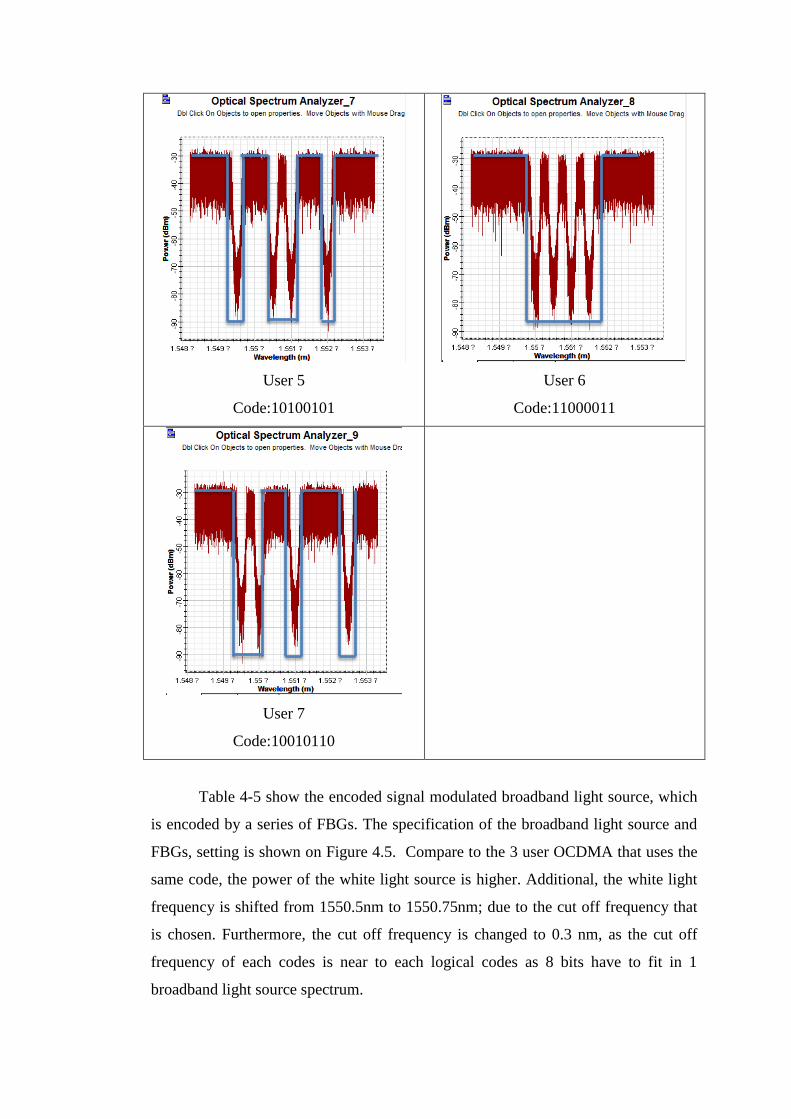
User 5
Code:10100101
User 6
Code:11000011
User 7
Code:10010110
Table 4-5 show the encoded signal modulated broadband light source, which
is encoded by a series of FBGs. The specification of the broadband light source and
FBGs, setting is shown on Figure 4.5. Compare to the 3 user OCDMA that uses the
same code, the power of the white light source is higher. Additional, the white light
frequency is shifted from 1550.5nm to 1550.75nm; due to the cut off frequency that
is chosen. Furthermore, the cut off frequency is changed to 0.3 nm, as the cut off
frequency of each codes is near to each logical codes as 8 bits have to fit in 1
broadband light source spectrum.
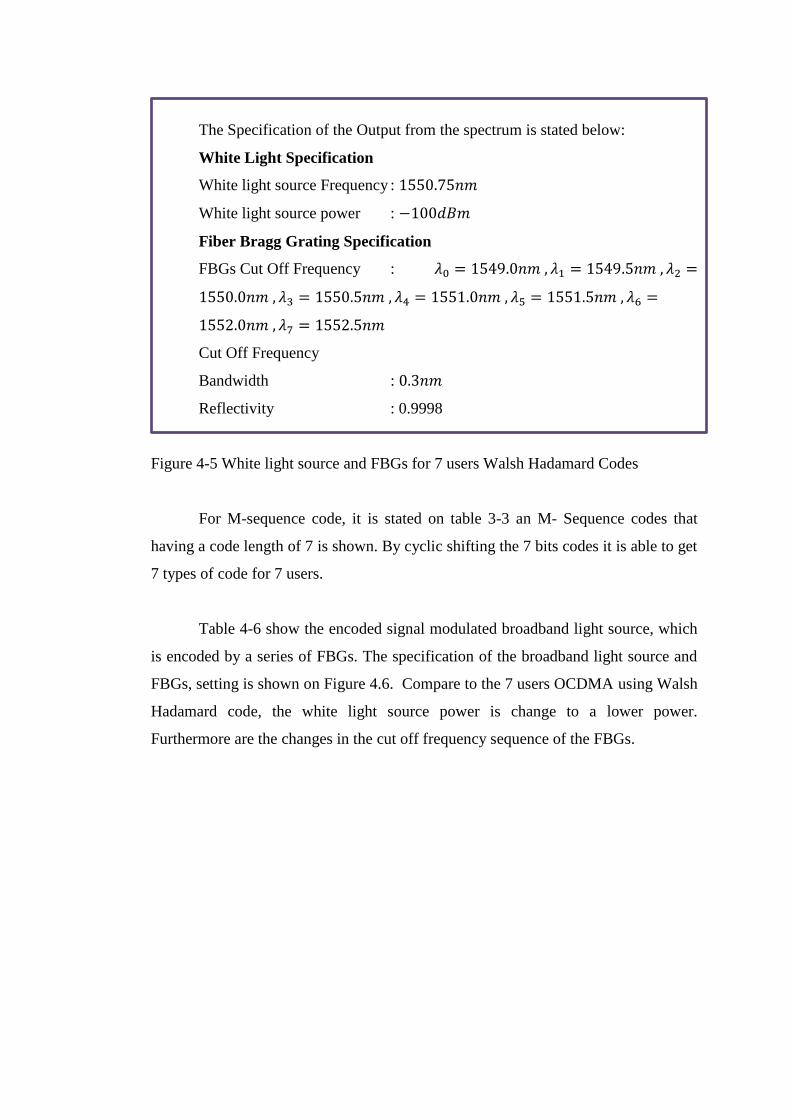
The Specification of the Output from the spectrum is stated below:
White Light Specification
White light source Frequency :
White light source power :
Fiber Bragg Grating Specification
FBGs Cut Off Frequency :
Cut Off Frequency
Bandwidth :
Reflectivity : 0.9998
Figure 4-5 White light source and FBGs for 7 users Walsh Hadamard Codes
For M-sequence code, it is stated on table 3-3 an M- Sequence codes that
having a code length of 7 is shown. By cyclic shifting the 7 bits codes it is able to get
7 types of code for 7 users.
Table 4-6 show the encoded signal modulated broadband light source, which
is encoded by a series of FBGs. The specification of the broadband light source and
FBGs, setting is shown on Figure 4.6. Compare to the 7 users OCDMA using Walsh
Hadamard code, the white light source power is change to a lower power.
Furthermore are the changes in the cut off frequency sequence of the FBGs.

The Specification of the Output from the spectrum is stated below:
White Light Specification
White light source Frequency :
White light source power :
Fiber Bragg Grating Specification
FBGs Cut Off Frequency :
Cut Off Frequency
Bandwidth :
Reflectivity : 0.9998
Figure 4-6 White light source and FBGs for 7 users M-sequence Codes
Table 4-6 Encoded Optical Signal from Spectrum analyzer for 7 Users OCDMA
for M- Sequence code
Encoded Broadband source in Spectrum
Analyzer
Encoded Broadband source in Spectrum
Analyzer
User 1
Code:1110100
User 2
Code:0111010

User 3
Code:0011101
User 4
Code:1001110
User 5
Code:0100111
User 6
Code:1010011

User 7
Code:1101001
4.4 Full characteristic simulation on 3 Users SAC OCDMA
The setup of the 3 users SAC OCDMA network is introduced on chapter 3.3 and
chapter 4.3.1. Few simulations are done and discussed on research of the
characteristic of the communication network. All of the simulations are done in the
environment of Optisystem. Simulations done are:
One user network with different coding implement
Simulation on number of users in the network
The effects of the FBG cut off frequency bandwidth to the network
The effects of the changes of room temperature to the network
The effects of deflects FBGs to the network
4.4.1 One User network with different coding implement
In the beginning of this chapter, we discuss on the IM simulation and also implement
the white light source in to the IM simulation. The results come out that it shows, the
communication totally break down during long distances transmission or it‟s to be
said that white light source totally cannot function in IM transmission. But in an
OCDMA network, the white light is modulated and encode; the results shows a zero

error transmission with fiber length of 10km. Table 4-7 shows the BER and eye
diagram that is gain from the simulation on the one user transmission with different
coding.
On table 4-7, the BER for each coding is nearly to zero, the eye diagram gain
from the BERT during simulation show the eye widely open. This proves that when a
broadband source is encoded and decoded with optical codes, it shows better results
than normal CW laser IM transmission. This is due to the broadband source is able to
modulate more data‟s than the CW laser, with the condition of before match filtering;
the broadband light source is encoded and decoded properly.
Table 4-7 The BER and Eye diagram of one to one transmission with different
coding applied
User 1 (1010)
BER: 4.89E-188
User 2 (1100)
BER: 0

User 3 (1001)
BER: 5.60E-188
4.4.2 Simulation on number of users in the OCDMA network
With the increase of numbers of users in the network, it also increases the ISI to the
communication network. This is due to there will be crosstalk among the encoded
white light signals, when all the encoded white light signal is combined together with
a Nx1 power combiner for going through the SMF. Table4-8 shows the result gain
from the simulation.
According to table 4-8 we can see that, when the number of users decreases,
the BER also decreases. This means the lesser the number of users the better the
transmission.
Table 4-8 BER gain by changing the numbers of Users in the network
No. of Users User 1 User 2 User 3
1 user 7.154E-242 0.000E+00 2.443E-246
2 users 3.127E-19 2.392E-25 N/A
2 users 1.902E-91 N/A 1.693E-22
2 users N/A 4.131E-137 3.862E-33
3 users 9.832E-20 1.310E-26 4.587E-14

4.4.3 Effects of FBGs cut off frequency bandwidth to the network
The FBGs cut off frequency bandwidth shows an important role to the network. With
a smaller cut off frequency bandwidth the OCDMA system is able to use a longer
code length code; longer code means more users in the network. But smaller cut off
frequency bandwidth will cause the dispersion of signal during the transmission
through SMF; and cause the increase of BER. This means larger cut off frequency
bandwidth will have a smaller BER; but there still a limit on widening the cut off
frequency bandwidth, for avoiding crosstalk causing ISI to the network. Table 4-9
shows the results gain from the simulation.
Table 4-9, shows the BER of each user by changing the cut off frequency
bandwidth for each FBG in the network. It shows that the BER is affected by the
changing of cut off frequency bandwidth from a range of 0.1nm to 0.8nm. The best
results gain from the simulation is with a cut off frequency bandwidth of 0.6nm;
where the BER start to increase when the cut off frequency bandwidth is more widen.
This match with the statement above where there is a limit on increasing the cut off
frequency bandwidth of the FBG in the network. A significant result from table 4-9
proved the statement. This is also shown on figure 4.7 for a clearer view on the
effects of FBG cut off frequency bandwidth on the BER.
Table 4-9 BER gain by changing the cut off frequency bandwidth
Cut Off Frequency bandwidth (nm) BER
User 1 User 2 User 3
0.1 1.4959E-10 2.8756E-09 1.2899E-04
0.2 1.6052E-13 6.5145E-15 1.1210E-12
0.3 1.4554E-18 2.7435E-16 5.8001E-14
0.4 1.1552E-17 7.3115E-25 1.4911E-10
0.5 1.4304E-23 1.7414E-18 8.8888E-18
0.6 8.6812E-34 7.4491E-34 1.5489E-25
0.7 6.3010E-23 4.1260E-22 5.4499E-18
0.8 9.8324E-20 1.3104E-26 4.5873E-14
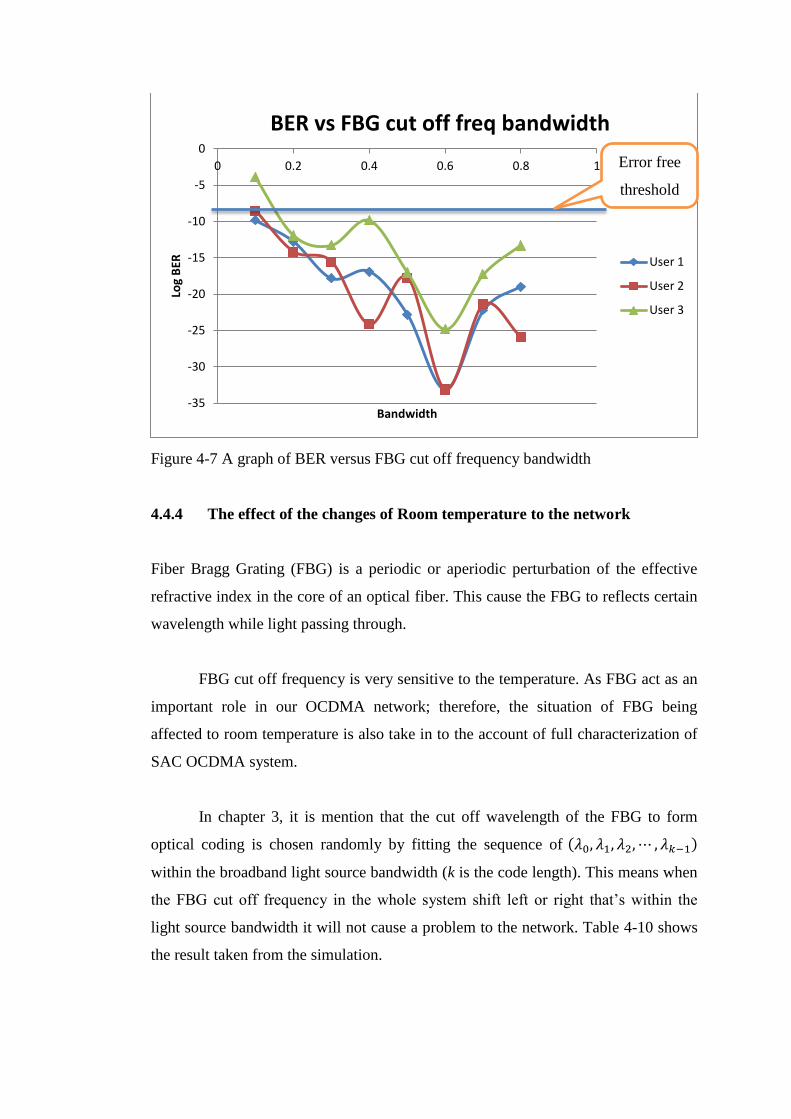
Figure 4-7 A graph of BER versus FBG cut off frequency bandwidth
4.4.4 The effect of the changes of Room temperature to the network
Fiber Bragg Grating (FBG) is a periodic or aperiodic perturbation of the effective
refractive index in the core of an optical fiber. This cause the FBG to reflects certain
wavelength while light passing through.
FBG cut off frequency is very sensitive to the temperature. As FBG act as an
important role in our OCDMA network; therefore, the situation of FBG being
affected to room temperature is also take in to the account of full characterization of
SAC OCDMA system.
In chapter 3, it is mention that the cut off wavelength of the FBG to form
optical coding is chosen randomly by fitting the sequence of
within the broadband light source bandwidth (k is the code length). This means when
the FBG cut off frequency in the whole system shift left or right that‟s within the
light source bandwidth it will not cause a problem to the network. Table 4-10 shows
the result taken from the simulation.
-35
-30
-25
-20
-15
-10
-5
0
0 0.2 0.4 0.6 0.8 1Lo
g B
ER
Bandwidth
BER vs FBG cut off freq bandwidth
User 1
User 2
User 3
Error free
threshold

Table 4-10 BER of FBG changes on room temperature
FBG cut off frequency
right shift
0.2 nm right shift
0.4 nm left shift 0.2nm
left shift 0.4 nm
BER
user 1 2.00028E-25 1.59760E-10 2.48815E-39 3.93668E-08
user 2 4.43354E-27 7.55003E-10 1.32784E-40 2.48854E-10
user 3 6.86133E-46 6.94498E-25 1.10271E-38 6.65098E-08
According to figure 4.8, we can see that during the FBG cut off frequency
right and left shift till 0.4nm, the BER increases till a non – error free communication
network. For FBG cut off frequency right or left shift of 0.2nm, the BER show it still
at an acceptance level, which is lower than the error free threshold. This is due to
during the FBG cut off frequency right or left shift of 0.2nm, the shifting still inside
the broadband light source bandwidth; as for FBG cut off frequency right or left shift
of 0.4, the FBG cut off frequency with a bandwidth of 0.6nm is out of the broadband
light source bandwidth. Figure 4.9 show an example that what happens when the
deep trench of the FBG cut off frequency is move out of the broadband light source
bandwidth. This is observed by probe the encoder (that consists of a series of FBG)
output with the optical spectrum analyzer (OSA) during simulation.
Figure 4-8 A graph the BER effected by temperature
-50
-45
-40
-35
-30
-25
-20
-15
-10
-5
0
0 0.5 1 1.5 2 2.5 3 3.5
log
BER
User
right shif 0.2 nm
right shif 0.4 nm
left shit 0.2nm
left shift 0.4 nm
Error free
threshold

Figure 4-9 FBG cut off frequency shift out of the broadband light source frequency
4.4.5 Effect of deflects FBG to the OCDMA network
To form a FBG is to print different reflective index on the fiber core. For the
OCDMA network, the cut off frequency should be very precise with less than 1% of
marginal error is allowed in the network. A deflects FBG is a FBG that is having an
inaccurate cut off frequency. For this situation it is take account in to the simulation
on characterizing the SAC-OCDMA network.
Few situation is take account in the simulation network, the results is shown
on table 4-11, 12 and 13. All three tables show the simulated results on few situation
of FBG deflect on the OCDMA system. All three table shows that when there is only
1 FBG deflects in the system, the communication network still an error free network.
But if more than 1 deflects in the system, the BER will increases dramatically. Figure
4.10 show a combination of all three tables.
There are few situation when the deflect FBG only occurs on one particular
user, this is shown on the table 4-12 and table 4-13 with the BER result in red font.
During this situation happens, the simulation shows that the user with the deflect
FBG; it will not cause problems to other users, as the BER increases only on that
This is the part where the
cut off trench shift out of
the light source
bandwidth

particular user with deflect FBG. Besides, with the BER increases on one user, the
other users in the system will have a decreased BER.
Table 4-11 Deflects FBGs on the encoder part
Deflects FBGs on the encoder part
No. of FBG deflects in the system Users BER
1
User 1 1.68529E-30
User 2 3.61505E-23
User 3 1.16080E-17
2
User 1 1.24562E-12
User 2 4.65162E-15
User 3 1.77671E-10
3
User 1 2.09327E-09
User 2 1.95838E-10
User 3 8.61583E-12
Table 4-12 Deflects FBGs on the decoder part
Deflects FBGs on the decoder part
No. of FBG deflects in the system Users BER
1
User 1 3.30246E-39
User 2 9.13967E-42
User 3 7.63175E-17
2
User 1 8.68122E-34
User 2 7.44913E-34
User 3 7.77489E-04
3
User 1 1.07218E-08
User 2 7.25744E-11
User 3 1.54892E-25
Table 4-13 Deflects FBGs on the encoder and decoder part
Deflects FBGs on the encoder and decoder part
No. of FBG deflects in the system Users BER
1
User 1 1.05125E-28
User 2 1.32784E-40
User 3 1.10270E-38
2
User 1 1.00000E+00
User 2 3.14638E-24
User 3 2.29049E-03
3
User 1 3.11442E-03
User 2 4.14992E-02
User 3 1.91094E-04

Figure 4-10 Deflects FBG in OCDMA system
4.5 Full characteristic simulation on 7 Users SAC-OCDMA with Walsh
Hadamard coding method
The setup of the 7 users SAC OCDMA network is introduced on chapter 3.3 and
chapter 4.3.2. Few simulations are done and discussed on research of the
characteristic of the communication network. All of the simulations are done in the
environment of Optisystem. Simulations done are:
One user network with different Walsh Hadamard coding implement
Simulation on number of users in the network
The effects of the FBG cut off frequency bandwidth to the network
Effect of FBG reflectivity to the SAC OCDMA system
4.5.1 One user network with different Walsh Hadamard coding implement
On chapter 4.4.1, the simulation on one user is the network is done on the 3 users
SAC OCDMA network on Walsh Hadamard code. For the 7 users of SAC- OCDMA
network, the Walsh Hadamard code comes with a different code length. The setup of
this simulation is stated on chapter 3 and the beginning part of chapter 4.
-45
-40
-35
-30
-25
-20
-15
-10
-5
0
1 2 3lo
g B
ER
Users
Effects of deflects FBG in OCDMA
1e
2e
3e
1d
2d
3d
1ed
2ed
3ec
Error free
threshold
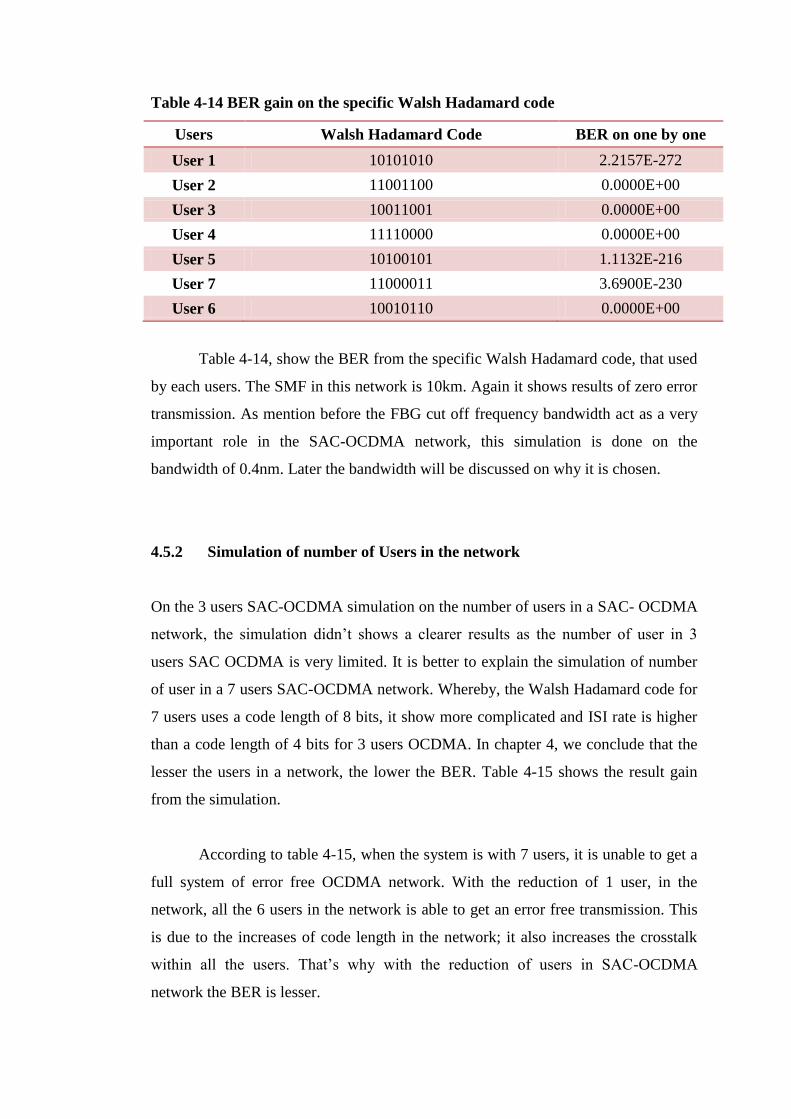
Table 4-14 BER gain on the specific Walsh Hadamard code
Users Walsh Hadamard Code BER on one by one
User 1 10101010 2.2157E-272
User 2 11001100 0.0000E+00
User 3 10011001 0.0000E+00
User 4 11110000 0.0000E+00
User 5 10100101 1.1132E-216
User 7 11000011 3.6900E-230
User 6 10010110 0.0000E+00
Table 4-14, show the BER from the specific Walsh Hadamard code, that used
by each users. The SMF in this network is 10km. Again it shows results of zero error
transmission. As mention before the FBG cut off frequency bandwidth act as a very
important role in the SAC-OCDMA network, this simulation is done on the
bandwidth of 0.4nm. Later the bandwidth will be discussed on why it is chosen.
4.5.2 Simulation of number of Users in the network
On the 3 users SAC-OCDMA simulation on the number of users in a SAC- OCDMA
network, the simulation didn‟t shows a clearer results as the number of user in 3
users SAC OCDMA is very limited. It is better to explain the simulation of number
of user in a 7 users SAC-OCDMA network. Whereby, the Walsh Hadamard code for
7 users uses a code length of 8 bits, it show more complicated and ISI rate is higher
than a code length of 4 bits for 3 users OCDMA. In chapter 4, we conclude that the
lesser the users in a network, the lower the BER. Table 4-15 shows the result gain
from the simulation.
According to table 4-15, when the system is with 7 users, it is unable to get a
full system of error free OCDMA network. With the reduction of 1 user, in the
network, all the 6 users in the network is able to get an error free transmission. This
is due to the increases of code length in the network; it also increases the crosstalk
within all the users. That‟s why with the reduction of users in SAC-OCDMA
network the BER is lesser.

Table 4-15 Effect of number of users in the SAC-OCDMA network to the BER
No. of Users
BER
User 1 User 2 User 3 User 4 User 5 User 6 User 7
1 9.32E-188
2 3.19E-28 1.22E-89
3 2.62E-23 1.90E-57 6.18E-24
4 1.48E-22 1.61E-36 3.74E-23 3.89E-15
5 6.07E-14 9.51E-23 3.91E-22 6.35E-17 1.78E-18
6 1.22E-10 2.99E-17 8.80E-14 3.21E-09 4.73E-11 7.37E-10
7 3.87E-08 7.00E-16 1.26E-12 3.03E-08 1.82E-12 1.25E-10 1.55E-09
4.5.3 The effects of FBG cut off frequency bandwidth to the network
As mention in chapter 4.4.3, the characteristic of the FBG act as an important role in
the network, especially the FBG cut off frequency bandwidth. Same as the
assumption given in chapter 4.4.3, every system have its ideal FBG cut off frequency
bandwidth to get the best results. Table 4-16; shows the BER gain from simulation
on changing the FBG cut off frequency bandwidth for encoder and decoder from
0.1nm to 0.5nm.
Table 4-16 Effects of FBG cut off frequency bandwidth on the BER
FBG Cut Off frequency
bandwidth(nm)
BER
User 1 User 2 User 3 User 4 User 5 User 6 User 7
0.1 3.882E-04 6.229E-06 2.650E-04 9.171E-03 3.244E-06 1.204E-04 6.518E-05
0.2 9.286E-08 3.575E-08 3.741E-08 9.011E-06 4.426E-11 7.753E-07 1.685E-12
0.3 3.867E-08 6.999E-16 1.257E-12 3.026E-08 1.820E-12 1.249E-10 1.553E-09
0.4 4.478E-13 3.683E-14 8.750E-12 2.223E-13 2.923E-12 1.123E-05 1.259E-07
0.5 1.113E-09 4.311E-08 1.820E-05 1.025E-08 3.305E-05 2.620E-03 3.443E-06

Figure 4-11 Effects of FBG cut off frequency bandwidth on the BER
4.5.4 The effects of FBG reflectivity to SAC-OCDMA network
A small brief introduction on FBG is given on chapter two, as FBGs is made up by a
SMF with different refractive index printed on the SMF core. So that the FBG
reflects a particular wavelengths of light and transmits all others. The FBG
reflectivity is the percentage of the power reflect back and also means the cut off
frequency power. Figure 4.12 (a) shows the output of a FBG with a reflectivity of 99%
that is taken from an OSA. Figure 4.12 (b) shows the output of a FBG with a
reflectivity of 99.98% that is taken from an OSA.
In the SAC-OCDMA network, the FBG reflectivity also a crucial aspect to
for having an error free SAC-OCDMA network. With a higher reflectivity, the
optical coding is able to have a higher contrast. This means the higher the reflectivity
the lower the BER of the network. The simulation is done on changing the
reflectivity of the FBGs on the SAC-OCDMA network and also done on different
cutoff frequency bandwidth. Table 4-17 show the results gain from the simulation.
-18
-16
-14
-12
-10
-8
-6
-4
-2
0
0 0.1 0.2 0.3 0.4 0.5 0.6Lo
g B
ER
FBG Cut Off Frequency Bandwidth (nm)
Bandwidth Vs BER
User 1
User 2
User 3
User 4
User 5
User 6
User 7

Figure 4-12 (a) FBG with a reflectivity of 99% (b) FBG with a reflectivity of 99.98%
Table 4-17 The BER for different FBG reflectivity and cut off frequency
bandwidth
FBG cut off
frequency bandwidth
FBG reflectivity
BER
User 1 User 2 User 3 User 4 User 5 User 6 User 7
0.3 0.99 2.075E-09 7.310E-14 1.959E-11 2.441E-13 3.278E-15 8.026E-07 9.314E-07
0.5 0.99 2.017E-11 3.873E-10 3.493E-10 3.485E-17 9.429E-10 2.232E-04 7.308E-08
0.3 0.9998 1.265E-07 1.177E-15 7.248E-13 4.461E-08 2.773E-13 1.387E-10 9.662E-10
0.5 0.9998 1.532E-09 4.624E-08 1.577E-05 1.185E-08 2.648E-05 2.550E-03 3.045E-06
Table 4-17 shows the BER for every user in the seven users SAC-OCDMA
with Walsh Hadamard codes network. From the table, the BER has taken from the
simulation of FBG with a reflectivity of 0.9998 shows a better result than the FBG
with a reflectivity of 0.99. But, when the FBG cut off frequency changes to a higher
bandwidth, the BER difference between two kinds of FBG reflectivity shows a little
difference. This is due to when the FBG cut off frequency bandwidth is broaden it
means that the incident wave is completely reflected before reaching the end of the
grating. That‟s why with a different reflectivity it makes no different in the results.
(a) (b)

81
4.6 Full characteristic simulation on 7 users SAC-OCDMA using M-
sequence code.
The setup of the 7 users SAC OCDMA network is introduced on chapter 3.3 and
chapter 4.3.2. Few simulations are done and discussed on research of the
characteristic of the communication network. All of the simulations are done in the
environment of Optisystem. Simulations done are:
One user network with different M-sequence coding implement
The effects of the FBG cut off frequency bandwidth to the network
Effect of FBG reflectivity to the SAC OCDMA system
4.6.1 One User network with different M-sequence coding implement
On chapter 4.4.1, the simulation on one user is the network is done on the 3 users
SAC OCDMA network on Walsh Hadamard code. For the 7 users of SAC- OCDMA
network, the Walsh Hadamard code comes with a different code length. At chapter
4.5.1, 7 users SAC-OCDMA show a very good result on having one user on the
network and implement each code available. As for the 7 users SAC-OCDMA M-
sequence coding method, same simulation is done on this method.
Table 4-18 BER gain on the specific M- sequence code
Users M-Sequence BER
user 1 1110100 0
user 2 0111010 0
user 3 0011101 0
user 4 1001110 1.101891e-319
user 5 0100111 0
user 6 1010011 0
user 7 1101001 0
Table 4-18, show the BER from the specific M-sequence code, that used by
each users. The SMF in this network is 10km. Again it shows results of zero error
transmission. As mention before the FBG cut off frequency bandwidth act as a very
important role in the SAC-OCDMA network, this simulation is done on the
bandwidth of0.3nm.

82
4.6.2 The effects of FBG cut off frequency bandwidth to the SAC-OCDMA
network
As mention in chapter 4.4.3, the characteristic of the FBG act as an important role in
the network, especially the FBG cut off frequency bandwidth. Same as the
assumption given in chapter 4.4.3, every system have its ideal FBG cut off frequency
bandwidth to get the best results. Table 4-19; shows the BER gain from simulation
on changing the FBG cut off frequency bandwidth for encoder and decoder from
0.1nm to 0.6nm.
Table 4-19 Effects of FBG cut off frequency bandwidth on the BER
FBG cut off frequency bandwidth
BER
User 1 User 2 User 3 User 4 User 5 User 6 User 7
0.1nm 1.70E-03 5.92E-03 1.03E-02 1.03E-03 1.10E-02 1.80E-02 1.14E-02 0.2nm 9.07E-10 1.74E-05 5.79E-05 3.11E-09 4.47E-04 7.78E-04 4.08E-05 0.3nm 1.78E-09 8.06E-18 3.69E-05 4.02E-16 2.54E-08 1.80E-04 1.20E-07 0.4nm 1.52E-10 2.79E-20 2.39E-08 2.79E-22 3.26E-07 8.51E-05 1.08E-09 0.5nm 2.34E-05 1.89E-13 6.83E-06 5.58E-55 5.89E-08 3.51E-04 2.21E-06 0.6nm 1.99E-04 9.49E-07 1.17E-07 4.03E-23 4.12E-06 2.98E-03 4.50E-04
Figure 4-13 Effects of FBG cut off frequency bandwidth on the BER
-60
-50
-40
-30
-20
-10
0
0.1 0.2 0.3 0.4 0.5 0.6
Log
BER
User
User 1
User 2
User 3
User 4
User 5
User 6
User 7

83
4.6.3 The effects of FBG reflectivity to SAC-OCDMA with M-sequence code
network
In the SAC-OCDMA network, the FBG reflectivity also a crucial aspect to for
having an error free SAC-OCDMA network. With a higher reflectivity, the optical
coding is able to have a higher contrast. This means the higher the reflectivity the
lower the BER of the network. The simulation is done on changing the reflectivity of
the FBGs on the SAC-OCDMA network and also done on different cutoff frequency
bandwidth. Table 4-20 show the results gain from the simulation.
Table 4-20 the effects of the FBG reflectivity to the SAC-OCDMA with m-
sequence code
FBG reflectivity
FBG cut off frequency bandwidth
BER
User 1 User 2 User 3 User 4 User 5 User 6 User 7
0.9998 0.1nm 1.697E-03 5.923E-03 1.032E-02 1.026E-03 1.101E-02 1.799E-02 1.137E-02
0.9998 0.2nm 9.071E-10 1.741E-05 5.787E-05 3.107E-09 4.471E-04 7.780E-04 4.077E-05
0.9998 0.3nm 1.777E-09 8.059E-18 3.693E-05 4.017E-16 2.543E-08 1.801E-04 1.204E-07
0.9998 0.4nm 1.524E-10 2.794E-20 2.395E-08 2.789E-22 3.261E-07 8.508E-05 1.083E-09
0.9998 0.5nm 2.343E-05 1.894E-13 6.835E-06 5.583E-55 5.891E-08 3.508E-04 2.212E-06
0.9998 0.6nm 1.993E-04 9.487E-07 1.174E-07 4.025E-23 4.122E-06 2.982E-03 4.503E-04
0.99 0.1nm 2.316E-04 6.279E-03 8.327E-03 1.652E-03 7.656E-03 2.644E-02 6.875E-03
0.99 0.2nm 3.017E-12 9.604E-05 5.742E-06 5.014E-09 4.350E-05 3.026E-03 2.104E-04
0.99 0.3nm 2.655E-08 3.354E-14 1.945E-09 4.506E-08 5.427E-09 5.194E-04 4.041E-05
0.99 0.4nm 9.220E-06 3.724E-13 6.572E-12 1.073E-10 3.969E-10 6.200E-06 1.983E-06
0.99 0.5nm 3.052E-08 1.218E-10 1.377E-07 1.469E-14 9.390E-10 7.105E-05 2.239E-05
0.99 0.6nm 5.072E-06 7.535E-14 1.265E-06 1.540E-21 6.548E-07 1.936E-03 1.941E-04
Table 4-20 shows the BER for every user in the seven users SAC-OCDMA
with M sequence code network. From the table, the BER have taken from the
simulation of FBG with a reflectivity of 0.9998 shows a better result than the FBG
with a reflectivity of 0.99. But, when the FBG cut off frequency changes to a higher
bandwidth, the BER difference between two kinds of FBG reflectivity shows a little
difference. This is due to when the FBG cut off frequency bandwidth is broaden it
means that the incident wave is completely reflected before reaching the end of the

CHAPTER 5
5 CONCLUSION AND RECOMMENDATIONS
5.1 Conclusion
Throughout the simulation conducted in Optisystem, the basic idea about optical
communication is understand, throughout the simulation of Intensity Modulation
network, with the combination of different modulation format on (Return to Zero)
RZ and (Non-Return to Zero) NRZ. Besides that, the construction a Spectral
Amplitude Coding (SAC) – OCDMA or Frequency Encoded (FE) – OCDMA
simulation increases the understanding of OCDMA system. Furthermore, the
increase number of users to the SAC-OCDMA network by integrating different
coding methods is studied and simulated.
A SAC-OCDMA uses broadband light source for intensity modulation, for
the sake of the data from different users is able to undergo modulation and
transmission over a SMF. For a normal one user to one user intensity modulation
network, broadband light source is not suitable for the network as; the dispersion rate
of the broadband light source is very high. That is why the results show a difference
between normal IM and OCDMA network.
Moreover, SAC-OCDMA integrates Optical coding methods to increase the
number of subscribers and the security levels of the network. In this report two kinds
of optical coding methods is studied and simulated with the SAC-OCDMA network.
Both optical coding methods are Walsh Hadamard code and M-sequence code. Both

codes are characterized based on simulations of different scenarios, and both off the
coding methods provide a very good results in the SAC-OCDMA system.
Furthermore, the Fiber Bragg Gratings act as a very important role on the
SAC-OCDMA network. If the Fiber Bragg Gratings are not well fabricated, the
whole SAC-OCDMA network will sure breakdown. That‟s why the basic knowledge
and characteristics are studied. Based on the few characteristic of a FBG, for
example the cutoff frequency bandwidth and the reflectivity; that will cause some
changes to the network, simulations are done.
Finally, based on all the simulation is done. A full characterization of both 3
users and 7 users SAC-OCDMA system are discussed. From all the simulations done,
the characteristics of SAC-OCDMA are well noticeable and understand.
5.2 Recommendations
With the simulation environment in Optisystem, the basic idea to construct the SAC-
OCDMA network is achieved. All the parameters can be altered to be suit the reality
environment, but it is best if we were given a chance to do hand on experiment. With
the real experiment equipment on hand, the skill of troubleshoot the complexity of
running on an optical experiment can be an extra advantage. The skill of splicing
technique, utilizing a real Optical Spectrum Analyzer (OSA) and Bit Error Rate
Tester (BERT), fabricating Fiber Bragg Grating filters that can be incorporate in to
the SAC-OCDMA network. With these skills, it prepared us to face the real industry
world of Optical Communication. The parameter given, are treated as a guideline and
the SAC-OCDMA network are capable for fine tuning. Furthermore, the simulated
results are able to compare with the real experiment, to prove that how well is the
SAC-OCDMA actually performed.

86
5.3 Future Work
Ever since completing this thesis report, optical communication design is learned.
The basic and yet crucial technique is to simulate an OCDMA network for multiple
access. In future, if a chance, a proper time and opportunity is given, I am willing to
explore deeper in different kinds of OCDMA methods. Besides that, for the
investigation it will be on 2D coding methods for increasing the numbers of
subscribers, data rate and transmission length; and the different kinds of OCDMA
network that is more complex and required lots of research and experiment are both
take in to account.

87
REFERENCES
[1] T.H.Maiman, Stimulated optical radiation in ruby. London: Nature, 1987.
[2] G.A. Hockham K.C.Kao, "Dielectric fibre surface waveguides for optical
frequencies," Proc. IEE, pp. 1151-1158, 1966.
[3] Volker Kuhn, Wireless Communications over MIMO Channels.: John Wiley &
Sons, Ltd, 2006.
[4] R. Dixon, Spread Spectrum Systems. New York: Wiley Interscience.
[5] R. Dixon, "Why Spread Spectrum," IEEE Commun. Soc. Mag, vol. 13, no. 21,
1975.
[6] D.Schilling and L.Milstein R.Pickholtz, "The Spread Spectrum concept," IEEE
Trans. Commun, vol. 25, no. 8, p. 748, 1997.
[7] P.C. Teh, "Applications of superstructure fibre Bragg gratings for optical code
division multiple access and packet switched networks.," in Doctoral Thesis.
University of Southampton: Optoelectronic Research Centre, 2003, p. 230.
[8] O.G. Ramer E.Marom, "Encoding and Decoding optical fiber network,"
Electron Lett., vol. 14, no. 3, p. 48, 1978.
[9] C.C. Chang, A.M. Weiner H.P.Sardesai, "A femtosecond code division multiple
access communication test bed," IEEE Journal of Lightwave Technology, vol.
16, pp. 1953-1964, 1998.
[10] S.Benedetto, and A.E. Willner L.G. Kazovsky, Optical Fibre Communication
System.: Artech House, 1996.
[11] P. R. Prucnal, Optical code division multiple access: fundamentals and
application. Taylor &Francis Group, 2006.
[12] E.Marom and O.G. Ramer, "Encoding-decoding optical fibre network ,"
Electron Lett, vol. 14, no. 3, p. 48, 1987.
[13] Nikos Karafolas and Deepak Uttamchandani, "Optical Fiber Code Division
Multiple Access Network: A Review," Optical Fiber Tech, vol. 2, pp. 149-168,

88
1996.
[14] M.Brandt-Pearce and B. Aazhang, "Multiuser detection for optical code division
multiple access system," IEEE Trans Commun, vol. 42, pp. 2-4, 1994.
[15] I.Sanz and M.A. Muriel, "New code division multiple access encoder/ decoder,"
Opt Engineering, vol. 32, no. 3, p. 481, 1993.
[16] Y.L. Chang and M.E. Marhic, "Fiber Optic ladder network for inversr decoding
coherent CDMA," IEEE J.Lightwave Tech, vol. 10, 1992.
[17] D.D.Sampson and D.A. Jackson R.A. Griffin, "Optical phase coding for code
division multiple access," IEEE Phoyon Technol Latter, vol. 4, no. 12, p. 1401,
1992.
[18] Michel E.Marhic, "Coherent Optical CDMA Network," Lightwave Tech, vol.
11, no. 5, 1993.
[19] M. Santoro and T. Fan P.Prucnal, "Spread Spectrum fibre optic local area
network using optical processing," IEEE Lightwave Tech, vol. 4, no. 5, p. 307,
1986.
[20] D.T.K.Tong, M.C.Wu, and E.Yablonvitch C.F.Lam, "Experimental
demonstration of bipolar optical CDMA system using a balance transmitter and
complementary spectral encoding," IEEE Photonic Tech Lett, vol. 10, pp. 1504-
1506, 1998.
[21] H.Takenouchi, T.Ishii, K.Okamoto, T.Goh, K.Sato, A.Harano H.Tsuda,
"Spectral encoding and decoding of 10 Gbit/s femtosecod pulses using high
resolution arrayed waveguide grating," IEEE Electronic Lett, vol. 35, pp. 1186-
1187, 1999.
[22] S. Makrimichalou, and A. S. Holmes R. R. A. Syms, "High-speed optical signal
processing potential of grating-coupled waveguide filters," Appl.Opt, vol. 30,
no. 26, p. 3762, 1991.
[23] J. Kim, and S-.W. Seo C-.K. Lee, "Generation and performance analysis of the
frequency hopping optical orthogonal codes with arbitrary time blank patterns.,"
in Proceedings of IEEE International Conference on Communications, 2001,
pp. 1275-1279.
[24] Jongyoon Shin, and Namkyoo Park Kyoungsik Yu, "Wavelength-Time
Spreading Optical CDMA System Using Wavelength Multiplexers and Mirrored

89
Fiber Delay Lines," IEEE Photonics Technology Letters, vol. 12, no. 9, pp.
1278-1280, 2000.
[25] David J.Richardson Hongxi Yin, Optical Code Division Multiple Access
Communication Networks. Beijing: Springer, 2008.
[26] Lawrence R. Chen, "Flexible Fiber Bragg Grating Encoder/Decoder for Hybrid
Wavelength Time Optical CDMA," IEEE Photonics Technology Letters, vol.
13, no. 11, pp. 1233-1235, 2001.
[27] H. M. H. Shalaby, and H. Ghafouri-Shiraz Zou Wei, "Modified Quadratic
Congruence Codes for Fiber Bragg-Grating-Based Spectral-Amplitude-Coding
Optical CDMA System," IEEE/OSA Journal of Lightwave Technology, vol. 19,
no. 9, pp. 1274-1281, 2001.
[28] G. -C. Yang and W. C. Kwong, Prime Codes with Applications to CDMA
Optical and Wireless network.: Artech House, 2002.
[29] Yasheng Qian Zhigang Cao, The principle of modern telecommunication.:
Tsinghua University Press, 1992.
[30] Y. Fujii, D. C. Johnson, and B. S. Kawasaki K. O. Hill, "Photosensitivity in
optical fiber waveguides: Application to reflection filter fabrication," Appl Phys
Lett, vol. 32, no. 1978, pp. 647-649.
[31] V. Mizrahi, P. J. Lemaire, and D. Monroe T. Erdogan, "Decay of ultraviolet-
induced fiber Bragg gratings," Appl Phys, vol. 76, pp. 73-80, 1994.
[32] Chen Mu Tsai, and Ming Wei Kang Jen Fa Huang, "Optical Spectral-Amplitude
Coder/Decoders Structured with Circulator-Free Fiber-Gratings Array," in
Proceedings of 2004 International Symposium on Intellegent Signal Processing
and Communication Systems, 2004, pp. 550-554.

90
APPENDICES
APPENDIX A: Simulation Environments
3-user SAC-OCDMA with Walsh Hadamard code

91
Intensity Modulation with NRZ modulation format
Intensity Modulation with RZ modulation format

92
7 User SAC OCDMA