Optical and Thermo-optical Properties of Polyimide- … to their exceptional physical and mechanical...
24
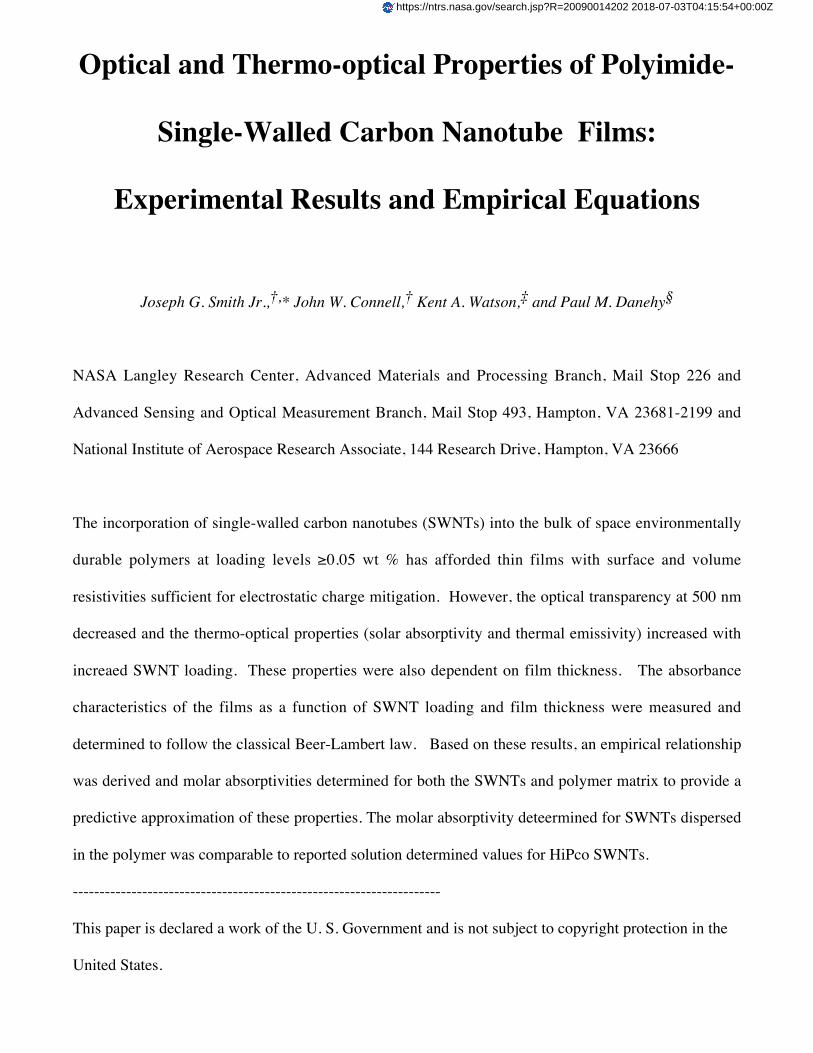
Optical and Thermo-optical Properties of Polyimide- Single-Walled Carbon Nanotube Films: Experimental Results and Empirical Equations Joseph G. Smith Jr., †, * John W. Connell, † Kent A. Watson, ‡ and Paul M. Danehy § NASA Langley Research Center, Advanced Materials and Processing Branch, Mail Stop 226 and Advanced Sensing and Optical Measurement Branch, Mail Stop 493, Hampton, VA 23681-2199 and National Institute of Aerospace Research Associate, 144 Research Drive, Hampton, VA 23666 The incorporation of single-walled carbon nanotubes (SWNTs) into the bulk of space environmentally durable polymers at loading levels ≥0.05 wt % has afforded thin films with surface and volume resistivities sufficient for electrostatic charge mitigation. However, the optical transparency at 500 nm decreased and the thermo-optical properties (solar absorptivity and thermal emissivity) increased with increaed SWNT loading. These properties were also dependent on film thickness. The absorbance characteristics of the films as a function of SWNT loading and film thickness were measured and determined to follow the classical Beer-Lambert law. Based on these results, an empirical relationship was derived and molar absorptivities determined for both the SWNTs and polymer matrix to provide a predictive approximation of these properties. The molar absorptivity deteermined for SWNTs dispersed in the polymer was comparable to reported solution determined values for HiPco SWNTs. --------------------------------------------------------------------- This paper is declared a work of the U. S. Government and is not subject to copyright protection in the United States. https://ntrs.nasa.gov/search.jsp?R=20090014202 2018-07-03T04:15:54+00:00Z
Transcript of Optical and Thermo-optical Properties of Polyimide- … to their exceptional physical and mechanical...
Optical and Thermo-optical Properties of Polyimide-
Single-Walled Carbon Nanotube Films:
Experimental Results and Empirical Equations
Joseph G. Smith Jr.,†,* John W. Connell,† Kent A. Watson,‡ and Paul M. Danehy§
NASA Langley Research Center, Advanced Materials and Processing Branch, Mail Stop 226 and
Advanced Sensing and Optical Measurement Branch, Mail Stop 493, Hampton, VA 23681-2199 and
National Institute of Aerospace Research Associate, 144 Research Drive, Hampton, VA 23666
The incorporation of single-walled carbon nanotubes (SWNTs) into the bulk of space environmentally
durable polymers at loading levels ≥0.05 wt % has afforded thin films with surface and volume
resistivities sufficient for electrostatic charge mitigation. However, the optical transparency at 500 nm
decreased and the thermo-optical properties (solar absorptivity and thermal emissivity) increased with
increaed SWNT loading. These properties were also dependent on film thickness. The absorbance
characteristics of the films as a function of SWNT loading and film thickness were measured and
determined to follow the classical Beer-Lambert law. Based on these results, an empirical relationship
was derived and molar absorptivities determined for both the SWNTs and polymer matrix to provide a
predictive approximation of these properties. The molar absorptivity deteermined for SWNTs dispersed
in the polymer was comparable to reported solution determined values for HiPco SWNTs.
---------------------------------------------------------------------
This paper is declared a work of the U. S. Government and is not subject to copyright protection in the
United States.
https://ntrs.nasa.gov/search.jsp?R=20090014202 2018-07-03T04:15:54+00:00Z
Corresponding author. E-mail: [email protected]
† NASA Langley Research Center, Advanced Materials and Processing Branch
§ NASA Langley Research Center, Advanced Sensing and Optical Measurement Branch
‡National Institute of Aerospace
Introduction
Space durable polymeric films are one of several enabling technologies for Gossamer spacecraft.1
These vehicles are large, deployable and ultra-lightweight and would be partially constructed of
polymer films. To be durable to the space environment, the film needs to exhibit resistance to electrons,
protons, and UV and vacuum UV radiation. For some applications, the film must also possess low solar
absorptivity (i.e. low-color), optical transparency across the visible spectrum (particularly at 500 nm),
and high thermal emissivity (e). Optical transparency at 500 nm is of interest since this is the
wavelength at which the solar maximum occurs. The solar absorptivity (a) pertains to the fraction of
incoming solar energy that is absorbed by the film and is typically low for a low color film. The e is a
measure of the film’s ability to radiate energy from the film surface. Films that exhibit low a and high e
values are desirable since little radiation would be absorbed while most of the radiation impinging upon
it would be radiated away from the surface. It is known that these properties are dependent upon film
thickness and inclusion of an absorbing species.
In addition to the aforementioned properties, intrinsic electrical conductivity (measured as
resisitivity) is needed to mitigate electrostatic charge (ESC) accumulation. ESC build-up occurs upon
exposure of insulating materials such as polymers to a charged orbital environment. When discharge
occurs, damage to surrounding materials and electronics on the spacecraft can result. The level of
surface resistivity required to mitigate ESC accumulation is in the range of 106-1010 W/square.2
Due to their exceptional physical and mechanical properties as well as radiation resistance, aromatic
polyimides are excellent materials for these applications. Respectable space environmental durability
and low color and a have been attained by proper choice of the constituent monomers.3,4 Sufficient
intrinsic conductivity (measured as resisitivity) for ESC mitigation has been achieved by the
incorporation of SWNTs into the bulk5-10 of space durable polymers (e.g. TOR-NC , LaRC™ CP-2, and
modified LaRC™ CP-2) as well as a surface coating.11 Bulk inclusion of SWNTs afforded films that
exhibited both surface and volume resistivity. Surface coating afforded only one conductive side
(measured as resisitivity) with the bulk and opposing side being insulative.
It was found that surface coating of SWNTs had a negligible effect upon the optical transparency, a,
and e compared to the pristine material.11 However, bulk inclusion of SWNTs at the loading levels
necessary to reach the electrical percolation threshold caused significant darkening resulting in
decreased % transmission (%T) at 500 nm and increased a and e for films of approximately the same
thickness.5,7,10 The absorbance at 500 nm and a of the SWNTs included in the bulk of the polymer was
observed to follow the classic Beer’s law equation when plotted vs. wt % SWNT loading. Similar
results were obtained for SWNTs (produced by the HiPco process) “dissolved” or “suspended” in 1,2-
dichlorobenzene12 and for functionalized SWNTs (produced by arc discharge) dissolved in solution.13 In
all cases, light scattering due to the SWNT bundles affected the results. For film samples, the results
were also affected by reflectivity losses at the polymer-air interface.
Due to the adherence of the nanocomposites to Beer’s law, it was of interest to further examine this
effect and attempt to develop a predictive empirical eq for these properties (absorbance and a). This is
important given that ultra-thin films (<3 mm) would be needed for proposed Gossamer strucutres. In this
work, nanocomposite films of an alkoxysilane terminated LaRC™ CP-2 polymer and purified high-
pressure carbon monoxide (HiPco) SWNTs were prepared to evaluate the effects of SWNT
incorporation upon the optical transparency at 500 nm, a, and e. This was performed at different SWNT
loadings and film thickness. The data was subsequently examined using Beer’s (absorbance vs.
concentration) and Lambert’s (absorbance vs. film thickness) laws with the results described herein.
Experimental Section
Materials. The following chemicals were obtained from the indicated sources and used without
further purification: aminophenyltrimethoxysilane (APTS, Gelest Inc., ~90% meta, ~10% para), 1,3-
bis(3-aminophenoxy)benzene (APB, Mitsui Chemicals America, Inc. mp 107-108.5 °C), and N,N-
dimethylacetamide (DMAc, Aldrich). 4,4’-Hexafluoroisopropylidiene diphthalic anhydride (6-FDA,
Hoechst Celanese Inc., mp 241-243 °C) was sublimed prior to use. SWNTs prepared by the HiPco
process were obtained from Tubes@Rice and purified by heating at 250 °C for ~16 h in a high humidity
chamber over moist air followed by Soxhlet extraction with hydrochloric acid (22.2 wt%) for ~24 h.
All other chemicals were used as received.
Alkoxysilane Terminated Amide Acid Synthesis. An alkoxysilane terminated amide acid
(ASTAA) of LaRC™ CP-2 was prepared by the reaction of 6-FDA with APB and end-capped with
APTS at a 2.5% offset. First, APB (6.3870 g, 0.0218 mol) and APTS (0.2390 g, 0.0011 mol) were
dissolved in DMAc (7 mL) at room temperature under nitrogen. The flask was subsequently immersed
in a room temperature water bath to dissipate the heat of reaction when the dianhydride was added.
Then 6-FDA (9.9547 g, 0.0224 mol) was added in one portion as a slurry in DMAc (10 mL) and rinsed
in with 18 mL of DMAc to afford a ~33.5% (w/w) solution. The reaction was stirred for ~24 h at room
temperature under nitrogen. An aliquot was removed to determine inherent viscosity. The remaining
solution was used as is or SWNTs were added as described below.
SWNT-ASTAA Mixture. Nanocomposite solutions were prepared by the addition of a sonicated
mixture of SWNTs in DMAc to a pre-weighed ASTAA solution. The SWNT loadings were 0.03, 0.05,
and 0.08 wt % based on the mass of ASTAA. After stirring at room temperature under a nitrogen
atmosphere for ~16 h, the solutions were used to cast unoriented thin films. A representative procedure
is described.
To a 100 mL round-bottom flask equipped with nitrogen inlet, mechanical stirrer, and drying tube
filled with calcium sulfate was charged 11.06 g of an ASTAA solution [~33.5% (w/w)]. In a separate
vial, SWNTs (0.0011 g) were placed in 3 mL of DMAc and the mixture sonicated for ~2.5 h in a
Degussa-Ney ULTRAsonik 57X cleaner operated at ~50% power and degas levels. The initial
temperature of the water bath was ambient and ~40 °C at the conclusion of sonication. The suspended
tubes were subsequently added to the stirred mixture of ASTAA at room temperature and rinsed in with
4.5 mL of DMAc to afford an ~20% (w/w) solution. The SWNT loading was 0.03 wt %. The mixture
was stirred for ~16 h under a nitrogen atmosphere at room temperature prior to film casting.
Films. DMAc solutions of the ASTAAs (with and without SWNTs as described above) were
doctored onto clean, dry plate glass and dried to tack-free forms in a low humidity chamber at ambient
temperature. The films on glass were stage cured in a forced air oven at 100, 200, and 300 °C for 1 h
each. The films were subsequently removed from the glass plate and characterized.
Characterization. Elemental analysis was performed by Desert Analytics (Tucson, Arizona).
Inherent viscosities (hinh) were obtained on a 0.5% (w/v) amide acid solution in DMAc at 25 °C. DSC
was conducted on a Shimadzu DSC-50 thermal analyzer. Melting point ranges (tangent of onset to melt
and the endothermic peak) were determined by either DSC at a heating rate of 10 °C/min or visually on
a Thomas-Hoover capillary melting point apparatus (uncorrected). Film thickness was determined on a
Testing Machines, Inc. digital micrometer. UV/VIS/near-IR spectra were obtained on thin films using a
Perkin-Elmer Lambda 900 UV/VIS/near-IR spectrometer. The a was measured on thin films using an
AZ Technology Model LPSR-300 spectroreflectometer with measurements taken between 250 to 2800
nm. Vapor-deposited aluminum on Kapton® film (1st surface mirror) was used as the reflective
reference for air mass 0 per ASTM E903. An AZ Technology Temp 2000A infrared reflectometer was
used to measure e. Surface resistivity was determined according to ASTM D-257-99 using a Prostat®
PSI-870 Surface Resistance and Resistivity Indicator operating at 9 V and reported as an average of
three readings.
RESULTS AND DISCUSSION
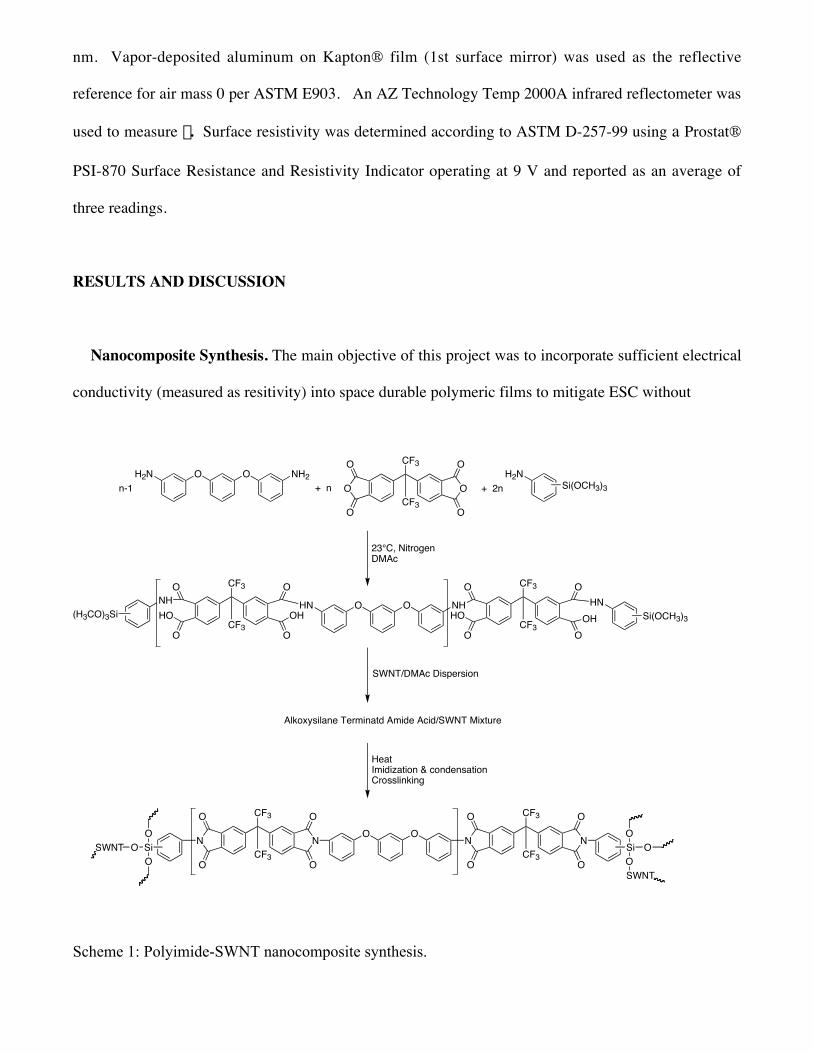
Nanocomposite Synthesis. The main objective of this project was to incorporate sufficient electrical
conductivity (measured as resitivity) into space durable polymeric films to mitigate ESC without
H2N O O NH2O O
O O
O O
CF3H2N
Si(OCH3)3CF3
HNSi(OCH3)3
NH(H3CO)3Si
HN O O NH
O O
O O
CF3
CF3
O O
O O
CF3
CF3HO OH HO OH
n-1 + n + 2n
SiSiO O
O O
O O
CF3
CF3
O O
O O
CF3
CF3
N NNN
O
OO
O
OOSWNT
SWNT
Alkoxysilane Terminatd Amide Acid/SWNT Mixture
SWNT/DMAc Dispersion
23°C, NitrogenDMAc
HeatImidization & condensationCrosslinking
Scheme 1: Polyimide-SWNT nanocomposite synthesis.
detrimental effects to the optical and thermo-optical properties of the pristine material. As previously
reported, the method used involved the preparation of an amide acid of a space durable polymer
(LaRC™ CP-2) endcapped with latent reactive groups, alkoxysilanes (Scheme 1).10 The endcapping
agent employed was aminophenyltrimethoxysilane. To incorporate sufficient resisitivity for ESC
mitigation into the material without affecting other desirable properties, SWNTs were used. The reasons
for choosing SWNTs were:
1) their inherent size, which would potentially have a negligible effect upon the thermo-optical and
optical properties of the base polymer,
2) their high aspect ratio, which suggests that a relatively low loading level would be needed to
reach the electrical percolation threshold, and
3) their high electrical conductivity.
The SWNTs employed in this work were prepared by the HiPco process and purified prior to use.
Elemental analysis afforded the following results: 89% C, 0.5% H, and 1.8% Fe. The results imply that
not all of the iron was removed. The residual iron is postulated to be due to catalyst entrapped inside
the nanotube or encased in an amorphous carbon cage. The remaining mass balance (8.7%) is
presumably due to oxygen in the form of carbon-oxygen bonded species such as carboxylic acid and
hydroxyl groups14,15 located at defect sites along the tube or at the tube ends. For these SWNTs, the
oxygen content was not determined by elemental analysis.
The SWNTs were added to the ASTAA solution and the mixture stirred under low shear prior to
casting unoriented films. The room temperature dried films were stage cured and imidized to 300 °C in
flowing air prior to analysis. It was postulated that a chemical reaction would occur between the
alkoxylsilane endcap and functionalities on the SWNT due to the purification procedure.10 Direct
observance of any chemical bond formation has been difficult to ascertain based on conventional
spectroscopic techniques. The Raman spectra of the SWNTs before and after a model reaction were
similar in appearance with slight differences in the radial breathing mode being apparent.10 Additionally,
analysis by high resolution scanning electron microscopy (HRSEM) revealed a light organic coating on
SWNTs that was not present on the purified SWNTs.10
The thermal, mechanical, optical, and electrical properties of nanocomposites of approximately the
same thickness (38 mm) have been previously reported.7,10 The hinh of the ASTAA used to prepare the
nanocomposite films was 0.88 dL/g (indicative of high molecular weight) with SWNT loadings ranging
from 0 to 0.08 wt %. HRSEM suggested that the SWNTs were well dispersed in the matrix with no
visible large agglomerates; however, localized regions of low and high SWNT concentration were
evident.10 From that work, a SWNT loading of ≥0.05 wt % was found to afford sufficient surface
resistivity necessary for ESC mitigation (Table 1).
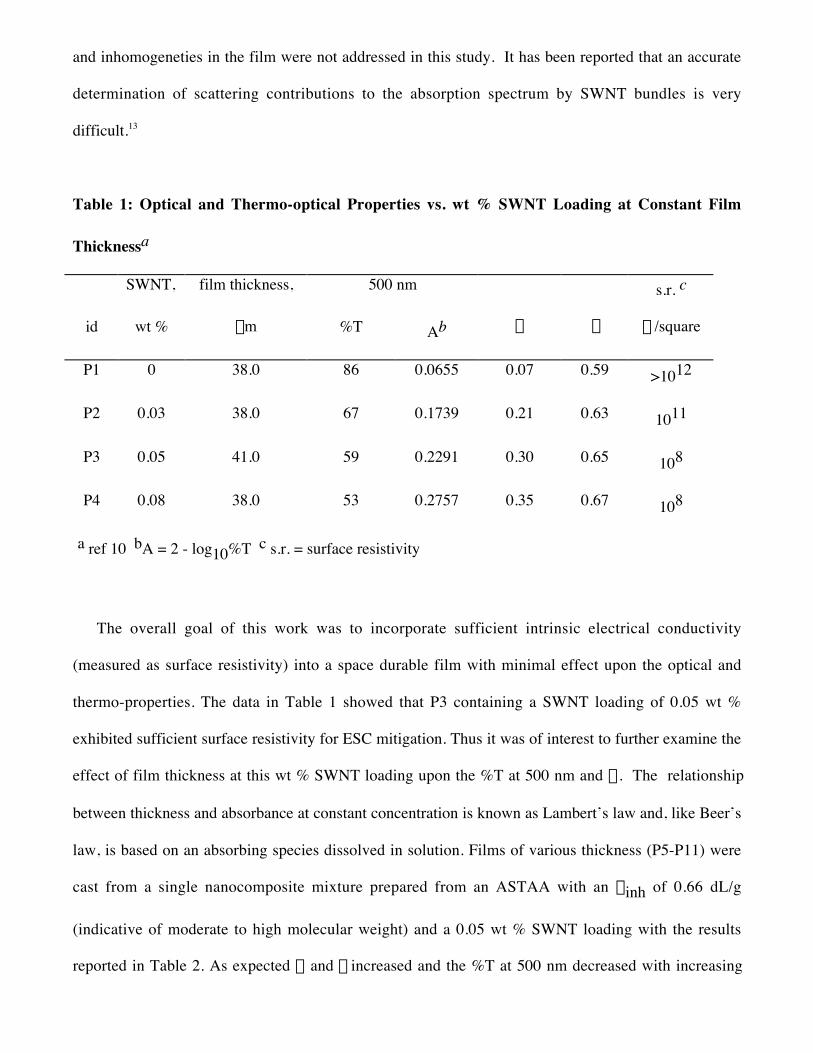
Optical and Thermo-optical Properties. It was found that for increasing SWNT loading (P2-P4),
the %T at 500 nm decreased while a and e increased with respect to the pristine material, P1 (Table 1).
Additionally, it was determined that the absorbance (A, where A = 2 - log10%T) adhered to Beer’s law
when plotted vs. SWNT wt % loading.10 However, the classic Beer’s law eq (A = abc) examines the
effect of increasing concentration (c) upon absorbance at constant path length (b). When the
concentration is expressed in units of mol/L and the path length in cm, then the absorptivity (a) is the
molar absorptivity expressed in units of L/(cm mol). This relationship, originally derived for solutions
containing various concentrations of an absorbing species in a cell (typically matching quartz cuvette)s
of a constant path length (typically 1 cm), was found to applicable to thin films as well.16 The plotted
data resulted in a non-zero y-intercept and was presumably due to light scattering and reflection in the
film.16 The a, an absorptive property which encompasses the spectral region ranging from 250-2800
nm, was also found to obey Beer’s law even though it was determined using a different instumental
setup.10 Based on the adherence to Beer’s law for both absorbance and a, it was of interest to further
investigate this effect taking into account reflectivity losses at the film surfaces in order to develop
empirical relationships to predict these properties. Losses due to light scattering by SWNT aggregates
and inhomogeneties in the film were not addressed in this study. It has been reported that an accurate
determination of scattering contributions to the absorption spectrum by SWNT bundles is very
difficult.13
Table 1: Optical and Thermo-optical Properties vs. wt % SWNT Loading at Constant Film
Thicknessa
SWNT, film thickness, 500 nm s.r. c
id wt % mm %T Ab a e W/square
P1 0 38.0 86 0.0655 0.07 0.59 >1012
P2 0.03 38.0 67 0.1739 0.21 0.63 1011
P3 0.05 41.0 59 0.2291 0.30 0.65 108
P4 0.08 38.0 53 0.2757 0.35 0.67 108
a ref 10 bA = 2 - log10%T c s.r. = surface resistivity
The overall goal of this work was to incorporate sufficient intrinsic electrical conductivity
(measured as surface resistivity) into a space durable film with minimal effect upon the optical and
thermo-properties. The data in Table 1 showed that P3 containing a SWNT loading of 0.05 wt %
exhibited sufficient surface resistivity for ESC mitigation. Thus it was of interest to further examine the
effect of film thickness at this wt % SWNT loading upon the %T at 500 nm and a. The relationship
between thickness and absorbance at constant concentration is known as Lambert’s law and, like Beer’s
law, is based on an absorbing species dissolved in solution. Films of various thickness (P5-P11) were
cast from a single nanocomposite mixture prepared from an ASTAA with an hinh of 0.66 dL/g
(indicative of moderate to high molecular weight) and a 0.05 wt % SWNT loading with the results
reported in Table 2. As expected a and e increased and the %T at 500 nm decreased with increasing
film thickness. Initial plots of absorbance and a were vs. film thickness were found to obey Lambert’s
law. However as mentioned above, losses due to reflectivity and light scattering were not taken into
account. The surface resistivities were ~108 W/square with an order of magnitude increase for P9-P11.
These values were comparable to P3. Film P5 had some surface areas
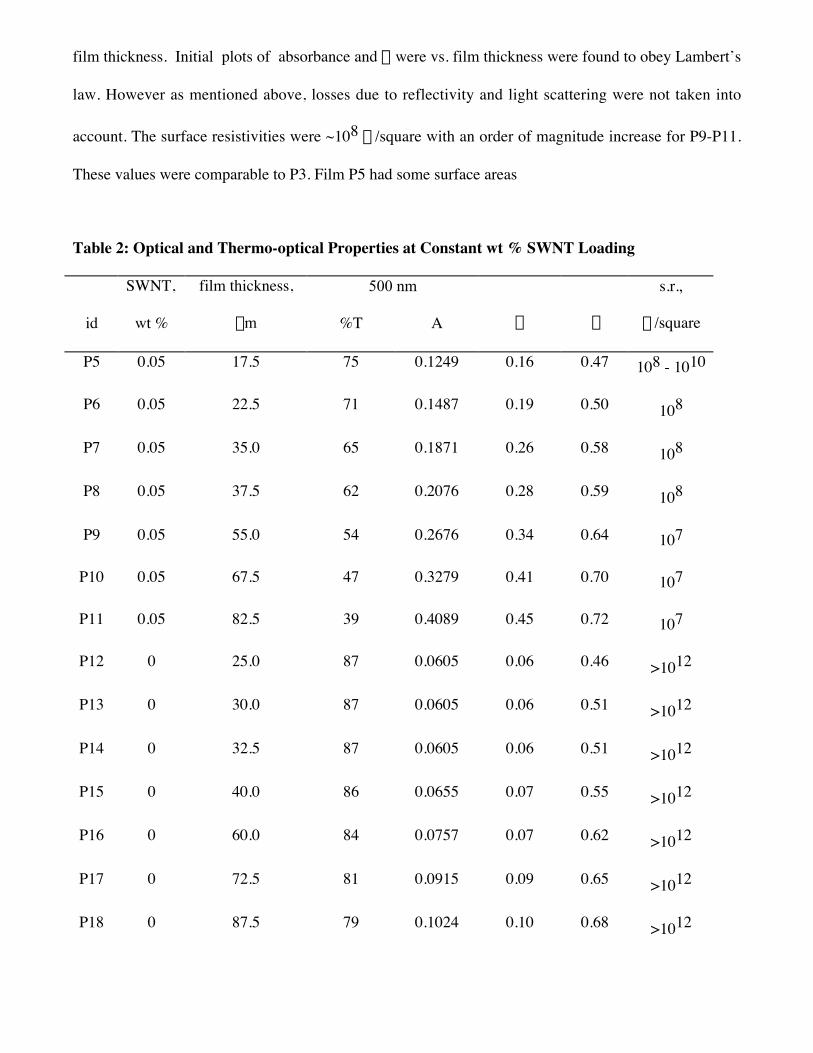
Table 2: Optical and Thermo-optical Properties at Constant wt % SWNT Loading
SWNT, film thickness, 500 nm s.r.,
id wt % mm %T A a e W/square
P5 0.05 17.5 75 0.1249 0.16 0.47 108 - 1010
P6 0.05 22.5 71 0.1487 0.19 0.50 108
P7 0.05 35.0 65 0.1871 0.26 0.58 108
P8 0.05 37.5 62 0.2076 0.28 0.59 108
P9 0.05 55.0 54 0.2676 0.34 0.64 107
P10 0.05 67.5 47 0.3279 0.41 0.70 107
P11 0.05 82.5 39 0.4089 0.45 0.72 107
P12 0 25.0 87 0.0605 0.06 0.46 >1012
P13 0 30.0 87 0.0605 0.06 0.51 >1012
P14 0 32.5 87 0.0605 0.06 0.51 >1012
P15 0 40.0 86 0.0655 0.07 0.55 >1012
P16 0 60.0 84 0.0757 0.07 0.62 >1012
P17 0 72.5 81 0.0915 0.09 0.65 >1012
P18 0 87.5 79 0.1024 0.10 0.68 >1012
where the readings were 1010 W /square implying there were regions of low and high SWNT
concentration.
Film thickness effects on %T, a , and e for the neat polymer (P12-P18, Table 2) were also
determined. The hinh of the ASTAA was 0.94 dL/g (indicative of high molecular weight) with film
thicknesses ranging from 25.0 to 87.5 mm. The %T at 500 nm and a did not vary appreciably for film
thicknesses ranging from 25.0 to 40.0 mm (P12-P15) whereas e increased ~20%. Like the SWNT
containing films (P5-P11), adherence to Lambert’s law was found when absorbance and a were plotted
vs. film thickness. As with the other samples, relectivity and light scattering losses were not addressed.
Surface resistivities were not determined for P12-P18, since P1 was previously determined to be
insulative.
Reflectivity Loss and Modified Eqs. Both Beer’s and Lambert’s laws pertain to the absorbance at a
particular wavelength of a species dissolved in a solution. The experiment is typically performed using
matching quartz cuvettes with one cell containg a solvent blank so as to subtract out losses due to
solvent and reflectance at the quartz-air interfaces. In this study, the solution is a solid polymer matrix
and care has to be taken to account for the Fresnel reflection from the two polymer-air interfaces of the
material.17 Each interface results in a few percent reflection that must be accounted for so this loss of
light is not wrongly attributed to absorption or scattering by the medium. The fraction reflected from
each surface can be calculated from
R = [(nLaRC™CP-2 - nair)/(nLaRC™CP-2 + nair)]2,
where R is the reflectivity and nLaRC™CP-2 = 1.61 and nair = 1 are the indices of refraction of LaRC™ CP-
24 and air, respectively. Thus R = 0.0546 per surface. Considering that the film has two air-polymer
surfaces, the %T for a sample having zero absorbance was calculated as
%T = 100(1 – 2R) = 89.1%.
Therefore, a modified definition of absorbance was used:
A = 2 - log10(%T/0.891) (1)
where the 0.891 refers to the 89.1% transmittance. Rearranging eq 1 afforded eq 2.
%T = 89.1(10-A) (2)
The absorbance was recalculated for P1-P18 using eq 1, to take into account losses due to reflection,
with the values reported in Table 3.
Normally in analysis of spectrometer data, this modification is not required because a reference scan
is usually performed with a sample having the absorbing species absent. For liquid samples, this is
relatively easy to accommodate. This reference scan is then used to “zero” the instrument, thereby
taking into account these reflective losses from the sample cell-air interfaces. However in the present
study, films of varying thickness were used so a single reference scan would not have been appropriate,
particularly because the neat polymer itself has absorption and/or scattering losses. Consequently, the
modified relationships for absorbance and %T (eqs 1 and 2, respectively) were used.
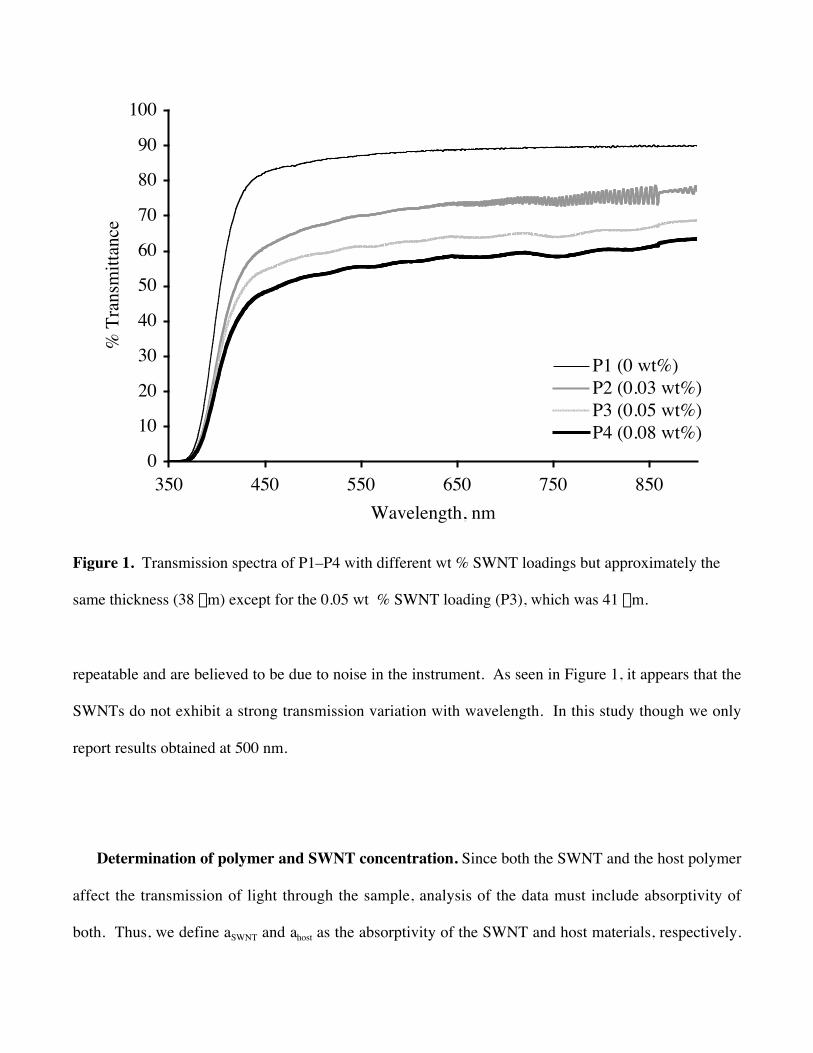
Complicating matters, both the SWNT and host polymer material exhibit absorption of light at 500
nm. This can be seen in Figure 1, which shows transmission spectra of the neat polymer film (P1) and
three different wt % SWNT loadings (P2-P4) in the spectral region ranging from 350-900 nm. The
figure shows that %T decreases with increasing SWNT loading. Additionally, there is an obvious drop
in transmission towards the ultra-violet end of the spectrum (<400 nm) caused by absorption of the host
polymer. The high frequency oscillations in the 0.03 wt % SWNT loading spectrum (P2) are not
0
10
20
30
40
50
60
70
80
90
100
350 450 550 650 750 850Wavelength, nm
% T
rans
mitt
ance
P1 (0 wt%)P2 (0.03 wt%)P3 (0.05 wt%)P4 (0.08 wt%)
Figure 1. Transmission spectra of P1–P4 with different wt % SWNT loadings but approximately the
same thickness (38 mm) except for the 0.05 wt % SWNT loading (P3), which was 41 mm.
repeatable and are believed to be due to noise in the instrument. As seen in Figure 1, it appears that the
SWNTs do not exhibit a strong transmission variation with wavelength. In this study though we only
report results obtained at 500 nm.
Determination of polymer and SWNT concentration. Since both the SWNT and the host polymer
affect the transmission of light through the sample, analysis of the data must include absorptivity of
both. Thus, we define aSWNT and ahost as the absorptivity of the SWNT and host materials, respectively.
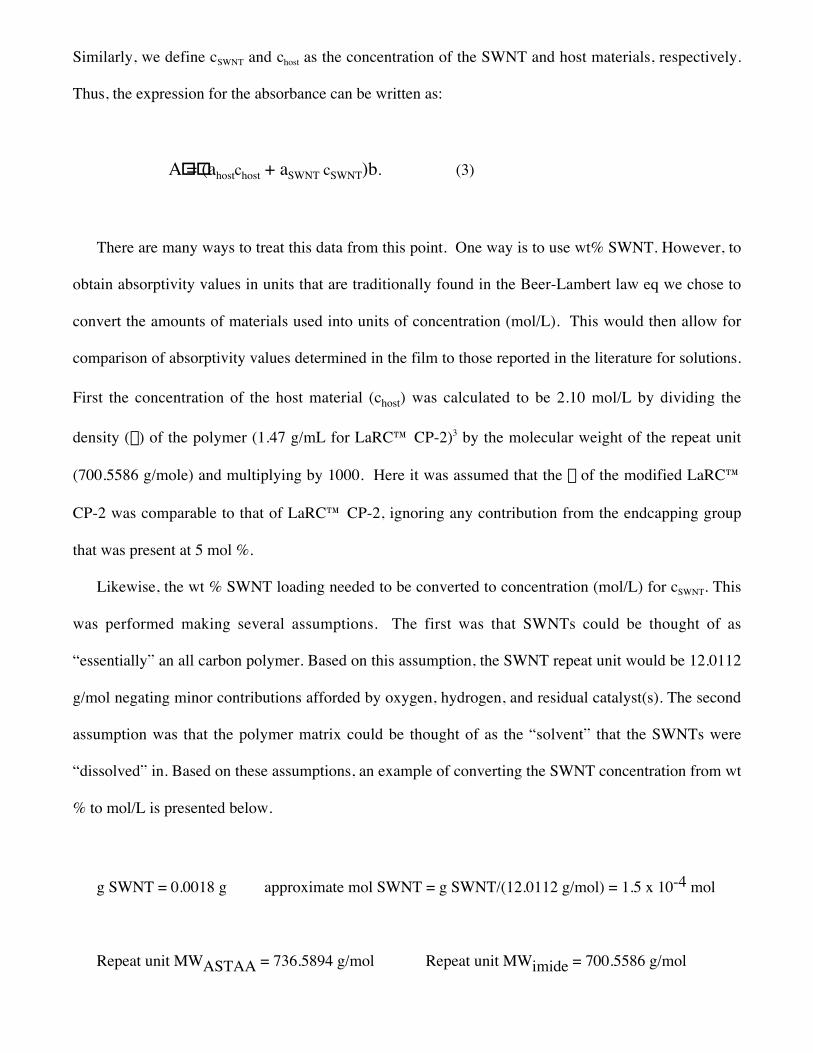
Similarly, we define cSWNT and chost as the concentration of the SWNT and host materials, respectively.
Thus, the expression for the absorbance can be written as:
A"="(ahostchost + aSWNT cSWNT)b. (3)
There are many ways to treat this data from this point. One way is to use wt% SWNT. However, to
obtain absorptivity values in units that are traditionally found in the Beer-Lambert law eq we chose to
convert the amounts of materials used into units of concentration (mol/L). This would then allow for
comparison of absorptivity values determined in the film to those reported in the literature for solutions.
First the concentration of the host material (chost) was calculated to be 2.10 mol/L by dividing the
density (r) of the polymer (1.47 g/mL for LaRC™ CP-2)3 by the molecular weight of the repeat unit
(700.5586 g/mole) and multiplying by 1000. Here it was assumed that the r of the modified LaRC™
CP-2 was comparable to that of LaRC™ CP-2, ignoring any contribution from the endcapping group
that was present at 5 mol %.
Likewise, the wt % SWNT loading needed to be converted to concentration (mol/L) for cSWNT. This
was performed making several assumptions. The first was that SWNTs could be thought of as
“essentially” an all carbon polymer. Based on this assumption, the SWNT repeat unit would be 12.0112
g/mol negating minor contributions afforded by oxygen, hydrogen, and residual catalyst(s). The second
assumption was that the polymer matrix could be thought of as the “solvent” that the SWNTs were
“dissolved” in. Based on these assumptions, an example of converting the SWNT concentration from wt
% to mol/L is presented below.
g SWNT = 0.0018 g approximate mol SWNT = g SWNT/(12.0112 g/mol) = 1.5 x 10⁻⁴ mol
Repeat unit MWASTAA = 736.5894 g/mol Repeat unit MWimide = 700.5586 g/mol
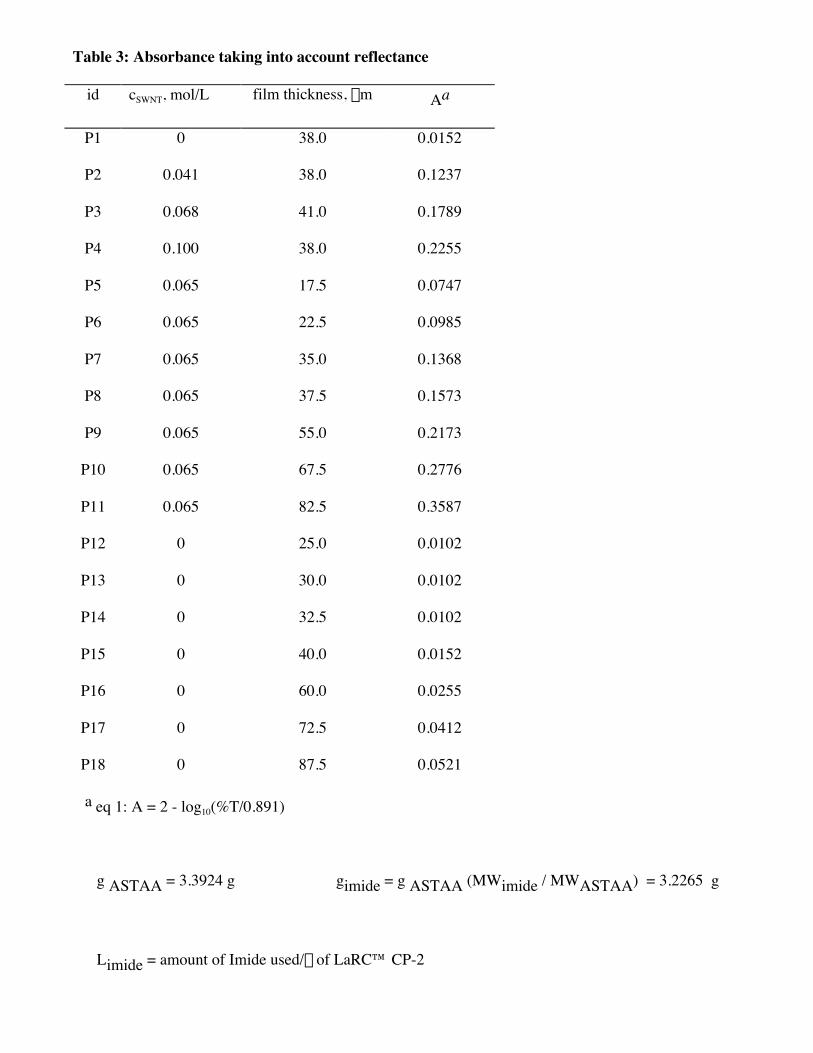
Table 3: Absorbance taking into account reflectance
id cSWNT, mol/L film thickness, mm Aa
P1 0 38.0 0.0152
P2 0.041 38.0 0.1237
P3 0.068 41.0 0.1789
P4 0.100 38.0 0.2255
P5 0.065 17.5 0.0747
P6 0.065 22.5 0.0985
P7 0.065 35.0 0.1368
P8 0.065 37.5 0.1573
P9 0.065 55.0 0.2173
P10 0.065 67.5 0.2776
P11 0.065 82.5 0.3587
P12 0 25.0 0.0102
P13 0 30.0 0.0102
P14 0 32.5 0.0102
P15 0 40.0 0.0152
P16 0 60.0 0.0255
P17 0 72.5 0.0412
P18 0 87.5 0.0521
a eq 1: A = 2 - log10(%T/0.891)
g ASTAA = 3.3924 g gimide = g ASTAA (MWimide / MWASTAA) = 3.2265 g
Limide = amount of Imide used/r of LaRC™ CP-2
= (3.2265 g / 1.47 g/mL)( 1 L/1000 mL) = 2.20 x 10⁻³ L
cSWNT = (1.5 x 10⁻⁴ mol SWNT) / (2.20 x 10⁻³ L LaRC™ CP-2)
= 0.068 mol/L for a 0.05 wt % SWNT loading
The cSWNT was calculated for P2-P11 using the method above with the values reported in Table 3.
Analysis of Transmission Measurements. The data in Tables 1-3 can be summarized into three
groups: (i) (P12-P18) variation of film thickness (b) for neat polymer (cSWNT = 0), (ii) (P1-P4) variation
of cSWNT for a constant film thickness (b, approximately equal to 38 mm), and (iii) (P5-P11) variation of
film thickness (b) for a polymer with a constant concentration of SWNT (cSWNT = 0.065 mol/L). The first
and third groups pertain to Lambert’s law while the second group pertains to Beer’s law. Since the
absorbance, film thickness, and host and SWNT concentrations were known; the only remaining
unknowns in eq 3 for each sample were ahost and aSWNT. Initial estimates were made for these two values
allowing a theoretical estimate of absorbance for each sample. The difference between the empirical
prediction of absorbance and the value of absorbance inferred from eq 1 was then computed for each
sample. These differences were squared and summed. Utilizing the Solver function in Microsoft Excel,
ahost and aSWNT were adjusted to minimize the sum of these squares, thereby obtaining a best fit to all of
the data simultaneously. Based on this analysis the values for ahost and aSWNT were 0.000249 and 0.0562
L/(mol mm), respectively. Thus eq 3 can be written as eq 4:
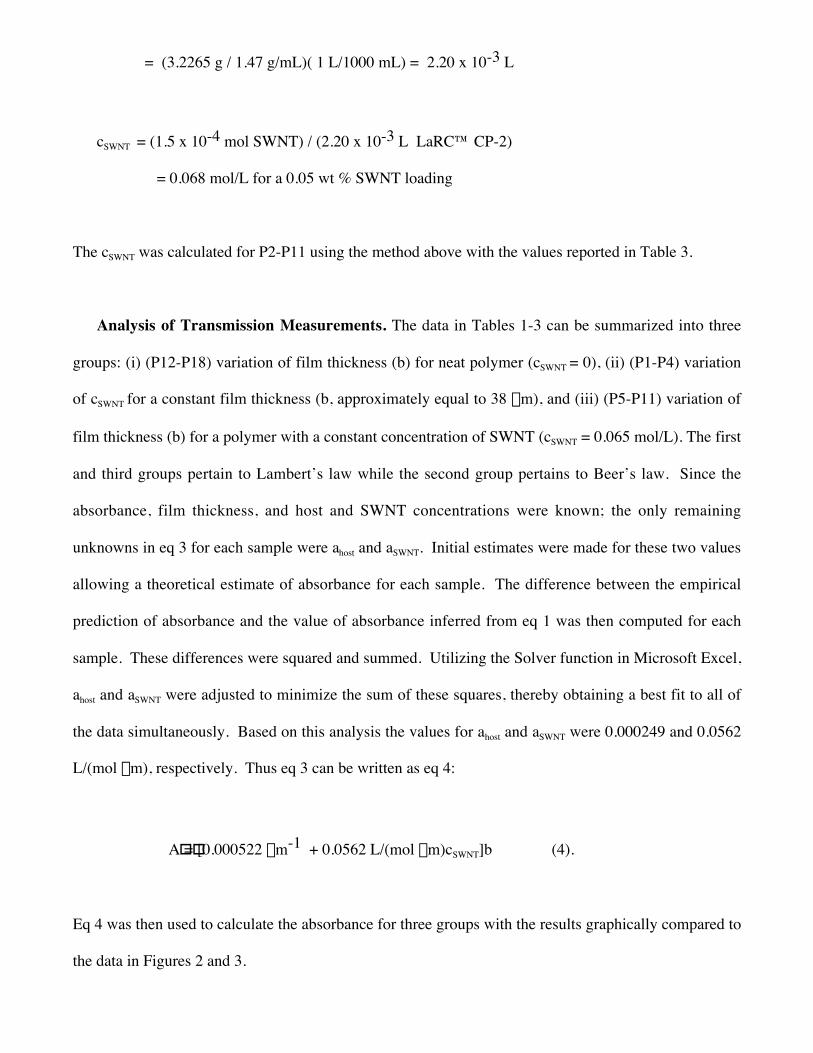
A"="[0.000522 mm-1 + 0.0562 L/(mol mm)cSWNT]b (4).
Eq 4 was then used to calculate the absorbance for three groups with the results graphically compared to
the data in Figures 2 and 3.
0.000
0.050
0.100
0.150
0.200
0.250
0.300
0.350
0.400
10 20 30 40 50 60 70 80 90Film Thickness, mm
Abs
orba
nce
P5-P11P5-P11 using eq 4P12-P18P12-P18 using eq 4
Figure 2. Absorbance vs. film thickness for neat (P12-P18) and SWNT-loaded films (P5-P11).
0.000
0.050
0.100
0.150
0.200
0.250
0 0.041 0.068 0.1cSWNT, mol/L
Abs
orba
nce
P1-P4P1-P4 using eq 4
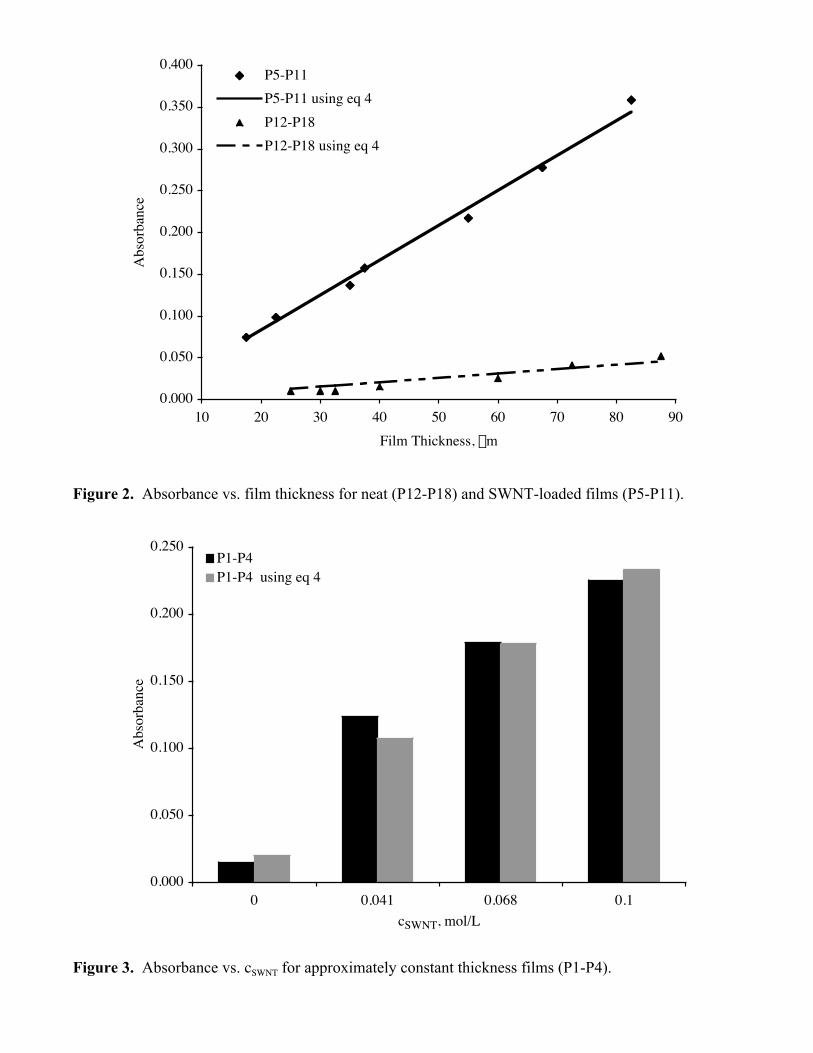
Figure 3. Absorbance vs. cSWNT for approximately constant thickness films (P1-P4).
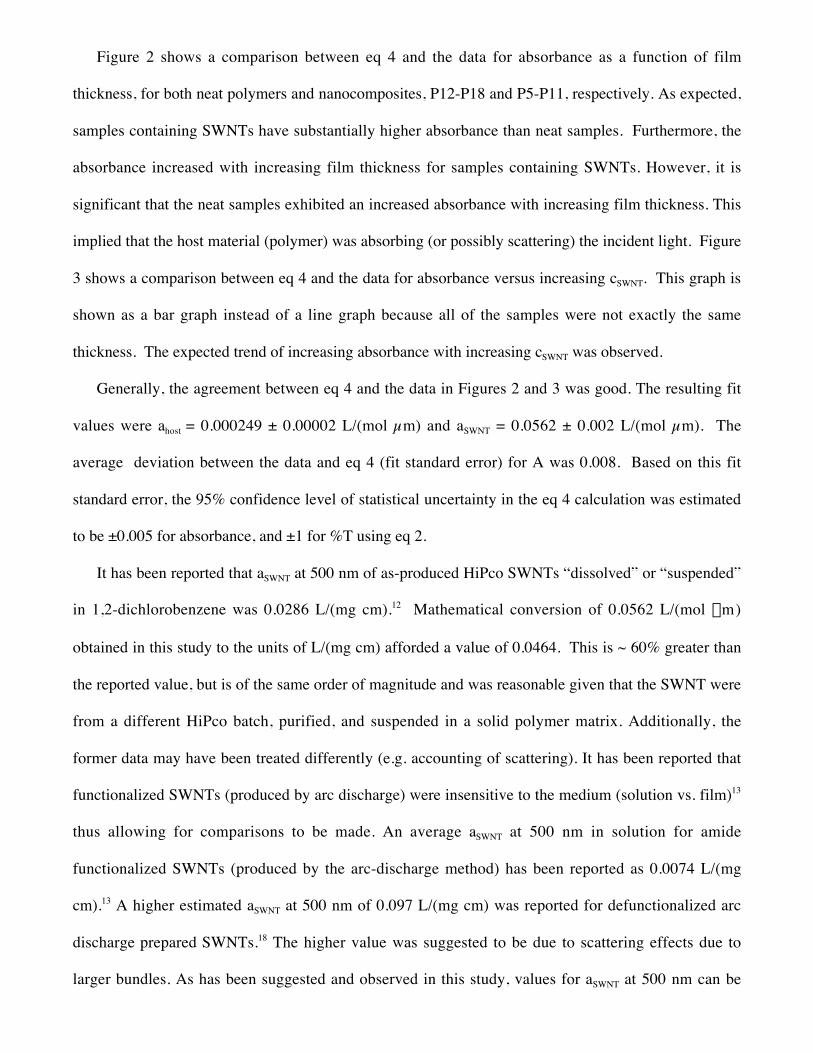
Figure 2 shows a comparison between eq 4 and the data for absorbance as a function of film
thickness, for both neat polymers and nanocomposites, P12-P18 and P5-P11, respectively. As expected,
samples containing SWNTs have substantially higher absorbance than neat samples. Furthermore, the
absorbance increased with increasing film thickness for samples containing SWNTs. However, it is
significant that the neat samples exhibited an increased absorbance with increasing film thickness. This
implied that the host material (polymer) was absorbing (or possibly scattering) the incident light. Figure
3 shows a comparison between eq 4 and the data for absorbance versus increasing cSWNT. This graph is
shown as a bar graph instead of a line graph because all of the samples were not exactly the same
thickness. The expected trend of increasing absorbance with increasing cSWNT was observed.
Generally, the agreement between eq 4 and the data in Figures 2 and 3 was good. The resulting fit
values were ahost = 0.000249 ± 0.00002 L/(mol µm) and aSWNT = 0.0562 ± 0.002 L/(mol µm). The
average deviation between the data and eq 4 (fit standard error) for A was 0.008. Based on this fit
standard error, the 95% confidence level of statistical uncertainty in the eq 4 calculation was estimated
to be ±0.005 for absorbance, and ±1 for %T using eq 2.
It has been reported that aSWNT at 500 nm of as-produced HiPco SWNTs “dissolved” or “suspended”
in 1,2-dichlorobenzene was 0.0286 L/(mg cm).12 Mathematical conversion of 0.0562 L/(mol mm)
obtained in this study to the units of L/(mg cm) afforded a value of 0.0464. This is ~ 60% greater than
the reported value, but is of the same order of magnitude and was reasonable given that the SWNT were
from a different HiPco batch, purified, and suspended in a solid polymer matrix. Additionally, the
former data may have been treated differently (e.g. accounting of scattering). It has been reported that
functionalized SWNTs (produced by arc discharge) were insensitive to the medium (solution vs. film)13
thus allowing for comparisons to be made. An average aSWNT at 500 nm in solution for amide
functionalized SWNTs (produced by the arc-discharge method) has been reported as 0.0074 L/(mg
cm).13 A higher estimated aSWNT at 500 nm of 0.097 L/(mg cm) was reported for defunctionalized arc
discharge prepared SWNTs.18 The higher value was suggested to be due to scattering effects due to
larger bundles. As has been suggested and observed in this study, values for aSWNT at 500 nm can be
different for SWNTs prepared by the various methods, dispersal in the medium, light scattering
contributions, etc..13
Eq 4 suggests that for an infinitely thin film (thickness approaching 0), as one that may be desired
for certain types of Gossamer spacecraft, the absorbance would approach zero. Using this result in eq 2,
the %T at 500 nm would be approximately 89%; independent of cSWNT.
Of course, eq 4 for absorbance and %T (eq 2) are representative only of this particular batch of
polymer-SWNT samples. The optical properties of samples prepared separately, or with different levels
of quality control than those in this study, could deviate significantly from those reported herein.
Additionally the data was obtained only as transmission measurements. Further experiments would
need to be performed to determine if these results maybe due to scattering. Thus, caution should be
exercised when applying this eq beyond the present data set. However, the overall methodology is
sound and does provide a first-order predictive approximation that may be useful when applied to other
systems.
Solar Absorptivity. As was found with absorbance, a (an absorptive property) was found to obey
both Beer’s and Lambert’s laws. As previously mentioned, a encompasses the spectral region ranging
from 250 to 2800 nm. A semi-empirical eq for a was chosen and best fit to the data using the Solver
function in Microsoft Excel resulting in eq 5:
a = 0.07230 + b[(0.000058 L/(mol mm))chost + (0.0740 L/(mol mm))cSWNT], (5)
where chost = 2.10 mol/L and b is in microns and cSWNT is in mol/L. This formula predicts a with an
uncertainty of ±0.01 with 95% confidence. Figure 4 shows good agreement between the data and eq 5
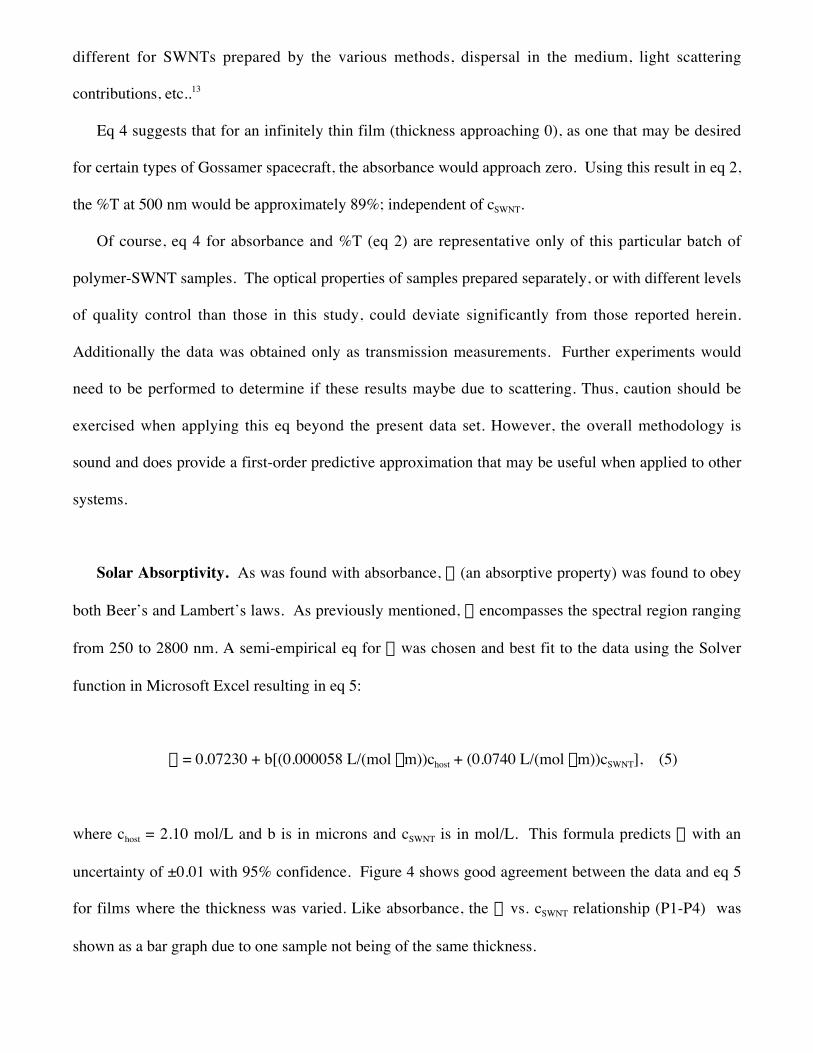
for films where the thickness was varied. Like absorbance, the a vs. cSWNT relationship (P1-P4) was
shown as a bar graph due to one sample not being of the same thickness.
0.00
0.10
0.20
0.30
0.40
0.50
0.60
10 20 30 40 50 60 70 80 90
Film Thickness, mm
a
P5-P11P5-P11 using Eq 5P12-P18P12-P18 using Eq 5
Figure 4. a vs. film thickness for neat (P12-P18) and SWNT-loaded films (P5-P11).
0.00
0.05
0.10
0.15
0.20
0.25
0.30
0.35
0.40
0 0.041 0.068 0.1
[SWNT], mol/L
a
P1-P4
P1-P4 using Eq 5
Figure 5. a vs. cSWNT for approximately constant thickness films (P1-P4).
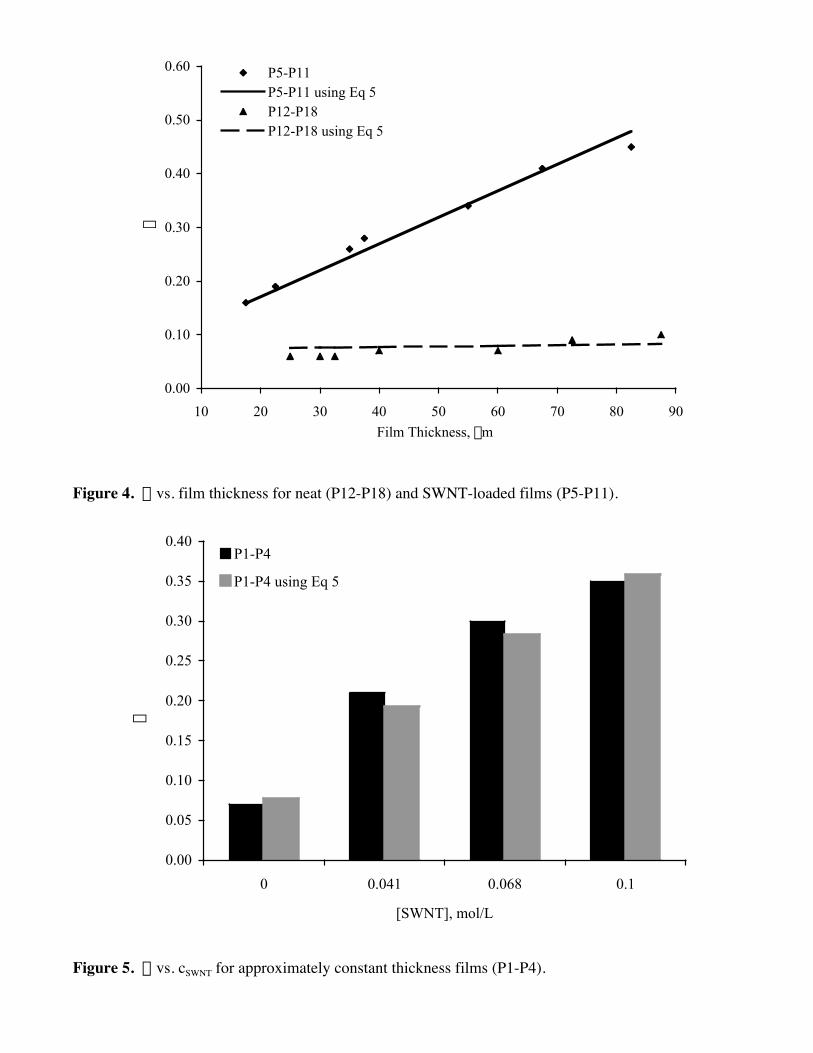
Similar agreement was found by comparing eq 5 and data vs. cSWNT (Figure 5).
Using eq 5, an infinitely thin film (thickness approaching 0) would exhibit an a of 0.07. This is
independent of cSWNT as seen for the absorbance (eq 4). Similar cautions and expectations as previously
stated for the treatment of the absorbance data apply to the prediction of a by eq 5.
Emissivity. Even though e is not an absorptive property, it was likewise examined to determine if a
first order predictive eq could be developed. For each of the films, e was measured and reported in
Tables 1 and 2. An eq was developed with Microsoft Excel using the Solver function with the data
fitted to a simple plane: an offset value of e plus a linear term in each dimension of b and cSWNT. The
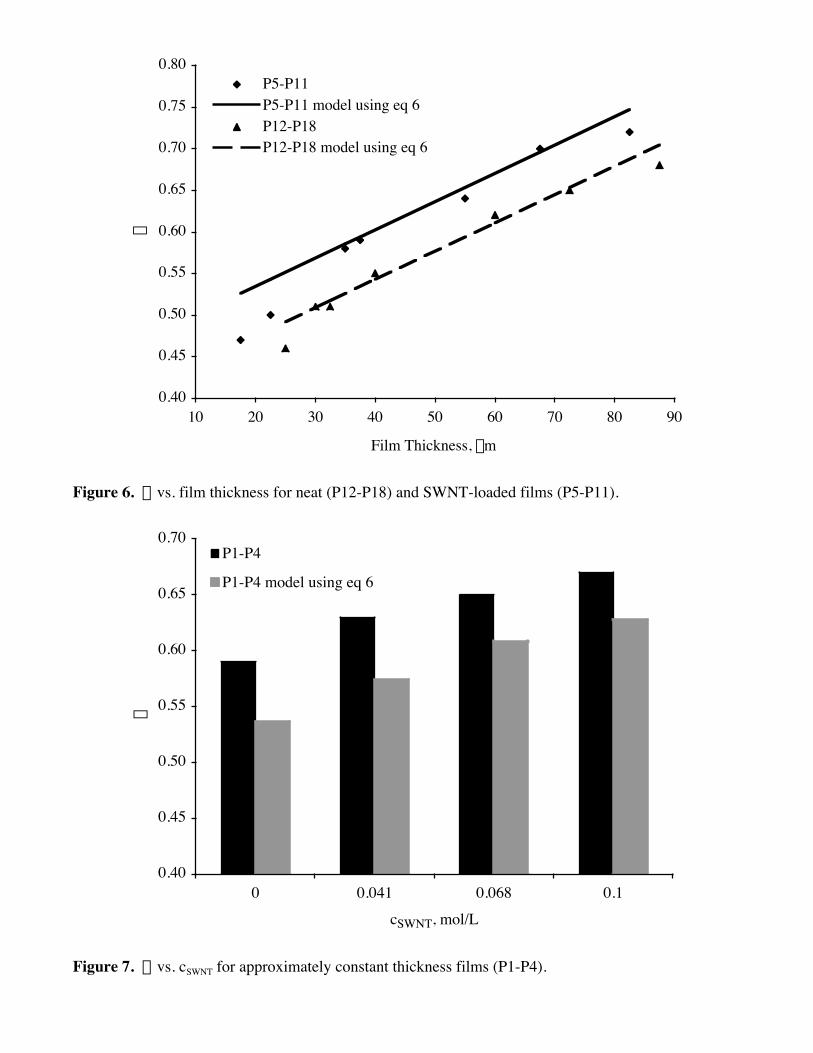
best fit function was (eq 6):
e = 0.407 + 0.915cSWNT + 0.0034b, (6)
where b was in microns and cSWNT was in mol/L. Eq 6 was then plotted against the data in Figures 6 and
7. In general, eq 6 and the data agreed that e increased with both film thickness and cSWNT. However,
there were some unexplained trends. It is unclear why there should be a nonlinearity in the e as the film
thickness decreased. Also, the data series shown in Figure 7 appeared to be systematically high (by
about 0.05) compared to eq 6, which was fit to all of the data. There may have been a run-to-run
variation either in the smaple preparation or in the measurement. Nonetheless, the trends identified
appear sound. It is known though that the e is dependent on many factors such as surface finish, color,
oxidation, aging, etc. and hence maybe difficult to accurately model.
0.40
0.45
0.50
0.55
0.60
0.65
0.70
0.75
0.80
10 20 30 40 50 60 70 80 90
Film Thickness, mm
e
P5-P11P5-P11 model using eq 6P12-P18P12-P18 model using eq 6
Figure 6. e vs. film thickness for neat (P12-P18) and SWNT-loaded films (P5-P11).
0.40
0.45
0.50
0.55
0.60
0.65
0.70
0 0.041 0.068 0.1cSWNT, mol/L
e
P1-P4
P1-P4 model using eq 6
Figure 7. e vs. cSWNT for approximately constant thickness films (P1-P4).
SUMMARY
Optical and thermo-optical properties were measured for nanocomposite films prepared from
alkoxysilane terminated amide acid polymers of LaRC™ CP-2 and HiPco SWNTs. Both film thickness
and cSWNT were varied. The absorbance at 500 nm and a exhibited a linear dependence upon cSWNT at
constant film thickness and with varying film thickness at constant cSWNT, respectively. These properties
were found to obey Beer's and Lambert's laws, respectively. Empirical eqs were developed for
absorbance at 500 nm and a using the Solver function in Microsoft Excel. Predicted values for both
were in good agreement with the data. The molar absorptivity at 500 nm determined for the HiPco
SWNTs based on this approach was of the same order of magnitude as that determined for HiPco
SWNTs in solution. An empricial eq was also developed for e, though it did not fit the data as
satisfactorily as observed for the absorbance at 500 nm and a. This approach provides a first-order
means to approximately predict both absorbance at 500 nm and a (and possibly e) at various film
thickness and SWNT loadings.
REFERENCES
1. Jenkins, CHM. Gossamer Spacecraft: Membrane and Inflatable Structures Technology for Space
Applications Vol. 191; American Institute of Aeronautics and Astronautics, 2001.
2. For an expla inat ion of W / square see Paas i , J . Research Note ,
http://www.vtt.fi/tuo/45/tuloksia/surface_resistance.pdf, March 19, 2002.
3. Watson, K.A.; Connell, J.W. Polym. Mater. Sci. Eng. Proc. 2001, 46, 1853.
4. SRS Technologies, Huntsville, AL 35806, http://www.stg.srs.com/atd/polyimidesales/cp_prop.htm
5. Park, C.; Ounaies, Z.; Watson, K.A.; Crooks, R.E,.; Smith Jr., J.G.; Lowther, S.E.; Connell, J.W.;
Siochi, E.J.; Harrison, J.S.; St. Clair, T.L. Chem. Phys. Lett. 2002, 364, 303.
6. Watson, K.A,.; Smith Jr., J.G.; Connell, J.W. Society for the Advancement of Materials and Process
Engineering Technical Conference Series 2001, 33, 1551.
7. Smith Jr., J.G.; Watson, K.A,.; Thompson, C.M.; Connell, J.W. Society for the Advancement of
Materials and Process Engineering Technical Conference Series 2002, 34, 365.
8. Glatkowski, P.; Mack, P.; Conroy, J.L.; Piche, J.W.; Winsor, P. U.S. Patent 6,265,466 B1; July 24,
2001.
9. Ounaies, Z.; Park, C,.; Wise, K.E.; Siochi, E.J.; Harrison, JS. Comp. Sci. and Tech. 2003, 63, 1637.
10. Smith Jr., J.G.; Connell, J.W.; Delozier, D.M.; Lillehei, P.T.; Watson, K.A.; Lin, Y.; Zhou, B,.;
Sun, Y-P. Polymer. 2004, 45, 825.
11. Watson, K.A.; Smith Jr., J.G.; Connell, J.W. Society for the Advancement of Material and Process
Engineering Proceedings 2003, 48, 1145.
12. Bahr, J.L.; Mickelson, E.T.; Bronikowski, M.J,.; Smalley, R.E.; Tour, J.M. Chem. Commun. 2001,
193.
13. Bing, Z.; Lin, Y.; Huaping, L.; Huang, W.; connell, J.W.; Allard, L.F.; Sun, Y-P. J. Phys. Chem. B
2003, 107, 13588.
14. Hu, H.; Bhowmik, P.; Zhao, B.; Hamon, M.A.; Itkis, M.E.; Haddon, R.C. Chem. Phys. Lett. 2001,
345,25.
15. Mawhinney, D.B.; Naumenko, V.; Kuznetsova, A.; Yates, J.T.; Liu, J.; Smalley, R.E. Chem. Phys.
Lett. 2000, 324,213.
16. Hull CC and Crofts NC. Ophthal. Physiol. Opt. 1996, 16,150.
17. a) Meyer-Arendt, JR. Introduction to Classical and Modern Optics, Prentice-Hall Inc. 1972, pp.
305-311. b) Hecht, E. Optics 4th Ed., Pearson Addison Wesley 2001.
18. Fu, K.; Huang, W.; Lin, Y.; Riddle, L.A.; Carroll, D.L.,; Sun, Y-P. Nano Lett. 2001, 1, 439.