Optical and thermal radiation properties of dielectrics and … · 2005-08-10 · Optical and...
20
Optical and thermal radiation properties of dielectrics and semiconductors as applicable to contactless measurement of their temperature V. A. Petrov Institute for High Energy Densities, Associated Institute for High Temperatures, 13/19 Izhorskaya, Moscow 125412, Russia E-mail: [email protected] Abstract. An analysis of data on wavelength and temperature dependence of optical and thermal radiation properties of semitransparent dielectrics in single crystal form as well as in form of porous ceramics, and also polymers, organic substances, silica glasses and semiconductors is carried out. An attention is focused on the application of peculiarities of the wavelength and temperature dependence of the spectral absorption coefficient and the refractive index for measurement of temperature by contactless pyrometry. Recommendations are made for selection of the spectral range at temperature measurement of the surface and a thin sub-surface layer of different materials. Approaches are considered to determining temperature distribution in the bulk of dielectric and semiconductors. 1. Introduction Although heat transfer in solids mostly occurs by conduction, there are substances in which radiative transfer is at least equally important if the temperature is high enough. They are called semitransparent (or partially transparent) substances, because their absorption coefficient is small in specific spectral regions, allowing radiation to travel a long distance. Semitransparent substances include almost all dielectrics and semiconductors: oxides, fluorides, chlorides, selenides, tellurides, germanium, silicon, gallium arsenide, indium antimonide, and most organic substances. These semitransparent materials are processed at temperatures that are so high as to make radiative heat transfer an important consideration in measuring surface temperature and internal temperature fields during thermal processing. Semitransparent materials have many uses at high temperatures in thermal insulation, thermal protection, thermal barrier coatings, electronic equipment. In checking its thermal state, it is necessary to make temperature measurements. However, contact methods such as those using a set of thermocouples are unsuitable for measuring local temperature in semitransparent materials because a local sensor would be exposed to the radiation from distant points in the material and from the environment. Accordingly, there is an acute need for means of contactless temperature measurement on semitransparent materials, and account must be taken of their optical and thermal radiation properties. A major task of contactless pyrometry of semitransparent materials just as pyrometry on the whole is to measure true surface temperature without knowing the emissivity of the object, because this depends not only on the temperature and wavelength but also on the state of the surface, i.e., the degree of roughness, the presence of a film, the size and orientation of crystal grains, etc. True temperature can in principle be measured by creating a blackbody inside the object, but this approach is not practical. Another conceivable way, proposed long ago in the context of opaque materials, is to simultaneously measure radiation intensities at different wavelengths and to fit the emissivity–wavelength dependence to the measured data points by adjusting the approximation parameters, whose number is less than the total number of the wavelengths (Svet 1982, Snopko 1999). However, this method has not been widely adopted because of its poor accuracy. Moreover, it does not solve the problem of the background radiation that enters the pyrometer after being reflected from the object. Nevertheless, we
Transcript of Optical and thermal radiation properties of dielectrics and … · 2005-08-10 · Optical and...

Optical and thermal radiation properties of dielectrics and semiconductors as applicable to contactless measurement of their temperature
V. A. Petrov
Institute for High Energy Densities, Associated Institute for High Temperatures, 13/19 Izhorskaya, Moscow 125412, Russia
E-mail: [email protected]
Abstract. An analysis of data on wavelength and temperature dependence of optical and thermal radiation properties of semitransparent dielectrics in single crystal form as well as in form of porous ceramics, and also polymers, organic substances, silica glasses and semiconductors is carried out. An attention is focused on the application of peculiarities of the wavelength and temperature dependence of the spectral absorption coefficient and the refractive index for measurement of temperature by contactless pyrometry. Recommendations are made for selection of the spectral range at temperature measurement of the surface and a thin sub-surface layer of different materials. Approaches are considered to determining temperature distribution in the bulk of dielectric and semiconductors. 1. Introduction Although heat transfer in solids mostly occurs by conduction, there are substances in which radiative transfer is at least equally important if the temperature is high enough. They are called semitransparent (or partially transparent) substances, because their absorption coefficient is small in specific spectral regions, allowing radiation to travel a long distance. Semitransparent substances include almost all dielectrics and semiconductors: oxides, fluorides, chlorides, selenides, tellurides, germanium, silicon, gallium arsenide, indium antimonide, and most organic substances. These semitransparent materials are processed at temperatures that are so high as to make radiative heat transfer an important consideration in measuring surface temperature and internal temperature fields during thermal processing. Semitransparent materials have many uses at high temperatures in thermal insulation, thermal protection, thermal barrier coatings, electronic equipment. In checking its thermal state, it is necessary to make temperature measurements. However, contact methods such as those using a set of thermocouples are unsuitable for measuring local temperature in semitransparent materials because a local sensor would be exposed to the radiation from distant points in the material and from the environment. Accordingly, there is an acute need for means of contactless temperature measurement on semitransparent materials, and account must be taken of their optical and thermal radiation properties. A major task of contactless pyrometry of semitransparent materials just as pyrometry on the whole is to measure true surface temperature without knowing the emissivity of the object, because this depends not only on the temperature and wavelength but also on the state of the surface, i.e., the degree of roughness, the presence of a film, the size and orientation of crystal grains, etc. True temperature can in principle be measured by creating a blackbody inside the object, but this approach is not practical. Another conceivable way, proposed long ago in the context of opaque materials, is to simultaneously measure radiation intensities at different wavelengths and to fit the emissivity–wavelength dependence to the measured data points by adjusting the approximation parameters, whose number is less than the total number of the wavelengths (Svet 1982, Snopko 1999). However, this method has not been widely adopted because of its poor accuracy. Moreover, it does not solve the problem of the background radiation that enters the pyrometer after being reflected from the object. Nevertheless, we

2
shall show that semitransparent materials allow one often to measure their true surface temperature and to exclude background radiation. 2. Optical properties of homogeneous dielectrics and semiconductors In respect to radiative heat transfer, semitransparent materials fall into two general classes: scattering and nonscattering materials. Since scattering results from structural inhomogeneity, the former class includes porous and foam ceramics, plasma-sprayed coatings, and fibrous materials, whereas nonscattering materials include dielectric and semiconductor single crystals, glasses, and many organic solids and polymers. In actual fact, a scattering material is an inhomogeneous form of a nonscattering one, the inhomogeneities being pores, voids, or inclusions. Macroscopically, electromagnetic radiation propagation through a homogeneous substance is described by Maxwell's equations, and the optical properties of the substance are determined by the complex refractive index N, whose real and imaginary parts are the refractive index n and the absorption index κ, respectively:
κinN −= . (1) Semitransparent materials have a very small density of free electrons. Their transmission spectral region may be defined according to different criteria, for example, such as κ ≤ 0.01. Since κ is small in the transmission region, the absorption is more often characterized by the absorption coefficient α, which is equal to the relative amount of radiant energy absorbed per unit length traveled by the radiation in the substance. Accordingly, the loss dI in the radiation intensity I over the elemental length dl is written:
IdldI α−= . (2) The absorption coefficient α is bound up with the absorption index by relation:
,4/ παλκ = (3) where λ is wavelength in vacuum. Let us first consider how optical properties of dielectrics vary with temperature and wavelength. Figure 1 shows the general wavelength dependence of α, κ and n for a typical dielectric crystal. It is plotted for the spectral region in which the substance mainly radiates when heated to above room temperature, the wavelengths ranging from the near ultraviolet (UV) to about 20 µm. The UV absorption is by electrons being raised from the valence to the conduction band. The substance is practically opaque to these wavelengths, α reaching 103 – 104 cm-1 or even higher levels. The short wavelength edge of the transmission shifts to longer wavelengths as the temperature is increased. At the UV absorption edge, α sharply increases with decreasing wavelength. For example, in pure optical silica glass α rises from 0.035 to 0.16 cm-1 as λ is decreased from 0.18 to 0.17 µm; the absorption coefficient reaches 10 cm-1 at λ=0.16 µm and grows even faster as λ is decreased further. Thus, the absorption edge can be represented by a stepwise function. The high transparent region (the region of low absorption) is characterized by α<10-3 cm-1. In this region, radiation is mainly attenuated by absorption and scattering due to structural imperfections and impurities. As the wavelength is increased, the refractive index slightly decreases (normal dispersion), and the absorption coefficient starts growing once a certain wavelength has been reached, indicating a first lattice absorption band. Figure 1 shows two such bands. Many dielectrics, including silicon dioxide, have more than one lattice absorption bands, and the total number and positions of the bands and optical behavior vary significantly from substance to substance. A first lattice-absorption peak is usually in the mid-wave infrared (IR). It may lie in the near-IR if the substance contains light atoms, such as hydrogen

3
in O—H or C—H groups, in which cases the peak is at 2.7 – 2.8 or 3.4 µm, respectively (Zolotarev et al, 1984).
0.1 1 10 1000
1
2
3
4
5
6
0.1 1 10 1001E-3
0.01
0.1
1
10
100
1000
10000
κ
n
n, κ
λ, µmα
λ, µm
α, с
m-1
Figure 1. Spectral dependence of the absorption index κ , the refractive index n, and the
absorption coefficient α for a typical dielectric crystal On the whole, the optical properties of different dielectrics follow the same pattern over lattice absorption bands and near them. Although a dielectric may show weaker absorption in higher bands, it remains opaque owing to the overlap between the bands, their overtones, and combinational bands. From a pyrometry viewpoint, it is of interest to ascertain how the absorption coefficient varies both at the peak of the first lattice absorption band and at its edges. The classical theory of optical absorption implies that a perfect ionic crystal should have a spectral range, called the reststrahlen band, over which its reflectance is unity, so that the crystal would be opaque to the radiation (Moss et al 1973). The reststrahlen band extends from the resonant frequency to a frequency higher by 20 to 30%. In practice, the reflectance cannot reach unity on account of lattice absorption. It is hardly possible to calculate the resonant frequency. Likewise, this cannot be determined by transmission measurement, because the values of absorption coefficient, peaking at 105–106 cm-1, require specimens thinner than 1 µm. Near the reststrahlen peak, absorption and refraction are evaluated by measuring reflection. The spectrophotometry measurements are mostly made at room temperature, using commercial instruments. However, one has to know the high-temperature behavior of semitransparent materials in order to calculate their thermal state. At present, the high-temperature data can be obtained only by complex experiments because it is still impossible to predict how the spectra of resonance molecular vibrations will change with temperature. Regrettably, the topic is not treated in adequate detail in the literature. In terms of heat transfer, primary importance should be attached to the short-wavelength edge

4
of fundamental lattice absorption: this region corresponds to the absorption coefficients of order 1 cm-1 and accounts for an appreciable proportion of emitted intensity as given by Planck's radiation law. If fundamental lattice absorption bands are seen as resulting from single-phonon resonance, the edges of such bands should have overtones and combinational bands of lower intensity produced by multiphonon absorption (Mitra 1985). For semiconductors the spectral dependence of optical properties is similar to that of dielectrics. However, some differences exist that are important in problem of contactless temperature measurement. They result from the energy gap being much smaller (hence the presence of free carriers even at room temperature) and from different arrangement of atomic bonds, especially in single atomic semiconductors, namely, germanium and silicon.
0.1 1 100
1
2
3
4
5
6
7
0.1 1 101E-5
1E-3
0.1
10
1000
100000
1E7
κ
n
n, κ
λ, µm
α
λ, µm
α, c
m-1
Figure 2. Spectral dependence of the absorption index κ , the refractive index n, and the
absorption coefficient α for a typical semiconductor at room temperature
Figure 2 shows typical patterns of spectral dependence for n, κ, and α in semiconductors at room temperature. Note that the edge of fundamental absorption usually lies in the near IR region, due to a smaller energy gap. Lattice absorption occurs in the far IR region, which cannot provide sufficient intensity of radiation for pyrometry. In the mid-wave IR, absorption is mainly by free carriers and grows with wavelength except at points where multiphonon absorption occurs. IR absorption strongly depends on temperature and impurity concentration; it should be evaluated experimentally for each individual crystal. 3. Optical properties of inhomogeneous dielectrics and semiconductors Any structural inhomogeneities in a material cause scattering of radiation; for this reason, they are often called scatterers. Moreover, they change absorption and refraction by amounts that depend on the nature of the inhomogeneities, their size, and the total volume they occupy.

5
If inhomogeneities are distant one to another much more than the wavelength, absorption and refraction can be treated by the effective-medium approach, in which the optical behavior of a material is characterized by the mean quantities α and n . For a porous material that has no other scatterers, the optical properties may be calculated by the following expressions
( )( ) 2
0
200
11
nn
Π−+ΠΠ−
=α
α , (4)
( )[ ] 2/12
01 nn Π−+Π= , (5)
where Π is the porosity and 0α and 0n are the absorption coefficient and the refractive index, respectively, for the same material in a pore-free state (Stepanov 1988).However, if inhomogeneities are closer to one another, no such simple expressions are available. If scattering is described in the frame of the radiation transfer equation, this includes two additional parameters: the spectral volumetric scattering coefficient β and the phase function γ, the latter generally involving both the dependence on wavelength and directions of incident and scattered radiation. Yet another approach to radiative transfer in scattering materials is the model devised by Gurevich (1931) and Kubelka and Munk (1931) for plane layer. It characterizes the optical properties of a scattering material in terms of a backscattering coefficient S and an absorption coefficient K, which refer to a layer of unit thickness. Radiative transfer is often treated as photon diffusion if absorption is much weaker than scattering and the layer has a very large optical thickness, i.e., the geometrical thickness multiplied by the scattering coefficient. This method is referred to as the diffusion approximation to the radiative transfer equation. It uses mean values of α , n , and the radiation diffusion coefficient D to characterize the optical behavior of porous materials (Galaktionov et al 1988, Petrov 1993). Scattering and absorption characteristics can, in principle, be evaluated by solving the inverse problems of radiative transfer on the basis of experimental data on the transmission, reflection, or emission of a plane layer. However, it should be pointed out that the inverse problems are still treated by considering a succession of associated direct problems, which are solvable only in their simplified form by numerical methods. It is therefore hardly surprising that the optical properties of scattering materials have yet to be studied in sufficient detail. Experimental determination of the optical properties for radiation transfer equation is very difficult. However, using approximate method of the discrete ordinates for solving of the radiation transfer equation, Nicolau et al (1994) overcame these difficulties. Most of available literature data were obtained within the Gurevich-Kubelka-Munk model. As an example, some typical values of K and S for the visible spectral range and room temperature are given below. Porcelain enamel has K= 25 cm-1 and S=5000 cm-1 (reflectivity about 0.9). White alumina ceramics has K=1.7 cm-1 and S=80 cm-1 (the reflectivity is about 0.82, a layer 3 mm thick is almost opaque). Opal glasses have K = 0.5 cm-1 and S = 4 cm-1 (the depth of directional transmission is less than 25 mm). As might be expected, scattering materials made from optical-grade crystals or high-purity glass have K of order 10-3 cm-1 or even smaller. Concerning S, it may reach 104 cm-1 (white paints are an example). By contrast, little is known quantitatively about K and S in the IR at high temperatures. Figure 3 shows example spectral curves of K and S for alumina ceramics of porosity 1.8% (Makino et al, 1984).

6
1 100.01
0.1
1
10
100
K
S
K, S
, cm
-1
λ, µm Figure 3. The coefficients K and S of the Gurevich-Kubelka-Munk model for alumina
ceramics (Makino et al, 1984).
The results were found to be unaffected by the temperature variation from room temperature to 700 K except that K grew insignificantly over the wavelength range 4 – 6 µm. 4. Optical properties of polymers and plastics Most plastics are noncrystalline materials whose molecules consist of many repeated units linked with one another by chemical bonds, thus having multi-band spectra. Figure 4 shows an example of the spectral transmittance of polyacrylonitrile film (Noakes, 1971).
2 4 6 8 10 12 140
20
40
60
80
100
τ λ, %
λ, µm Figure 4. Spectral transmittance of the polyacrylonitrile film
Unlike the dielectrics discussed in previous sections, plastics have no strong absorption bands, where 1≈n . As it is well known, the structure of polymer molecules shows up as a specific

7
arrangement of absorption bands. Specific absorption bands are also useful for pyrometry. Most plastics display a characteristic band at 3.43 µm due to longitudinal vibrations of the C—H bond; examples are polyethylene, polypropylene, polyisobutylene, polystyrene, polyvinyl chloride, and polymethylmethacrylate. This band is nonexistent in fluoroplastics, which show strong absorption at 8.2–8.7 µm. Nylon and some phenol-formaldehyde resins (such as bakelite) have an absorption band at about 3.0 µm. Epoxy and silicone resins exhibit a number of absorption bands. 5. Surface pyrometry of homogeneous dielectrics in their opaque region The spectral dependence of optical properties of dielectrics enables to give an opportunity to measure the true temperature of the surface. Recall that for any substance the reflectivity R of an optically smooth surface in the normal direction is expressed as follows:
( )( ) 22
22
11
κκ
+++−
=nnR . (6)
Notice that R approaches zero if 1=n and 2κ << ( )21+n . At the same time, the true temperature of the surface can be measured only if κ is such that the radiation flux, emitted by the surface has been generated within a thin sub-surface layer; this layer can be regarded as having infinite optical thickness and emitting blackbody radiation. As an example, figure 5 shows the optical properties of silica glass in vacuum UV range of the electron fundamental absorption band. It can be noted that n = 1 at a wavelength close to 0.07 µm. However, due to big value of κ in the whole shown spectral range, R is not equal to zero. Accordingly, this spectral region is not suitable for measuring true surface temperature. Moreover, the thermal emission in this range is insufficient for measurement of any practical temperature.
0.06 0.08 0.10 0.12 0.14 0.160.0
0.2
0.4
0.6
0.8
1.0
1.2
1.4
1.6
1.8
2.0
2.2
2.4
0.06
0.08
0.10
0.12
0.14
0.16
0.18
0.20
0.22
κ
n
n, κ
λ, µm
R
R
Figure 5. Vacuum UV spectral dependence of the absorption index κ , the refractive index n,
and the reflectivity R of silica glass
The other dielectrics show the similar behavior of optical properties in the electron fundamental absorption band.
8
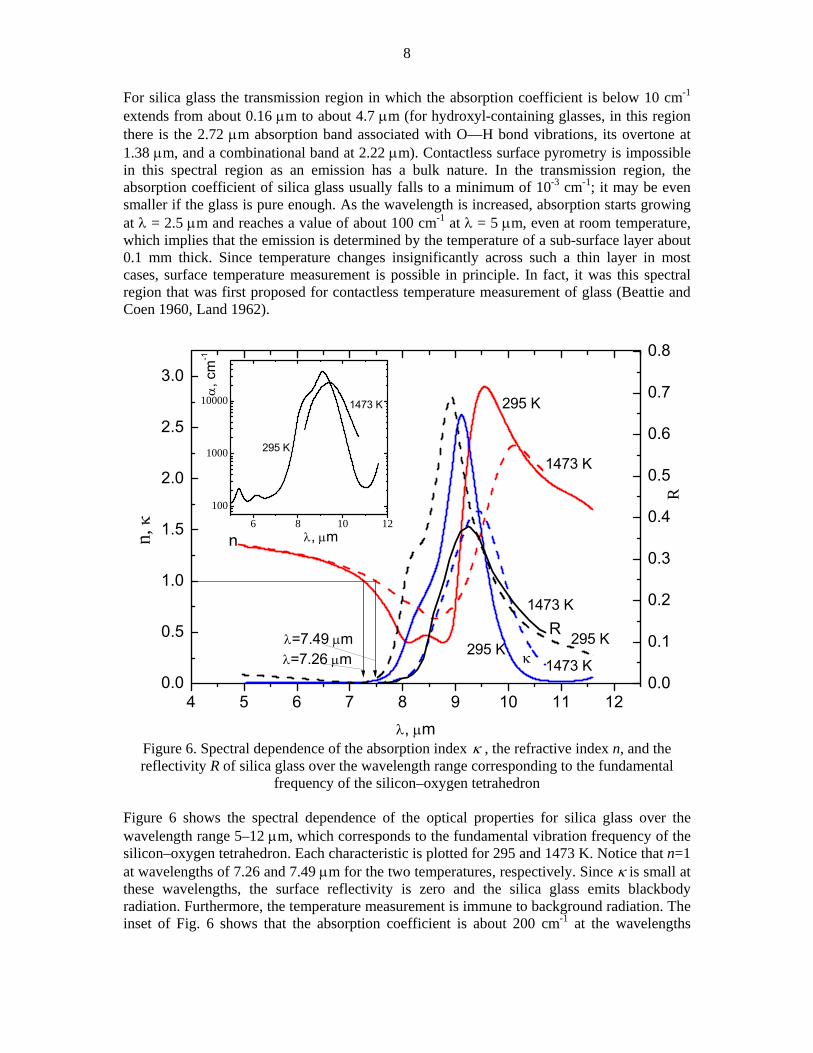
For silica glass the transmission region in which the absorption coefficient is below 10 cm-1 extends from about 0.16 µm to about 4.7 µm (for hydroxyl-containing glasses, in this region there is the 2.72 µm absorption band associated with O—H bond vibrations, its overtone at 1.38 µm, and a combinational band at 2.22 µm). Contactless surface pyrometry is impossible in this spectral region as an emission has a bulk nature. In the transmission region, the absorption coefficient of silica glass usually falls to a minimum of 10-3 cm-1; it may be even smaller if the glass is pure enough. As the wavelength is increased, absorption starts growing at λ = 2.5 µm and reaches a value of about 100 cm-1 at λ = 5 µm, even at room temperature, which implies that the emission is determined by the temperature of a sub-surface layer about 0.1 mm thick. Since temperature changes insignificantly across such a thin layer in most cases, surface temperature measurement is possible in principle. In fact, it was this spectral region that was first proposed for contactless temperature measurement of glass (Beattie and Coen 1960, Land 1962).
4 5 6 7 8 9 10 11 120.0
0.5
1.0
1.5
2.0
2.5
3.0
0.0
0.1
0.2
0.3
0.4
0.5
0.6
0.7
0.8
6 8 10 12
100
1000
10000
1473 K
295 K
1473 K295 K
1473 K
295 K
R
λ=7.49 µmλ=7.26 µm κ
nn, κ
λ, µm
R
1473 K
295 K
λ, µm
α, c
m-1
Figure 6. Spectral dependence of the absorption index κ , the refractive index n, and the reflectivity R of silica glass over the wavelength range corresponding to the fundamental
frequency of the silicon–oxygen tetrahedron
Figure 6 shows the spectral dependence of the optical properties for silica glass over the wavelength range 5–12 µm, which corresponds to the fundamental vibration frequency of the silicon–oxygen tetrahedron. Each characteristic is plotted for 295 and 1473 K. Notice that n=1 at wavelengths of 7.26 and 7.49 µm for the two temperatures, respectively. Since κ is small at these wavelengths, the surface reflectivity is zero and the silica glass emits blackbody radiation. Furthermore, the temperature measurement is immune to background radiation. The inset of Fig. 6 shows that the absorption coefficient is about 200 cm-1 at the wavelengths

9
concerned. This means that an emitting radiation originates from a sub-surface layer about 0.05 mm thick. Thus, a measured temperature can be regarded as a true surface temperature.
6 8 10 12 140.0
0.5
1.0
1.5
2.0
2.5
3.0
0.0
0.2
0.4
0.6
0.8
1.0
6 8 10 12 14 16
10
100
1000
10000
λ=10.35 µmλ=9.61 мкм
293 K
1773 K
κn
1773 K
293 K
1773 K
293 K
n, κ
λ, µm
R
R
1773 K
293 K
λ, µm
α, c
m-1
Figure 7. Spectral dependence of the absorption index κ , the refractive index n, and the reflectivity R of an alumina single crystal at the short-wavelength edge of the first lattice
vibration band
Figure 7 shows the spectral dependence of the optical properties of a single crystal of Al2O3 at the short-wavelength edge of the first lattice-vibration band. Compared with SiO2, the absorption peak of the Al—O bond is located farther, at 17.6 and 18.5 µm for 293 and 1773 K, respectively (1773 K is the maximum temperature for which experimental data are available). With practical temperatures, monochromatic emitted flux is weak at the maximum of these wavelengths. Figure 7 is therefore restricted to the band edge, where contactless temperature measurement is possible. At room temperature, n = 1 occurs at λ = 9.61 µm, with κ = 0.019, α = 250 cm-1, and R as small as 0.0001. If the temperature is raised to 1773 K, the wavelength providing n = 1 is shifted to 10.35 µm. Although at that an absorption increases (κ = 0.15, α = 1800 cm-1), the reflectivity remains small, R = 0.005. So this means that for Al2O3 there is wavelength suitable for measurement of true surface temperature (Lingart and Petrov 1977, Brun et al 2002). Figure 8 shows the spectral dependence of absorption coefficient of Al2O3 in semitransparent region for different temperatures. It is seen that wavelengths shorter than 4 µm are unsuitable for surface pyrometry at any temperature, due to weak absorption. However, the absorption at 6-7 µm allows one to realize infinite optical thickness in a layer about 0.1 mm thick. At these wavelengths, R is as small as 0.037, and it is possible to introduce a small correction for the reflectivity when measuring temperature (provided that the background radiation is not too

10
intense).
1 2 3 4 5 6 7
1E-3
0.01
0.1
1
10
100
4
3
21
α, c
m-1
λ, µm Figure 8. Spectral dependence of absorption coefficient of Al2O3 in semitransparent region for
different temperatures: 1 – 295 K, 2 – 900 K, 3 – 1700 K, 4 – 2300 K It appears likely that other dielectric single crystals also have IR spectral ranges suitable for pyrometry. Regrettably, little is known about how the optical properties of dielectrics, including their emissivity and reflectivity, vary with temperature at wavelengths of high absorption. This problem should therefore be addressed for a material of interest before selection of the spectral range of temperature measurement. If relevant data are not available, one should draw on room-temperature measurements of the transmissivity and normal reflectivity. Figure 9 shows the room-temperature spectral transmisivity and spectral reflectivity of some single crystals.
Figure 9. The room-temperature spectral transmittance τ (solid lines) and spectral surface reflectivity R (dashed lines) of specific single crystals: 1 - sapphire (1 mm), 2 - MgO (0.408 mm), 3 - LiF (1 mm), 4 – CaF2 (1 mm), 5 – BaF2 (9 mm), and 6 – NaF (1 mm).

11
It is seen that, on average, the spectral range of strong enough absorption and weak reflection is 2.5-4.5 µm wide, which should allow one to obtain a sufficient pyrometric signal. 6. Pyrometry of organic compounds and polymers Temperature measurements on semitransparent solid organic compounds, including plastics, are currently an active area of research. As the materials are usually made and processed at temperature below 430 K, emission is weak during the process, and the maximum of radiation intensity take place near wavelength of λ= 7 µm. A significant departure from the current practice, direct temperature measurement would make for better product quality. A wavelength of 3.43 µm is the most suitable for pyrometry of polymers, because it corresponds to C—H stretching. Figure 10 shows the normal emissivity ελ of a plastic film as a function of film thickness. Curves 1 and 2 correspond to a wavelength of 3.43 µm and the wavelength range 2.0–2.6 µm, respectively. These data apply to polyethylene, polypropylene, polyisobutylene, polystyrene, polyvinyl chloride, polymethylmethacrylate, etc. Fluoroplastics show characteristic, strong absorption over the range 8.2–8.7 µm but not at 3.4 µm. Nylon and some phenol-formaldehyde resins (such as Bakelite) have an absorption band at about 3.0 µm. Epoxy and silicone resins exhibit a number of absorption bands. Returning to figure 10, we notice that the emissivity reaches a level as high as 0.96 at increase of thickness. In fact, it was this spectral region that was used by the first pyrometer for plastics (Noakes 1971). Note also that most plastics have a fairly large number of absorption bands of different intensity that can be used in pyrometry. For the wavelengths selected, the film thickness L must be such as to ensure complete absorption; this criterion may be specified as αL > 5, where α is the absorption coefficient. The stronger the absorption, the thinner the film that has ελ=0.96. Figure 10 indicates that a layer about 6 mm thick is suitable for pyrometry in the wavelength range 2.0–2.6 µm.
Figure 10. Thickness dependence of the normal emissivity of a plastic film for a wavelength
of 3.43 µm (1, the bottom scale) and wavelength range 2.0 – 2.6 µm (2, the top scale)

12
7. Pyrometry of scattering inhomogeneous dielectrics Scattering lightens the temperature measurements in a certain sense. With a scattering coefficient β of order 102–103 cm-1, a layer as thin as 0.1–1 mm can be treated as having an infinite optical thickness. Regrettably, to calculate the emissivity of scattering materials are practically impossible even for optically infinite layer because data on wavelength and temperature dependence of α, β and γ are absent. To add further complication, β and γ depend on structural factors such as porosity, pore size distribution, grain size, and the extent to which the material is heterogeneous. With scattering ceramics, the absorption coefficient differs from that of the same substance in the single crystalline state. For the above reason, contactless measurements of surface temperature on a scattering material should again use a spectral region where 1≈λε . A suitable region is characterized by the scattering albedo 0→ω and 1→n . The condition 0→ω means that the absorption coefficient must be much larger than the scattering coefficient. Since scattering varies more slowly with wavelength than absorption does in most cases, it is ordinarily possible to find a spectral region of suitable αβ − relationship at the short-wavelength edge of the first lattice absorption band, where n is usually close to unity. Thus, measurement wavelengths should be selected so that α is as large as possible and n approach unity whether the dielectric is scattering or not. 8. Pyrometry of semiconductors Figure 11 shows, as an example, the spectral dependence of the refractive index n and the absorbtion index κ of a high-purity single crystal of germanium in its fundamental absorption band at room temperature (Potter 1985) and the normal reflectance R, calculated on the base of these data.
0.0 0.5 1.0 1.5 2.00
1
2
3
4
5
6
0.0
0.1
0.2
0.3
0.4
0.5
0.6
0.7
0.8
R
κ
n
n, κ
λ, µm
R
Figure 11. Spectral dependence of the absorption index κ, the refractive index n, and the
reflectivity R of high pure germanium at room temperature

13
Notice that, beginning with λ = 1.5 µm, the absorption index grows rapidly with decreasing wavelength, and so does the refractive index. The latter reaches a maximum at λ = 0.6 µm and then falls to unity at ≈λ 0.18 µm. As n and κ decrease, so does R, but R does not reach zero when n = 1, because κ is still considerable. As λ is increased from about 1.5 µm, the absorption coefficient of high-purity germanium (resistivity about 50 Ω⋅cm) decreases rapidly to a level of order 0.1 cm-1 at room temperature and the region of high transparency begins. As in this region the refractive index 4≈n , the reflectivity is high (R is more than 0.35). In the high transmission region (2–14 µm), the absorption coefficient depends greatly on impurities concentrations and temperature. Figure 12 shows the spectral dependence of the absorption coefficient subject to temperature for p-type germanium whose room temperature resistivity is 30 Ω cm, the curves being calculated from transmission data given by Gillespie et al (1965). The calculation also used refractive index values from Voronkova et al (1965). Figure 13 shows the spectral dependence of n, κ, and R of an optical quality single crystal of silicon over the fundamental absorption band. The curves were calculated using data given by Edwards (1985). The refractive index n=1 is observed at λ=0.2 µm, however, the reflectivity is high there due to a big κ, as with germanium. As with other semiconductors, the absorption of single crystalline silicon is strongly temperature dependent in the transmission region. Figure 14 illustrates this by showing the wavelength and temperature dependence of the absorption coefficient for n-type silicon
2 4 6 8 10 12
0.1
1
104
3
2
1
α, c
m-1
λ, µm Figure 12. Spectral dependence of the absorption coefficient of p-type single crystal of
germanium: 1 – 298 K, 2 – 373 K, 3 – 473 K, 5 – 473 K
with a room-temperature resistivity of 5 Ω cm, as calculated from transmission data by Gillespie et al (1965). It is known that the optical properties of silicon are essentially affected by oxygen admixture, which can penetrate silicon crystals during both growth and thermal processing. The Si—O bond is manifested in the absorption peak at about 9 µm, as in silica glass. This band can be seen in figure 14.

14
0.2 0.4 0.6 0.8 1.0 1.20
1
2
3
4
5
6
7
0.3
0.4
0.5
0.6
0.7
0.8
κ
nn,
κ
λ, µm
R
R
Figure 13. Spectral dependence of the absorption index κ, the refractive index n, and the
reflectivity R of high pure silicon at room temperature
In the transmission region, semiconductor absorption is associated not only with intrinsic carriers but also with impurities, defects, and related carriers; in fact, intrinsic carriers are of secondary importance in many cases.
0 2 4 6 8 10 12
0.1
1
10 5
4
321
α, c
m-1
λ,µm Figure 14. Spectral dependence of the absorption coefficient of n-type single crystal of
silicon: 1 – 298 K, 2 – 373 K, 3 – 573 K, 5 – 673 K

15
Figure 15 illustrates this point with the room-temperature spectral dependence of the absorption coefficient subject to resistivity in the case of p-type silicon. It is seen that the absorption may change by two orders of magnitude as the doping level is varied.
1 2 3 4 5 6 7 8 910 200.1
1
10
1005
4
32
1
α, c
m-1
λ, µm Figure 15. Spectral dependence of the absorption coefficient of p-type silicon of different
resistivity: 1 – 0.5 Ω⋅cm, 2 – 0.13, 3 – 0.07, 4 – 0.03, 5 – 0.014
The above patterns of spectral dependence, which are also typical of diatomic semiconductors, do not allow true surface temperature to be measured at the wavelength of unit refractive index in the fundamental absorption band, because strong absorption at this wavelength implies a large reflectance. Note also, that the wavelength lies in the vacuum ultraviolet, where emission is prohibitively weak at practical temperatures. Likewise, true surface temperature cannot be measured in the region of multiphonon absorption, because the refractive index and hence the reflectance remain large over wavelengths up to 25 µm. In terms of spectral characteristics, the long wavelength edge of fundamental absorption appears to be the most suitable for semiconductor pyrometry. Since the absorption at these wavelengths is independent of doping level, one can find a narrow wavelength range where
≈α 100 cm-1 and the model of a uniform-temperature thin surface layer is applicable. Although the temperature so measured is brightness temperature, a correction can be made for surface reflection, provided that the background radiation is sufficiently weak. The correction will depend on only the refractive index, which is usually known to a fairly high accuracy. Such a narrow range is centered at about 0.95 or 1.6 µm for silicon and germanium, respectively. 9. General considerations in selecting a spectral range for the pyrometry of dielectrics and semiconductors The above considerations concerning the selection of a spectral range for the pyrometry of dielectrics and semiconductors are solely based on the spectral characteristics of the materials. In practice, a spectral range of contactless temperature measurement is greatly

16
constrained by other factors as well, namely, air attenuation, the required temperature sensitivity of the instrument, and the temperature range of measurement. The air through which the radiation to be measured passes usually contains water vapor and carbon dioxide. Water vapor absorbs most strongly in the bands 2.6–2.9 and 5.9–7.5 µm, and carbon dioxide, in the bands 2.7–2.8, 4.2–4.6, and 13.5–16.0 µm. The attenuation at these wavelengths depends on the distance and the concentration. The spectral absorptance of water vapor over a path length of 1.2 m for a typical humidity may be as high as 20%. Both gases tend to contribute to the attenuation. Although their effect can be allowed for by calibration with respect to expected operating conditions, unavoidable humidity fluctuations can cause measured temperatures to deviate from true ones by several degrees. For this reason, an operating spectral range is usually selected outside the absorption bands of water vapor and carbon dioxide. Another consideration is that any pyrometer should maximize the radiation flux utilized. With semitransparent objects, an operating spectral range is selected with regard to both the spectral characteristics of the object and the spectral distribution of blackbody radiation as described by Planck's radiation law. The two limiting factors are often at variance with each other, so that one has to strike a balance between them. In terms of temperature sensitivity, shorter wavelengths are preferable for the following reasons. For example, as it follows from the Wien's law, the relative change VdV / in the output signal of a pyrometer is connected with the relative change in temperature by the expression:
TdT
Tc
VdV
λ2= , (7)
where 2c = 1.4388⋅102 m K is the second constant in Planck's radiation law. It follows that, as an example, if the temperature deviates by 1% from 1000 K, the percentage change in signal will be 14% at λ=1 µm against 1.4% at λ=10 µm. Furthermore, errors due to uncertainty in emissivity are less important if the measurement is made at shorter wavelengths. To be specific, if the emissivity is known to within 1%, temperature measurements around 1000 K will be accurate to within 0.7 K at λ=1 µm against 7 K at λ=10 µm. 10. Measurement of bulk temperature distribution on dielectrics and semiconductors In the above the temperature measurement of a semitransparent material has been addressed within the model of a uniform temperature of surface or thin sub-surface layer. However, temperature is not uniform in many practical cases, so that the problem arises of determining a temperature distribution in the bulk of an object. There are several contactless methods of temperature field measurement on semitransparent materials on the basis of the temperature dependence of the refractive index n and the absorption coefficient α in the transmission region. As compared with contact measurements, these methods have the advantage of not disturbing the temperature field being examined. As compared with conventional pyrometry, they do not require radiation emission from the object and therefore can be used at moderate temperatures. Yet another advantage is a high speed of response, which makes them applicable to fast processes. On the other hand, the optical contactless methods have their limitations. First, the measurements proper yield a distribution of the refractive index or absorption coefficient, which is then converted to a temperature field by calculation using a temperature dependence of the optical property concerned. The point is that the accuracy of calculation is often insufficient. Furthermore, the material to be examined must be homogeneous and free from scattering centers and must have a very high optical quality (if the object is placed into a chamber, the same requirement is imposed on the windows). It is therefore hardly surprising that the optical contactless methods have not become popular.
17
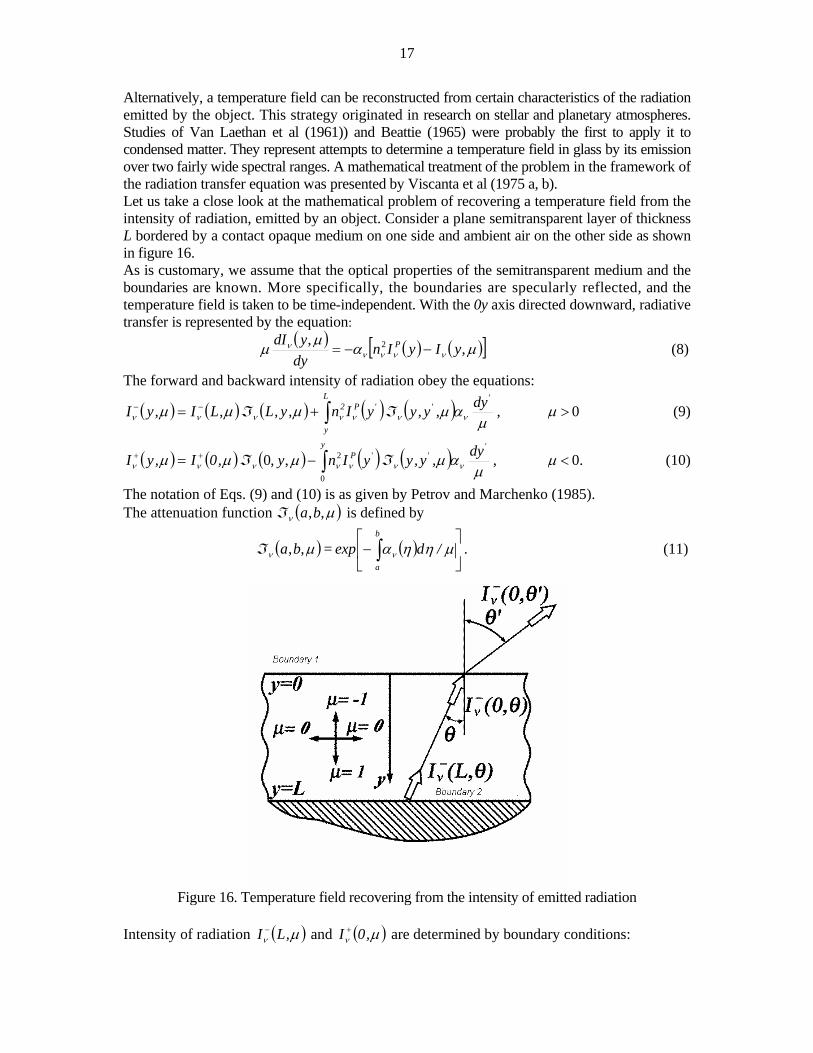
Alternatively, a temperature field can be reconstructed from certain characteristics of the radiation emitted by the object. This strategy originated in research on stellar and planetary atmospheres. Studies of Van Laethan et al (1961)) and Beattie (1965) were probably the first to apply it to condensed matter. They represent attempts to determine a temperature field in glass by its emission over two fairly wide spectral ranges. A mathematical treatment of the problem in the framework of the radiation transfer equation was presented by Viscanta et al (1975 a, b). Let us take a close look at the mathematical problem of recovering a temperature field from the intensity of radiation, emitted by an object. Consider a plane semitransparent layer of thickness L bordered by a contact opaque medium on one side and ambient air on the other side as shown in figure 16. As is customary, we assume that the optical properties of the semitransparent medium and the boundaries are known. More specifically, the boundaries are specularly reflected, and the temperature field is taken to be time-independent. With the 0y axis directed downward, radiative transfer is represented by the equation:
( ) ( ) ( )[ ]µαµµ ννννν ,, 2 yIyIndyydI P −−= (8)
The forward and backward intensity of radiation obey the equations:
( ) ( )µµ νν ,LI,yI −− = ℑ ( ) ( )∫+L
y
'P yIn,y,L ννν µ 2 ℑ ( )µ
αµ νν
'' dy,y,y , >µ 0 (9)
( ) ( )µµ νν ,I,yI 0++ = ℑ ( ) ( )∫−y
P yIny0
'2,,0 ννν µ ℑ ( )µ
αµ νν
'' dy,y,y , <µ 0. (10)
The notation of Eqs. (9) and (10) is as given by Petrov and Marchenko (1985). The attenuation function ℑ ( )µν ,,ba is defined by
ℑ ( )µν ,,ba = ( ) ⎥⎦
⎤⎢⎣
⎡− ∫
b
a
/dexp µηηαν . (11)
Figure 16. Temperature field recovering from the intensity of emitted radiation
Intensity of radiation ( )µν ,LI − and ( )µν ,I 0+ are determined by boundary conditions:

18
( ) ( )[ ] ( ) ( ) ( ),,LIRTInR,LI P µµµµ νννννν+− +−= 22
221 >µ 0, (12)
( ) ( ) ( )µµµ ννν ,0,0 1−+ = IRI , <µ 0. (13)
Inside the semitransparent layer, the radiation arriving at the upper boundary, is expressed by substituting 0=y into Eq. (9):
( ) ( )µµ νν ,LI,I −− =0 ( ) ( )µµ νν ,LI,I −− =0 ℑ ( ) ( )∫+L
P yInL0
2,0, ννν µ ℑ ( )µ
αµ ννdy,,y 0 . (14)
The intensity, emitted into the air is therefore given by ( ) ( )[ ]( ) ( )µµµ ννννν ,0/1,0 22
01' −− −= InnRI . (15)
Equation (14) with boundary conditions (12) and (13) implies
( ) ( )µβµ νν =− ,I 0 ( )[ ] ( )22
21 TInR Pννν µ− ℑ ( )+µν ,,L 0
( )∫+L
P yIn0
2νν [ℑ ( ) ( )µρµ νν 20 +,,y ℑ ( )µν ,,L 0 ℑ ( )µν ,y,L ]
µαν
dy, (16)
where ( ) =µβν [ ( ) ( )µµ νµ 211 RR− ℑ ( )µν ,L,02 ] 1− (17)
represents multiple internal reflections from the two boundaries. Substituting Eq. (16) into Eq. (15) yields
( ) ( )[ ] ( )µβµµ νννν20110 nR,I ' −=− ( )[ ] ( )221 TIR P
νν µ− ×
×ℑ ( )µν ,0,L ( )∫+L
P yI0
ν [ℑ ( ) ( )µµ νν 20 R,,y + ℑ ( )µν ,,L 0 ×ℑ ( )µν ,y,L ]µ
ανdy
. (18)
Solving Eq. (18) by inversion yields a temperature distribution )( yT . The procedure makes use of emission intensities measured at a number of frequencies selected so that radiation from any point inside the layer reach the detector (a spectrometer or spectroradiometer). It is assumed that one knows the temperature dependence of nv and να , the respective reflectivity of boundaries 1 and 2, R1v and R2v; and the temperature T2 at boundary 2. The inversion procedure is no easy task, as Eq. (18) is an inhomogeneous nonlinear Fredholm integral equation of the second kind. Note also that its solution is often very sensitive to measurement errors. The accuracy of a solution is also limited by the accuracy to which the spectral and temperature dependence of absorption is identified, as well as by the limited amount of measured data available, ( )',0 µν
−I . Moreover, the condition of specular reflection from the boundaries may not be fulfilled. The inversion procedure consists in repeated solution of Eq. (18) subject to a tentative temperature distribution, whose parameters are refined in each step. The ultimate goal is to minimize the objective function
( )∑=
∆=N
iigFf
1, (19)
where N is the total number of independent measurements, , ( )calci Ig ',0 µν−=∆ - ( )measI ',0 µν
− and F is an arbitrary monotonic increasing positive function of ig∆ . It is commonly assumed that
F = ( )2ig∆ . The objective function f so defined will be equal to zero if the temperature distribution
is recovered exactly and the measured data are free from errors. Since this is seldom the case, the objective function is often defined as the sum of squared deviations of calculated intensities from measured ones. A temperature distribution is represented as a set of points )( yT or as a

19
combination of certain functions. If the semitransparent layer is thin enough, its temperature field can be represented by a polynomial of degree 1. 11. Combined calculation-experimental method of temperature field determination For a plane semitransparent layer, a temperature field is commonly calculated by simultaneous solution of two equations describing energy conservation and radiation heat transfer provided that boundary conditions, optical and thermal properties of the material are known. The boundary conditions are specified for distant, opaque boundaries, such as the chamber walls and the heater. The temperature on these boundaries is easily measured with thermocouples or pyrometers in most cases. However, a temperature field can be derived from a measured temperature of the semitransparent material itself (Bityukov et al, 1980). This strategy enables one to determine temperature fields far more accurately. Its implementations ordinarily use a measured surface temperature as a boundary condition. The simplest case is dielectric crystals or ceramics, whose emission is measured in the opaque region, the refractive index being close to unity. 12. Conclusion (i) For homogeneous dielectrics, surface temperature can be determined by measuring the emission in a narrow spectral range at the short wavelength edge of fundamental lattice absorption, where ≈n 1. In this case, reflection is unimportant and it is not necessary to know the optical properties of the dielectric. On the other hand, one has to deal with a small signal-to-noise ratio of the instrument, absorption by the air, and a low temperature sensitivity of the pyrometry signal. (ii) For scattering inhomogeneous dielectrics, the spectral range of measurement may be the same as that for homogeneous dielectrics except that its short-wavelength edge must be shifted toward longer wavelengths. (iii) For dielectrics, a general way to determine surface temperature is to measure the emission from a thin surface layer in the multiphonon absorption band, where the absorption coefficient is of order 100 cm-1. At these wavelengths the correction for reflection depends on the refractive index only, which is usually known to a high accuracy and is little affected by temperature variations. (iv) For organic materials and polymers, wavelengths around 3.43 µm are preferable: they correspond to C—H bond stretching. (v) For semiconductors, temperature measurements should be made at wavelengths close to the long wavelength fundamental absorption edge, for which the absorption coefficient is of order 100 cm-1 at room temperature. On the other hand, the refractive index must be known to a high accuracy in order to make a correction for surface reflection. (vi) For dielectrics, bulk temperature fields should be determined from the surface temperature measured at wavelengths for which absorption is high and ≈n 1. A temperature field is derived by numerical solution of equations for radiative and conductive heat transfer. References Beattie J R, 1965 Ceram. Age 81, No. 4, 70-79. Beattie J R, Coen E, 1960 Br. J. Appl. Phys. 11, No 4, 151-157 Bityukov V K, Petrov V A, and Stepanov S V, 1980 High Temp.-High Press. 12 229-236 Brun J F, Meneses D D S, Echegut P, 2002 in The Sixteenth European Conference on Thermophysical Properties, (London: Imperial College) Edwards D F, 1985 in Handbook of Optical Constants of Solids Ed. E.D. Palik (New York: Academic Press), pp. 547-569 Galaktionov A V, Petrov V A, and Stepanov S V, 1988 in Teplomassoobmen: Problemnye

20
doklady Minskogo Mezhdunarodnogo foruma (Heat and Mass Transfer: Problem Papers from an International Forum in Minsk), (Minsk: Institute of Heat and Mass Transfer), pp. 208-222. Gillespie O T, Olsen A L, and Nichols L W, 1965 Appl. Opt. 4, No. 11, 1488-1493. Gurevich M M, 1931 Trudy Gos. Opt. Inst. 6, issue 57, 1-20 Kubelka P, Munk F, 1931 Z. Tech. Phys. B 20, No 11a, 593-601 Land T, 1962 Glass Ind. 43, No 5, pp. 244-247, 250-251, 282-283 Lingart Yu K and Petrov V A, 1977 Elektrotekh. Prom., Elektrotermiya No 5 (177), 3-4 Makino T, Kunitomo T, Sakai I, Kinoshita H, 1984, Heat Transfer–Jpn. Res. 13, No. 4, 33-50 Mitra S S, 1985 in Handbook of Optical Constants of Solids Ed. E.D. Palik (New York: Academic Press), pp. 213-270 Moss T S, Burrell G J, and Ellis B, 1973 Semiconductor Opto-Electronics, (London: Butterworths) Nicolau V P, Raynaud M, Sacadura J F, 1994 Int. J. Heat Mass Transfer 37 311-317 Noakes W, 1971 Control Instrum. 3 No. 9, 42-43 Petrov V A, 1993 Inzh.-Fiz. Zh. 64 726-733 Petrov V A and Marchenko N V, 1985 Perenos energii v chastichno prozrachnykh tverdykh materialakh (HeatTransfer in Partially Transparent Solid Materials) (Moscow: Nauka), pp. 136-139 Potter R F, 1985 in Handbook of Optical Constants of Solids Ed. E.D. Palik (New York: Academic Press), pp. 465-478 Snopko V N, 1999 Osnovy metodov pirometrii po spektru teplovogo izlucheniya (The Fundamentals of Pyrometry by Thermal Emission Spectra) (Minsk: Stepanov Institute of Physics) Stepanov S V, 1988 Teplofizika Vysokikh Temperatur 25 180-182 Svet D Ya, 1982 Opticheskie metody izmereniya istinnykh temperatur (The Optical Methods of True-Temperature Measurement) (Moscow: Nauka) Van Laethan R, Leger L G, Boffe N, and Plumat E, 1961 J. Am. Ceram. Soc. 44 321-322 Viscanta R, Chupp R E, Toor J S, and Hommert P J, 1975a IEEE Trans. Ind. Appl. 11 438-446 Viscanta R, Hommert P O, and Groninger G L, 1975b Appl. Opt. 14 428-437. Voronkova E M, Grechushnikov B N, Distler G I, Petrov I P, 1965 Opticheskie materialy dlya infrakrasnoi tekhniki (Optical Materials for Infrared Technology) (Moscow: Nauka) Zolotarev, V M, Morozov, V N and Smirnova E V, 1984 Opticheskie postoyannye prirodnykh i tekhnicheskikh sred (Optical Constants of Natural and Artificial Media) (Leningrad: Khimiya)