Closing the Opportunity to Learn Gap for Students with Disabilities
Upload
truongkietCategory
view
216download
0
Opportunity to Learn:A high impact strategy for improving educational outcomes in developing countries.
Audrey-marie Schuh Moore, Ph.D., Joseph DeStefano, and Elizabeth Adelman
MARCH 2012

EQUIP2: Educational Policy, Systems Development, and Management is one of three USAID-funded Leader with Associates Cooperative Agreements under the umbrella heading Educational Quality Improvement Program
(EQUIP). As a Leader with Associates mechanism, EQUIP2 accommodates buy-in awards from USAID bureaus and missions to support the goal of building education quality at the national, sub-national, and cross-
community levels.
FHI 360 is the lead organization for the global EQUIP2 partnership of education and development organizations, universities, and research institutions. The partnership includes fifteen major organizations and an expanding network of regional and national associates throughout the world: Aga Khan Foundation, American
Institutes for Research, CARE, Center for Collaboration and the Future of Schooling, East-West Center, Education Development Center, International Rescue Committee, Joseph P. Kennedy, Jr. Foundation, Michigan
State University, Mississippi Consortium for International Development, ORC Macro, Research Triangle Institute, University of Minnesota, University of Pittsburgh Institute of International Studies in Education,
Women’s Commission for Refugee Women and Children.
The original Opportunity to Learn series is available for download on the EQUIP2 website
http://www.equip123.net
Case Studies
Using Opportunity to Learn and Early Grade Reading Fluency to Measure School Effectiveness in Ethiopia
Using Opportunity to Learn and Early Grade Reading Fluency to Measure School Effectiveness in Guatemala
Using Opportunity to Learn and Early Grade Reading Fluency to Measure School Effectiveness in Honduras
Using Opportunity to Learn and Early Grade Reading Fluency to Measure School Effectiveness in Mozambique
Using Opportunity to Learn and Early Grade Reading Fluency to Measure School Effectiveness in Nepal
Working Papers and Policy Briefs
Opportunity to Learn: A high impact strategy for improving educational outcomes in developing countries
Opportunity to Learn and Early Grade Reading: The cases of Ethiopia, Guatemala, Honduras, Mozambique, and Nepal
School Effectiveness: Improving the Use of Financial Investments in Education

Opportunity to Learn:A high impact strategy for improving
educational outcomes in developing countriesAudrey-marie Schuh Moore, Ph.D.
Joseph DeStefanoElizabeth Adelman
MARCH 2012


Table of Contents
iTable of ContentsForward.....................................................................................................................................................1
Acknowledgements....................................................................................................................................2
Contributors..............................................................................................................................................3
Opportunity to Learn: A high impact strategy for improving educational outcomes in developingcountries..............................................................................................................................................7
Opportunity to Learn and Early Grade Reading: The cases of Ethiopia, Guatemala, Honduras, Mozambique, and Nepal...........................................................................................................................29
School Effectiveness: Improving the Use of Financial Investments in Education......................................63
Using Opportunity to Learn and Early Grade Reading Fluency to Measure School Effectiveness inWoliso, Ethiopia.......................................................................................................................................71
Using Opportunity to Learn and Early Grade Reading Fluency to Measure School Effectiveness inGuatemala................................................................................................................................................99
Using Opportunity to Learn and Early Grade Reading Fluency to Measure School Effectiveness inHonduras...............................................................................................................................................129
Using Opportunity to Learn and Early Grade Reading Fluency to Measure School Effectiveness inMozambique..........................................................................................................................................157
Using Opportunity to Learn and Early Grade Reading Fluency to Measure School Effectiveness inNepal.....................................................................................................................................................195
Opportunity to Learn Research Methodology...........................................................................................219


1
Forward
ForwardHow can we ensure that 100 million children learn to read by 2015?
The United States Agency for International Development (USAID) supported by the Education Quality Improvement Program (EQUIP2) addresses this question through applied research and education projects in a variety of developing countries.
USAID support and research on learning to read extends back nearly a decade and has recently gained momen-tum through the EDDATA II program and its contributions on early grade reading, as well as from research and project experience from a variety of other donors and organizations.
Many countries that have undergone expansion of access to public education still face significant disparities in the quality of education that students receive- wide challenges that many Ministries of Education struggle to address. Compounding this challenge is the fact that significant amounts of time are lost throughout the school year and day, which makes it difficult for teachers to find time to cover the curriculum and teach students.
To understand how these challenges might be addressed, EQUIP2 developed an opportunity to learn index (OTL) that is comprised of 12 factors that are supported by the international literature as key to ensuring that students in primary school have a foundational opportunity to learn.
Of the twelve factors, the first six are associated with time lost for learning. These include: the school being open or closed; teacher and student absenteeism; time lost during the day; time on task; and equivalent time for instruction.
EQUIP2, in partnership with Save the Children, CARE and the Aga Khan Foundation, identified five case examples that allowed teams of researchers to test the hypothesis that decreased time for learning was correlated with lower ability to read.
The teams developed a research methodology for collecting and analyzing the OTL factors. Data were gathered on the amount of time lost, time spent on reading activities, and grade three students’ ability to read. A par-ticularly noteworthy aspect of this research was the team’s ability to quantify the loss of time. Research findings challenged some of the prevailing notions about what it may take to help 100 million students learn to read and suggested critical areas where donors and Ministries of Education should focus to ensure that schools have sufficient time available for learning.
The cases in this book demonstrate that understanding the time loss factors as they relate to school manage-ment provide a unique and critical role to addressing USAID’s new education goals – particularly ensuring primary school students learn to read. EQUIP2 research suggests five critical areas that donors and Ministries alike should address: ensuring the school is open every day; ensuring that teachers are present; ensuring that students are present and ready to learn; ensuring that the school day is managed to minimize time loss; and that teachers learn to manage their class time as well as improve their pedagogical practices.
This book includes a chapter which frames the research questions and the issues around opportunity to learn; a chapter outlining the research methodology; a synthesis of the case study findings; a chapter on the resource wastage OTL leads to; and the five case studies. This research demonstrates that students need both quality instruction and time to learn to read.
It is our hope that this research will be a useful contribution to efforts to achieve Education for All.
Patrick CollinsUSAID Education Officer EGAT Education/USAID

2
Opp
ortu
nity
to L
earn
: A h
igh
impa
ct st
rate
gy fo
r im
prov
ing
educ
atio
nal o
utco
mes
in d
evel
opin
g co
untr
ies
AcknowledgmentsThis book is the result of a three-year effort to examine the opportunity to learn its impact on students’ ability to read. Central to the completion of this book is the extensive range of support, data and evalua-tions produced by our partners. In writing these cases, the authors have made a sincere effort to include and share local voices and perceptions about the challenges and opportunities facing schools in each country. In all cases, local staff from our partner organizations contributed to modifying and adapting instruments to make the instruments relevant to the country context.
We would like to extend our warmest regards and sincere thanks to all those who provided ideas, insights, input, and feedback on a variety of issues in both the individual case studies and the synthesis paper. Contributing to the ongoing dialogue on opportunity to learn and to individual case studies are: ministry of education staff, including those supporting policy, financing and implementation of several of these programs; staff of international development agencies; funding and technical assistance agencies; univer-sities; community groups; NGOs and teachers and district education staff.
The accumulated knowledge, experience and feedback from individuals representing the above organiza-tions have been integrated into the case studies and papers that make up this book. We would like to specifically thank the following individuals and organizations.
USAID. We would like to extend our sincerest gratitude to USAID Washington and the Missions in Guatemala, Honduras, Ethiopia, Mozambique, and Nepal in supporting research on the opportunity to learn. In particular, we would like to thank Patrick Collins, EQUIP2 AOTR for his support and guid-ance over the last three years.
EQUIP2 partners. Collaboration from Save the Children, CARE, the Aga Khan Foundation, and RTI were essential to the completion of individual case studies. Our EQUIP2 University partners helped review the analysis and publish the work in various journals. Individuals deserving special recognition include Joseph DeStefano (RTI); Conrad Wesley Snyder (FHI 360); Amy Jo Dowd (Save the Chil-dren); Linda Ulquini (AKF); Sheila Manji (AKF), Kathy Bartlett (AKF); Margaret Meagher and Sarah Bouchie(formerly CARE); James Jacob (University of Pittsburgh); David Chapman (University of Min-nesota), Mark Ginsburg (FHI 360) and all the in country teams who are individually acknowledged in the case studies. EQUIP2 Opportunity to Learn Research Team. This book would not have been possible without the significant contribution of time, energy, and outright will from our core team of researchers: Joseph DeStefano, Audrey-marie Schuh Moore, and Elizabeth Adelman. Sheila Manji (AKF) was critical as a co-principle investigator in Mozambique. Eva Grajeda, Nawsheen Elaheebocus, and Elliot Freidlander who led data collection teams in the field, assisted in adapting the instruments and supported analysis of the data for the country case studies. Erik Lundgren, Annie Smiley, and Brian Dooley were also essential to the team in creating attractive layouts and formats for working papers, briefs, and this book, editing and tightening documents, and for supporting the team in developing creative and effective dissemination strategies. Thank you. ~~It is my sincere hope that individuals and organizations working to achieve improved learning will find this book of value as we strive to address the challenges and adversities faced when children an opportu-nity to learn.
Audrey-marie Schuh Moore, Joseph DeStefano, and Elizabeth AdelmanEQUIP2 OTL Research Team

3
Acknowledgem
ents and Contributors
ContributorsDr. Audrey-marie Schuh Moore is the Director of EQUIP2 at FHI 360 and provided both management and technical leadership to the core research team. She helped design the research methodology and sup-ported analysis and writing for all the studies.
Joseph DeStefano is a Senior Education Research Analyst at RTI International. He is the Co-Principle Investigator for the OTL research team. He helped design the research methodology and supported the analysis and writing of all the studies. He led the Ethiopia case study and provided substantial input for the Nepal case study.
Elizabeth Adelman was a research officer with FHI 360 and led data collection teams in Guatemala, Honduras and Mozambique. Elizabeth also led data analysis for these cases and is the lead author for the Mozambique case study. She is currently completing her Ed.D at Harvard University.
~Specific contributions to particular chapters and case studies assembled in this book include:
Moore, Audrey-marie Schuh, Ph.D., Joseph DeStefano, and Elizabeth Adelman (2011). Opportunity to Learn and Early Grade Reading: The cases of Ethiopia, Guatemala, Honduras, Mozambique, and Nepal. Funded by the United States Agency for International Development under the EQUIP2 Program. FHI 360.
Cetola, Caitlin, Joseph DeStefano, and Audrey-marie Schuh Moore (2010). School Effectiveness: Improv-ing the Use of Financial Investments in Education. Funded by the United States Agency for International Development under the EQUIP2 Program. FHI 360.
Moore, Audrey-marie Schuh, Ph.D., Adelman, Elizabeth, and Eva Grajeda (2008). Using Opportunity to Learn and Early Grade Reading Fluency to Measure School Effectiveness in Guatemala. Funded by the United States Agency for International Development under the EQUIP2 Program. FHI 360.
Adelman, Elizabeth, Moore, Audrey-marie Schuh, and Analia Jamovich (2009). Using Opportunity to Learn and Early Grade Reading Fluency to Measure School Effectiveness in Honduras. Funded by the United States Agency for International Development under the EQUIP2 Program. FHI 360.
DeStefano, Joseph and Nawsheen Elaheebocus (2009). Using Opportunity to Learn and Early Grade Reading Fluency to Measure School Effectiveness in Woliso, Ethiopia. Funded by the United States Agency for International Development under the EQUIP2 Program. FHI 360.
DeStefano, Joseph, Friedlander, Elliott, Adelman, Elizabeth, and Audrey-marie Schuh Moore. (2010). Using Opportunity to Learn and Early Grade Reading Fluency to Measure School Effectiveness: School Qual-ity in Nepal. Funded by the United States Agency for International Development under the EQUIP2 Program. FHI 360.
Adelman, Elizabeth, Moore, Audrey-marie Schuh, and Sheila Manji. (2011). Using Opportunity to Learn and Early Grade Reading Fluency to Measure School Effectiveness in Mozambique. Funded by the United States Agency for International Development under the EQUIP2 Program. FHI 360.

4
Opp
ortu
nity
to L
earn
: A h
igh
impa
ct st
rate
gy fo
r im
prov
ing
educ
atio
nal o
utco
mes
in d
evel
opin
g co
untr
ies
EQUIP2: Educational Policy, Systems Development, and Management is one of three USAID-funded Leader with Associates Cooperative Agreements under the umbrella heading Educational Quality Im-provement Program (EQUIP). As a Leader with Associates mechanism, EQUIP2 accommodates buy-in awards from USAID bureaus and missions to support the goal of building education quality at the national, sub-national, and cross-community levels.
FHI 360 is the lead organization for the global EQUIP2 partnership of education and development organizations, universities, and research institutions. The partnership includes fifteen major organizations and an expanding network of regional and national associates throughout the world: Aga Khan Founda-tion, American Institutes for Research, CARE, Center for Collaboration and the Future of Schooling, East-West Center, Education Development Center, International Rescue Committee, Joseph P. Kennedy, Jr. Foundation, Michigan State University, Mississippi Consortium for International Development, ORC Macro, Research Triangle Institute, University of Minnesota, University of Pittsburgh Institute of Interna-tional Studies in Education, Women’s Commission for Refugee Women and Children.
This paper was made possible by the generous support of the American people through the United States Agency for International Development (USAID) under Cooperative Agreement No. GDG-A-00-03-00008-00. The contents are the responsibility of FHI 360 through the Educational Quality Improvement Program 2 (EQUIP2) and do not necessarily reflect the views of USAID or the United States Government.

5
Acknowledgem
ents and Contributors

7
WO
RK
ING
PAPER: O
pportunity to Learn: A high impact strategy for im
proving educational outcomes in developing countries
Opportunity to Learn: A high impact strategy for improving educational outcomes in developing countries
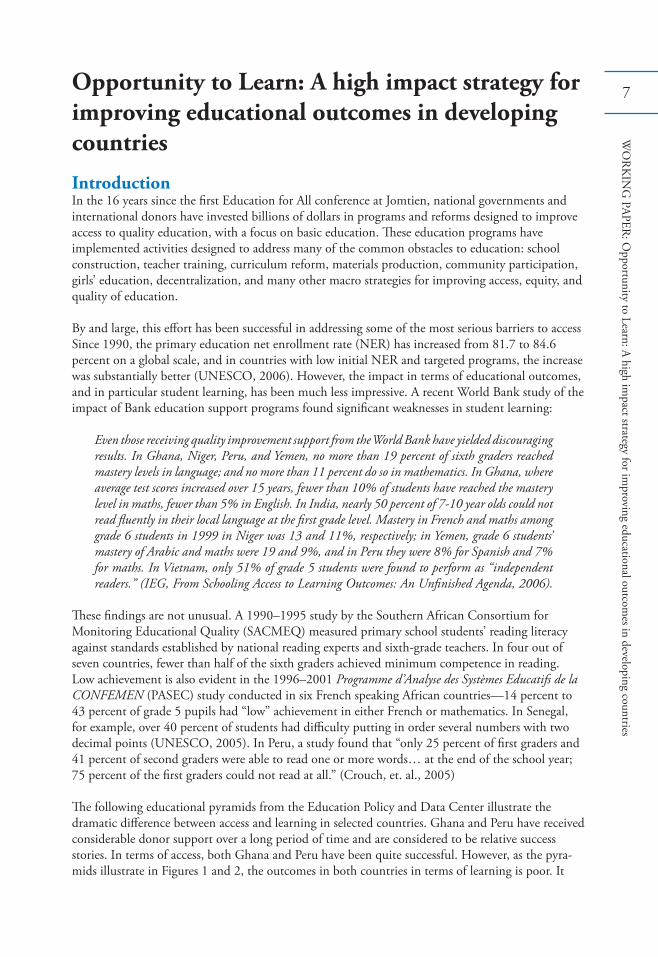
IntroductionIn the 16 years since the first Education for All conference at Jomtien, national governments and international donors have invested billions of dollars in programs and reforms designed to improve access to quality education, with a focus on basic education. These education programs have implemented activities designed to address many of the common obstacles to education: school construction, teacher training, curriculum reform, materials production, community participation, girls’ education, decentralization, and many other macro strategies for improving access, equity, and quality of education.
By and large, this effort has been successful in addressing some of the most serious barriers to access Since 1990, the primary education net enrollment rate (NER) has increased from 81.7 to 84.6 percent on a global scale, and in countries with low initial NER and targeted programs, the increase was substantially better (UNESCO, 2006). However, the impact in terms of educational outcomes, and in particular student learning, has been much less impressive. A recent World Bank study of the impact of Bank education support programs found significant weaknesses in student learning:
Even those receiving quality improvement support from the World Bank have yielded discouraging results. In Ghana, Niger, Peru, and Yemen, no more than 19 percent of sixth graders reached mastery levels in language; and no more than 11 percent do so in mathematics. In Ghana, where average test scores increased over 15 years, fewer than 10% of students have reached the mastery level in maths, fewer than 5% in English. In India, nearly 50 percent of 7-10 year olds could not read fluently in their local language at the first grade level. Mastery in French and maths among grade 6 students in 1999 in Niger was 13 and 11%, respectively; in Yemen, grade 6 students’ mastery of Arabic and maths were 19 and 9%, and in Peru they were 8% for Spanish and 7% for maths. In Vietnam, only 51% of grade 5 students were found to perform as “independent readers.” (IEG, From Schooling Access to Learning Outcomes: An Unfinished Agenda, 2006).
These findings are not unusual. A 1990–1995 study by the Southern African Consortium for Monitoring Educational Quality (SACMEQ) measured primary school students’ reading literacy against standards established by national reading experts and sixth-grade teachers. In four out of seven countries, fewer than half of the sixth graders achieved minimum competence in reading. Low achievement is also evident in the 1996–2001 Programme d’Analyse des Systèmes Educatifs de la CONFEMEN (PASEC) study conducted in six French speaking African countries—14 percent to 43 percent of grade 5 pupils had “low” achievement in either French or mathematics. In Senegal, for example, over 40 percent of students had difficulty putting in order several numbers with two decimal points (UNESCO, 2005). In Peru, a study found that “only 25 percent of first graders and 41 percent of second graders were able to read one or more words… at the end of the school year; 75 percent of the first graders could not read at all.” (Crouch, et. al., 2005)
The following educational pyramids from the Education Policy and Data Center illustrate the dramatic difference between access and learning in selected countries. Ghana and Peru have received considerable donor support over a long period of time and are considered to be relative success stories. In terms of access, both Ghana and Peru have been quite successful. However, as the pyra-mids illustrate in Figures 1 and 2, the outcomes in both countries in terms of learning is poor. It

8
Opp
ortu
nity
to L
earn
: A h
igh
impa
ct st
rate
gy fo
r im
prov
ing
educ
atio
nal o
utco
mes
in d
evel
opin
g co
untr
ies
is important to emphasize that the measures of learning in these pyramids are generally at the most basic measure of education—the ability to read a simple sentence. The large international tests such as PISA and TIMMS show that many students are not testing at a competitive level. Other proxy indicators of learning, such as transition to secondary school and primary school pass rates also indi-cate that students are not learning at adequate levels.
Figure 1. Peru Learning Pyramid
100
99
89
18
100
100
89
18
Children of school entry age
Percentage of children that will attend school
Survival to Grade 5 (in %)
DHS Dataset, 2004
UIS, 2004
FEMALESMALES
Percentage of 5th graders able to read a simple sentencePISA, 2000
Figure 2. Ghana Learning Pyramid
100
78
48
19
100
81
52
12
Children of school entry age
Percentage of children that will attend school
Survival to Grade 5 (in %)
DHS Dataset, 2003
UIS, 2002
FEMALESMALES
Percentage of 5th graders able to read a simple sentenceDHS Dataset, 2003
Why has so much investment yielded so little return? This paper argues that at least a part of the answer is that students are not succeeding because they lack the opportunity to learn (OTL). Learning outcomes are below that expected in government primary schools in developing countries despite huge investments in education reform, teacher training, learning materials, curriculum and infrastructure. Studies of schools outside the government systems (i.e. in Complementary Education Model Schools) show that children are achieving higher learning outcomes with equal or less resources. From reviewing the literature, eight crucial, underlying elements have been identified that, when at a minimum level, create what we refer to as a basic opportunity to learn. These elements are the factors that add up to total instructional time, hours in school year, days school is open, teacher attendance and punctuality, student attendance and punctuality, teacher-student ratio, instructional materials per student, time in classroom on task, and reading skills taught by grade. Education systems can track and monitor these factors as part of their management and school improvement

9
WO
RK
ING
PAPER: O
pportunity to Learn: A high impact strategy for im
proving educational outcomes in developing countries
strategy. In many developing country schools, these elements are being overlooked—school hours are insufficient, schools are closed too often, teacher and student attendance and punctuality is low, there are insufficient instructional materials for home or school use, time-on-task in the classroom is minimal, and children cannot read well enough by the end of grade 3—and there is no evident system to track and improve the situation. Without a strategy to track these elements more closely, and direct funding to ensure that a minimum level is attained, children can not be provided with a basic opportunity to learn.
This is not a new argument—it has been discussed in many fora, and some OTL elements are included in the 2005 EFA Global Monitoring Report. However, this insight has not adequately informed and influenced policy and implementation strategies of either donors or national governments. Perhaps because the answer rests on common sense, solutions are overlooked. A recent EQUIP2 study of complementary education systems highlighted cases that showed a significant improvement in completion and learning over formal schools in providing education to underserved populations. The authors concluded that these systems had no magic formula—they simply were able to provide a consistent opportunity to learn (DeStefano, et al., 2006).
This paper will argue that the basic opportunity to learn does not exist in many countries, and that a concerted management focus to assure that schools provide these basic elements of an opportunity to learn could potentially yield big improvements in learning. The paper will assess the following questions: 1) what basic factors create the opportunity to learn, and 2) to what extent is the lack of these basic elements a problem in developing countries? This working paper, one of a series on do-nor effectiveness and systems reform, will explore both the elements that create a basic opportunity to learn, and strategies for addressing them.
Opportunity to Learn IndexThe thinking behind the opportunity to learn index starts from a relatively simple premise: learning is to some degree a function of time and effort. Without adequate time on task, no learning is possible. This common sense statement is supported by international research. In A Global Study of Intended Instructional Time and Official School Curricula, 1985-2000, Benavot and Amadio (2004) state that “pupil achievement increases when students are given greater opportunities to learn, especially when ‘engaged learning time’ is maximized.” Investments in teachers, materials, curricula, and classrooms are wasted if they are not used for a reasonable period of time. For the purposes of this paper, we assume a straightforward relationship between learning and the opportunity to learn. We assume a direct relationship in that each factor that reduces time on task will have an impact on learning (i.e., every day that a teacher is absent reduces potential student learning for all students in the class by one day.) While factors such as more effective teaching methods are certainly important, it stands to reason that a good teacher who is absent is not producing—any teacher can achieve more in 100 hours than in 50 hours.
The concept of opportunity to learn is not new. In the 1960’s, John Carroll wrote that equality of Opportunity to Learn required increasing the amount of instructional time for the least prepared students to enable them to master the curriculum. In the 1980’s, RAND developed a set of institutional quality indicators, including teacher qualification, curriculum, and spending indicators.OTL standards have been applied in the U.S. to address two core concerns – standards of excellence and accountability for results. The rationale for OTL standards is straightforward—it is unfair to hold students responsible for meeting high academic standards unless they have been assured of an opportunity to learn. If schools lack the resources to teach students the material that will be assessed, then accountability and performance standards can have little impact. The OTL standards seek to track whether school quality is adequate to achieve the standards and whether the resources are

10
Opp
ortu
nity
to L
earn
: A h
igh
impa
ct st
rate
gy fo
r im
prov
ing
educ
atio
nal o
utco
mes
in d
evel
opin
g co
untr
ies
distributed equitably among schools and districts (Venezia & Maxwell-Jolly, 2007).
Prior to No Child Left Behind legislation in the U.S., the Goals 2000 legislation in 1994 sought to hold schools and school systems accountable for student outcomes through voluntary OTL standards that established criteria to assure that the “resources, practices, and conditions” necessary for student learning are available (Ysseldyke, Thurlow & Shin, 1995). The standards addressed the following areas:
• Curricula and materials; • Teacher capability; • Continuous professional development; • Alignment of curriculum, instructional practices, and assessments with content standards;• Safety and security of the learning environment;• Non-discriminatory policies, curricula and practice;• School financing; and• Other factors that assure students the fair opportunity to achieve knowledge and skills.
While these standards are appropriate and relevant for all countries, they do not capture the key factors that are most immediately relevant for developing countries. Much of the national and international investment in education has focused on the issues listed above without a commensurate effect. This paper posits that a basic OTL for developing countries needs to focus on a number of more fundamental measures before the above elements become relevant.
A previous variation of school standards was the Fundamental Quality Level (FQL) approach implemented in a number of African countries in the 1990’s. The FQL system sought to establish standards of inputs and infrastructure necessary to provide equality of school conditions. The FQL program provided a basis for dialogue about investment in education infrastructure. While extremely useful for informing investment decisions and choices, the FQL approach did not capture the management aspects of creating a genuine opportunity to learn.
This paper suggests an index of eight factors that constitute the core elements of an opportunity to learn. A series of additional elements is necessary to bring an education system to a level of high academic performance, but none, or at least very few, of the higher level investments can be effective without a solid foundation. One can easily argue for additional or fewer elements. The literature supports many other factors that influence school performance such as percent of female teachers, school feeding, parent involvement, socio-economic status, etc. This framework does not seek to be comprehensive, but rather to address the basic, common sense elements that have not been adequately addressed.
The OTL pyramid illustrated in Figure 3, shows a progression of issues that need to be addressed and managed for effective education. Levels are illustrative, and the elements in the higher levels are included only to demonstrate the concept of a stepped series of investments, and not to attempt to define a hierarchy of education strategies. The focus of this paper is on the bottom level. We argue that the failure to focus on the fundamental OTL factors undermines all investments in higher level interventions. As one moves up the pyramid, the technical complexities of implementing the improvements increases. However, the lowest level factors reflect the lowest levels of management and technical complexity, and yet have a huge impact on outcomes.

11
WO
RK
ING
PAPER: O
pportunity to Learn: A high impact strategy for im
proving educational outcomes in developing countries
Figure 3. Opportunity to Learn Pyramid
Elements of a Foundational Opportunity to LearnThe Balochistan Community Girls School Project and Schools for Life, in Ghana’s Northern Region, are just two of many complementary approaches. Operating on impressive scales and in the most challenging circumstances, they contribute to EFA goals of access, equity, completion, and learning. Other examples are summarized in Table 1.
Foundational elements inputs and managements1. The school year has a minimal instructional time of 850-1000 hours per year. 2. The school is open every hour and every day of the school year, and the school is located in the
village or at least within 1 km of the student. 3. The teacher is present every day of the school year and every hour of the school day. 4. The student is present every day of the school year and every hour of the school day. 5. The student-teacher ratio is within manageable limits, assumed to be at least below 40-1. 6. Instructional materials are available for all students and used daily.
Foundational elements: pedagogy7. The school day and classroom activities are organized to maximize time-on-task—the effective
use of time for educational purposes. 8. Emphasis is placed on students developing core reading skills by the second or third grade.
For the purpose of this discussion, we make a distinction between the first six elements, which represent management and funding challenges and the last two, which represent a somewhat more complex challenge, reflecting instructional design and school/classroom management challenges that require higher level skills. As one moves up the pyramid, the complexity of the challenge and technical skills or system reforms needed to address them increases. For example, an OTL study in Ghana found that the overly ambitious curriculum was poorly aligned with teacher capability, so that less than half of the material was actually covered during the school year. However, the national examinations measured learning on the entire curriculum, so that the theoretical maximum score that most students could achieve would be 50 percent, even if they learned all of the material covered perfectly.

12
Opp
ortu
nity
to L
earn
: A h
igh
impa
ct st
rate
gy fo
r im
prov
ing
educ
atio
nal o
utco
mes
in d
evel
opin
g co
untr
ies
The following discussion will briefly touch on evidence and aspects of these basic elements of an education system. A more comprehensive review can be found in a 2006 World Bank publication by Helen Abadzi, Efficient Learning for the Poor: Insights from the frontiers of Neuroscience.
Analysis of Factors Affecting the Opportunity to LearnFactor 1: The school is open and located near the studentThe starting point for learning is that there is a place to learn. The exact nature of the minimum physical requirements is open to debate and could be a home, a tent, a three-story building with plumbing, etc. What is less open to debate is that the place to learn needs to be open and near to the students.
Figure 4. Enrollment and Distance in Chad’s Western Saharan Region, 2002-2003
The school is nearby. The World Bank Rural Access Initiative found that the location of a school, particularly in some parts of Africa, has a dramatic impact on school attendance. Figure 4 shows how each additional kilometer a child lives from the school causes attendance to drop by 20 percent or more. Simply having a school in the village addresses 50–60 percent of the enrollment challenge for rural children. While the specific ratio will vary according to country context, the base relationship of distance and attendance applies generally.
The school is open. The official instructional time described above represents the theoretical maximum, which should not be confused with actual instructional time; “students almost invariably receive less than the prescribed amount of instructional hours” (Benavot, 2004). In Peru, national policy requires 1,100 hours of primary instruction, which implies 220 days for schools that are organized in two shifts of 5 hours each. The standard in Honduras is 900 hours of instruction—200 days of 4.5 hour school days; in El Salvador, 1,000 hours of instruction resulting from 200 five-hour school days. However, these official schedules are regularly undermined by strikes, holidays, weather, in-service teacher training, bureaucratic demands, cancellations, and other distractions. While definitive data is not collected or available for most countries, what is available suggests a significant loss of instructional time. Research cited by Abadzi found that schools were open only 70 percent

13
WO
RK
ING
PAPER: O
pportunity to Learn: A high impact strategy for im
proving educational outcomes in developing countries
of official time in Mali, 57 percent of the time in Honduras, and about 54 percent of the time in Nepal. Furthermore, sub-national variation in instructional time and school year and day length can reasonably be expected to be substantial, with rural areas having the greatest reduction. Such variation was acknowledged, but not measured, by Benavot.
The pressure to increase attendance and meet the EFA access goals can also exacerbate the loss of instructional time. Many countries in all regions use the strategy of double or even triple shifts to compensate for shortages of teachers or school buildings. In these countries, such as Mexico, Senegal, and Bangladesh, the school day is broken into smaller periods. On average, children in Francophone African countries lose 32 percent of their class time (Abadzi, 2006).
Factor 2: Minimum Instructional TimeThe 2005 Global Monitoring Report proposes that a quality education must start with at least 850 to 1000 hours per year of instructional time. In many developing countries, this target is difficult to reach with school days split into the two or three shifts required to achieve national coverage with limited infrastructure. Benavot and Amadio’s 2004 study of instructional time (Table 1) found that regional averages for grades 1-3 are consistently below the minimum target of 850 hours, and that in four of the seven regions, the median annual instructional hours actually decreased between 1985 and 2000. The global average instructional time in 2000 was below the 850 hour target in all six primary grades.
Table 1: Median Yearly Instructional Hours in Grades 1 to 8, circa 1985 and 2000 (constant cases), by UNESCO Region*
UNESCO Regions Period Grade
1Grade
2Grade
3Grade
4Grade
5Grade
6Grade
7Grade
8# of
Cases
SSA1985 800 800 847 884 908 908 918 918
9–142000 761 795 870 888 925 939 1013 1013
AS1985 708 725 731 756 791 808 827 855
142000 768 768 788 813 813 813 888 888
EAPA1985 657 674 784 797 863 901 875 875
9–102000 676 711 817 821 821 830 867 867
SWA1985 675 675 793 884 884 972 972 972
3-52000 630 630 734 734 734 900 900 900
LAC1985 726 730 748 758 790 790 922 922
13–182000 786 786 796 796 800 800 945 945
NAWE1985 813 813 859 859 867 860 893 915
13–172000 770 770 808 808 840 840 900 900
CEE1985 617 631 666 709 761 785 825 825
102000 561 587 627 645 729 782 818 853
GlobalMedians
1985 708 717 761 803 828 840 888 89371–88
2000 741 743 784 798 809 813 900 900Note: Figures in bold italic indicate an increase in intended instructional time over the 1985-2000 period. Key to UNESCO-EFA Regions—SSA: Sub-Saharan Africa; AS: Arab States; EAPA: East Asia and the Pacific; SWA: South and West Asia; LAC: Latin America and Caribbean; NAWE: North America and Western Europe; CEE: Central and Eastern Europe.* Cited from UNESCO website; Instructional time tables by Benavot (2004)

14
Opp
ortu
nity
to L
earn
: A h
igh
impa
ct st
rate
gy fo
r im
prov
ing
educ
atio
nal o
utco
mes
in d
evel
opin
g co
untr
ies
In the context of international competitiveness, it is worth nothing that increased instructional time is a topic of debate in developed countries even though the required instructional time is considerably higher than the GMR minimum levels. In the U.S., there is concern that American students spend less time in school than their peers in other industrialized countries (PBS, 2005). The U.S. school year of 180 days is considerably less than major competitors, such as China (251 days), Japan (243 days), and Germany (240 days). In terms of instructional hours on core academic subjects, U.S. high school students spend only 1,460 hours as compared to Germany’s 3,528, France’s 3,280, and Japan’s 3,170. In this context, the challenges and requirements for developing countries hoping to become competitive are clear. At the top level of international education competition, the developed countries are devoting more than three times as much instructional time as are the developing countries. The gap in learning cannot help but to grow.
Factor 3: Teacher absenteeism and tardinessLimited research is available about the extent, causes, and impact of teacher absenteeism on student learning. While there have been a number of surveys in specific regions in developing countries, few national surveys have been undertaken to determine the full scope of the problem. Very few developing countries have sufficiently robust information systems to collect, analyze, and report on average daily attendance of teachers and students, as is the common practice in industrial countries. As with other aspects of these unmeasured indicators, the lack of definitive research is somewhat counterbalanced by the widespread recognition, particularly in rural areas, that teacher absenteeism is a serious problem. Figure 5 illustrates indicative information from country studies.
The magnitude of the problem is supported from other sources as well. In a study of primary school teacher absenteeism in six developing countries—Bangladesh, Ecuador, India, Indonesia, Peru, and Uganda—and based on physical observations, an average of 19 percent of teachers were absent on any given day (Chaudhury, et al., 2005). The figures are even more startling when examined at national levels. In India, a quarter of teachers were considered absent from school, yet only half were in fact teaching in classrooms when observations took place. Across the countries surveyed, absence rates were higher in poorer regions, and in schools with poor infrastructure and no recent school inspections. This analysis indicated that in most cases, absence is not concentrated in a few repeat offenders, but is fairly widespread—teachers present less than 50 percent of the time were documented in four of the six counties surveyed. As with any type of employment, some degree of absenteeism is natural. Normal reasons for absenteeism include family problems, health, pregnancy, or emergency leave. HIV/AIDS has become a significant factor in teacher attendance in some countries. Other causes are specific to the teaching profession or employment in cash economies, such as teacher training courses that take teachers out of classrooms without providing substitutes, assignments requiring travel, travel to collect salary, or educational leave (Rogers, et al., 2004). Teacher absenteeism is associated with a number of factors including poor, urban communities; limited monitoring and discipline by school directors; infrequent school inspections; and distance from the branch Ministry of Education office (Rogers, et al., 2004). In South Asia, head teachers attributed only 4 percent of absences to non-education-related official duties. Illness was cited no more than 15 percent of the time, even in countries such as Uganda or Zambia with high HIV/AIDS prevalence, where it would be assumed to affect teacher attendance. Unauthorized absences, leaving early, or arriving late account for between 30 and 50 percent of the reasons for absences. But in a sample of 3,000 government-run schools in India, only one teacher was reported as fired because of repeated absence (Chaudhury, et al., 2005).

15
WO
RK
ING
PAPER: O
pportunity to Learn: A high impact strategy for im
proving educational outcomes in developing countries
Figure 5. Rates of Teacher Absenteeism
Absense Rate- Teachers (%)
16%14%
14%
25%19%
15%
11%27%
17%
Bangladesh
Ecuador
Honduras
India
Indonesia
Papua New Guinea
Peru
Uganda (PETS II)
Zambia
Source: PETS surveys
Absenteeism rates at this level will clearly affect both the quality of learning, the motivation of students, and continuity of instruction. These levels, while shocking, probably understate the problem in several ways. First, the problem will be more emphatic in rural areas, isolated schools, and poor areas—the sub-national variation is likely to be considerable. Second, these numbers do not always include tardiness. Assuming a linear relationship between time and learning, the direct impact of teacher absenteeism to reduce potential student learning could range from 14–25 percent.
Neither teacher absenteeism nor tardiness is regularly monitored and reported in most school systems and neither forms part of the school management regime—this issue seldom informs policy decisions at the national level. Strategies for addressing absenteeism are varied, but must start by identifying the issue as a critical management concern. In Nicaragua, parental involvement and administrative autonomy positively influenced teacher attendance, especially in poor, rural areas (King & Ozler, 2001). Similarly, a national survey of teacher absence in Uganda showed that increased monitoring by district officials and proximity of a district education office positively influence teacher attendance (Habyarimana, 2004). Teachers with additional training after their pre-service programs, as well as teachers working in urban schools, are less likely to be absent. Furthermore, lower student-teacher ratios are also associated with lower teacher absence rates.
Factor 4: Student absenteeism and tardinessConsiderable statistical evidence exists about the great growth in student enrollment in the past decades. Unfortunately, students don’t learn as a result of enrolling, they learn as a result of attending school on a regular basis. At this most basic level of the education production function, most education systems in developing countries neither collect nor analyze attendance data on a consistent basis. In the absence of reliable data on daily student attendance, there is little definitive information. However, periodic studies and anecdotal observations in many countries through random school visits show that registered students are frequently not in school.
A study in Bangladesh found that schools had no policies in place to address student absenteeism. Student attendance was sporadic; observed classes found that student attendance ranged from 43 to 67 percent (BEPS, 2004). Interviews with teachers indicated that only about half of the children regularly attended classes; 20 percent had excessive absences and another 30 percent were absent frequently enough to cause teachers concern. During the study period, half of the students were

16
Opp
ortu
nity
to L
earn
: A h
igh
impa
ct st
rate
gy fo
r im
prov
ing
educ
atio
nal o
utco
mes
in d
evel
opin
g co
untr
ies
absent, half were tardy, and over 40 percent left early at least one day in the previous week. Tutors were engaged by almost half of the students to help them outside of school.
Studies have indicated a clear and mutually reinforcing relationship between attendance, school achievement, and promotion. In rural Honduras, a study on the relationship of school attendance and student achievement found that achievement gains influenced the demand for primary schooling and increased student attendance. “An increase in the average score by five points increases school attendance by three to seven days, or between 2 and 5 percent” (Bedi & Marshall, 1999). The strongest factors associated with gains in academic achievement in this case were student-teacher ratios, preschool programs, and teacher quality.
The available evidence supports the commonsense expectation that children who attend school regularly are more successful in school, and are more likely to be promoted. A project evaluation study in Guatemala found that children who were promoted from grade 1 to 2 had a significantly higher attendance and punctuality record than those that did not pass (Chesterfield, 2005). Children who had to repeat first grade were present only about two-thirds of the time, whereas promoted children were present over 80 percent of the time when classes were held (Table 2). A noticeable gender difference was also found in this study; girls had consistently poorer rates of attendance and punctuality than boys.
The study in Guatemala found that punctuality was the single most important variable explaining student promotion for first time students. This is not surprising, as students who arrive on time are able to follow explicit instructions provided by the teacher at the start of classes, whereas those who are late will have difficulty following the class assignments. The impact of punctuality on promotion is also clear. Punctual students were seven times more likely to be promoted than children who were tardy.
Table 2: Promotion by Participation Record and Gender
Participation Record Overall Girls Boys
AttendancePromoted .81** .78** .84**
Not Promoted .67 .66 .68
PunctualityPromoted .80** .78** .83**
Not Promoted .67 .66 .69t-test +significant at p £ .1; *significant at p £ .05; **significant at p £ .01
Source: Chesterfield, 2005
As with teacher absenteeism, strategies for addressing student attendance must start with using attendance as a management tool, and in understanding the underlying causes of absenteeism. To some degree, there is a circular influence with other OTL factors—if the teacher does not regularly show up, little learning is taking place; and if the class size is unmanageable, students may not be motivated to attend. Older students who are falling farther behind because they cannot read well are also likely to be absent. Physical and sexual security, the need for child labor at home, and other opportunity costs may also be factors. Strategies for addressing absenteeism can include scholarships, food programs, school-parent activism to assure attendance, and systems of accountability (AED, 2006).
Factor 5: Appropriate class size and student-teacher ratiosA good deal of research and controversy has surrounded the question of ideal class size over the past 40 years. Many of the most rigorous studies have been based in the U.S. The first meta-

17
WO
RK
ING
PAPER: O
pportunity to Learn: A high impact strategy for im
proving educational outcomes in developing countries
analysis of class-size literature by Glass, Cahen, and Smith in 1978 indicated that students scored approximately 10 percentile ranks better on standardized tests in a class of 20 rather than 40, and that the “greatest gains in achievement occurred among students who were taught in classes of 15 students or less” (HEROS, 2003). Currently, evidence suggests that reduced class size does improve student achievement, especially in the early grades when measured against performance on standardized tests, and particularly for minority or disadvantaged students.
The fine distinctions of whether classes should have 15 or 20 students are largely irrelevant in the developing world. Class sizes of 80, 100, or even 200 have been found in countries after universal primary education (UPE) policies were implemented. Whereas student-teacher ratios at regional levels show averages of 43 in Sub-Saharan Africa, 21 in Latin America and the Caribbean, and 38 in South Asia, the sub-national variation is significant (UNESCO, 2006). As an example, the sub-national maps of class size and pupil-teacher ratio in Uganda (see Annex) clearly illustrate the range found within a given country.
Class size has been repeatedly shown to have an important influence on student achievement. As is the case in developed countries, class size studies in developing countries have shown that reduced student-teacher ratios improve achievement in the cases of South Africa, Israel, and Bolivia (Case & Deaton, 1998; Angrist & Lavy, 1999; Lavy, 1999; Urquiola, 2001). A large scale statistical analysis using school level data in Uganda from over 2,000 schools indicated that completion drops off sharply when the student-teacher ratio exceeds 50:1 (Moses, 2005). There is also some evidence that lower student-teacher ratios improve teacher performance and satisfaction. “Having fewer children in class reduces the distractions in the room and gives the teacher more time to devote to each child (Mosteller, 1995).”
The ideal student-teacher ratio remains open for debate. There is not a “perfect” class size; the dynamics of multi-grade classrooms, skill level of the teacher, cultural norms, and other factors may well impact the effectiveness of classroom instruction. The Fast Track Initiative (FTI) indicative framework, based on substantial research, establishes a target of 40 students per teacher as a useful benchmark. In the absence of a more definitive measure, the FTI proposed target seems a reasonable goal.
Factor 6: Learning materials are available to every student and regularly usedLearning materials incorporate a broad category of education-related resources that includes textbooks, instructional guides, workbooks, practice exercises, activities, tests, audio-visual materials, and supplementary readers in libraries, classrooms, or homes. Of these, textbooks are the most commonly utilized, studied, and documented input for classroom instruction.
Textbooks are recognized as a critical component of instruction; textbooks support the curriculum and relate directly to the syllabus of the course. During the 1970s and 1980s, school effectiveness studies highlighted the positive impact that relevant, good-quality, affordable textbooks had on achievement (Abadzi, 2006). The EFA 2005 Global Monitoring Report describes textbooks as an “enabling input,” an important resource that is intrinsically interrelated to the teaching and learning processes. Particularly in developing countries, evidence suggests that school effectiveness is linked to direct material inputs such as textbooks, and that textbooks are one of the most cost-effective means of positively impacting quality in poor resource environments (Crossley & Murby, 1994). As early as 1978, the World Bank issued a staff working paper examining the relationship between textbooks and achievement in developing countries. Based on a review of the evidence, “the availability of books appears to be the most consistent school factor in predicting academic
18
Opp
ortu
nity
to L
earn
: A h
igh
impa
ct st
rate
gy fo
r im
prov
ing
educ
atio
nal o
utco
mes
in d
evel
opin
g co
untr
ies
achievement”, although the authors caution that the impact was not uniform across schools or countries (Heyneman, et al., 1978).
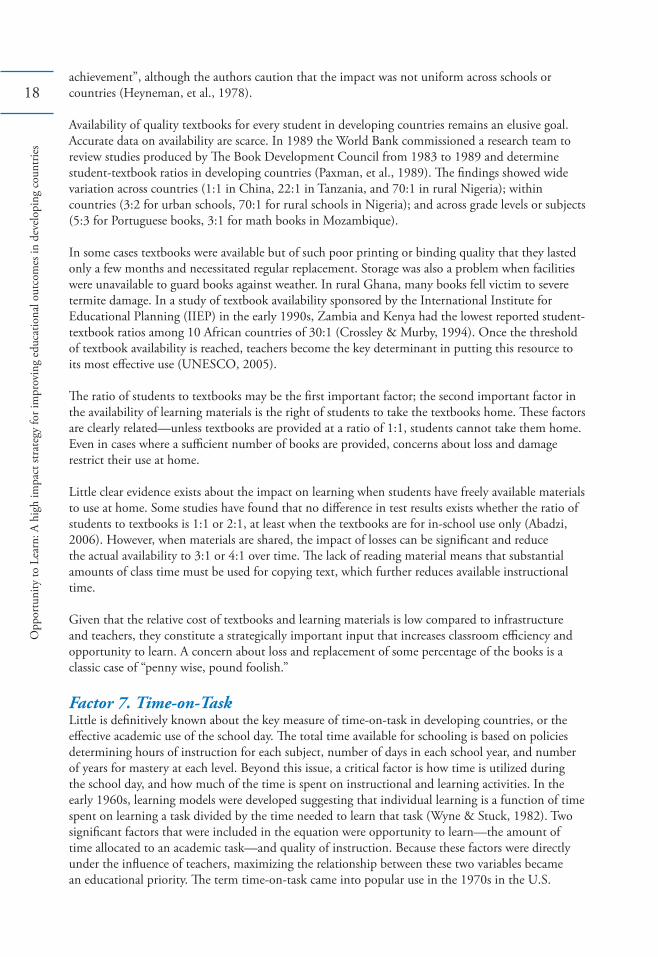
Availability of quality textbooks for every student in developing countries remains an elusive goal. Accurate data on availability are scarce. In 1989 the World Bank commissioned a research team to review studies produced by The Book Development Council from 1983 to 1989 and determine student-textbook ratios in developing countries (Paxman, et al., 1989). The findings showed wide variation across countries (1:1 in China, 22:1 in Tanzania, and 70:1 in rural Nigeria); within countries (3:2 for urban schools, 70:1 for rural schools in Nigeria); and across grade levels or subjects (5:3 for Portuguese books, 3:1 for math books in Mozambique).
In some cases textbooks were available but of such poor printing or binding quality that they lasted only a few months and necessitated regular replacement. Storage was also a problem when facilities were unavailable to guard books against weather. In rural Ghana, many books fell victim to severe termite damage. In a study of textbook availability sponsored by the International Institute for Educational Planning (IIEP) in the early 1990s, Zambia and Kenya had the lowest reported student-textbook ratios among 10 African countries of 30:1 (Crossley & Murby, 1994). Once the threshold of textbook availability is reached, teachers become the key determinant in putting this resource to its most effective use (UNESCO, 2005).
The ratio of students to textbooks may be the first important factor; the second important factor in the availability of learning materials is the right of students to take the textbooks home. These factors are clearly related—unless textbooks are provided at a ratio of 1:1, students cannot take them home. Even in cases where a sufficient number of books are provided, concerns about loss and damage restrict their use at home.
Little clear evidence exists about the impact on learning when students have freely available materials to use at home. Some studies have found that no difference in test results exists whether the ratio of students to textbooks is 1:1 or 2:1, at least when the textbooks are for in-school use only (Abadzi, 2006). However, when materials are shared, the impact of losses can be significant and reduce the actual availability to 3:1 or 4:1 over time. The lack of reading material means that substantial amounts of class time must be used for copying text, which further reduces available instructional time.
Given that the relative cost of textbooks and learning materials is low compared to infrastructure and teachers, they constitute a strategically important input that increases classroom efficiency and opportunity to learn. A concern about loss and replacement of some percentage of the books is a classic case of “penny wise, pound foolish.”
Factor 7. Time-on-TaskLittle is definitively known about the key measure of time-on-task in developing countries, or the effective academic use of the school day. The total time available for schooling is based on policies determining hours of instruction for each subject, number of days in each school year, and number of years for mastery at each level. Beyond this issue, a critical factor is how time is utilized during the school day, and how much of the time is spent on instructional and learning activities. In the early 1960s, learning models were developed suggesting that individual learning is a function of time spent on learning a task divided by the time needed to learn that task (Wyne & Stuck, 1982). Two significant factors that were included in the equation were opportunity to learn—the amount of time allocated to an academic task—and quality of instruction. Because these factors were directly under the influence of teachers, maximizing the relationship between these two variables became an educational priority. The term time-on-task came into popular use in the 1970s in the U.S.

19
WO
RK
ING
PAPER: O
pportunity to Learn: A high impact strategy for im
proving educational outcomes in developing countries
and refers to the amount of time that students are actively engaged in learning and therefore the intersection of the quantity and quality of classroom time.
While the idea of time-on-task seems fairly straightforward, the underlying elements are complex and difficult to measure. In 1990, David Berliner sought to explain the multi-faceted nature of instructional time by identifying nine elements, including:
• Allocated (scheduled) time: the overall and subject instructional times allotted by the state.• Engaged time: time in which students are paying attention to materials with instructional goals. • Time-on-task: a subset of engaged time, this measure captures student engagement only on a
specific learning task, rather than general engagement that may not be related to the assignment. • Academic learning time: a more complex measure of successful use of time-on-task for learning. • Transition time and waiting time: two measures of non-instructional use of the allocated time. • Aptitude and perseverance: measurements of student ability and willingness to engage in the
academic task can also be measured as part of instructional time concepts. • Pace: a measure of the instructional mix of content and time, and of the tradeoffs of breadth and
depth.
In a comparison of instructional time in the U.S., where the average length of a school day is 6 hours and 35 minutes, teachers reported an average of 14 different activities during the school day. Of these activities, only 64 percent were related to academics, the remainder being used in maintenance, enrichment, and recess (Massachusetts 2020). Therefore, the initial measure of allocated time shows a relatively low emphasis on academic learning. Even this is likely to be an overestimate since studies consistently show that allocated time invariably overstates the actual time teachers devote to academic subjects. The situation in developing countries may be even more complex where an overcrowded curriculum and short school days can combine to have minimal time available for any given subject.
Beyond the measure of allocated time, the effort to measure effective instructional time begins with determining how much time the teacher actually spends engaged in the classroom, taking out the non-instructional transition and waiting times. In the worst cases, school observation visits found teachers spending class time smoking, chatting, reading a newspaper, or engaging in other non-instructional activities. Even when teachers are focused on the students, considerable time can be devoted to generic classroom management, transition between activities, preparation, and other non-instructional tasks. The more complex measures of time-on-task and academic learning time get at the core issues of whether the instruction is effective in engaging the students’ attention on specific areas, and whether the students are successful. Large scale measures of student attention, much less learning, over the course of a day are largely unavailable for developing countries, because of the extremely labor intensive and costly nature of such studies. Comparisons between actively engaged students and those less engaged, or engaged less frequently, indicate not only a quantitative but also a qualitative difference in learning gains, motivation, self-confidence, interest, and attitude toward learning. The level of engagement is determined by a number of factors including the quality of instruction from the teacher and cognitive abilities of the students. “Students cannot actively engage in the learning if the instruction is poor and/or they are unable to comprehend what is being taught and what they are to do” (Bloom, p.340, 1980).
In a study based on classroom observations recording degree of involvement, low achievers spent less time during each class “on task” than high achievers, leading to an aggregate loss of time dedicated to academic activities. This suggests that over time, low achieving students fall further and further behind, which is corroborated by longitudinal studies of student performance on standardized

20
Opp
ortu
nity
to L
earn
: A h
igh
impa
ct st
rate
gy fo
r im
prov
ing
educ
atio
nal o
utco
mes
in d
evel
opin
g co
untr
ies
exams (Good & Beckerman, 1978; Bloom, 1980; Stallings, 1980). Low achieving junior high students were engaged in academic activities 40 percent of the time compared with 85 percent for high-achieving students (Stallings, 1980).
The limited number of studies measuring time-on-task in developing countries have indicated that only 63 percent of class time, on average, was used in teaching activities, and 83 percent of that time was predominately lecture-based rather than interactive (Abadzi, 2006). These average numbers are considerably lower for low-performing schools.
Addressing the time on task issue is substantively different and more challenging than the other issues discussed. While many of the other challenges can be tackled with management tools at the school and community level, improving the effective use of instructional time requires a different set of interventions that center on teacher quality, curriculum, and materials. Options for addressing improved time-on-task have included programmed learning, teacher training, classroom management, and even highly scripted requirements. A critical place to start is improving means of measuring and tracking time-on–task in order to better understand the current status.
Factor 8. Learning to ReadThe ability to read is a foundation skill for all subsequent learning in school. Students whose reading skills are weak will fall farther and farther behind as they move through primary and lower secondary school. The international data on learning achievement—and even on the most basic measure of reading—is quite weak. A recent publication uses household survey data to demonstrate that in many countries students are failing to master even fundamental reading skills (EPDC, 2005).
The relationship between early reading skills and academic survival and success is well established. Equally importantly, the relationship between the failure to learn to read, and falling farther behind each year is also well documented. The gap between readers and non-readers is not addressed in later years; it continues to grow. Recent work has moved this research forward with insights from neurological science as to how reading skills can be developed (Crouch, et. al, 2005; Abadzi, 2006). The keys to early reading appear to be a simplified and highly focused curriculum in the early grades, and an emphasis on developing reading and study skills. Abadzi’s work indicates that schools can target a verbal reading level of 60 words per minute to develop the basic brain functions needed for comprehension and learning.
This factor is also substantively different than the first six OTL elements, because achievement of early learning requires a curricular focus on a small number of objectives, effective pedagogy, good materials, and time. Assuring that the initial factors are in place is an essential, but not sufficient condition to have time to devote to reading instruction and acquisition. Programs with a specific focus on early literacy and reading, such as the National Literacy Strategy in the U.K., Breakthrough to Literacy in Ghana and the reading program in Namibia emphasize having appropriate available materials and specified amounts of reading time each day. In light of the documented problems in many systems with large numbers of children with poor reading skills, the lessons of these reading-emphasis programs are particularly noteworthy. With sufficient emphasis and time, foundational reading skills can be achieved for many students in a relatively short period.
It is worth emphasizing that reading and literacy are complex skills and concepts. The teaching and assessment of literacy do not lend themselves to simple answers. However, the first step is to recognize the critical importance of early reading, and to concentrate curriculum, time, and pedagogy on seeking to achieve this goal.

21
WO
RK
ING
PAPER: O
pportunity to Learn: A high impact strategy for im
proving educational outcomes in developing countries
The Opportunity to Learn DeficitAggregating the OTL factors into a measure of basic system effectiveness is complex and region- and context-specific. Clearly, the existing data is scattered and insufficient to draw global conclusions about the extent to which these factors influence learning. Moreover, the situations are very specific to countries and even sub-regions of countries –the total effective instructional time in rural areas may be very different than in urban schools, and for different reasons. However, the potential for substantial inefficiencies in the educational process is clearly significant. An illustrative analysis of cumulative loss of time-on-task demonstrates the potential loss to instructional time faced by students in developing countries (see Figure 4).
Figure 6. Cumulative Loss of Time-on-Task
These calculations of the overall loss of efficiency are, at best, rough estimates of the general order of magnitude. They do not include the inefficiencies imposed by excessive class size or inadequate reading skills. The estimate is conservative on every measure, but still results in students having only 15-20 percent of the desirable instructional time. This calculation is consistent with estimates of other analyses (Abadzi, 2006). If these estimates are remotely close to reality, the cumulative inefficiency of education systems indicates a large opportunity for improvement by addressing relatively straightforward management and input issues.
The Relationship of OTL and Learning OutcomesThe amount and rigor of substantive research on OTL and other effective instructional time measures is currently limited, with the recent World Bank study as the most comprehensive currently available (Abadzi, 2007). An EQUIP2 study on school effectiveness in Haiti (DeStefano & Miksic, 2007) included a modified form of an OTL index to assess the relationship to learning outcomes. Two OTL data points were incorporated into their study: the number of days schools were open and student attendance. Of the 54 schools examined, they found that schools were open only 73 percent of the time and students attended only 77 percent of the time. The average showed that these schools provided only 57 percent of the possible opportunity to learn; consequently, these schools could only be expected to accomplish around 50 percent, at best, of what could possibly be covered in a given school year.

22
Opp
ortu
nity
to L
earn
: A h
igh
impa
ct st
rate
gy fo
r im
prov
ing
educ
atio
nal o
utco
mes
in d
evel
opin
g co
untr
ies
Table 3: Opportunity to Learn, September 2005–January 2007
% Days School Is in Session
Attendance Rate
OTL Index
Community Schools 71% 75% 54%Private Schools 75% 78% 59%
National Schools 73% 84% 62%Overall 73% 77% 57%
In addition to these two data points, a modified version of the Early Grade Reading Assessment tool was used to correlate learning and opportunity to learn (Crouch et al, 2005). Given tests in their native and instructional language of Haitian Creole, students were evaluated on their ability to recognize individual letters, identify words in isolation, and read short sections of text. The established threshold associated with reading comprehension is 60 words per minute, but reading at least 30 words per minute indicates a preliminary benchmark that students have learned to recognize and decode some words. In this case, the majority—86 percent—of students tested read well below the established threshold of 60 words per minute; almost 60 percent could not read 30 words per minute.
Table 4: Reading Fluency Thresholds
Number of 3rd Grade Students Tested
Percentage of Students Reading X wpm
From 0 to 30 wpm 95 59%From 31 to 60 wpm 44 27%
Over 60 wpm 22 14%Total 161 100%
According to this analysis, the combination of school days lost and low average student attendance accounted for 55 percent of the variance in student performance. Results were further disaggregated to demonstrate regional variation: top performing schools provided a 26 percent greater opportunity to learn than the lowest performing schools. These results highlight the strong relationship between OTL measures and learning.
Strategies for Achieving OTLIt is worth emphasizing that much of the efficiency loss in OTL can be addressed through relatively straightforward efforts to prioritize management attention to these fundamental issues. This is not to say that they are easy to address—as discussed, there are fundamental underlying causes of teacher absenteeism, student absenteeism, school closings, and effective time-on-task, among others. However, the biggest immediate obstacle is that the issues are not currently being systematically addressed.
The most significant finding, in some ways, was the lack of available data for any of these issues that are so central to the efficiency of the education system. The simple fact is that in most countries no one can answer the most basic questions: How many days are the schools open? How many days do teachers miss each year? What is the average student attendance? Are learning materials available for every class? How many actual hours of instruction in reading and basic academic subjects are received? Are students learning to read? How much classroom time is allocated for learning? Do teachers use the time efficiently? The answers to these basic questions are unknown because they

23
WO
RK
ING
PAPER: O
pportunity to Learn: A high impact strategy for im
proving educational outcomes in developing countries
are not being asked. They are not measured; they are not tracked. No one is held accountable for a failure to provide the basic opportunity to learn. One of the fundamental precepts of evaluation and management is that managers pay attention to what is tracked and reported. Since none of these elements is regularly tracked or reported, it is not surprising that managers do not focus on improving them.
Few if any donor programs have focused on these issues as a priority area. The Fundamental Quality Level (FQL) approach used in a number of African countries, such as Benin and Guinea, established general standards for provision of school inputs, but did not specifically address the management aspects of time-on-task. Two recent studies of the patterns of donor investment (World Bank, 2006; Chapman & Jester Quijada, In Press) identified the priority strategies used in major donor education projects over the past 15 years. While some aspects of the OTL issues may have been included under general rubrics such as “improved management”, teacher salaries and incentives, teacher deployment to underserved regions, and community participation, none of the documentation indicated that the core OTL issues were a priority. None of the projects included cumulative time-on-task as either a priority policy or operational issue. The cumulative investment for USAID alone over this 15 year period was over $2 billion, with the primary focus on curriculum reform, materials development, teacher training, information systems, and policy. From the prism of this OTL analysis, it could be argued that over 80 percent of this investment was severely undermined by the failure to address the most foundational elements of education systems.
If OTL factors are being targeted and measured through school and community management, significant improvements are possible. It is important to recognize that problems such as teacher and student attendance that look insolvable at the national level can be reasonably managed at the school level, where human interaction is possible. The use of community and school information systems, such as school self assessment in Namibia (Gillies, 2004) and school report cards in Central America (AED, 2006) have mobilized the school community to identify and address basic issues such as teacher and student attendance and punctuality. Parent volunteers implementing school report cards reported each day on the school hours and teacher attendance. Volunteers at a local level identified the individual children with attendance problems and addressed them at the family level. In Namibia, school management committees diagnosed basic problems and set targets in the school improvement plan. Teachers in Namibia completed self assessments to identify their ability to use time effectively.
Some national systems have begun to track and report on many of the OTL factors. In El Salvador, a set of school planning and assessment tools, “la ruta que tomamos,” includes explicit measures of student and teacher attendance, materials, and student learning of basic skills. These data are directly incorporated into school improvement planning.
The key finding of this paper is not that there are simple answers to the complex challenge of addressing time-on-task, absenteeism, or other issues. It is that these issues need to be recognized as critical constraints to learning outcomes and education system improvement. These OTL factors need to be given priority in terms of donor and country management systems, and then tracked as key system indicators. An important starting point will be the systematic inclusion of tracking systems and management tools in USAID projects, and the use of OTL indicators to inform decision making and analysis by ministries and donors in program and policy design.
There are three general strategies for addressing OTL issues in partner countries: 1) incorporate OTL issues and awareness in activities and assistance programs such as teacher and principal training, 2) incorporate OTL measures in management and information systems at the school level, and 3) raise awareness by tracking an OTL Index (ideally on a sub-national basis). This strategy

24
Opp
ortu
nity
to L
earn
: A h
igh
impa
ct st
rate
gy fo
r im
prov
ing
educ
atio
nal o
utco
mes
in d
evel
opin
g co
untr
ies
involves developing explicit management tools and models that can be integrated into the regular professional development programs in the country and could include teacher training, principal training, supervisor training, and engagement of parents and community school boards.
Table 5: Illustrative OTL Index—Primary School
Factor Target Rating High Rating Medium Rating LowOfficial
instructional time950 hours 950+ 850-950 Below 850
Schools open 100% of official 90%+ 80 -90% Below 80Teacher
attendance and punctuality
90% of instructional hours
90-100% 80-90 Below 80
Student attendance and
punctuality
Avg Daily on-time Attendance 95%
90%+ 75-89% Below 75%
Pupil–Teacher Ratio
40 30-40 40-49 50+
Learning materials 1:1, available and used, all year
Material for each student that they can take home
Materials generally available
Materials late, not available to all students, not used
Reading score Country target: words per minute
Language specific Language specific
Language specific
Time on Task 80% on academic purposes
70% + 60-70% Below 60%
Score 5 3 1
The EQUIP2 project is currently expanding on the Haiti work described above to develop and pilot a methodology and instruments for measuring and tracking a comprehensive OTL index in a form that is not simply a data collection activity but rather is intended to directly inform programmatic and school management decisions. This work will be piloted in a number of countries in 2008. Determination will be made as to whether rubrics, such as that shown in Table 5, or an index is most useful. Ultimately, the intent is to have an index of effective instructional time.

25
WO
RK
ING
PAPER: O
pportunity to Learn: A high impact strategy for im
proving educational outcomes in developing countries
ReferencesAbadzi, H. 2006. Efficient Learning for the Poor: Insights from the Frontier of Cognitive Neuroscience. Washington, D.C.: The World Bank.
Academy for Educational Development. 2006. The CERCA Report Card: Communities Creating Educational Quality, Final Report. Washington, D.C.: AED and USAID.
Alexander, R. 2000. Culture and Pedagogy. Malden, MA: Blackwell Publishing.
Angrist, J.D. and V. Lavy. 1999. “Using Maimonides’ Rule to Estimate the Effect of Class Size on Scholastic Achievement.” Quarterly Journal of Economics, vol. 114 (2): 533–575.
Bedi, A., and Marshall, J.H. 1999. “School Attendance and Student Achievement: Evidence from Rural Honduras.” Economic Development and Cultural Change, vol. 47 (3): 657–682.
Benavot, A. 2004. Instructional Time Tables. Paris, France: UNESCO.
Benavot, A and Massimo Amadio. 2004. A Global Study of Intended Instructional Time and Official School Curricula, 1980-2000. Background paper commissioned by the International Bureau of Education for the UNESCO-EFA Global Monitoring Report (2005).
Berliner, David C. 1990. “What’s all the fuss about instructional time?” Chapter from, The Nature of Time in Schools, Theoretical Concepts and Practicioner Perceptions. New York, NY: Teacher’s College Press.
BEPS. 2004. Time to Learn: Teachers’ and Students’ Use of Time in Government Primary Schools in Bangladesh. Washington, D.C.: USAID.
Bloom, Benjamin. 1980. All Our Children Are Learning. New York City, NY: McGraw-Hill.
Case, A. and A. Deaton. 1998. School Quality and Educational Outcomes in South Africa. Princeton, NJ: Research Program in Development Studies, Princeton University.
Chapman, David and Jessica Jester Quijada. In-press. An Analysis of USAID Assistance to Basic Education in the Developing World, 1990-2005. Washington, D.C.: EQUIP2, FHI 360, and USAID.
Chaudhury, N., J. Hammer, M. Kremer, K. Muralidharan, and F. H. Rogers. Draft 2005. Missing in Action: Teacher and Health Worker Absence in Developing Countries. Washington, D.C.: The World Bank.
Chesterfield, Ray. 2005. School Success Amid Hardship: First Grade Completion in Rural Guatemala. Washington, D.C.: USAID/Guatemala and the MEDIR project.
Craig, H. 1998. “Teacher Supply, Training and Professional Development.” Executive summary from Teacher Development: Making an Impact. Washington, D.C.: The World Bank.
Crossley, M., Murby, M. (1994). Textbook Provision and the Quality of the School Curriculum in Developing Countries: Issues and Policy Options. Comparative Education, Vol.30, No.2, pp.99-114.

26
Opp
ortu
nity
to L
earn
: A h
igh
impa
ct st
rate
gy fo
r im
prov
ing
educ
atio
nal o
utco
mes
in d
evel
opin
g co
untr
ies
Crouch, L, H. Abadzi, M. Echegaray, C. Pasco, and J. Sampe. 2005. “Monitoring Basic Skills Acquisition through rapid Learning Assessments: A Case Study from Peru.” UNESCO Prospects, June 2005, vol. 35 (2).
DeStefano, Joseph and Emily Miksic. 2007. School Effectiveness in Maïssade, Haiti. Washington, D.C.: EQUIP2, FHI 360, and USAID.
DeStefano, J., A. Schuh Moore, A. Hartwell, and D. Balwanz. 2006. Reaching the Underserved through Complementary Models of Effective Schooling. Washington, D.C.: EQUIP2, FHI 360, and USAID.
Education Policy and Data Center (EPDC). 2005. Educating the World’s Children: Patterns of Growth and Inequality. Washington, D.C.: FHI 360 and USAID.
Gillies, John. 2004. Strengthening Accountability and Participation: School Self-Assessment in Namibia. Washington, D.C.: EQUIP2, FHI 360, and USAID.
Good, T.L. & T.M. Beckerman. 1978. “Time on Task: A Naturalistic Study in Sixth-Grade Classrooms.” The Elementary School Journal, vol. 78 (3): 192–201.
Heyneman, S.P., J.P. Farrell, and M.A. Sepulveda-Stuardo. 1978. Textbooks and Achievement: What We Know (Staff Working Paper No. 298). Washington, D.C.: World Bank Database.
Hoong, A.W. Draft 2006. Development of Sustainable System for Provision of Textbooks in Primary Education: Singapore’s experience.
Habyarimana, J. Draft 2004. Measuring and Understanding Teacher Absence in Uganda. Boston, MA: Harvard University.
King, E.M., and Berk Ozler. 2001. What’s Decentralization Got to do with Learning? Endogenous School Quality and Student Performance in Nicaragua. Washington, D.C.: The World Bank.
Krieg, J.M. 2006. “Teacher Quality and Attrition.” Economics of Education Review, vol. 25 (1): 13–27.
Kuziemko, I. 2006. “Using Shocks to School Enrollment to Estimate the Effect of School Size on Student Achievement.” Economics of Education Review, vol. 25(1): 63–75.
Health & Education Research Operative Services, Inc. (HEROS). 2003. “Class Size Research.” Retrieved 26 Jan. 2006, http://www.heros-inc.org/classsizeresearch.htm.
Lavy, V. 1999. Using Dual Natural Quasi-Experimental Designs to Evaluate the Effect of School Hours and Class Size on Student Achievement. Jerusalem, Israel: Department of Economics, The Hebrew University of Jerusalem.
Massachusetts 2020. “Research Digest: Comparing Instructional Time.” Retrieved 25 Sep. 2006, http://www.mass2020.org/Research%20Brief4%20-%20Comparing%20Instructional%20Time.pdf.
Mereku, K. D., F.K. Amadahe, K. Etsey, J. Adu, A. Schuh Moore, W. Synder, B. Long. Opportunity to Learn: English and Mathematics in Ghanaian Primary Schools. Washington, D.C.: BECAS project

27
WO
RK
ING
PAPER: O
pportunity to Learn: A high impact strategy for im
proving educational outcomes in developing countries
and AED.
Moses, Kurt. Education in Uganda. Presented at EQUIP2 Quarterly Meeting in 2005. Washington, D.C.: USAID and EQUIP2.
Mosteller, F. 1995. “The Tennessee Study of class Size in the Early School Grades.” The Future of Children: Critical Issues for Children and Youths. vol. 5 (2): 113–127.
Norton, M. S. 1998. “Teacher Absenteeism: A Growing Dilema in Education.” Contemporary Education, vol. 69 (2): 95–99.
Nottelmann, E.D., & Hill, K.T. 1977. “Test Anxiety and Off-Task Behavior in Evaluative Situations.” Child Development, vol. 48 (1): 225–231.
Paxman, B., C. Denning, and A. Read. 1989. Analysis of Research on Textbook Availiability and Quality in Developing Countries. Washington, D.C.: The World Bank.
Public Broadcasting Service (PBS). 2005. Making Schools Work with Hedrick Smith. Executive Producer, Hedrick Smith. PBS and South Carolina Educational Television.
Rogers, F. H., J. Lopez-Calix, et al. 2004. “Teacher Absence and Incentives in Primary Education: Results from a National Teacher Tracking Survey in Ecuador.” Excerpt from Ecuador: Creating Fiscal Space for Poverty Reduction. Washington, D.C.: The World Bank.
Scheerens, J. 1999. School Effectiveness in Developed and Developing Countries: A Review of the Research Evidence. Washington, D.C.: The World Bank.
Stallings, J. 1980. “Allocated Academic Learning Time Revisited, or Beyond Time on Task.” Educational Researcher, vol. 9 (11): 11–16.
Urquiola, M. 2001. Identifying Class Size Effects in Developing Countries: Evidence from Rural Schools in Bolivia. (Policy Research Working Paper 2711). Washington, D.C.: The World Bank.
Van Graan, M., and E. Leu. 2006. “Quality in Education, Teaching, and Learning: Perceptions and Practice.” From Chapter 6 of Namibia Pilot Study of Teacher Professional Development. Washington, D.C.: EQUIP1, American Institutes for Research, USAID.
Venezia, Andrea, and Julie Maxwell-Jolly. 2007. The Unequal Opportunity to Learn in California’s Schools: Crafting Standards to Track Quality. Berkeley, CA: Policy Analysis for California Education (PACE).
Wyne, M.D. and G.B. Stuck. 1982. “Time and Learning: Implications for the Classroom Teacher.” The Elementary School Journal, vol. 83 (1): 67–75.
UNESCO. 2004. EFA: The Quality Imperative (2005 Global Monitoring Report). Paris, France: UNESCO.
Ysseldyke, J, M. Thurlow, and H. Shin. 1995. Opportunity to Learn Standards (Policy Directions No. 4). Minneapolis, MN: National Center on Educational Outcomes. USAID/Honduras website, “Educational Assistance to Honduras.” <http://www.usaid.gov/hn/education.htm>


29
WO
RK
ING
PAPER: O
pportunity to Learn and Early Grade Reading: Th e cases of Ethiopia, G
uatemala, H
onduras, Mozam
bique, and Nepal
Opportunity to Learn and Early Grade Reading: The cases of Ethiopia, Guatemala, Honduras, Mo-zambique, and Nepal
Executive SummarySchool effectiveness is a concept that is difficult to define and even more difficult to measure. To most educational planners, “effectiveness” is the measure of factors that enhance a child’s learning, irrespective of their background. While many models of school effectiveness exist, the Five-Factor model suggests that leadership, acquisition of basic skills, a secure environment, high student expectations, and frequent performance assessment are critical elements of effectiveness (Scheerens, 2000).
This study argues that improvement in school effectiveness requires schools and educators to concentrate on even more basic elements than those posited by the research. This focus should be on providing a basic opportunity to learn (OTL) by having the school open every day, teachers present, and students present and ready to learn. The educational value of that basic opportunity then depends on how teachers and students use the time available during the day, how much time is engaged in academic activities, the quality of those activities, whether materials are present and used, and whether class sizes are reasonable. The study also establishes an OTL profile based on 12 factors, including: percentage of days the school is open; teacher attendance; student attendance; percentage of days left for instruction; percentage of time on task; percentage of equivalent days left for instruction; percentage of students with textbooks; percentage of textbook use; percentage of time spent reading; grade 3 reading fluency; class size and school support. These indicators measure the extent to which OTL is optimized in a sample of schools in regions of Ethiopia, Guatemala, Honduras, Mozambique, and Nepal.
The study answers the following questions:
• How well do schools provide OTL?• How does actual OTL compare to potential OTL?• How does OTL vary across countries and schools?
MethodologyData for the study were collected through first-hand field research in Ethiopia, Guatemala, Honduras, Mozambique, and Nepal, made possible through collaboration with CARE, Save the Children USA, the Aga Khan Foundation, and each organization’s in-country offices. Samples of schools in each country were drawn from those schools in CARE, Save the Children, and Aga Khan Foundation education programs, based on stratification by school size and location. Comparison schools—those not participating in the NGO-supported programs—were also sampled, but in a very limited manner.
Field research teams visited each school for a day and collected data through the use of a series of instruments including: Concepts about Print (CAPs)1; Early Grade Reading Assessments2 (EGRA); Stallings Classroom observation protocols; school observations; and interviews with teachers and principals. The sample included 24 schools in Ethiopia, 26 in Guatemala, 33 in Honduras, 49 in 1 The instruments for Concepts about Print were adapted from instruments used by Save the Children USA and originally developed by Mary Clay2 The EGRA instruments were developed by RTI International under the USAID-funded Ed-Data II project and adapted for use in Mozambique

30
Opp
ortu
nity
to L
earn
: A h
igh
impa
ct st
rate
gy fo
r im
prov
ing
educ
atio
nal o
utco
mes
in d
evel
opin
g co
untr
ies
Mozambique, and 23 in Nepal. Data analysis included regression, ANOVA, and factor analysis, along with qualitative analysis of interviews.
ContextThe CARE, Save the Children, and Aga Khan Foundation programs in each country have been operating for a number of years and provide a variety of support to the targeted communities and schools . In Ethiopia, Guatemala, and Nepal, Save the Children focuses on giving every child the opportunity to attend school. In Honduras, CARE works to secure educational opportunities and quality schooling to children in rural areas. In Mozambique, the Aga Khan Foundation focuses on improving both access and quality at the primary level.
Students in the study were evenly split by gender in Ethiopia, Guatemala, and Honduras, and Mozambique. In Nepal, there were more boys than girls. The average age of students in the study was 10 years. In Ethiopia, however, more than 71 percent of the sample was older than 10 years, compared to 40 percent, 9 percent, and 30 percent in Guatemala, Honduras, and Nepal, respectively. In Mozambique, 89 percent of the sample was older than 8 years. Students in Guatemala, Honduras, and Nepal had higher participation rates in kindergarten (73 percent, 86 percent, and 66 percent, respectively) compared to Mozambique and Ethiopia, where 13 and 28 percent of sampled students, respectively, had attended kindergarten.
Spanish was the only language spoken in the areas visited in Honduras. Of the multi-lingual countries, Ethiopia had the most linguistically homogenous set of students, with 91 percent speaking Afan Oromo. Guatemala had the most diverse group with 34 percent speaking K’iche as their mother tongue (and also speaking Spanish at home), 30 percent speaking Mam, and 25 percent speaking Ixil. Another 11 percent of students in Guatemala spoke only Spanish. Mozambique was also diverse: 62 percent spoke Emakhuwa, 24 percent spoke KiMwani, 11 percent spoke ShiMakonde, two percent spoke multiple mother tongues, and less than one percent spoke Portuguese. In Nepal, the students spoke mainly Nepali and Tharu.
ResultsHow well do schools provide an opportunity to learn?Schools in Ethiopia, Guatemala, Honduras, Mozambique, and Nepal were open over 90 percent of the school days, and teacher and student attendance rates were reasonably high (between 78 and 97 percent). However, time loss due to late starts, early closings, and time-off-task were quite large (i.e. an average of 90 minutes lost per day) in all five countries. In terms of engaged time – or time on task in the classroom, in Guatemala, sample schools used only 72 percent of the available day for instruction because of late starts, early closings, and prolonged breaks for recess. In Guatemala, Mozambique, and Nepal, students were on task only 59, 60, and 60 percent of the time, respectively. In Honduras, students were on task 56 percent of the time, while in Ethiopia, they were on task only 41 percent of the time.
Across the five cases, when time loss due to school closings, teacher and student absence, and time-off-task were combined, schools on average used less than 50 percent of the equivalent available days for instruction. Expressed in terms of the number of days in the school year, this equivalent time equated to 69 days in Ethiopia, 56 days in Guatemala, 78 days in Honduras, 30 days in Mozambique, and 87 days in Nepal. For Nepal, the value would have been even lower if student attendance were taken into account. Ethiopia’s value would also have been lower if time use at school were taken into account.
In terms of the OTL factors related to textbook use and reading, on average, Ethiopia, Mozambique and Nepal were better at providing language textbooks for Grades 1–3 than Guatemala and

31
WO
RK
ING
PAPER: O
pportunity to Learn and Early Grade Reading: Th e cases of Ethiopia, G
uatemala, H
onduras, Mozam
bique, and Nepal
Honduras. However, students were observed using these books a very small percentage of the time. Students were also rarely observed reading in class: less than 12 percent of the time in Ethiopia, Guatemala, Mozambique, and Nepal. Oral reading fluency in all countries was low for Grade 3, but was better in Spanish in Guatemala and Honduras. The reading fluency averages for Ethiopia and Nepal of 18 and 26 words per minute (wpm), respectively, were made this low by the significant number of Grade 3 students unable to read. In Mozambique, the reading fluency results were the starkest among the five countries with approximately 60% of grade 3 students sampled not reading a single word and more than 93% reading two words or less per minute. Average class sizes were reasonable in all five countries, and schools, on average, reported receiving sufficient support visits during the year.
How does actual OTL compare with potential OTL?The official school year in Ethiopia was 203 days (812 intended instructional hours), in Guatemala was 180 days (900 intended instructional hours), in Honduras was 200 days (1050 intended instructional hours), in Mozambique was 183 days (945 intended instructional hours) and in Nepal was 192 days (1152 intended instructional hours). All five countries offered more hours of intended instruction, on average, than was found in their regions for Grades 1–3: 789 hours for Latin America and the Caribbean, 665 for South and West Asia, and 809 for sub-Saharan Africa (Benavot, 2004). In practice, more than 50 percent of the potential OTL was lost during the year.
How does OTL vary across schools?Variation in OTL across schools in all five countries was fairly extensive. The smallest amount of variation was found in three OTL factors: days schools are open, teacher absenteeism, and student absenteeism. School-level variations for these three factors ranged from 60 to 100 percent, with Ethiopia having the greatest variation in days open and Guatemala and Mozambique having the greatest variation in teacher and student attendance.
The variation in the percentage of time-on-task in all five countries was broad, but the range was widest in Ethiopia and Nepal. One school in Ethiopia averaged almost 70 percent student time-on-task during a lesson, while others were below 20 percent. In two schools in Nepal, students were on task 80 percent of the time, but one school averaged just 33 percent. Results were similar for Mozambique. The percentage of time spent on task in Honduras ranged from 34 to 75 percent. In Guatemala, the range was much smaller, with the lowest time-on-task at 47 percent and the highest at 71 percent. The countries varied in how on-task time was used in the classroom (e.g., for copying from the board, seatwork, discussion/debate). When teachers were on task, however, students were more likely to be on task.
Language Arts textbooks were readily available in most of the study’s schools for students in Grades 1–3. In Guatemala, the percentage of students with textbooks in each school varied the most (between 0 and 100 percent). While more than 90 percent of students across the study had access to language textbooks, researchers rarely observed the books being used in class. Students were rarely observed reading aloud, reading silently, or interpreting text (less than 12 percent of the time in Ethiopia, Guatemala, Mozambique and Nepal and 21 percent of the time in Honduras). In addition, none of the countries had an official curriculum for teaching reading.
This lack of reading in classrooms was reflected in students’ reading fluency scores. In Nepal, the majority of students either could not read at all (44 percent) or were able to read 41–60 wpm (26 percent). In Ethiopia, very few students read more than 40 wpm and the largest percentage (36 percent) could not read at all. Not a single Ethiopian student was able to read more than 70 wpm. In Mozambique, 59 percent of the sample was unable to read a single word in Portuguese. Approximately 33 percent of students were able to read from one to five wpm and six percent of students in the sample were able to read more than 11 wpm. Students’ reading scores in Guatemala

32
Opp
ortu
nity
to L
earn
: A h
igh
impa
ct st
rate
gy fo
r im
prov
ing
educ
atio
nal o
utco
mes
in d
evel
opin
g co
untr
ies
were more evenly distributed. Here, only 4 percent were unable to read, 8 percent read 1–20 wpm, and 46 percent could read more than 50 wpm. Students in Honduras were the strongest readers averaging 73 wpm. Over 60 percent of Honduran students sampled were able to read at least 70 wpm, and 35 percent could read above 90 wpm.
ConclusionsThe findings in Ethiopia, Guatemala, Honduras, Mozambique, and Nepal suggest that: a) a great deal of instructional time is lost; b) little, if any, reading instruction takes place in most classrooms (Honduras excepted); and (c) while textbooks exist, their effective use is suspect. Additionally, while students have fairly good knowledge of Concepts About Print, their reading fluency scores are generally below the acceptable threshold of 60 wpm, except in Honduras.
The OTL profile further revealed that the variation among schools in each country was considerable and the only OTL factor that correlated with reading scores was the combined equivalent day’s indicator. While sample sizes were small and likely impacted regression results, the researchers believe the lack of a relationship of the variables was due to the fact that little or no classroom reading instruction took place.
The researchers did find some relationships. In Guatemala and Mozambique, the language children reported speaking at home was associated to differences in reading scores. Ethiopian students working outside the home for money and repetition were correlated with higher reading scores. In Nepal, teacher attendance and the availability of textbooks were highly correlated with reading. Honduran students were observed reading more often, which was reflected in their higher reading scores.
The OTL profile and subsequent analysis from these country cases provides useful insights into the relationship between schools, instruction, and learning. Unless there is a minimum amount of instruction, specifically in reading, then educators should not expect a relationship between opportunity to learn and learning. This finding has important policy implications for those implementing programs or making education sector policy.
Policy ImplicationsTime Loss: Schools in all five countries used less than half of their potential opportunity to learn. Within classrooms, less than 12 percent of the time was spent reading. This finding suggests a need to further develop specific reading curricula that focuses on teaching reading skills and ensures that teachers are trained to teach reading. There is also a need to empower communities to monitor and supervise schools to ensure the schools are open and that teachers are present. Research has shown that community-managed programs that engaged parents ensured that schools were open and teachers and students were present. Some countries such as Guatemala and Liberia are further pilot testing ID cards and/or cell phone use to better track teacher attendance.
Textbook Availability and Use: While most students had textbooks, their use in class was limited. This lack of textbook use indicates that teachers need training to use textbooks effectively in class. The training should include pedagogically sound approaches such as activity centers that emphasize word use and structure, silent reading of story books, and peer reading.
Language arts books should also include stories and texts that allow students to practice reading. These books should engage children’s imaginations and excite them about learning to read. International development organizations and developing country governments also need to recognize the lack of children’s storybooks as a missing ingredient in promoting literacy. Learning to read will always be an uphill battle in places where the environment is devoid of interesting reading material. Where appropriate, some of the storybooks should be in children’s mother tongue.

33
WO
RK
ING
PAPER: O
pportunity to Learn and Early Grade Reading: Th e cases of Ethiopia, G
uatemala, H
onduras, Mozam
bique, and Nepal
Linking Teacher Training to Literacy Acquisition Strategies. Teacher training workshops are often held off-site and might not introduce teachers to useful pedagogical and managerial concepts. As a result, a behavior change approach to teacher improvement is needed that can identify classroom-based practices needed to engage students. Evaluation of behavior change over time needs to be conducted and tracked. Educators and communities also need to encourage an environment supportive of behavior change.
Teacher training and support should work in parallel with the provision of easels, storybooks, and other reading materials. Training should also prepare teachers to structure classrooms and class time in ways that are conducive to reading. In this lies a more complex set of investments with unclear financial trade-offs that should be carefully examined in each context.
Other policy implications from this study include investing in remedial support for students unable to read, ensuring that teachers use assessment to inform instruction, and using school support services to help teachers implement organizational and instructional changes.
While there are trade-offs and political challenges to each implication, educators must find concrete ways to ensure that students learn to read. The OTL profile can serve as a useful tool for educators to gauge how students are progressing. As an evaluative tool, the profile allows ministries of education to see school variations at the regional, district, or national levels and develop appropriate interventions. Unless there is a greater focus on instructional rather than administrative support, official visits to schools will continue to have limited impact on the opportunity to learn and learning outcomes found in schools.

34
Opp
ortu
nity
to L
earn
: A h
igh
impa
ct st
rate
gy fo
r im
prov
ing
educ
atio
nal o
utco
mes
in d
evel
opin
g co
untr
ies
IntroductionSchool effectiveness is a concept that is difficult to define and even more difficult to measure. To most educational planners, “effectiveness” is the measure of factors that enhance a child’s learning, irrespective of their background. While many models of school effectiveness exist, the Five-Factor model suggests that leadership, acquisition of basic skills, a secure environment, high student expectations, and frequent performance assessment are critical elements of effectiveness (Scheerens, 2000).
This study argues that improvement in school effectiveness requires educators to concentrate on even more basic elements than those posited by the research. Schools need to ensure opportunities to learn (OTL) for students, measured, in this study, by time spent on learning activities. Opportunity to learn begins with ensuring that school is open and that teachers and students are present. The educational value of that basic opportunity then depends on how teachers and students use the remaining available time, whether materials are present and used, and whether class sizes are reasonable.
Instructional time is a multi-faceted concept. While the importance of sufficient instructional time and its impact on student achievement is well documented in literature, the length and focus of time for improving student learning remains unclear (Berliner, 1990; Benavot and Amadio, 2004; Abadzi, 2009). How much instructional time is lost in schools? Should educators extend the school day or year? Or, should the focus be on improving the use of existing instructional time? If existing time is increased, will it impact student achievement?
This study documented the loss of effective instructional time and argues that educational interventions should focus on improving the use of existing instructional time. The study further establishes a 12-factor OTL profile to analyze the variations in school effectiveness and instructional time within samples of schools in Ethiopia, Guatemala, Honduras, Mozambique, and Nepal. The study answers the following questions:
• How well do schools provide OTL?• How does actual OTL compare to potential OTL?• How does OTL vary across countries and schools?
A literature review found no studies that had examined extended allocated instructional time in developing countries. However, studies by Stallings (1980), Berliner (1990), and Abadzi (2007) showed that the instructional time variables, including allocated time, transition time, OTL, waiting time, and academic engagement were alterable, easy to measure, and understood by teachers. Changes in these time variables are easy to make and quickly affect classroom performance, as noted by Berliner (1985). While policy analysts find greater interest in allocated time because it is easy to manipulate, it is a weak predictor of improvement in learning.
Data collected from schools in Ethiopia, Guatemala, Honduras, Mozambique, and Nepal indicated low levels of OTL and instructional time and differed greatly from these schools’ potential OTL. Data also varied considerably between schools across most OTL factors. In particular, the teaching of reading was inadequate in most schools included in this study. These findings highlight a series of issues related to school effectiveness and the optimization of OTL. The issues include ensuring that the school is open every day, teachers and students are present, and students spend more time on task.

35
WO
RK
ING
PAPER: O
pportunity to Learn and Early Grade Reading: Th e cases of Ethiopia, G
uatemala, H
onduras, Mozam
bique, and Nepal
Definition of an OTL ProfileThe concept of OTL began in the 1960s when John Carroll acknowledged that students lagging behind could master the intended content given more instructional time. The concept focuses on the time allocated to teaching, learning, and curriculum coverage and is supported throughout the literature (Bloom, 1968; Gettinger, 1984; Abadzi, 2007; Gillies and Quijada, 2008). The OTL profile begins with the premise that student learning is a function of time, effort, and effective instructional activities as outlined by Gillies and Quijada of the Educational Quality Improvement Program 2 (EQUIP2). In addition to OTL factors that impact the amount and use of classroom time, this study looked at the availability and use of materials, student ability to read fluently in the language of instruction, and the provision of support services to schools.
To construct a measureable OTL profile, this study drew Gillies and Quijada’s work, using several factors verbatim and adding and modifying others to arrive at the set of 12 OTL factors described in Table 1. A detailed discussion of and data for each factor forms the core of this study.
Table 1. Cost per Learning Outcome
Factor Measure Comment1. Percentage of days school is open
The percentage of days school is open as scheduled on the academic calendar
Accounts for time lost when schools open later or close earlier than scheduled in the school year and when schools are closed when they should be open
2. Teacher attendancea The percentage of days when school is open in which teachers are present
Uses the average attendance rate for the entire staff of a school
3. Student attendance The percentage of days when school is open in which students are present
Uses the average attendance rate for all Grade 3 students of a school
4. Percentage of school days available for instruction
The percentage of the available classroom time when teachers and students are together
Accounts for time lost due to late start or early end of the school day, recess, and other breaks
5. Percentage of student time-on-taskb
The percentage of classroom time when students participate in instruction-related activities
Uses observed percentage of time and number of students engaged in instruction-related activities
6. Equivalent percentage of days available for instruction
The percentage of equivalent days available for instruction after accounting for time lost due to school closing, teacher and student absence, daily time loss, and time-off-task
Summarizes OTL Factors 1–5
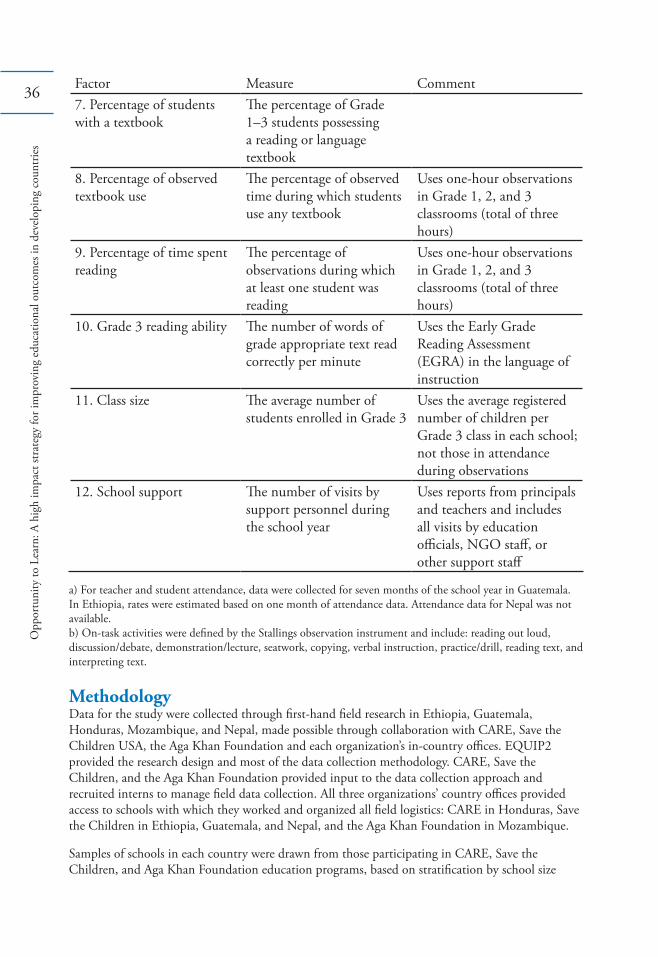
36
Opp
ortu
nity
to L
earn
: A h
igh
impa
ct st
rate
gy fo
r im
prov
ing
educ
atio
nal o
utco
mes
in d
evel
opin
g co
untr
ies
Factor Measure Comment7. Percentage of students with a textbook
The percentage of Grade 1–3 students possessing a reading or language textbook
8. Percentage of observed textbook use
The percentage of observed time during which students use any textbook
Uses one-hour observations in Grade 1, 2, and 3 classrooms (total of three hours)
9. Percentage of time spent reading
The percentage of observations during which at least one student was reading
Uses one-hour observations in Grade 1, 2, and 3 classrooms (total of three hours)
10. Grade 3 reading ability The number of words of grade appropriate text read correctly per minute
Uses the Early Grade Reading Assessment (EGRA) in the language of instruction
11. Class size The average number of students enrolled in Grade 3
Uses the average registered number of children per Grade 3 class in each school; not those in attendance during observations
12. School support The number of visits by support personnel during the school year
Uses reports from principals and teachers and includes all visits by education officials, NGO staff, or other support staff
a) For teacher and student attendance, data were collected for seven months of the school year in Guatemala. In Ethiopia, rates were estimated based on one month of attendance data. Attendance data for Nepal was not available.b) On-task activities were defined by the Stallings observation instrument and include: reading out loud, discussion/debate, demonstration/lecture, seatwork, copying, verbal instruction, practice/drill, reading text, and interpreting text.
MethodologyData for the study were collected through first-hand field research in Ethiopia, Guatemala, Honduras, Mozambique, and Nepal, made possible through collaboration with CARE, Save the Children USA, the Aga Khan Foundation and each organization’s in-country offices. EQUIP2 provided the research design and most of the data collection methodology. CARE, Save the Children, and the Aga Khan Foundation provided input to the data collection approach and recruited interns to manage field data collection. All three organizations’ country offices provided access to schools with which they worked and organized all field logistics: CARE in Honduras, Save the Children in Ethiopia, Guatemala, and Nepal, and the Aga Khan Foundation in Mozambique.
Samples of schools in each country were drawn from those participating in CARE, Save the Children, and Aga Khan Foundation education programs, based on stratification by school size

37
WO
RK
ING
PAPER: O
pportunity to Learn and Early Grade Reading: Th e cases of Ethiopia, G
uatemala, H
onduras, Mozam
bique, and Nepal
and location. Comparison schools—those not participating in the NGO-supported programs—were also sampled. Field teams then visited each school and conducted interviews with the school director and teachers in Grades 1–3. One-hour observations using the Stallings methodology were conducted in Grade 1, 2, and 3 classrooms. A random sample of Grade 3 students were interviewed, given a 10-item assessment based on Concepts About Print (a pre-literacy evaluation of familiarity with printed materials developed by Marie Clay), and completed a battery of Early Grade Reading Assessment tools including letter recognition, word recognition, and reading text.
ContextThe five field studies included in this research were conducted in collaboration with CARE in Honduras, Save the Children in Ethiopia, Guatemala, and Nepal, and the Aga Khan Foundation in Mozambique. The Save the Children, CARE, and Aga Khan Foundation programs defined the context in which the schools in the study operated. The programs in each country had been operating for a number of years and each provided a variety of supports to the targeted communities and schools. In Ethiopia, Guatemala, and Nepal, Save the Children focuses on giving every child the opportunity to attend school. In Honduras, CARE works to secure educational opportunities and quality schooling to children in rural areas. In Mozambique, the Aga Khan Foundation focuses on improving both access and quality at the primary level.
The study drew samples of 24 schools in Ethiopia, 26 in Guatemala, 33 in Honduras, 49 in Mozambique, and 23 in Nepal. The Ethiopia sample included 15 community schools and 9 government schools, of which 6 received no support from Save the Children. In Guatemala, the sample included 20 Save the Children-supported schools and 6 comparison schools. The Honduras sample included 27 CARE-supported schools (3 in peri-urban areas and 24 in rural districts) and 6 comparison schools. In Mozambique, the sample originally included 60 schools across 5 districts, but consistent school closures prevented the team from gathering data in 11 schools. Of the 49 schools sampled in Mozambique, 5 were comparison schools. In Nepal, of the 23 schools in the sample, 7 were comparison schools.
Table 2 summarizes information about the students included in the study. Students in the study were evenly split by gender in Ethiopia, Guatemala, and Honduras, and Mozambique. In Nepal, there were more boys than girls. The average age of students in the study was 10 years. In Ethiopia, however, more than 71 percent of the sample was older than 10 years, compared to 40 percent, 9 percent, and 30 percent in Guatemala, Honduras, and Nepal, respectively. In Mozambique, 89 percent of the sample was older than the expected age of 8 years. Students in Guatemala, Honduras, and Nepal had higher participation rates in kindergarten (73 percent, 86 percent, and 66 percent, respectively) compared to Mozambique and Ethiopia, where 13 and 28 percent of sampled students, respectively, had attended kindergarten.
62 percent spoke Emakhuwa, 24 percent spoke KiMwani, 11percent spoke ShiMakonde, two percent spoke multiple mother tongues, and less than one percent spoke Portuguese.
Spanish was the only language spoken in the areas visited in Honduras. Of the multi-lingual countries, Ethiopia had the most linguistically homogenous set of students, with 91 percent speaking Afan Oromo. Guatemala had the most diverse group with 34 percent speaking K’iche as their mother tongue (and also speaking Spanish at home), 30 percent speaking Mam, and 25 percent speaking Ixil. Another 11 percent of students in Guatemala spoke only Spanish. Mozambique was also diverse: 62 percent spoke Emakhuwa, 24 percent spoke KiMwani, 11 percent spoke ShiMakonde, two percent spoke multiple mother tongues, and less than one percent spoke Portuguese. In Nepal, the students spoke mainly Nepali and Tharu.

38
Opp
ortu
nity
to L
earn
: A h
igh
impa
ct st
rate
gy fo
r im
prov
ing
educ
atio
nal o
utco
mes
in d
evel
opin
g co
untr
ies
Family size and other socio-economic characteristics were similar within each country’s samples. Within each country, schools were located in areas with similar levels of economic development.
Table 2. Characteristics of Students in Sample Schools
FindingsHow well do schools provide an opportunity to learn?Table 3 and Figure 1 summarize the average OTL factor values for sample schools in each country. Schools in Ethiopia, Guatemala, Honduras, Mozambique, and Nepal were open over 90 percent of the days on the school calendar and teacher and student attendance rates were fairly high. Only a small portion of OTL is lost due to Factors 1–3. However, other factors lower the provision of OTL.
In Guatemala, sample schools used only 72 percent of the available day for instruction due to late starts, early closings, teacher and student absences, and prolonged breaks in the day for recess (i.e., 30 minute recess periods ran as long as 60 minutes). In all five countries, additional OTL was lost when student time-off-task in classrooms was taken into account. In Guatemala and Nepal, students were on task only 59 and 60 percent of the time, respectively. In Mozambique and Honduras, students were on task 50 and 56 percent of the time, respectively, while in Ethiopia, they were on task only 41 percent of the time.

39
WO
RK
ING
PAPER: O
pportunity to Learn and Early Grade Reading: Th e cases of Ethiopia, G
uatemala, H
onduras, Mozam
bique, and Nepal
Table 3. Summary of Performance on OTL Indicators, Sample Averages
1 2 3 4 5 6 7 8 9 10 11 12
% Open
tcher attd rate
stdt attd rate
% of day used
% time-on-task
% equiv days for inst
% w/ text
% obs
using text
% obs read
oral read wpm
class size
# supp visits (yr)
Guatemala 97% 88% 92% 72% 59% 33% 63% 3% 11% 46 27 7
Honduras 93% 94% 97% 82% 56% 40% 58% 22% 21% 73 29 5
Ethiopia 93% 89% 97% n/a 41% 33% 83% 4% 3% 18 44 18
Nepal 90% 91% n/a 92% 60% 45% 84% 14% 12% 26 44 3
Mozam-bique
92% 87% 78% 60% 50% 16% 80% 40% 5% 4 43 1-2
In all five countries, when time loss due to school closings, teacher and student absences, and off-task students were combined, schools used less than 50 percent of the equivalent available days for instruction (OTL Factor 6). Expressed as the number of days in the school year in which children and teachers were in school at the same time, this equivalent time came to approximately 30 days in Mozambique, 69 days in Ethiopia, 56 days in Guatemala, 78 days in Honduras, and 87 days in Nepal. In Nepal, the value would have been lower if student attendance were taken into account; in Ethiopia the value would have been lower if time use during the day were taken into account.
On average, Ethiopia, Mozambique and Nepal were better than Guatemala and Honduras at ensuring that schools have language textbooks for Grades 1–3 (provision of materials is an explicit aspect of Save the Children’s programs). However, students were observed using those textbooks a very small percentage of the time (OTL Factor 8). Students were also observed reading in class similarly low percentages of time: less than 12 percent of the time in three of the countries. Oral reading fluency in Ethiopia, Guatemala, Mozambique, and Nepal was low for Grade 3, while students were clearly more proficient readers (in Spanish) in Honduras. The averages in Ethiopia, Mozambique and Nepal (18, 4 and 26 wpm, respectively) were made lower by the significant percentages of Grade 3 students who could not read at all. In Mozambique, approximately 59% of grade 3 students tested could not read a single word. Average class sizes were reasonable in all five countries and schools reported receiving support visits quite frequently in Ethiopia, frequently in Guatemala and Honduras, and a few times per year in Mozambique and Nepal.
How does actual OTL compare to potential OTL?To compare actual OTL with potential OTL, the study looked at the combined effect of OTL Factors 1–5 to determine the equivalent number of days of instruction as compared to the total number of days in the school year. The official school year was 203 days in Ethiopia (812 intended instructional hours), 180 days in Guatemala (900 intended instructional hours), 200 days in Honduras (1050 intended instructional hours), 183 days in Mozambique (945 intended instructional hours), and 192 days in Nepal (1152 intended instructional hours). According to the MOE official policy, all five countries offer more hours of intended instruction, on average, than is found in their regions for Grades 1–3: 789 hours for LAC, 665 for South and West Asia, and 809 for sub-Saharan Africa (Benavot, 2004). In practice, the actual OTL is significantly lower than the potential in all five countries.
From the official total on the school calendar, the number of days school was closed was subtracted. In all countries, no school was open every day it should have been. Days were lost when schools opened after the official start date or when school was closed for other reasons (e.g., weather, local holiday, or school director absence). Additional days were subtracted from the potential total to

40
Opp
ortu
nity
to L
earn
: A h
igh
impa
ct st
rate
gy fo
r im
prov
ing
educ
atio
nal o
utco
mes
in d
evel
opin
g co
untr
ies
account for teacher and student absences. In Ethiopia, Guatemala, Honduras, Mozambique, and Nepal, the loss of time during the school day in the periods for which data were available was converted into an annual estimate of equivalent days lost. Lastly, student time-off-task during observed lessons was also converted into an annual estimate of equivalent days lost. The graph below summarizes how time was lost during the school year and how this erodes the time available for opportunity to learn.
Figure 1. Equivalent Days of Schooling Available for Teaching and Learning
203
180
200192190
175186
174168
146
175
158162
135
170
139145150
200
250
Official Days School Closed Teacher Absence
Student Absence Daily Time Lost Time‐on‐task
97
69
56
7887
0
50
100
Ethiopia Guatemala Honduras Nepal
In Guatemala, instruction occurred only on the equivalent of 56 out of 180 possible days. In Honduras, an equivalent of only 78 out of the possible 200 days of instruction was used. In Ethiopia, only the equivalent of 69 out of 203 days was used for instruction (and would have been lower if data on time lost during the day were available). In Mozambique, the contrast was stark: only 30 equivalent days remained out of an initial 183 days. In Nepal, the equivalent of 87 out of 192 days was used for instruction (and would have been lower if student attendance data were available).
In addition to comparing the time-related OTL factors to the total potential time for instruction, data on the percentage of observations during which children were reading (OTL Factor 9) shed light on the actual versus potential OTL, or in this case, the opportunity to practice reading. In all five cases, the percentage of observations in which students read material (including from the blackboard) was very low: 21 percent in Honduras, 12 percent in Nepal, 11 percent in Guatemala, 5 percent in Mozambique, and only 3 percent in Ethiopia.
Obviously, students could not have been reading all of the time, but the potential opportunity to practice reading should include more than such a small fraction of each school day. For example, 3 percent of a five-hour school day equates to 9 minutes of reading per day. In the US, students

41
WO
RK
ING
PAPER: O
pportunity to Learn and Early Grade Reading: Th e cases of Ethiopia, G
uatemala, H
onduras, Mozam
bique, and Nepal
in grades three and four spent an average of 16 minutes reading during a 50-minute reading class and an additional 15 minutes reading at home daily (Taylor, 2008). In Mozambique, students spent an average of 3 minutes doing any kind of reading during an entire day. Abadzi (2008) notes that achieving automized reading processes requires extensive practice with books and phonics, particularly in languages such as English, French, Portuguese, and Spanish. Such low amounts of daily practice cannot be expected to lead to automization. It is important to note that reading scores were higher in Honduras and could have been linked to the larger amounts of reading observed in the classroom.
How does OTL vary across schools?The previous section shared the average values of various OTL factor across all sample schools, disaggregated by country. However, more significant than average values was the variation in OTL across schools within each country. Both the nature and quality of the opportunity to learn provided at each school varied considerably, with schools performing better than the average on some factors while doing worse on others. While the non-control schools in each country were the objects of school improvement efforts (e.g., installation of infrastructure, provision of materials, training of teachers, ongoing financial and technical support), the impact of these efforts was not uniformly evident across schools.
The following section provides factor-by-factor discussion of this variation and reports whether any significant correlations were found among OTL factors, in particular whether OTL Factor 10 (student reading ability) correlated with any of the other factors (alone or in combination).
OTL Factor 1: The percentage of days school is openGuatemala varied the least in the percentage of days schools were open. Some schools were open every day, and one school was open on 90 percent of the scheduled school days. In Guatemala, when closures did occur, most were due to teacher training days or unplanned holidays. School closures in Guatemala (5 days, on average) tended to follow a similar pattern to other countries in the region where days lost to school closings for Grade 4 students ranged from a high of 6.3 in Paraguay to a low of 1.3 in Uruguay (Zhang et al., 2008).
In Honduras, 50 percent of interviewed principals reported beginning the school year late, on average five days after the official start date. Not one school in the sample was open every day of the academic calendar. Schools most often reported closures for teachers’ pay days, strikes, and teacher training. Every rural school reported closing its doors once per month so teachers could cash their paycheck. On the days of this study’s observations, 40 percent of the schools reported having lost over two weeks of school due to unofficial closings.
In Ethiopia, no school in the sample was open every day. Many schools initiated the school year after the official start date and most were closed additional days. At least 2 of the 26 schools were open less than 90 percent of the days available for instruction. One school had been closed for nearly all of the first three months of the school year.
In Mozambique, only one of the 49 schools opened on the official start date, and four of the schools reported that they had been closed for more than 30 days since the beginning of the school year. The data from the school records showing consistent time loss due to school closures were reinforced by actual observations by the research team. On 19 occasions, the team arrived at the school they were scheduled to visit to find that it was actually closed that day.
The same challenges were present in Nepal, where not one of the sample schools was open every day. There was a great deal of variation in school closings, ranging from a low of 4 days closed to a

42
Opp
ortu
nity
to L
earn
: A h
igh
impa
ct st
rate
gy fo
r im
prov
ing
educ
atio
nal o
utco
mes
in d
evel
opin
g co
untr
ies
high of 39 days. At least 8 of the 23 schools were open less than 90 percent of the days available for instruction.
Figure 2. Opportunity to Learn Factors: Variation Across Sample Schools
OTL Factor 2: Teacher attendanceIn Guatemala, teacher attendance data were difficult to obtain as many schools lacked attendance books. Absentee data were not documented in a consistent fashion and often not collected until later in the year, if at all. Generally, an average absenteeism rate was triangulated from the principal log books and the teacher’s student absenteeism logs across the number of months that the schools had been open. On average, across the 26 schools in Guatemala, teachers were absent two days per month, an attendance rate of roughly 88 percent. Some schools had perfect teacher attendance (based on the available records), while others had attendance rates as low as 68 percent.
In Honduras, teacher attendance data was collected in a manner similar to that in Guatemala. In schools with only one or two teachers, the student attendance log was the only official school attendance record kept. On average, across the 33 schools, teachers were absent 12 days per year. Only 2 schools had teacher attendance rates below 90 percent while 15 had attendance rates of 95 percent and higher.
In Ethiopia, the teacher attendance rate was obtained from the official teacher attendance record of each school. Similar to Guatemala, teachers attended school an average of 89 percent of the time. However, there was somewhat less variation in teacher attendance than in Guatemala. Three schools had teacher attendance rates of 70 to 80 percent, nine had teacher attendance rates of 80 to 90 percent, and nine had attendance rates above 90 percent.
In Mozambique, attendance records at the schools revealed that the average teacher attendance rate for schools in the sample was 87 percent. Collecting teacher attendance data proved to be

43
WO
RK
ING
PAPER: O
pportunity to Learn and Early Grade Reading: Th e cases of Ethiopia, G
uatemala, H
onduras, Mozam
bique, and Nepal
challenging, since not all directors ensured that attendance records were completed daily. There appeared to be no oversight or consistency in recording the data; and teachers whose classrooms were not physically located in the same school area as the main buildings were often not included on the school ledger or were only asked to sign once a week or month. Teachers reported missing school for a variety of reasons ranging from official trainings or seminars, distance education, or recertification to illness, a death in the family or community, or personal travel. Teachers also reported that they had to often miss a day of school to travel to the city to receive their paycheck as a result of the new Ministry policy. Directors and community members reported that teachers sometimes extend these trips for personal business, which added to the number of days they were absent from the schools.
In Nepal, the researchers were unable to obtain official records for teacher attendance. However, principals were asked to report on teacher attendance during the week prior to the interview. These attendance rates were used to estimate teacher attendance over the entire school year. On average, teachers were present 91 percent of the time. Two schools had teacher attendance rates just below 80 percent, and 5 others had rates between 80 and 90 percent. The remaining 16 schools reported attendance rates over 90 percent.
These attendance rates were consistent with studies conducted by Chaudhury (2005) and Abadzi (2009) that showed teacher absence rates between 11 and 27 percent in Bangladesh, Ecuador, India, Indonesia, Peru, Uganda, and Zambia.
OTL Factor 3: Student attendanceIf a student is not present and ready to learn, he or she cannot take advantage of the other opportunities to learn assembled at the school. However, similar to teacher absenteeism, few studies have quantified student absenteeism due to scarce school and teacher attendance records. Similar to this study, available international research, such as the work of Zhang et al. (2008), has focused on principal and teacher perceptions of student absenteeism, rather than actual attendance records. However, 2003 PISA data indicated student absenteeism rates ranging from 27 to 90 percent in Brazil, Hong Kong-China, Indonesia, Russia, Serbia, Thailand, and Tunisia. This study acquired and analyzed data on student attendance for Ethiopia, Guatemala, and Honduras, but not Nepal.
In Ethiopia, data obtained from schools’ attendance books in the first few months of the school year indicated that students in most schools were present more than 90 percent of the time. Only one school had an official attendance rate lower than 90 percent. A specific objective of Save the Children’s program was to bring schools closer to the communities in which children live. Therefore, it was not surprising that the schools in the sample drew students from their immediately surrounding villages. More than 80 percent of students in the sample lived within a 30 minute walk to school with 73 percent walking less than 10 minutes. This contributed to the high attendance rates. However, spot checks during classroom observations often revealed a higher rate of absenteeism than officially recorded.
In Guatemala, there was considerable amount of variation in student attendance rates. The data collected by this study indicated that students were present 92 percent of the time. The lowest attendance rate was 83 percent, which corresponded to a loss of 31 days in that school. Since most students traveled between 15 and 18 minutes to school, the relatively high student attendance rate could have been due to the close proximity of schools to students’ homes, although students did consistently arrive late.
Student attendance rates in Honduras were consistently high across the schools in the sample. On average, students were present 97 percent of the time. Only 2 schools had attendance rates lower than 90 percent and 14 schools had attendance rates of over 99 percent. The adjusted school

44
Opp
ortu
nity
to L
earn
: A h
igh
impa
ct st
rate
gy fo
r im
prov
ing
educ
atio
nal o
utco
mes
in d
evel
opin
g co
untr
ies
schedules in rural areas may have accounted for these high attendance rates. While city schools began class at 7:30 a.m., classes in the municipality of Gujiquiro began at 8:00 a.m. to give students enough time to arrive at school. Given that, on average, students in the rural areas reported walking 25 minutes to school, the delayed start may have contributed to higher attendance rates.
In Mozambique, the average student attendance rate (according to official school records) was 78 percent, equivalent to a loss of 32 days a year. Schools reported a range of attendance rates, from a low of 39 percent to as high as 98 percent. Student attendance rates at the district level were similar. Gathering student attendance data was challenging because teachers did not take attendance on a consistent basis. Only 67 percent of teachers had an attendance book on hand on the day of the visit. Teachers gave a variety of reasons to explain the lack of attendance records; most often stating they had left the book at home or that they were not keeping attendance because the government had yet to provide them with official record books. During the interviews, Grade 3 students were asked whether they missed class last week; 24 percent reported missing school the previous week. These students were absent, on average, three days during the previous week. Fifty-four percent of students said they did not come to school because they were sick, 15 percent had to work in their fields, 7 percent did not want to come, 4 percent had to work at home and the rest provided reasons varying from taking care of younger siblings to that they were not sure. Only a small sample of students reported that they tended to miss school regularly throughout the year to work outside the home.
OTL Factor 4: Percentage of the school day available for instructionThe percentage of the school day available for instruction takes into account the non-instructional components of the school day, such as recess. It also recognizes that school may start late, end early, or experience interruptions in instructional time for a variety of reasons (e.g., the teacher or students may be out of class). This study was able to collect data on the loss of instructional time during the school day in Guatemala, Honduras, and Nepal.
In Guatemala, teachers and students were regularly observed arriving late to school. Additionally, recess often ran longer than scheduled. The percentage of the day available for instruction in Guatemala, Honduras, and Nepal was found by subtracting this time lost and treating the remaining time (when teachers and students were in class together) as a percentage of the full, five-hour school day. On average, schools in the study used only 72 percent of the school day, with wide variation across schools. One school used only 57 percent of the day, and eight used only 67 percent of the day.
In Honduras, schools most often started on time but experienced multiple breaks during the day. While most schools visited took both a recess and a lunch break, the length of these breaks varied considerably. Some schools took up to two hours for these breaks, while others took only 30 minutes. A number of schools did not give a lunch break due to the government’s failure to provide student lunches. School days also ended at various times due to parent meetings, bus schedules, or a lack of material to continue class. On average, schools in the study used only 80 percent of the available learning time, with a wide amount of variation. One school used 100 percent of the day, compensating for recess with an extra 30 minutes of class, while seven used only 70 percent of the available learning time.
In Mozambique, in addition to late starts and early release, schools in the sample lost an average of 40 minutes during the recess periods, with a variance among schools of between 0–104 minutes. When the time lost because of a late start, an early release, and extended recess was combined, students spent an average of 158 minutes in the classroom—or the equivalent of only two-and-a-half hours, i.e., only half their scheduled lesson time was available. There was little if any difference between the districts. Classes often started late because not enough students had arrived and/or the teachers were not present on time. Directors and teachers reported a variety of reasons for ending
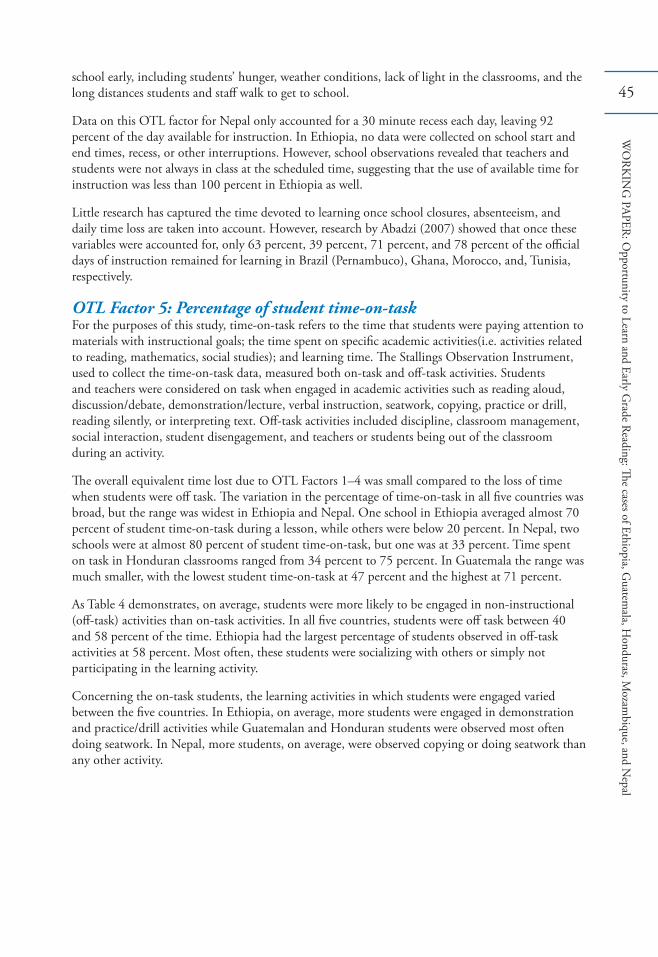
45
WO
RK
ING
PAPER: O
pportunity to Learn and Early Grade Reading: Th e cases of Ethiopia, G
uatemala, H
onduras, Mozam
bique, and Nepal
school early, including students’ hunger, weather conditions, lack of light in the classrooms, and the long distances students and staff walk to get to school.
Data on this OTL factor for Nepal only accounted for a 30 minute recess each day, leaving 92 percent of the day available for instruction. In Ethiopia, no data were collected on school start and end times, recess, or other interruptions. However, school observations revealed that teachers and students were not always in class at the scheduled time, suggesting that the use of available time for instruction was less than 100 percent in Ethiopia as well.
Little research has captured the time devoted to learning once school closures, absenteeism, and daily time loss are taken into account. However, research by Abadzi (2007) showed that once these variables were accounted for, only 63 percent, 39 percent, 71 percent, and 78 percent of the official days of instruction remained for learning in Brazil (Pernambuco), Ghana, Morocco, and, Tunisia, respectively.
OTL Factor 5: Percentage of student time-on-taskFor the purposes of this study, time-on-task refers to the time that students were paying attention to materials with instructional goals; the time spent on specific academic activities(i.e. activities related to reading, mathematics, social studies); and learning time. The Stallings Observation Instrument, used to collect the time-on-task data, measured both on-task and off-task activities. Students and teachers were considered on task when engaged in academic activities such as reading aloud, discussion/debate, demonstration/lecture, verbal instruction, seatwork, copying, practice or drill, reading silently, or interpreting text. Off-task activities included discipline, classroom management, social interaction, student disengagement, and teachers or students being out of the classroom during an activity.
The overall equivalent time lost due to OTL Factors 1–4 was small compared to the loss of time when students were off task. The variation in the percentage of time-on-task in all five countries was broad, but the range was widest in Ethiopia and Nepal. One school in Ethiopia averaged almost 70 percent of student time-on-task during a lesson, while others were below 20 percent. In Nepal, two schools were at almost 80 percent of student time-on-task, but one was at 33 percent. Time spent on task in Honduran classrooms ranged from 34 percent to 75 percent. In Guatemala the range was much smaller, with the lowest student time-on-task at 47 percent and the highest at 71 percent.
As Table 4 demonstrates, on average, students were more likely to be engaged in non-instructional (off-task) activities than on-task activities. In all five countries, students were off task between 40 and 58 percent of the time. Ethiopia had the largest percentage of students observed in off-task activities at 58 percent. Most often, these students were socializing with others or simply not participating in the learning activity.
Concerning the on-task students, the learning activities in which students were engaged varied between the five countries. In Ethiopia, on average, more students were engaged in demonstration and practice/drill activities while Guatemalan and Honduran students were observed most often doing seatwork. In Nepal, more students, on average, were observed copying or doing seatwork than any other activity.

46
Opp
ortu
nity
to L
earn
: A h
igh
impa
ct st
rate
gy fo
r im
prov
ing
educ
atio
nal o
utco
mes
in d
evel
opin
g co
untr
ies
Table 4. Use of Time in Class for Different Categories of Student Activities
Category of Activity Ethiopia Guatemala Honduras Mozambique NepalNon-instructional 58% 42% 44% 50% 40%Demonstration 11% 6% 5% 8% 12%Practice/Drill 10% 5% 4% 2% 11%Copying 7% 6% 5% 9% 13%Seatwork 5% 21% 25% 14% 13%Reading 4% 4% 6% 5% 5%Discussion 3% 7% 5% 9% 2%Verbal Instruction 2% 6% 5% 3% 3%
In addition to calculating the overall percentage of on-task students during an observation, the researchers also looked at patterns in students’ behavior when the teacher was on or off task. Table 5 shows that, in each country, teacher involvement in a learning activity led to greater percentages of on-task students. On average in Nepal, 77 percent of students were on task when the teacher was on task, while in Guatemala, Honduras, and Ethiopia the averages were 69 percent, 62 percent, and 61 percent, respectively. However, when teachers were off task, students were much less likely to be engaged in learning activities. In both Ethiopia and Nepal, only 12 percent of students were observed to be on task when teachers were off task. These numbers demonstrate the importance of teachers leading or being involved with a lesson to increase the likelihood that their students will also be on task.
Table 5. Use of Time in Class: Percentage of students on-task
Guatemala Honduras Ethiopia Mozambique Nepal
Overall Average 58% 56% 42% 50% 60%
When Teacher is on-task 69% 62% 61% 49% 77%
When Teacher is off-task 32% 36% 12% 51% 12%
By Grade
When Teacher on-task 1 70% 63% 79%
2 73% N/A 55% 78%
3 66% 62% 74%
When teacher off-task 1 38% 14% 57% 11%
2 29% N/A 11% 49% 14%
3 30% 11% 47% 10%
Researchers in Guatemala also used the Guatemalan Ministry of Education teacher practice standards to determine effective classroom practice. While seatwork and copying were still the predominate on-task activities, other activities were used fairly frequently to aid learning: cooperative, small group activities; debate and discussion, particularly in social studies and geography; and learning tools such as games and manipulables. In fact, teachers’ pedagogical skill levels rated reasonably well against the Ministry of Education’s standards for time management, classroom management, and use of instructional resources.

47
WO
RK
ING
PAPER: O
pportunity to Learn and Early Grade Reading: Th e cases of Ethiopia, G
uatemala, H
onduras, Mozam
bique, and Nepal
As with Factor 4, little research has captured the use of time in classrooms. While Brazil, Ghana, Morocco, and Tunisia differ in income and poverty levels from the countries in this study, they showed similar results. In Pernambuco, Brazil, students were engaged in interactive learning 53 percent of the time, while students in Ghana were engaged approximately 52 percent of the time. Rates were slightly better in Morocco and Tunisia at 63 and 62 percent, respectively (Zhang, et al., 2008).
OTL Factor 6: Equivalent percentage of days available for instructionThis factor measures the combined effects of OTL Factors 1 through 5, all of which relate to the amount of time available for teachers and students to engage in learning activities. To calculate the equivalent percentage of days available, researchers started with the percentage of days school was open (the official number of school days minus the number of days a school was closed when it should have been open). Teacher and student absence were factored in, as learning could only occur when both were present. Time lost for breaks in the school day was then factored out. Finally researchers accounted for time-on-task to differentiate between classroom time used for learning activities as opposed to non-instructional activities.
This study revealed that, on average, only the equivalent of 69 out of 203 days were used for instruction in Ethiopia, 56 out of 180 days in Guatemala, 78 out of 200 days in Honduras, 30 out of 183 days in Mozambique, and 87 out of 190 days in Nepal (numbers for Ethiopia and Nepal would have been lower if data were available for time lost during the day and student attendance, respectively). This study also uncovered considerable variation across schools in how OTL Factors 1–5 interacted to determine an equivalent percentage of days each school made available for instruction. Figure 3 shows this variation.
Figure 3. Variation in the Equivalent Percent of Available Days for Instruction (OTL Factor 6)
40%
60%
80%
Ethiopia Guatemala Honduras Nepal
Schools with greatest amount of time
Schools with leastamount of time
0%
20%
Individual schools in each country

48
Opp
ortu
nity
to L
earn
: A h
igh
impa
ct st
rate
gy fo
r im
prov
ing
educ
atio
nal o
utco
mes
in d
evel
opin
g co
untr
ies
In Guatemala and Nepal, some schools had twice the equivalent number of days available for instruction as compared to other schools. In Ethiopia, the schools that made the most time available for instruction had three times the equivalent available days than those with the least available time; in Honduras, some schools provided up to five times the number of equivalent instructional days than other schools. In Mozambique, the difference in the days remaining for instruction varied from 22 days to 34 days.
OTL Factor 7: Percentage of students with a textbook Figure 4 shows that language textbooks were readily available for students in Grades 1–3 in most of this study’s schools. The availability of textbooks for students in grade 3 was high across all five countries. In Guatemala, only six sample schools had no language textbooks for students in Grades 1–3, and one school in both Nepal and Honduras similarly lacked this important resource. Although most Honduran classrooms in the sample had some textbooks, less than 50 percent of the students had exercise books, which were an integral part of the national curriculum.
Figure 4. Number of Schools within the Percentage Range of Students with a Language Textbook
25% to 50%
50% to 74%
75% to 99%
100%
ge of stude
nts with a textbo
ok
Ethiopia
Guatemala
Honduras
N l
0 5 10 15 20 25 30
0%
1% to 24%
Number of schools
Percen
tag Nepal
In addition to language textbooks, students were asked if they had pencils and notebooks. In Mozambique, nearly one third of students did not have notebooks (32 percent) or writing utensils (27 percent), though in the other four countries, the great majority of students had basic materials. Moreover, students were often seen using these materials.
In Ethiopia, 18 observations revealed that students were engaged in practice and drill, which teachers taught mostly through the blackboard. During 19 observations, students completed seatwork with their notebooks and 21 observations showed demonstration taking place in the classroom. Teachers

49
WO
RK
ING
PAPER: O
pportunity to Learn and Early Grade Reading: Th e cases of Ethiopia, G
uatemala, H
onduras, Mozam
bique, and Nepal
most frequently used the blackboard as the medium of instruction for demonstrations. Students were observed engaging in activities related to reading in only 11 percent of observations.
In Guatemala, students were most frequently observed doing seatwork in their notebooks (22–24 observations, depending on the country). Some discussion/debate and demonstration was also observed in Guatemala, but much less frequently (6–8 observations). When these activities were taking place, the medium of instruction was frequently the blackboard. Similar results were found for Nepal, Mozambique and Honduras.
OTL Factor 8: Percentage of observed use of textbooksA higher percentage of students were observed using textbooks in Honduras than in Ethiopia, Guatemala, Mozambique, and Nepal. Figure 5 combines OTL Factors 7 and 8 to show how textbook availability and use were interrelated in the schools studied. The vertical axis plots the percentage of observations during which textbook use was noted and the horizontal axis plots the percentage of students with a language arts textbook. Each data point represents a school.
It is interesting to note that the majority of data points for Ethiopia, Guatemala, Mozambique and Nepal cluster in the lower-right side of the graph. This indicates that high textbook availability in a school was associated with relatively low observed textbook use. Also of interest is that all outliers (schools with higher than average textbook use for a given level of textbook availability) are found in Nepal. The results for Honduras show a more scattered use of textbooks, with more students observed possessing and actually using textbooks in the classroom.
Figure 5. Percentage of Students Observed Using a Textbook for a Given Level of Textbook Availability

50
Opp
ortu
nity
to L
earn
: A h
igh
impa
ct st
rate
gy fo
r im
prov
ing
educ
atio
nal o
utco
mes
in d
evel
opin
g co
untr
ies
OTL Factor 9: Percentage of time spent readingClassroom observations revealed that reading instruction was almost non-existent in all five countries. Students were rarely observed reading aloud, reading silently, or interpreting text: this occurred less than 12 percent of the time in Ethiopia, Guatemala, Mozambique and Nepal, and 21 percent of the time in Honduras. Additionally, none of the countries had an official curriculum for teaching reading.
While more than 90 percent of students in the study had access to language arts textbooks, researchers rarely observed textbook use in class. In Ethiopia and Nepal, the books lacked reading passages and stories, making it difficult for researchers to develop the reading fluency test. In Guatemala, reading passages and stories were easy to locate, but were rarely in the mother tongue. In fact, the only schools possessing Mayan story books were those supported by Save the Children, and even then these books were usually locked in the principal’s office. No structured approach to reading was observed in any classroom in this study. In Honduras, teachers reported waiting two to three years for textbooks. The district education office reported that books would be delivered for the 2008 school year, but at the time of the research visits (halfway through the school year), new books had yet to arrive at these schools. In Mozambique, 55% of teachers reported that students read on a daily basis and 8% reported that students read 3-6 times per week. During actual classroom observations, students were observed reading less than 5% of the time – or less than 3 minutes an hour. In Portuguese classes, students were observed reading approximately 5 minutes per hour (8% of the observation time). Across these countries, students in grade 3 are struggling to read. If students are going to learn to read, teachers need to focus on teaching reading skills (i.e. phonemic awareness, decoding) and give them focused time to read books.
OTL Factor 10: Reading fluencyReading ability is both an outcome of opportunity to learn and a critical determinate of whether students continue to learn and advance in school. If students do not acquire an adequate level of reading ability early in their schooling, they fall further behind. Thus, students’ continued opportunity to learn depends on their level of reading ability.
Given the lack of focus on reading and reading instruction, it was not surprising to find low Grade 3 reading performance. In Honduras, the site of the highest percentage of observed reading activities, students’ overall reading performance surpassed that of students in the other three countries. While the average number of words read per minute provided a general idea of student reading levels, this number masked the enormously wide range of abilities found in each country. As Table 6 demonstrates, students in every country read at many different rates.
Table 6. Frequency Distributions of Reading Fluency
Words Per Minute Ethiopia Guatemala Honduras Mozambique Nepal
Zero 36% 4% 8% 59% 44%
1-10 15% 2% 1% 34% 3%
11-20 9% 6% 2% 3% 3%
21-30 13% 11% 2% 1% 6%
31-40 12% 11% 2% 1% 7%
41-50 9% 18% 6% 1% 16%
51-60 3% 15% 8% 1% 10%
61-70 2% 12% 11% 0% 5%
>70 0% 19% 60% 0% 7%

51
WO
RK
ING
PAPER: O
pportunity to Learn and Early Grade Reading: Th e cases of Ethiopia, G
uatemala, H
onduras, Mozam
bique, and Nepal
In Nepal, the majority of students either could not read at all (44 percent) or were able to read 41–60 wpm (26 percent). In Ethiopia, very few students read more than 40 wpm and the largest percentage (36 percent) could not read at all. Not a single student was able to read more than 70 wpm. In addition, only 2 schools in Ethiopia and 11 schools in Nepal averaged more than 25 wpm on the fluency test.
In Mozambique, the vast majority could not read at all (59%) or were able to read 1-10 wpm (34%). In that case, there were clear challenges related to learning Portuguese. To assess whether students in the sample had developed a basic oral vocabulary in Portuguese, they were asked to identify body parts and everyday objects (e.g., eyes, head, pencil, stone) and to complete a number of basic instructions using common prepositions (e.g., put the pencil on the paper). Only 25 percent of the overall sample was able to answer 10 or more of the 20 oral vocabulary questions, and the remaining 75 percent of students struggled considerably with the oral vocabulary exam.
Students’ reading scores in Guatemala were more evenly distributed. Very few children could not read (4 percent), 8 percent read 1–20 wpm, and almost half the sample (46 percent) read more that 50 wpm. Students in the study averaged 47 wpm, but the range among schools was between 25 wpm and 82 wpm.
Students in Honduras were, on average, the strongest readers in the sample with an average reading score of 73 wpm. Similar to Guatemala, few children (8 percent) could not read and only 3 percent read at 1–20 wpm. The majority of students (over 60 percent) read at least 70 wpm, and 35 percent read over 90 wpm.
Neurocognitive research conducted by Abadzi (2008) suggests that all students should be able to decode by the end of Grade 1; that all Grade 2 students should be able to read at least 60 wpm; and that Grade 6 students should be able to easily read 120–150 wpm and provide a summary of the passage. In the Arabic script languages, all students should be able to read effectively within one to two years of beginning instruction.
Table 7. Concepts About Print
Ethiopia Guatemala Honduras Mozambique Nepal# of CAP
Correct An-
swers
% Stu-dents
by CAP score
Avg wmp
% Stu-dents
by CAP score
Avg wmp
% Stu-dents
by CAP score
Avg wmp
% Stu-dents
by CAP score
Avg wmp
% Stu-dents
by CAP score
Avg wmp
Zero 1% 8.6 34% 40 0% 40 8% 0 1% 5.1
1 0% 6% 1% 7% 2%
2 0% 3% 0% 8% 3%
3 5% 2% 1% 10% 3%
4 6% 2% 2% 11% 6%
5 9% 3% 4% 14% 8%
6 12% 9.0 7% 47 8% 50 15% 2 8% 8.7
7 10% 9% 7% 13% 11%
8 18% 24.0 18% 56 10% 74 6% 11 20% 39.8
9 23% 11% 45% 3% 29%
10 16% 5% 22% 4% 11%

52
Opp
ortu
nity
to L
earn
: A h
igh
impa
ct st
rate
gy fo
r im
prov
ing
educ
atio
nal o
utco
mes
in d
evel
opin
g co
untr
ies
Identifying the causes of these reading level patterns across countries is essential in order to improve students’ reading abilities. This study used Concepts About Print to assess whether students were acquiring skills foundational to learning to read. As Table 7 demonstrates, the majority of students in these cases had acquired pre-literacy foundation in either their mother tongue or the language of instruction. While Ethiopian and Nepalese students had low reading scores, they knew their letters and print concepts. Higher Concepts About Print scores were correlated with better reading performance, but almost all students handled most Concepts About Print questions.
OTL Factor 11: Class sizeClass sizes in Grade 3 varied immensely. On average, class sizes in Ethiopia, Guatemala, Honduras, Mozambique, and Nepal were 46, 27, 29, 43, and 44 students per class, respectively. At the school level, class sizes varied from 28–77 in Ethiopia, 10–40 in Guatemala, 14–49 in Honduras, 14-110 in Mozambique, and 16–104 in Nepal. In Ethiopia, five schools had class sizes larger than 50 students, with three containing more than 60 students per class. In Guatemala only one school had more than 40:1 student/teacher ratio and in Honduras only three schools had classes with over 45 students. Class sizes in the sample schools were generally appropriate and, while higher than the average for OECD countries, were within the range of 25–48 students per class seen in countries included in the World Education Indicator Study (OECD, 2006).
OTL Factor 12: School supportEQUIP2 research on complementary education programs found that school support services were critical in allowing community schools to produce learning results similar to or better than their government school counterparts (DeStefano, et al., 2007). This study shows that schools in Ethiopia reported high numbers of visits, whether from Save the Children staff or from local and regional education officials. On average, schools reported being visited almost twice per month during the school year, with some claiming weekly visits. These numbers of reported visits may be overstated, however. In all five countries, the number of visits reported by principals differed dramatically from the number reported by teachers within the same school.
More important than the number of visits was whether these visits provided any benefit to the school. For example, in Guatemala, visits reportedly focused on classroom management or administrative support rather than instructional support to teachers. In Mozambique, thirty-eight percent of teachers reported that feedback provided by the Directors on a school visit had anything to do with improvements to teaching and learning. Only nine percent of teachers reported ever getting any feedback on how to improve reading instruction. In all cases, school support visits did not correlate with any other study finding.
Conclusions and Policy ImplicationsRelationships among OTL Factors and Student OutcomesResearch by Bloom (1968), Gettinger (1984), Benavot and Amadio (2004), and Abadzi (2007) indicate that to improve students’ learning levels, a basic opportunity to learn must exist. This opportunity to learn requires that teachers and students are present every day and that they spend most of the day engaged in learning activities. Research further indicates that too much instructional time is wasted in classrooms due to poor classroom management, disciplinary action, long transition times, and teacher and student absenteeism; educators must make more efficient use of the existing time available for instruction (Stallings, (1973, 1980); and Aronsen et al, 1998).
The main findings across Ethiopia, Guatemala, Honduras, Mozambique, and Nepal suggest that: a) a great deal of instructional time was lost; b) little, if any, classroom reading instruction took place; c) textbook use was suspect; and d) students’ reading abilities were low.

53
WO
RK
ING
PAPER: O
pportunity to Learn and Early Grade Reading: Th e cases of Ethiopia, G
uatemala, H
onduras, Mozam
bique, and Nepal
Given the small amount of classroom time spent on reading and the lack of a reading curriculum, it was not surprising that students’ reading abilities were low. While students across all five countries knew letters and tested reasonably well on the Concepts About Print, reading fluency scores were well below the acceptable threshold of 60 wpm in Ethiopia, Guatemala, Mozambique, and Nepal. In fact, in Ethiopia, Mozambique and Nepal, large percentages of students in Grade 3 were unable to read at all. Their performance on the Concepts About Print implies, however, that even those students unable to read received some basic instruction in lower primary grades. Unfortunately, this instruction was not sufficient to make the transition from an introduction to written material to actual reading.
The OTL profile and subsequent analysis from these country cases provides useful insights into the relationship between schools, instruction, and learning: Unless there is a minimum amount of instruction, specifically in reading, then a relationship between OTL and learning is unlikely. Across all five studies, schools varied in teacher and student attendance, textbook possession and use, class size, and number of support visits by education personnel. Major variations existed across all OTL factors included in this study’s research framework. Despite these variations, in classrooms across all five countries there was a consistently small amount of reading instruction, little exposure to text, and a lack of opportunity for students to read (rates were higher in Honduras, however). This finding has important policy implications for those implementing programs or making education sector policy. The following discussion divides these implications into two categories: School Organization and Management and Classroom Environment and Instruction.
Policy Implications: School Organization and ManagementSchool organization and management deals with areas such as school leadership, governance, accountability, and support, to which OTL Factors 1–6 directly relate. Increasing the amount of learning time available to students is a first step in improving their overall academic performance in reading (Snow et al., 1998).
As noted by Aronson, et al. (1998), Literature on the relationship between time and learning dates back to the 1970s and typically focuses on empirical, data-based research; policy reports combining educational theory and empirical research; or anecdotal, experientially-based periodical publications, usually explaining schools’ experiences implementing a certain time-related policy. Over the last several decades, school districts throughout the United States have studied extensions to the school day and year that would provide more allocated time to students. However, research by Holsinger (1982), Nelson (1990), and Aronson, et al. (1998) has provided mixed findings about the influence of allocated and engaged time on student learning. Research has revealed little or no relationship between allocated time and student achievement; some relationship between engaged time and achievement; and a larger relationship between academic time and achievement. In short, time does matter and is predictive of academic achievement if properly used for engaged academic activities (Latham 1985 as cited in Hollowood et al, 1994; Brophy and Good, 1986; Greenwood, 1991). Research by Stallings (1973), Aronson, et al. (1998), and Abadzi (2007, 2009) also show that the amount of allocated and engaged time is greatly reduced by time spent on non-academic activities, transition to classes or topics, poor classroom management, and disciplinary activities.
Schools in Ethiopia, Guatemala, Honduras, Mozambique, and Nepal, used, on average, less than half of the available opportunity to learn and even less of available instructional time. This loss of OTL was due primarily to off-task teachers and students. Further, this study found that students being off task were directly tied to teachers being off task. The loss of time from teachers and students being off task in the classroom ranged from 30 to 40 days per year. Outside of the classroom, students lost the equivalent of between 30 and 75 days of instruction due to school closures, teacher and student absenteeism, and late starts and extended recess.

54
Opp
ortu
nity
to L
earn
: A h
igh
impa
ct st
rate
gy fo
r im
prov
ing
educ
atio
nal o
utco
mes
in d
evel
opin
g co
untr
ies
Within the classroom, students spent the majority of the time doing seatwork, debating or discussing subjects, and copying. A limited amount of reading (10–20 percent of observations) took place in the lower primary grades and an even smaller percentage of classroom time involved students reading or analyzing text. While sufficient textbooks seemed to exist in most classrooms, researchers witnessed limited use of these books. In none of the five countries was there evidence of a reading curriculum.
When addressing time variables, the implications for policy reform need to distinguish between factors that are easily addressed and those that require more complicated policy interventions. OTL factors such as school closures, absenteeism, and daily time loss are more easily corrected than ensuring quality time-on-task, teacher training, and support services, because policy-makers can engage communities in solving these problems and holding schools accountable. EQUIP2 complementary education research supports the idea that community run/supported programs designed to engage parents help ensure that schools are open and teachers and students are present.
Based on the results of this study, ensuring that schools were open 100 percent of the official time, that schools started and ended their school day on time, and that teachers and students were present would add 39 days of instruction in Ethiopia, 32 days in Guatemala, 30 days in Honduras, 122 days in Mozambique and more than 50 days in Nepal. In Guatemala, ensuring that the schools open on time and that recess is kept to 30 minutes would add an additional 49 days of instruction. Even if the quality of instruction were held constant, it is likely that this increase in learning time would improve student learning outcomes.
Policy Implications: Classroom Environment and InstructionDecades of school improvement work have focused on helping children learn through interventions such as teacher training and support and improved pedagogical methods. Yet, school quality still poses a challenge for educators and policy-makers alike. Students still lose important instructional time and often lack the learning materials necessary to improve performance. The answer to improving school quality and learning at times seems elusive. Where should policy-makers and educators invest their resources? How should they prioritize interventions? While investments in improving factors such as school opening, start and end times, and absenteeism can often be addressed with improved management of the school day, creating real improvements in the classroom and instruction is often more difficult. The following discussion provides insights into interventions that could improve the classroom environment and help children learn.
Textbook Availability and UseAcross all five countries, 63–84 percent of students had textbooks, on average. Yet, the use of textbooks was fairly limited, especially in Ethiopia, Guatemala and Mozambique. In Guatemala, textbooks often sat on shelves unused and six schools had no textbooks for students. Snow, et al. (1998) indicate that in the early grades, factors such as time, materials, and resources should support both daily independent reading of texts (selected based on student interest) and daily assisted reading and rereading of more difficult texts that advance students’ linguistic abilities. This approach to reading was rarely seen in classroom observations.
The availability and use of textbooks has important policy implications. First, as noted by Snow, et al. (1998) and Bruns, et al. (1999), textbooks should not be provided without helping teachers integrate these books into their instructional practice. Training to effectively use textbooks should include pedagogically sound approaches such as activity centers that emphasize word use and structure, silent reading of story books, and peer reading.
Second, language arts books should include stories and texts that allow students to practice reading. This study found that the content in language class textbooks in Ethiopia, Mozambique and Nepal

55
WO
RK
ING
PAPER: O
pportunity to Learn and Early Grade Reading: Th e cases of Ethiopia, G
uatemala, H
onduras, Mozam
bique, and Nepal
was limited. Examples of text that children could read were few and failed to engage children’s imaginations and excite them about learning to read.
Finally, while most students in the study’s schools had textbooks, the observed use was fairly low, and in some classrooms, essentially non-existent. CARE, Save the Children, and Aga Khan Foundation programs, like many programs, invested in delivering books to schools. This research demonstrates that this alone falls short of ensuring that the textbooks are used in classrooms. Further, the amount of educational benefit from textbook use was unclear given their insufficient number of reading passages, particularly in Ethiopia, Mozambique and Nepal.
Practice reading is critical for early grade students to learn to read. Snow, et al. (1998) points out that students should have storybooks that are below their frustration level (to encourage reading), and students should practice frequently. If practice reading is essential for literacy among lower primary grade students, then books that provide interesting stories should also be present and used in the classroom. There was a dramatic shortage of local language story books in the three multi-lingual countries in this study.
International development organizations and developing country governments need to recognize the lack of children’s storybooks as a missing ingredient in promoting literacy. Learning to read will always be an uphill battle in environments devoid of interesting reading material. Projects, programs, and policy need to recognize that the creation of literate environments and the development of culture of reading are as important as the need to focus on better in-school reading instruction Projects, programs, and policy also need to ensure that the provision of storybooks is accompanied by their use—something almost never observed in this study. In Guatemala, Save the Children developed Mayan storybooks; however, these books were often locked in the principal’s office. This is prime example of a potentially useful intervention undermined because of a lack of knowledge and encouragement.
Linking Teacher Training to Literacy Acquisition StrategiesLinked to the idea of promoting the proper use of books in classrooms is the prevailing approach to teacher in-service training and support. The programs included in this study invested considerable resources to train teachers. Too often, that training was in the form of off-site workshops. These workshops may or may not introduce teachers to useful pedagogical innovations, classroom management practices, and progressive concepts such as child-centered or active learning. However, independent of the content, the model of teacher development that relies on teachers receiving instruction in a general area and transferring this knowledge into practice should be discredited, as noted by Villegas-Reimers (2003). Instead, a behavior change approach is needed that identifies the specific classroom-based practices needed by teachers, and breaks down these practices into manageable increments of behavior change. This help must consist of the chance to practice in a safe environment, of clear benefits to teachers exhibiting the new behavior, of consistent evaluation and feedback, and of supportive organizational cultures within schools and communities that encourage these behaviors.
Observations in all five countries indicated fairly low time-on-task and a consistent lack of engaging instruction in the early grades. In particular, the study found a lack of instruction tailored to the acquisition of the foundational aspects of literacy. Behavior changes for teachers should improve time-on-task, specifically in literacy acquisition-related activities. This could be as simple as creating time for reading: teachers reading to students, students reading to students, and students reading by themselves. More importantly, early primary teachers need to learn the fundamental elements of teaching reading (e.g., sound–letter correspondence, oral blending of sounds to read words, sight vocabulary) and need specific classroom practices that reinforce these elements. Classroom practices

56
Opp
ortu
nity
to L
earn
: A h
igh
impa
ct st
rate
gy fo
r im
prov
ing
educ
atio
nal o
utco
mes
in d
evel
opin
g co
untr
ies
must link to the use of textbooks and other reading materials to improve learning and engagement of students. These strategies also need to be consistently applied by teachers in the classroom.
The implication for policy-makers is twofold. First, classrooms must be equipped with additional materials such as easels, storybooks, and supplies for students to create reading materials. More important is the linkage between the provision of these new materials and teacher training and support to ensure they are used in ways that help students learn to read. In this lies a more complex set of investments with unclear financial trade-offs that should be carefully examined in each context.
Providing Remedial or Accelerated SupportSchools also need help developing remedial strategies given the high percentages of students found in this study who were unable to read or reading at low levels of fluency in Grade 3. Vaughn and Linan-Thompson (2004) write that students should learn to read by the end of their first year in school. Many of the students in this study were not reaching that goal. Unless specific strategies are deployed to ensure those students learn to read, they will simply fall further behind. Introducing interventions such as accelerated learning programs, after-school tutoring, and special classes for students who are behind are strategies that need to be deployed more systematically in schools similar to those in this study.
Using Assessment to Inform InstructionLinked to the idea of providing remedial support to students who are behind is the ability to assess students’ literacy levels and identify those who are acquiring the building blocks of literacy and those who are not. The Ed Data II project continues to improve the Early Grade Reading Assessment employed in this study, demonstrating its utility in a variety of settings and languages. Such tools need to be used more systematically, not only to gauge whether learning is occurring, but also to allow teachers to spot check their students’ progress. EGRA can help teachers deploy instructional interventions that respond to their students’ needs, including identifying students needing significant remedial support.
The OTL profile includes reading fluency an indicator of school effectiveness. This profile provides a tool that could be used to contextualize the information about learning outcomes provided by EGRA. The OTL profile provides educators, program managers, and policy-makers with useful, time-relevant data about variations among schools in across the 12 factors. This set of school effectiveness data can allow more targeted support where assistance is needed. For example, one school may have high time-on-task percentages, but high teacher absentee rates. This knowledge could help a community or education official focus on the specific issue at the school, in this case determining why teachers are consistently absent. The OTL profile would allow individualized support to schools by allowing supervisors to collect school-relevant data.
School Support ServicesEQUIP2 complementary education research found that school support services were a critical in the effectiveness and cost-effectiveness of complementary models. However, it is clear from these five cases that the investments in school support were translating appreciably into neither improved opportunities to learn nor better learning outcomes for students. If schools receiving ongoing support are unable to implement the changes that lead to better use of time, then how can one expect schools to meet these challenges on their own? Support resources need to be devoted to instruction, in particular to instruction in reading. Unless there is a greater focus on instructional rather than administrative support, visits to schools by officials will continue to have limited impact on the actual OTL and learning outcomes obtained in schools.

57
WO
RK
ING
PAPER: O
pportunity to Learn and Early Grade Reading: Th e cases of Ethiopia, G
uatemala, H
onduras, Mozam
bique, and Nepal
ConclusionWhile there are trade-offs and political challenges to each of these implications, it is important that educators begin to look at concrete ways to ensure that students learn to read. The OTL profile can serve as a useful tool to gauge students’ progress. As an evaluative tool, the profile allows ministries of education to see school variation at the region, district, or national levels and target appropriate interventions according to need. For example, schools in one region may consistently start late, causing a loss of instructional time that simply requires better supervision to ensure on-time starts. Another region may face extreme losses due to off-task teachers and students. Understanding these nuanced differences can help target interventions. At the school level, principals and community members can compare their school to a national average, yet understand the variations in their community and region and gauge their progress against other schools. Finally, the OTL profile can serve as a tool for communities to improve the accountability, governance, and management of schools.
To better support community efforts to monitor and support schools, EQUIP2 will support the introduction, monitoring, and evaluation of strategies to improve collection and use of OTL indicators through the development of a tool that will help local education officials to easily collect OTL data and track the results over time. These tools will be made available in 2010.

58
Opp
ortu
nity
to L
earn
: A h
igh
impa
ct st
rate
gy fo
r im
prov
ing
educ
atio
nal o
utco
mes
in d
evel
opin
g co
untr
ies
ReferencesAbadzi, Helen. 2007a. “Absenteeism and Beyond: Instructional Time Loss and Consequences.” Policy Research Working Paper No. 4376. Washington, DC: World Bank.
Abadzi, Helen. 2007b. “Instructional Time Loss and Local-Level Governance.” Prospects. 37 (1): 13-16.
Abadzi, Helen. 2009c. “Instructional Time Loss in Developing Countries: Concepts, Measurement, and Implications.” World Bank Research Observer. 24 (2): 267-290.
Anderson, Maria Elena. 2001. “Guatemala the Education Sector. Guatemala Poverty Assessment” (GUAPA) Program, Technical Paper No. 2. Washington, DC: World Bank.
Aronson, Julia, Joy Zimmerman, and Lisa Carlos. 1998. Improving Student Achievement by Extending School: Is It Just a Matter of Time? Paper presented at the PACE Media/ Education Writers Seminar, San Francisco, 20 April 1998.
Benavot, Aaron, and Massimo Amadio. 2005. “A Global Study of Intended Instructional Time and Official School Curricula, 1980-2000.” Paper commissioned for the Education for All Global Monitoring Report 2005, The Quality Imperative. Geneva: UNESCO International Bureau of Education.
Berliner, David. 1990. “What’s All the Fuss About Instructional Time?” In The Nature of Time in Schools. Theoretical Concepts, Practitioner Perceptions, ed. M. Ben-Peretz and R. Bromme. New York: Teachers College Press.
Bloom, Benjamin. 1968. “Learning for Mastery.” UCLA Evaluation Comment. 1(2): 1–8.
Brophy, Jere, and Thomas Good. 1986. “Teacher Behavior and Student Achievement.” In The Handbook of Research on Teaching (3rd ed.), ed. M. C. Wittrock. New York: Macmillan.
CARE. 2009. Care’s Work in Guatemala. Atlanta: CARE. http://www.care.org
Carrol, John B. 1963. “A Model of School Learning.” Teachers College Record. 64 (8): 723–733.
CIA. 2009. The World Factbook: Guatemala. Washington, DC: CIA. https://www.cia.gov/.
Clay, Mary. 2000. Concepts about Print: What Have Children Learned about the Way We Print Language? Portsmouth, NH: Heinemann.
Edwards, John. 2002. “Education and Poverty in Guatemala.” Guatemala Poverty Assessment (GUAPA) Program, Technical Paper No. 3. Washington, DC: World Bank.
EQUIP2. 2008. Framework for School Effectiveness Research. Washington, DC: EQUIP2, FHI 360, and USAID.
Fisher, Douglas. 2009. “The Use of Instructional Time in the Typical High School Classroom.” The Education Forum. 73 (2): 168-176.
Gettinger, Maribeth. 1984. “Individual Differences in Time Needed for Learning: A Review of the Literature.” Education Psychologist. 19 (1): 15–19.

59
WO
RK
ING
PAPER: O
pportunity to Learn and Early Grade Reading: Th e cases of Ethiopia, G
uatemala, H
onduras, Mozam
bique, and Nepal
Gillies, John, and Jessica Jester-Quijada. 2008. Opportunity to Learn: A high impact strategy for improving educational outcomes in developing countries. Washington DC: EQUIP2, FHI 360, and USAID.
Greenwood, Charles. 1991. “Longitudinal Analysis of Time, Engagement, and Academic Achievement in At-risk and Non-risk Students.” Exceptional Children. 57 (6): 521-535.
Hollowood, Tia, Christine Salisbury, Beverly Rainforth, and Mary Palombaro. 1995. “Use of Instructional Time in Classrooms Serving Students With and Without Severe Disabilities.” Exceptional Children. 61 (3): 242-253.
Holsinger, Donald B. 1982. “Time, Content and Expectations as Predictors of School Achievement in the US and other Developing Countries: A Review of IEA Evidence.” Paper presented at a Meeting of the National Commission on Excellence in Education, New York, 28 September 1982.
Hossler, Carol-Anne, Frances Stage, and Karen Gallagher. 1988. “The Relationship of Increased Instructional Time to Student Achievement.” Policy Bulletin No. 1. Bloomington, IN: Consortium on Educational Policy Studies.
Jukes, Matthew, Shaher Banu Vagh, and Young-Suk Kim. 2006. Developing Measures of Reading Ability and Classroom Behaviour for Use in Multi-country Evaluations. Washington, DC: World Bank.
Karweit, Nancy. 1985. “Should we lengthen the school term?” Educational Researcher. 14 (6): 9-15.
Levin, Henry M. 1984. Clocking Instruction: A Reform Whose Time Has Come? Palo Alto: The California Institute for Research on Educational Finance and Governance, quoted in Joshua Aronson. 1995. Stop the Clock: Ending the Tyranny of Time in Education. San Francisco: Far West Laboratory.
Lowe, Robert, and Robert Gervais. 1988. “Increasing Instructional Time in Today’s Classroom.” NASSP Bulletin. 72 (19): 19-22.
Massachusetts 2020. 2005. Time for a Change: The Promise of Extended-Time Schools for Promoting Student Achievement. Boston: Massachusetts 2020.
Moore, Mary, and Janie Funkhouser. 1990. More Time to Learn: Extended Time Strategies for Chapter 1 Students. Washington, DC: Decision Resources Corp.
Nelson, Steve. 1990. Instructional Time as a Factor in Increasing Student Achievement. Washington, DC: Office of Educational Research and Improvement.
OECD. 2006. Education at a Glance 2006. Retrieved on February 27, 2010 at www.oecd.org/edu/eag2006.
Quartarola, Bob. 1984. A Research Paper on Time on Task and the Extended School Day Year and Their Relationship to Improving Student Achievement. Burlingame, CA: Association of California School Administrators.
Save the Children. 2006a. Metodología del Programa de Educación. Guatemala City: Save the Children.
Save the Children. 2009b. Guatemala. Westport, CT: Save the Children.
Snow, Catherine, Susan Burns, and Peg Griffin. (1998). Preventing Reading Difficulties in Young Children.

60
Opp
ortu
nity
to L
earn
: A h
igh
impa
ct st
rate
gy fo
r im
prov
ing
educ
atio
nal o
utco
mes
in d
evel
opin
g co
untr
ies
Committee on the Prevention of Reading Difficulties in Young Children, National Research Council.
Scheerens, Japp. 2000. Improving School Effectiveness. Paris: UNESCO International Institute for Education Planning.
Stallings, Jane, and David Kaskowitz. 1974a. Follow Through Classroom Observation Evaluation. Washington, DC: Office of Education.
Stallings, Jane. 1978b. “The Development of the Contextual Observation System.” Paper presented at the Annual Meeting of the American Educational Research Association, Ontario, 27-31 March 1978.
Stallings, Jane. 1980c. “Allocated Academic Learning Time Revisited, or Beyond Time on Task.” Educational Researcher. 9 (11): 11-16.
Stallings, Jane, and H. Jerome Freiberg. 1991d. “Observation for the Improvement of Teaching.” In Effective Teaching: Current Research, ed. H. Waxman and H. Walberg. Berkeley, CA: McCutchan Publishing Corporation.
UNSECO. 2006a. Education Counts: Benchmarking Progress in 19 WEI Countries. Montreal: UNSECO.
UNESCO & LLECE. 2008b. Los aprendizajes de los estudiantes de América Latina y el Caribe. Resumen Ejecutivo del Primer Reporte de Resultados del Segundo Estudio Regional Comparativo y Explicativo. Santiago: UNESCO and LLECE.
UNESCO. 2009c. EFA Global Monitoring Report 2009. Paris: UNESCO.
Vaughn, Sharon and Sylvia Linan-Thompson. 2004. Research-Based Methods of Reading Instruction: Grade K-3. Alexandria, VA: Association for Supervision and Curriculum Deve.
Villegas-Reimers, Eleonora. 2003. Teacher Professional Development: an International Review of the Literature. UNESCO: International Institute for Educational Planning.
Virginia Department of Education. 1992. Instructional Time and Student Learning: A Study of the School Calendar and Instructional Time. Richmond: Virginia Department of Education.
Zhang, Yanhong, Neville Postlehwaite, and Aletta Grisay, eds. 2008. A View Inside Primary Schools. Montreal: UNESCO.

61
WO
RK
ING
PAPER: O
pportunity to Learn and Early Grade Reading: Th e cases of Ethiopia, G
uatemala, H
onduras, Mozam
bique, and Nepal


63
POLIC
Y BRIEF: School Eff ectiveness: Im
proving the Use of Financial Investm
ents in Education
School Effectiveness: Improving the Use of Financial Investments in Education
IntroductionThe global economic recession has had severe impacts on developing countries. As global economic growth declined from 5.2 percent in 2007 to approximately -0.6 percent in 2009, economic growth in developing countries fell from 8.3 percent to 2.5 percent (International Monetary Fund, 2010). As the lowering of foreign direct investment, export revenue (including tourism revenue), and remittances have impeded economic growth and employment in developing countries, there are indications that progress towards the Millennium Development Goals (MDGs) is slowing, and in some cases, has reversed. In this context, governments are increasingly looking to save costs and identify cost-effective interventions that improve education without using large amounts of resources.
In a time when ministries of education need cost-effective solutions, research conducted by the United States Agency for International Development (USAID)-funded Education Quality Improvement Program 2 (EQUIP2) identifies various ways in which schools can more efficiently use existing resources to improve student learning. A series of EQUIP2 studies, which looked at time loss in schools across five countries, found that in many cases poor management of schools leads to the equivalent loss of more than 50 percent of the school year. The primary causes of lost time are schools opening late or closing early, teacher and student absenteeism, poor management of time during the school day, and time-off-task in the classroom. These time losses severely diminish the amount of instruction students receive in a school day. This policy brief calculates the estimated dollar value of time loss in 3 of the 5 countries where data was available in order to show policy-makers how poor management detracts from opportunities for students to learn.
Opportunity to LearnEQUIP2 has defined 12 factors that affect a child’s opportunity to learn (OTL). The opportunity to learn begins when school is open, teachers and students are present, and classroom time is managed so that the time spent on instruction is optimized. Simply stated, more effective schools do a better job ensuring a basic opportunity to learn. This study examines the following five factors which can be used to measure some aspects of school effectiveness:
• PercentageofDaysSchoolisOpen• TeacherAttendanceRates• StudentAttendanceRates• PercentageofDaysAvailableforInstruction• PercentageofTime-on-TaskintheClassroom
Equivalent Days of SchoolingEQUIP2 collected school-level data in Guatemala, Honduras, and Nepal to measure each of the five OTL factors listed above. These factors are used as the basis for calculating the yearly equivalent amount of days lost. In each country’s sample schools, as depicted in Figure 1, teachers and students were engaged in instructional activities for the equivalent of less than 50 percent of the available days for instruction (Moore, DeStefano & Adelman, 2010).

64
Opp
ortu
nity
to L
earn
: A h
igh
impa
ct st
rate
gy fo
r im
prov
ing
educ
atio
nal o
utco
mes
in d
evel
opin
g co
untr
ies
Figure 1. Equivalent Days of Schooling Available for Teaching and Learning
180
200192
175186
174
146
175158
135
170
97
139 145
56
7887
0
50
100
150
200
250
Guatemala Honduras Nepal
Official Days
School Closed
Teacher Absence
Student Absence
Daily Time Use
Time on Task
Source: Moore, DeStefano & Adelman, 2010
Guatemala, Honduras, and Nepal have official school calendars that respectively include 180, 200, and 192 days of instruction. This is represented by the first bar in each grouping in Figure 1. Each subsequent bar shows the number of equivalent days remaining after accounting for the time lost due to each OTL factor. For example, Guatemalan schools in the study sample were closed the equivalent of 5 days per year when they should have been open, reducing the available days for instruction from 180 to 175. When all factors are accounted for, Guatemalan schools in the sample had the equivalent of just 31 percent of the official number of school days devoted to instruction. The opportunity to learn in the schools researched in Honduras is equivalent to only 39 percent of the full school year. In sample schools in Nepal, the equivalent of 45 percent of available school days is used for instruction (Moore, et al., 2010).
The Cost of Lost Opportunity to LearnThe lack of opportunities to learn in these studies’ schools translates into significant amounts of lost time. Lost time equates to wasted resources. To calculate the amount of resources lost because of inefficient use of time at the school level, EQUIP2 estimated the average expenditure per school based on each country’s national primary school budget. Those estimates were used to quantify the dollar value of the time lost at the school level.
The Guatemalan sample consisted of 26 institutions, 20 of which were Save the Children-supported. On average, a school in Guatemala has an annual budget estimated at $24,544 (UNESCO, 2008). Of that, 69% is wasted because the equivalent of only 56 out of 180 possible school days are available as a basic opportunity for students to learn. Of the five OTL factors researched in this study, poor time-on-task (effectively time-off-task) accounted for the largest portion of equivalent time lost (41 days) and therefore the largest share of wasted resources (the equivalent of 23% of the budget). The time in the daily schedule not used for academic purposes equates to an additional loss of 21% of the budget (the equivalent of 38 lost days).

65
POLIC
Y BRIEF: School Eff ectiveness: Im
proving the Use of Financial Investm
ents in Education
In Honduras, 33 institutions were included in the research, 27 of which were CARE-supported schools. In Honduras, 61% of the average annual school budget of $20,618 is wasted because the opportunity to learn actually provided in sample schools equates to just 78 of the 200 possible days for instruction (Honduras Ministry of Education, 2009). Again, time-off-task represents the largest portion of equivalent time lost (61 days) and therefore the biggest waste of education resources (the equivalent of 30% of the budget). Teacher absences by themselves waste 6% of the budget (the equivalent of 12 days per year).
In Nepal, 55% of an average school budget of $25,075 is wasted (UNESCO, 2008). Time-off-task equates to 30% of the budget (or 58 days of instruction) wasted and unplanned school closures waste an additional 9% (or 18 days of instruction). The Nepali sample consisted of 23 institutions, and does not include data on student attendance, so in fact over-estimates the opportunity to learn.
The data presented represents a sample of schools in a few countries around the world. The implications of such results on a national or global scale could be greatly more significant. Figure 2 shows what equivalent share of a sample school’s budget goes to assuring opportunity to learn and what portions are wasted due to each type of lost opportunity to learn.
Figure 2. Equivalent Share of School Budget for Opportunity to Learn
Cost Effectiveness of LearningNot surprisingly, the low provision of OTL at the schools in this study corresponds with low learning outcomes. Students in each of these studies’ schools were given an early grade reading assessment that measures, among other things, oral reading fluency. Reading ability is both an outcome of OTL and a determinant of a student’s future ability to learn and advance through their education (Moore, et al., 2010). A growing body of international evidence points to a minimum oral reading fluency of between 40 and 60 wpm for students who are emergent readers (Abadzi,

66
Opp
ortu
nity
to L
earn
: A h
igh
impa
ct st
rate
gy fo
r im
prov
ing
educ
atio
nal o
utco
mes
in d
evel
opin
g co
untr
ies
2006; Gove and Cvelich, 2010). By setting a target reading fluency of 60 wpm, it is possible to calculate the cost per student to reach this desired learning outcome. For each sample school, the cost to educate the students was calculated by multiplying the average annual national cost per student by the number of years the children were in school at the time of the assessment. That cost to educate the students was then divided by the percentage of students in the sample school that achieved the learning outcome. The results can be seen in the following table.
Table 1. Cost per Learning Outcome
Average Cost per
Student% of Students Above 60
wpm in Grade 3
Cost per Learning Outcome (60wpm) in
Grade 3Guatemala $90 31% $726Honduras $226 66% $855
Nepal $55 13% $1,050
In each case, the education system is using many more resources than necessary to obtain the outcome of students being able to read 60 wpm by Grade 3. For example, 2.5 years of schooling in Guatemala costs $90 per student (at the prevailing average cost). However, producing a Grade 3 student able to read 60 wpm cost eight times that amount. The lost opportunities to learn and the associated wasted resources considerably raise the cost of producing the desired learning outcome.
Increasing Cost EffectivenessInefficiencies in educational systems result in a significantly sub-standard use of time in classrooms, which leads to the inefficient use of resources, and hence, poor learning outcomes. However, by making small improvements to the provision of OTL, schools can increase instructional time with the resources currently available to them.
For example, on average, teacher salaries represent 90 percent of school budgets. Each day a salaried teacher reports to work, students receive one day of budgeted academic instruction. However, if a teacher does not report to work, the school receives no benefit for that day’s expenditure of the teacher’s salary. The school also loses the equivalent of one day of instruction for every one of the teacher’s students. In this manner, teacher absences at the Guatemalan schools in this study equate to wasting $3,954 per year at each school (the loss of the equivalent of 29 days of instruction). If schools in Guatemala could increase the teacher attendance rate to 95 percent, it would equate to the more efficient use of some $2,761 and 20 more days of instruction.
It cannot be assumed that schools will be open, with teachers in attendance, and students ready to learn each day. The findings of these studies show quite the opposite; more often than not, these basic elements of education are lacking. School closures are frequent and irregular, teacher and student attendance rates are erratic, and time during the school day is often lost due to late starts, early dismissals, extended recesses and transition periods, and time-off-task. Efforts to improve education outcomes introduced in these inefficient systems are not likely to achieve the desired objectives. Insufficient amounts of opportunity to learn, or more simply, teacher-student contact time, need also to be addressed if resources expended to improve quality are not to end up wasted.
ConclusionOTL factors have been directly linked to current and future student successes and should therefore be given priority by national and local governments, schools, and organizations that assist and track educational systems in developing countries. A more efficient use of instructional time will result

67
POLIC
Y BRIEF: School Eff ectiveness: Im
proving the Use of Financial Investm
ents in Education
in spending higher percentages of education budgets productively and lowering costs per learning outcome; additionally, it will result in the ability to more accurately determine the effectiveness of programs and interventions introduced to schools. The use of OTL as an indicator of efficient spending allows for the consideration of how to spend available resources differently, rather than seeking out additional funding for inefficient education systems.
68
Opp
ortu
nity
to L
earn
: A h
igh
impa
ct st
rate
gy fo
r im
prov
ing
educ
atio
nal o
utco
mes
in d
evel
opin
g co
untr
ies
ReferencesAbadzi, H. (2006). Efficient Learning for the Poor: Insights from the Frontier of Cognitive Neuroscience. Washington, D.C.: World Bank.
Honduras Ministry of Education. (2009). “Management Objectives and Results by Institution.” Viewed at http://www.sefin.gob.hn/portal_prod/data/2009/DGP/PresupuestoAprobado2009/egresos/r_fpr_objres_ges_50_.pdf
International Monetary Fund. (2010). “World Economic Outlook Update.” Viewed at http://www.imf.org/external/pubs/ft/weo/2010/update/02/pdf/0710.pdf
Levin, H & McEwan, J. (2001). Cost-Effectiveness Analysis. Second Edition. New York: Sage Publications, Inc.
Moore, A.S, DeStefano, J. & Adelman, E. (2010). Opportunity to Learn as a Measure of School Effectiveness in Ethiopia, Guatemala, Honduras, and Nepal. Washington, D.C.: FHI 360.
UNESCO Institute for Statistics. “Finance Indicators by ISCED Level.” (2008). Viewed at http://stats.uis.unesco.org/unesco/TableViewer/tableView.aspx?ReportId=172

69
POLIC
Y BRIEF: School Eff ectiveness: Im
proving the Use of Financial Investm
ents in Education


71
CASE ST
UD
Y: CASE ST
UD
Y: Using O
pportunity to Learn and Early Grade Reading Fluency to M
easure School Eff ectiveness in Ethiopia
Using Opportunity to Learn and Early Grade Reading Fluency to Measure School Effectiveness in Woliso, Ethiopia
Executive SummaryIn 2008, the Educational Quality Improvement Program 2 (EQUIP2), in partnership with Save the Children, conducted a study of school effectiveness in Ethiopia. Data were collected from 24 schools (15 community and 9 government schools) in Woliso, Dendi, Goro, and Bacho, four adjoining districts located about two hours southeast of Addis Ababa in the Oromo Region. All of the community schools and three of the government schools included in the study were supported under a Save the Children project. The study aimed to determine whether schools provide adequate opportunities to learn and whether teachers and students use those opportunities to ensure that children learn to read fluently in the language of instruction (Afan Oromo) by Grade 3.
The study found that few children at the start of Grade 3 had learned to read fluently enough to ensure comprehension. Thirty-six percent of the students could not read a single word of either Grade 2 or 3 level text. Only 15 percent of the students could read at a rate of 40 words per minute (wpm) or faster, a rate that may be fluent enough to ensure comprehension. Though most of the students read below a desirable level for Grade 3, almost all students were found to have adequate pre-literacy skills (knowing letters and the ability to properly orient themselves in relation to text). Differences in reading fluency between girls and boys were not pronounced, but one sub-group of children (boys who reported working outside their home for money) had reading fluency levels 23 percent below those who did not work to earn money. We also found that the percentage of Grade 3 children able to read fluently varied considerably across schools. The biggest difference across schools was in the percentage of students who could not read at all, ranging from no students in that category to 75 percent of students not being able to read a single word.
The data collected on opportunities to learn reveals that the overall low performance of students in reading was, in part, attributable to the amount of potential instructional time not used in these schools. School being closed and teacher and student absence combined to reduce the amount of time available for instruction by as much as 43 percent in government schools and 29 percent in community schools. Overall, the equivalent of 43 out of the 203 days in the school year was lost in community schools and 60 days in government schools.
The actual time available for instruction—the time when school was open and teachers and students were present—was further reduced by the manner in which teachers and students used time during class. Observations of student and teacher activity in Grade 1, 2, and 3 classrooms revealed that, on average, 64 percent of students were not engaged in learning (i.e., off task) during a lesson. Students were most frequently off task when the teacher was off task (i.e., the teacher was not actively leading a lesson or assigning activities to the students). When these measures of time-on-task were taken into account, we found that schools lost the equivalent of an additional 91 days of potential instruction time because of off-task students and teachers.
Closer examination of the data on classroom activity determined the amount of time students spent on reading-related activities. Students were noted doing any reading activities during only 11 percent of the classroom observations, and during those reading-related activities, only one-third of the students were engaged.

72
Opp
ortu
nity
to L
earn
: A h
igh
impa
ct st
rate
gy fo
r im
prov
ing
educ
atio
nal o
utco
mes
in d
evel
opin
g co
untr
ies
The low levels of reading fluency noted in the students we tested is most likely attributable to the vast amount of wasted potential instructional time. School being closed, teachers and students being absent, and most significantly, poorly structured lessons and lack of engagement in instructional activities all reduced actual instructional time to less than one-third of the officially allocated time. Furthermore, we observed little instruction in reading, very little student use of books or other written materials, and almost no students reading.
This research demonstrates that: a) teacher and student attendance need to be more closely monitored and the factors that impact them addressed; b) the daily school schedule needs to be better managed to ensure adequate time for reading instruction in the early grades; and c) teachers need to learn instructional strategies to ensure that students are engaged in reading or reading-related exercises. Furthermore, given the low levels of reading fluency, schools need strategies for building the reading skills of students throughout the primary grades, as few, if any, of them are learning to read well enough to learn across all subject areas.
IntroductionSave the Children USA has had considerable success working with communities and education authorities in the Ethiopian districts (woredas) of Woliso, Bacho, Dendi, and Goro to establish schools in villages where they had not previously existed. Almost 9,000 children previously unlikely to go to school now walk short distances to attend classes each day. However, Save the Children was not satisfied with only ensuring greater access to schooling and chose to collaborate with EQUIP2 to assess the effectiveness of the schools in providing a quality education. This study measures school effectiveness in these Save the Children schools, as well as government schools, by examining children’s reading abilities and schools’ provision of consistent, quality opportunities to learn. We hope this study helps improve the quality of education available not only in these districts, but throughout Ethiopia.
Background and frameworkProgress toward providing education for all requires countries to identify and employ models of effective schooling that can reach rural, poor children. Beginning in 2003, the Education Quality Improvement Program 2 (EQUIP2) examined whether complementary, community-based schools were such a model. Through a series of ten case studies titled Meeting EFA: Reaching the Underserved through Complementary Models of Education, EQUIP2 developed a methodology for assessing complementary programs’ cost-effectiveness in terms of providing access, ensuring completion, and promoting learning.
Based on this research, EQUIP2 found that some programs supporting complementary models are more cost-effective than their public school counterparts in part because they offer a more consistent opportunity to learn. Complementary program schools were found to share a number of characteristics: schools are located near students, school schedules are adjusted to fit the local lifestyle, student attendance is more regular, locally recruited teachers attend more regularly, and the curriculum is scaled back to focus on core skills.
To build on these findings, EQUIP2 examined opportunity to learn as a framework for understanding how schools can improve teaching and learning. In Opportunity to Learn: A high impact strategy for improving educational outcomes in developing countries EQUIP2 identified and justified eight1 factors of a foundational opportunity to learn:
1 EQUIP2 originally identified these 8 factors, which were later expanded to 12 factors based on the findings from the case studies in Guatemala, Honduras, and Nepal. For more information on the expanded factors, please see EQUIP2’s synthesis of its school effectiveness case studies, Using Opportunity to Learn and Early Grade Reading Fluency to Measure School Effectiveness in Ethiopia, Guatemala, Honduras, and Nepal.

73
CASE ST
UD
Y: CASE ST
UD
Y: Using O
pportunity to Learn and Early Grade Reading Fluency to M
easure School Eff ectiveness in Ethiopia
1. Amount of instructional time available in the school year; 2. Frequency of school closures and distance from students;3. Teacher attendance;4. Student attendance;5. Student–teacher ratios;6. Availability and use of instructional materials;7. Time-on-task within the school day and within lessons; and8. Development of reading skills in early grades.
To understand how these factors interact to promote learning, better tools for evaluating student literacy skill development are needed. One drawback of the EQUIP2 complementary education research was the scarcity of data on student learning outcomes. The use of proxies such as end-of-cycle exams is not ideal because, as Thomas Kellaghan has noted, such exams discriminate between high achieving students rather than reflect the range of all students’ performance. USAID investment in early grade reading assessment (EGRA) methodologies offered EQUIP2 a chance to expand its research on school effectiveness.
EGRA provides a methodology for quickly assessing a variety of early literacy skills, which can be used to gauge school and/or system effectiveness at fostering acquisition of those skills. The EdData II project in particular has been instrumental in promoting and improving EGRA and has supported its application in almost 20 countries. However, one of EGRA’s limitations is the floor effect: It does not measure the skills of students unable to read letters, words, or connected text. To remedy this, the Concepts About Print (CAP) methodology was used to evaluate pre-reading skills in students who are non-readers.
The combination of the opportunity to learn framework, EGRA, and CAP is the inspiration behind EQUIP2’s research on effective schools. This research is based on the idea that school effectiveness, as measured by whether the school enables children to learn to read, is a function of how well the school ensures an opportunity to learn and whether it draws on teaching approaches that make the best use of instructional time. With this in mind, the study attempts to answer the following research questions:
• Are schools effective? – Are students able to read fluently by Grade 3? – Do the schools ensure that students receive an adequate opportunity to learn?
• What factors account for variations in school effectiveness? – What explains variations among individual students’ ability to read fluently? – What explains variations in school effectiveness?
Through the partnership, Save the Children gave EQUIP2 access to an area in Ethiopia in which Save the Children operates schools and lent the services of a research intern. This paper presents the results of this collaboration between Save the Children and EQUIP2 in Ethiopia.
ContextAmid rolling fields of wheat and teff 114 km southeast of Addis Ababa, lies the rural, impoverished district of Woliso. Woliso is in Ethiopia’s Oromo Region, one of the country’s nine regions, each of which is responsible for providing its children with education programming. With the advent of regionalization in the mid-1990s, local languages have been the media of instruction in primary schools. Afan Oromo is the language of instruction in all the schools included in this study.
In 2001, Save the Children began providing access to basic education for children living in remote areas of Woliso and the adjoining districts of Bacho, Dendi, and Goro. Save the Children manages

74
Opp
ortu
nity
to L
earn
: A h
igh
impa
ct st
rate
gy fo
r im
prov
ing
educ
atio
nal o
utco
mes
in d
evel
opin
g co
untr
ies
four programs from its Woliso office, focusing on primary education, early childhood development, school health and nutrition, and adolescent development. The primary education program includes two main components. One encourages remote villages to create community-based schools with the goal of transferring the schools to the formal government system. The other component helps existing government schools build classrooms, install water sources, supply student desks, and provide vitamin supplements and de-worming treatment. As summarized in Table 1, there are just over 100 schools in this target area serving more than 63,000 students.
When establishing a school, Save the Children helps create and train members of a parent-teacher association and contributes 85–90 percent of school construction costs. The association decides the school’s location, mobilizes local contributions (communities contribute about 10 percent of operating costs), and manages the school’s operations. The school’s management committee selects paraprofessional teachers, to whom Save the Children provides honoraria payment, ongoing support, and training (Save the Children pays for select staff enrollment in government-run teacher training programs). As teachers complete their formal training and become certified, they are placed onto the government payroll. Once all teachers are certified, a community school is converted to an official government school.
Table 1: Basic information about schools in the target area
Community Government Total
Total Number of Schools 28 73 101 Total Enrollment 5,887 57,757 63,644
% girls 48% 45% 47%
Schools in Woliso 12 32 44 Dendi 11 - 11 Goro 5 17 22
Bacho - 34 34
Schools receiving support: 28 22 49 for more than 5 years 9
for 3 or 4 year 9 new in 2008 10
Sampling and Methodology
SamplingTo select the sample, we eliminated schools that did not include Grades 1 through 3, that did not teach in Afan Oromo, or that were government schools located in towns (a sign that the school was too large for the study). This reduced the universe of schools from 101 to 74. From those we chose 24 for the sample; the number that could be studied in the time available. Schools were selected according to size, distance from a main town, and duration of Save the Children support. School size was divided into three categories: small (enrollment of less than 200 students); medium (200 to 400); and large (400 to 600). Distance from town was divided into four categories: less than 10km; 10 to 20; 20 to 30; and over 30. Years of support was divided into three categories: newly supported in 2008; supported for 3 to 5 years, and supported for 6 to 7 years. The characteristics of sample schools are summarized in Tables 2 and 3.

75
CASE ST
UD
Y: CASE ST
UD
Y: Using O
pportunity to Learn and Early Grade Reading Fluency to M
easure School Eff ectiveness in Ethiopia
The sample included 15 community and 9 government schools. All of the community schools in the sample have been supported by Save the Children. Only three government schools received some support from SC, although the length of support was not known. The other six government schools were considered the control group, as they received no support from Save the Children. Many of the schools serve students in both the morning and afternoon.
Table 2: Characteristics of sample schools by type
Community Government Total
Total Number of Schools 15 9 24 Receiving SC support: 15 3 18
for 5 years or more 7 for 3 or 4 year 5
new in 2008 3
Total Enrollment 4,480 3,035 7,515 Grade 3 Enrollment 1,045 581 1,626
Average Grade 3 class size 44 48 46
Table 3: Characteristics of sample schools by schoolCommunity Schools (CS)
Total Enrollment
Distance from district
town
Years in the SC
Program
Teacher Years
Experience
% Female
Teachers
% teachers with TTI
Chancho Soyoma 258 < 10 km 6 4.1 43% 86%
Haro Abdi 330 < 10 km 4 3.8 38% 88%
Worka Kore 192 < 10 km new 1.8 38% 75%
Jemjem Lega Batu 203 10 - 20 km new 2.3 44% 89%
Kono Lafe Arba 338 10 - 20 km 5 4.3 63% 88%
Maru Babeli 429 10 - 20 km 5 4.3 33% 100%
Soma 179 10 - 20 km 3 2.0 50% 38%
Tiki Doyo 322 10 - 20 km 3 1.9 71% 43%
Derare Ebicha 319 20 - 30 km 5 4.4 13% 75%
Handhura Maru 245 20 - 30 km 5 2.8 25% 88%
Mekena Rogda 231 20 - 30 km 3 2.0 25% 25%
Maru Sombo 340 20 - 30 km 7 4.2 33% 50%
Honche Bite 317 20 - 30 km new 1.8 33% 33%
Jelisa Cheka 281 > 30 km 4
Kennera Labu 496 > 30 km 7 4.7 0% 90%
CS Totals 4480 3.2 36% 39%

76
Opp
ortu
nity
to L
earn
: A h
igh
impa
ct st
rate
gy fo
r im
prov
ing
educ
atio
nal o
utco
mes
in d
evel
opin
g co
untr
ies
Government Schools (GS)
Total Enrollment
Distance from district
town
Support Received from SC*
Teacher Years
Experience
% Female
Teachers
% teachers with TTI
Dilallaa 718 < 10 km 4 21.1 30% 90%
Kantero Bido 215 10 - 20 km 1 0.8 50% 100%
Hale Koya 400 > 30 km 3 1.4 14% 86%
Gambela Goro ** 254 < 10 km - 2.6 80% 80%
Besa** 222 10 - 20 km - 0.3 0% 100%
Chirecha Busa Tedira** 212 10 - 20 km - 2.4 40% 100%
Gudina Boru** 428 10 - 20 km - 3.2 17% 100%
Biftu** 203 20 - 30 km - 0.8 0% 100%
Wasarbi Gabreli** 383 20 - 30 km - 0.7 14% 100%
GS Totals 3,035 3.7 27% 95%
** Control School Totals 1,702 1.7 25% 97%
Grand Total 7,515 3.4 33% 79%* The number in the column “Support Received from SC” in the case of government schools indicates how many out of the five possible types of support (deworming, furniture, wells, latrines or additional classrooms) the government school has received. ** The six government schools from the same geographic area that are included in the sample, but that received no support from Save the Children, are considered control schools for the sake of this study.
MethodologyThe research team spent one day visiting each school. A visit consisted of six activities:
• Two general observations at different times during the visit noting the presence of certain school facilities and whether students and teachers were inside or outside the classroom;
• One hour observations of student and teacher activity in Grade 1, 2, and 3 classrooms; • A school director survey addressing student enrollment and attendance, teacher attendance,
support visits received by the school, and the relationship between the school and the community/parents;
• Interviews with teachers from Grades 1, 2, and 3 to cross-reference results from the school director surveys;
• Student surveys inquiring about schooling and home life; and• A battery of student reading tests.
For the student survey and reading tests, the team randomly selected 20 students from Grade 3 at each school in a boy-to-girl ratio reflective of the gender balance in the full class. The tests included CAP questions to assess pre-reading skills and student familiarity with printed text and books and EGRA components to assess the number of letters recognized in isolation, the number of words read correctly in isolation, and the number of words read correctly in context per minute. The number of words read correctly per minute was used as the measure of reading fluency, a recognized and robust index of reading comprehension that reliably differentiates between strong and poor readers as demonstrated in Matthew Jukes’ 2006 study, Development of Assessments of Reading Ability and Classroom Behavior.

77
CASE ST
UD
Y: CASE ST
UD
Y: Using O
pportunity to Learn and Early Grade Reading Fluency to M
easure School Eff ectiveness in Ethiopia
Working with Ethiopian Save the Children staff, we composed a passage using vocabulary modeled on story books from local libraries and Grade 3 textbooks. (There were no reading passages in school textbooks for Grades 1 through 3, the team simply used vocabulary found in these books.) We similarly composed a Grade 2 passage and students were asked to read both. Finally, students were asked one, two, or three comprehension questions depending on how far they read in the passage.
Table 4: Characteristics of students in the sample
Number of Grade 3 students tested 456
Boys 234 51%
Girls 222 49%
Language spoken as mother tongue:
Afan Oromo 416 91%
Gurage 28 6%
Amharic 12 3%
Average age (years) 10.5
% over age (older than 10 years) 71%
% who attended kindergarten 28%
% who did not repeat a grade 77%
% who live 10 min. or less from school 37%
% who walk 10 to 30 min. to school 45%
% who walk more than 30 min. to school 17%
Average family size 6.8
% of students who earn money for work 26%
% who have in their home: - a radio 82%
a toilet 77%
electricity 13%
a television 3%
a refrigerator 2%
three or more of the above 11%
As shown in Table 4, sampled students are evenly divided between boys and girls and most children speak Afan Oromo at home (91 percent), are overage (71 percent are older than 8 years), live within 30 minutes of school (82 percent), did not attend kindergarten (72 percent), have not repeated a grade (77 percent), and are from similar socio-economic backgrounds.
Limitations of the StudyWhile the data from this study are robust and representative of education in these Ethiopian districts, there are important limitations to the methodology and data. The research was conducted at the start of the school year, so data on school opening and teacher and student attendance may not be representative of the full year. In addition, the study did not capture time loss due to late opening and early close, so it is likely that the estimates of available instructional time are overly optimistic. Low student performance on the reading assessment may be affected by their unfamiliarity with EGRA and the fact that reading abilities are probably at a low point after two months of vacation in environments that generally lack reading materials. We acknowledge that CAP and EGRA are not comprehensive measures of learning, but are targeted evaluations of student performance in pre-reading and reading. Our classroom observations also often covered

78
Opp
ortu
nity
to L
earn
: A h
igh
impa
ct st
rate
gy fo
r im
prov
ing
educ
atio
nal o
utco
mes
in d
evel
opin
g co
untr
ies
lessons in more than one subject area; however the use of time in class was fairly consistent across all subjects observed. Finally, the interview protocols and questionnaires were developed in English and translated and culturally adapted into Afan Oromo, after which the responses were translated back into English for analysis. It is likely that some errors occurred while moving between languages.
FindingsOverall ResultsWe found strong relationships between the results of each EGRA component: letter recognition, word recognition, and reading fluency of text from Grades 2 and 3 were all highly correlated. Therefore, we used Grade 3 reading fluency as the indicator of student literacy. Letter recognition and CAP were used to examine the pre-reading skills in the students with the lowest reading fluency scores.
Many students in the sample schools in Woliso, Bacho, Dendi, and Goro were struggling to learn to read. As the frequency distribution depicted in Figure 1 shows, students unable to read made up the largest group at the beginning of Grade 3 (36 percent of those tested). Almost three-quarters of students read 30 words per minute (wpm) or less. In contrast, 15 percent read with a fluency of over 40 wpm.
For students with low levels of reading fluency, we examined their letter recognition and CAP results to determine their position on the path toward literacy acquisition. These findings are summarized in Table 5 and indicate a relationship between CAP questions, letter recognition, fluency of letter recognition, and ability to decode words. Students who read zero wpm answered correctly about 6 of 10 CAP questions and could read correctly about 20 out of 26 letters. Students able to minimally decode words (1–10 wpm) did better on the CAP questions and letter recognition. In all cases, students with minimal to no word reading ability at least had pre-reading skills.
Figure 1: Reading fluency results, percentage of students who could read
Table 5: Test results for students with low levels of fluencyZero words per
minute1–10 words per
minute
Number of students 165 69
Average # of correct CAP questions 6.2 7.3
Average # of letters read correctly 19.7 24.9
Average # of letters read per minute 32.9 53.1

79
CASE ST
UD
Y: CASE ST
UD
Y: Using O
pportunity to Learn and Early Grade Reading Fluency to M
easure School Eff ectiveness in Ethiopia
Reading comprehension was assessed based on a set of one, two, or three questions asked after the reading passage, depending on how far the student read. The students who could not read were not asked the comprehension questions. Figure 2 depicts the relationship between reading fluency and the number of questions students were asked and correctly answered.
Figure 2: Reading fluency and number of questions asked and answered
43.945
50
60
70 Bars: Students answering the given number of questions
(left axis)
Diamonds: Average WPM of that group of students
(right axis)
35.9 35
40
50
27.8
31.5
25
3040
18.3
21.5
15
20
20
30
6.5 7.5
11.2
5
10
10
00
0/1 1/1 0/2 1/2 2/2 0/3 1/3 2/3 3/3
N = 51 N = 97 N = 137
The students who were asked only one question had read the least of the given text. Therefore it is not surprising that they had the lowest reading fluency scores and that most answered the question incorrectly. Those students asked all three questions clearly read more words per minute and almost 80 percent (who also read over 35 wpm) answered at least two of the questions correctly.
Results for Different Groups of StudentsTable 6 shows the average reading fluency results by type of school, district, and student mother tongue. On average, Grade 3 community school students read 19.0 wpm correctly compared to 14.2 wpm for government school students. Control schools, as a subset of government schools, had an average reading fluency of 13.6 wpm. These differences were significant, but the effect size of differences between groups as a source of this variation is negligible (less than 2 percent). Most of the variation arises from differences between students within groups. In community schools, students in Woliso read with much greater fluency than those in Dendi and Goro. Students in government schools in Bacho read less well than those in government schools in Goro and Woliso although the differences, while significant, were not as pronounced as those with community schools.
More important than the variation among sub-groups at schools was the variation in student reading fluency from school to school. As shown in Table 6, the students of some schools performed much better than students in others. The frequency distribution of student reading fluency results, shown previously in Figure 1, indicated an overall distribution that is skewed toward zero wpm. The percentage of students who could not read a word on the EGRA was an important determinant of the variation of performance across schools. Figure 3 shows how the percentages of students in four categories of reading fluency varied from school-to-school. Each set of horizontal bars represents one school. The four colors correspond to four levels of reading fluency: zero wpm, 1 – 20 wpm, 21-40 wpm, and over 40 wpm.

80
Opp
ortu
nity
to L
earn
: A h
igh
impa
ct st
rate
gy fo
r im
prov
ing
educ
atio
nal o
utco
mes
in d
evel
opin
g co
untr
ies
Figure 3: Reading fluency result variation among schools
Zero wpm 1 to 20 wpm 21 to 40 wpm > 40 wpm
n Sample
Scho
ols in
0% 25% 50% 75% 100%
% of Students
Table 6: Reading fluency resultsAverage Words Per Minute
Community All Govt Control
By type of school 19.0 14.2 13.6
By district Community All Govt
Bacho - 13.5
Dendi 10.3 -
Goro 12.5 14.4
Woliso 23.0 14.5
By mother tongue Woliso Bacho Dendi Goro
Amharic 25.3 1.0
Afan Oromo 22.4 13.5 10.3 15.3
Gurage 13.5 6.2
Top Performing Schools Average wpm % not reading Govt/Comm SC Support
1 41.0 5% C 5
2 31.2 5% C 7
3 25.5 15% C 5
4 23.2 0% C 5
5 22.9 30% C 5
Lowest Performing Schools Average wpm % not reading Govt/Comm SC Support
1 5.5 75% C 3
2 7.4 65% C new
3 7.6 47% G no
4 10.6 65% C new
5 11.6 40% G noWoliso students speaking Afan Oromo, Amharic, and Gurage read more fluently than their peers with the same mother tongues in the other districts. Gurage and Amharic speakers in Goro had the lowest reading fluency scores.

81
CASE ST
UD
Y: CASE ST
UD
Y: Using O
pportunity to Learn and Early Grade Reading Fluency to M
easure School Eff ectiveness in Ethiopia
The percentage of students able to read more than 40 wpm varied between 5 percent and 25 percent at all but two schools. For the most part, similar percentages of students were able to read between 1 and 40 wpm across all schools. The most significant variation across schools occurred in the students reading zero wpm. For the most part, schools with fewer students unable to read performed better overall and schools with larger percentages of students unable to read students performed worse overall. This may imply that out-of-school factors contributed to some students reading fluently while in-school factors determined the percentage of students unable to read.
Understanding the Variation in Student OutcomesThe researchers took two approaches to explore the factors contributing to the variation seen among students, groups of students, and schools. First, we looked at individual student characteristics such as gender, age, and family status to see which, if any, related to variations in student reading fluency. Second, we examined school-level factors such as available instructional time, teacher and student absence, and time-on-task in classrooms.
Individual FactorsBoys had higher average reading fluency than girls, but slightly higher variance. More girls reported missing school the previous week, so boys’ slightly higher reading fluency levels may be related to their higher attendance rate. Age was not consistently related to reading fluency, implying that students who start school at different ages were not learning at different rates.
To gauge socio-economic status, students were asked about the type and size of their home, their families’ possessions and livestock, and whether the student earned money outside of the home. No relationships appeared between reading fluency results and these socio-economic proxy data for individual students, except for students earning income from work outside their homes. These students read at a significantly lower level, with boys in this group reading at a rate 23 percent lower than boys not earning money outside of home. There was not a statistically significant difference between these categories of girls.
In addition to the characteristics of students and their families, we examined students’ schooling experiences. These variables included kindergarten attendance, repetition, shift attendance (morning or afternoon), school absence the week prior to the observation, and distance from school. The most pronounced differences in reading fluency were evident when comparing students who reported missing school the previous week to those who said they did not. Students reporting missing school (21 percent of the sample) read at an average fluency rate almost 50 percent lower than those who said they were present. Two-thirds of the students who reported being absent attended the morning shift.
Repetition was related to differences in the reading fluency of individual students in community schools, but not in government schools. Community school students who reached Grade 3 without repeating had a higher average reading fluency (20 wpm) than those who repeated once (16 wpm), and a much higher average than those who repeated twice (12 wpm).
School FactorsTo look at school-level factors we return to EQUIP2’s opportunity to learn framework. We used the eight opportunity to learn factors both individually and collectively to determine the effectiveness of each school in the study at maximizing opportunities to learn. Recall that the factors include:

82
Opp
ortu
nity
to L
earn
: A h
igh
impa
ct st
rate
gy fo
r im
prov
ing
educ
atio
nal o
utco
mes
in d
evel
opin
g co
untr
ies
1. Amount of instructional time available in the school year; 2. Frequency of school closures and distance from students;3. Teacher attendance;4. Student attendance;5. Student–teacher ratios;6. Availability and use of instructional materials;7. Time-on-task within the school day and within lessons; and8. Development of reading skills in early grades.
Factors 1 through 4: Available Instructional TimeIn this study, we combined factors one through four into a measure termed available time for instruction. The objective was to compare the amount of time actually available to the amount of time theoretically available based on the official school calendar. Actual time was calculated by subtracting time lost from the theoretically available time, where time lost was determined by whether school was open when it should be, whether the school was managed so that teachers attend regularly, and whether the school was conveniently located and therefore easy for students to attend regularly.
Factors 1 and 2: Was school open?In Ethiopia, the official school calendar includes 203 days. We collected data from the sample schools to show the number of days schools had actually been open since the start of the school year. From that base, we projected the equivalent number of days the school would be open for the full year (i.e., if a school was closed 10 percent of the available days since the beginning of the school year, we project a closure rate of 10 percent for the full year).
While no school in the sample was open every day on the school calendar, all but two were open more than 90 percent of the time. Many schools opened after the official start date and most were closed a few days after the first day of school. One school was closed almost all of the first three months of the school year. Government schools were closed more days than community schools.
Factor 3: Were teachers present at school?Teacher attendance data were obtained from each sample school’s official teacher attendance record. Teachers had an average attendance rate of 89 percent on the days school was open. Community school teachers were absent slightly more frequently than government school teachers. Three schools had teacher attendance rates of 70 to 80 percent, nine had teacher attendance rates of 80 to 90 percent, and nine had attendance rates above 90 percent.
Factor 4: Did students attend school regularly?The data obtained from schools’ official attendance books indicated that students in most schools were present more than 90 percent of the time over the first months of the school year. Only one school had an attendance rate lower than 90 percent (84 percent). All schools tended to draw students from their surrounding villages. More than 80 percent of the students in the sample live within a 30 minute walk to school, with 73 percent walking less than 10 minutes to and from school. This may account for the fairly high attendance rates.
The attendance data in the official register was cross-checked by verifying attendance in the observed classrooms. These data indicated a higher rate of absenteeism for many schools than is officially registered. The average attendance on observation days was only 84 percent, with wide variation. By this measure, only nine schools (37 percent of the sample) had attendance rates over 90 percent, while five had rates below 70 percent.

83
CASE ST
UD
Y: CASE ST
UD
Y: Using O
pportunity to Learn and Early Grade Reading Fluency to M
easure School Eff ectiveness in Ethiopia
To estimate the number of days effectively available for instruction in each school, we subtracted the number of days a school was closed and the number of days lost due to teacher and student absence from the number of days on the school calendar (203). These estimates were not exact computations of the number of days of instruction, but rather indicated how three distinct aspects of school operation impact the available opportunities for students to learn. For example, governance and management decisions at the school level determine whether that school is open on any given day. Teacher accountability factors into whether teachers are present. Distance from school, as well as children’s responsibilities at home and issues of health and nutrition impact student attendance. The combined effect of these factors is seen in Figure 4.
Time available to learn in government schools was most reduced by schools being closed, and especially so for the subset of government schools serving as our control group. In community schools, teacher attendance accounts for the largest loss of time.
Beginning with the official total of 203 days, we subtracted the equivalent of the percentage of days when school was not open (as much as 18 percent in government schools). We then subtracted the days lost due to teacher absenteeism. For instance, if the attendance rate was 89 percent for the full sample, then a teacher was not present on the equivalent of 11 percent of the days school is open, leading to an additional loss of 22 days. Lastly, we subtracted the impact of student attendance.
If we use the single day observed attendance rates instead of the attendance recorded in the official school register, the time lost was greater in each category. Using this estimate, community schools on average lost 29 percent of available instructional days and government schools (including control schools) on average lost 43 percent.
As stated earlier, students who reported missing school the week prior to the observation had reading fluency rates half those of the students who said they had not missed school. The percentage of students in a school who reported missing at least one day the previous week was a strong predictor of that school’s average reading fluency. By itself, student self-reported attendance explained 35 percent of the variation in a school’s average reading fluency.
Figure 4: Time lost: Number of days effectively available for instruction
203 203 203
189 200
167
146
165
151
135
160
143 132
150
100
50
‐
C it G t C t lCommunity Government Control
Official number of days in school year Days school is open
Days school is open and teacher is present School open, teacher present, students present

84
Opp
ortu
nity
to L
earn
: A h
igh
impa
ct st
rate
gy fo
r im
prov
ing
educ
atio
nal o
utco
mes
in d
evel
opin
g co
untr
ies
Factor 5: Were class sizes reasonable?Sample school class sizes in Grades 1 through 3 for the most part did not vary much. Most schools had average class sizes between 30 and 50 students. Five schools had class sizes larger than 50 students, three of which had more than 60 students on average. Only one school had fewer than 30 students in Grade 3.
In our data, class size had no relationship with student reading fluency and class size was not affected by distance of schools from town. Sample schools with the greatest total enrollment had larger class sizes in lower primary grades.
Factor 6: Were materials available for students?In most observed classrooms, students were asked if they possessed pencils, notebooks, and textbooks in the language of instruction (Afan Oromo). Save the Children provides textbooks, but neither notebooks nor pencils. Throughout the sample schools in which these data were collected, large majorities of students, especially in Grades 2 and 3, had these basic materials.
Table 7: Percentage of students with a language textbook
Community Schools Gr. 1 Gr. 2 Gr. 3
1 47% 100% na
2 100% 68% 95%
3 79% 100% 81%
4 na na 100%
5 na na 100%
6 100% 100% 100%
7 66% na na
8 100% 100% 100%
9 na 65% 84%
10 85% na na
11 89% na 21%
12 100% na na
13 94% na 28%
14 76% 100% 100%
Average 85% 90% 81%
Government Schools Gr. 1 Gr. 2 Gr. 31 100% 100% 100%
2 96% 98% 100%
3 100% 93% 100%
4 39% 78% 100%
5 49% 100% 100%
6 37% 95% 100%
7 97% 100% 100%
Average 74% 95% 100%
Table 7 shows the percentage of students in Grades 1, 2, and 3 who possessed an Afan Oromo textbook. The table demonstrates that government schools better ensured access to textbooks. Those government schools receiving support from Save the Children (1 and 2) provided books to the

85
CASE ST
UD
Y: CASE ST
UD
Y: Using O
pportunity to Learn and Early Grade Reading Fluency to M
easure School Eff ectiveness in Ethiopia
majority of students in Grades 1 through 3. Those schools not receiving support tended to have fewer Grade 1 textbooks but enough books for the majority of students in Grade 2 and all students in Grade 3. It was not clear why government schools were better able to ensure textbook availability than community schools.
Factors 7 and 8: Use of Available Time and Time-on-task
Factor 7: Did the school make good use of available time each day?Earlier, we accounted for the loss of time in school due to school closure and teacher and student absence. In addition, we collected data to allow us to determine how much of the school day was used for instruction. In 23 of the 24 schools we were able to record the presence of teachers and students in class at two points during the school day (when we arrived and at another randomly chosen time). In total, we recorded whether students and teachers were in class 46 times in the 23 schools. Table 8 shows during how many of these observations all, some, or no students and teachers were in class.
Table 8: Classroom presence of teachers and students
# of Observations
% of Total Observations
Total observations 46All teachers and students in class 11 24%
Some teachers and all students in class 16 35%Some teachers and some students in class 10 22%
No teachers in class 9 20%
The observer noted whether no, some, or all teachers were in their classrooms, repeating this action for students. On nine occasions, no teachers were in class when they should have been. This clearly reduced the amount of instructional time. The cases during which only some students and teachers were in class or when all students, but only some teachers were in class also contributed to a loss of instructional time. This was mainly due to teachers being out of their rooms. Only in the case of all students and teachers being in class, which was observed on 11 out of 46 instances (24 percent), can we say that instructional time was not being lost due to this factor.
Another aspect of school organization in Ethiopia appeared to contribute to a loss of instructional time. Elementary schools are organized on a subject-based schedule. For Grades 1 through 3, the school week consisted of 1,200 minutes of instruction, which were divided among five required subjects: Afan Oromo (200 minutes), English (200), Math (200), Aesthetics (240), and Environmental Science (360). This schedule was evident in most schools, with only a few variations (e.g., to include health and nutrition instruction). In all sample schools, teachers were assigned by subject area and are supposed to change classrooms according to a fixed schedule of 40 minute periods. Our field teams, however, rarely saw the actual time of instruction match the official schedule. In fact, we noted several inefficiencies in how classrooms and teachers were used, leading to larger class sizes and less instructional time. In half of the sample schools, classrooms were unused during the morning or afternoon shift and teachers with free periods were often idle.
The observer noted whether no, some, or all teachers were in their classrooms, repeating this action for students. On nine occasions, no teachers were in class when they should have been. This clearly reduced the amount of instructional time. The cases during which only some students and teachers were in class or when all students, but only some teachers were in class also contributed to a loss of instructional time. This was mainly due to teachers being out of their rooms. Only in the case of all

86
Opp
ortu
nity
to L
earn
: A h
igh
impa
ct st
rate
gy fo
r im
prov
ing
educ
atio
nal o
utco
mes
in d
evel
opin
g co
untr
ies
students and teachers being in class, which was observed on 11 out of 46 instances (24 percent), can we say that instructional time was not being lost due to this factor.
Another aspect of school organization in Ethiopia appeared to contribute to a loss of instructional time. Elementary schools are organized on a subject-based schedule. For Grades 1 through 3, the school week consisted of 1,200 minutes of instruction, which were divided among five required subjects: Afan Oromo (200 minutes), English (200), Math (200), Aesthetics (240), and Environmental Science (360). This schedule was evident in most schools, with only a few variations (e.g., to include health and nutrition instruction). In all sample schools, teachers were assigned by subject area and are supposed to change classrooms according to a fixed schedule of 40 minute periods. Our field teams, however, rarely saw the actual time of instruction match the official schedule. In fact, we noted several inefficiencies in how classrooms and teachers were used, leading to larger class sizes and less instructional time. In half of the sample schools, classrooms were unused during the morning or afternoon shift and teachers with free periods were often idle.
Factor 8: Did teachers use class time to engage students in productive instructional activities?Using the Stallings Observation System, we observed teachers and students in Grades 1, 2, and 3 at each school (except where circumstances prevented completing all observations). With this instrument, the observer recorded the nature of the classroom activities and the type of materials being used at 10 minute intervals in each classroom. The observer noted whether the full class, a large group, a small group, or an individual student was involved in each “on-task” activity observed. Teacher and student activities deemed “off-task” were also noted. Teachers were off task if they were interacting socially with or disciplining students, managing the classroom (e.g., telling students to stand, sit, move in or out of the room), interacting with other adults, or out of the classroom. Students were off task if they were interacting socially, being disciplined, involved with classroom management tasks, sitting idly, or out of the room.
The team observed 61 classrooms and recorded 583 instances of teacher and student activity that were classified into seven on-task categories: reading, demonstration, discussion, practice/drill, seatwork, copying, and verbal instruction, as well as the off-task activities mentioned above. Table 9 summarizes the frequency with which we observed activities in each of these categories.
Table 9: Frequency of observations of activities
Were observed doing tasks relating to:
% of obs. of Teachers
% of obs. of Students
Materials most frequently used
Reading 3% 11% textbook Demonstration 20% 21% blackboard
Discussion 5% 5% nonePractice/Drill 16% 18% blackboard or none
Seatwork 8% 19% notebook
Copying 5% 18% notebook or blackboard
Verbal instructions 4% 4% noneWere observed doing tasks
unrelated to instruction 38% 89%
By far the most frequently observed activity across all the grades and schools was students involved in off-task activities: We noted at least one student off task during 89 percent of the observations.
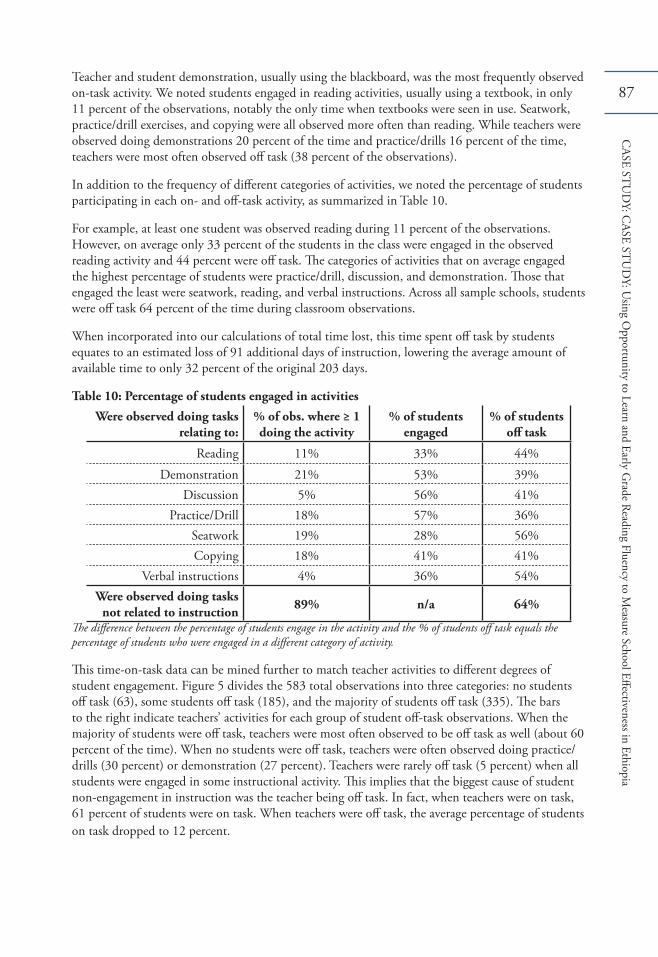
87
CASE ST
UD
Y: CASE ST
UD
Y: Using O
pportunity to Learn and Early Grade Reading Fluency to M
easure School Eff ectiveness in Ethiopia
Teacher and student demonstration, usually using the blackboard, was the most frequently observed on-task activity. We noted students engaged in reading activities, usually using a textbook, in only 11 percent of the observations, notably the only time when textbooks were seen in use. Seatwork, practice/drill exercises, and copying were all observed more often than reading. While teachers were observed doing demonstrations 20 percent of the time and practice/drills 16 percent of the time, teachers were most often observed off task (38 percent of the observations).
In addition to the frequency of different categories of activities, we noted the percentage of students participating in each on- and off-task activity, as summarized in Table 10.
For example, at least one student was observed reading during 11 percent of the observations. However, on average only 33 percent of the students in the class were engaged in the observed reading activity and 44 percent were off task. The categories of activities that on average engaged the highest percentage of students were practice/drill, discussion, and demonstration. Those that engaged the least were seatwork, reading, and verbal instructions. Across all sample schools, students were off task 64 percent of the time during classroom observations.
When incorporated into our calculations of total time lost, this time spent off task by students equates to an estimated loss of 91 additional days of instruction, lowering the average amount of available time to only 32 percent of the original 203 days.
Table 10: Percentage of students engaged in activities
Were observed doing tasks relating to:
% of obs. where ≥ 1 doing the activity
% of students engaged
% of students off task
Reading 11% 33% 44%
Demonstration 21% 53% 39%Discussion 5% 56% 41%
Practice/Drill 18% 57% 36%Seatwork 19% 28% 56%Copying 18% 41% 41%
Verbal instructions 4% 36% 54%Were observed doing tasks
not related to instruction 89% n/a 64%
The difference between the percentage of students engage in the activity and the % of students off task equals the percentage of students who were engaged in a different category of activity.
This time-on-task data can be mined further to match teacher activities to different degrees of student engagement. Figure 5 divides the 583 total observations into three categories: no students off task (63), some students off task (185), and the majority of students off task (335). The bars to the right indicate teachers’ activities for each group of student off-task observations. When the majority of students were off task, teachers were most often observed to be off task as well (about 60 percent of the time). When no students were off task, teachers were often observed doing practice/drills (30 percent) or demonstration (27 percent). Teachers were rarely off task (5 percent) when all students were engaged in some instructional activity. This implies that the biggest cause of student non-engagement in instruction was the teacher being off task. In fact, when teachers were on task, 61 percent of students were on task. When teachers were off task, the average percentage of students on task dropped to 12 percent.

88
Opp
ortu
nity
to L
earn
: A h
igh
impa
ct st
rate
gy fo
r im
prov
ing
educ
atio
nal o
utco
mes
in d
evel
opin
g co
untr
ies
Figure 5: Teacher’s behavior when students were on or off task
100%no students
Corresponding activities of teachers
Observations of students off task
0% 25% 50% 75% 100%
63
Reading Demonstration Discussion Practice/Drill Seatwork Copying Verbal instructions Off Task
no students off task
75%185
some students off task
50%
335majority of students
25%335 students
off task
0%
583 observations
We also compared observation results for different grade levels and for the different subjects taught during the observations. The percentage of observations during which the teacher and students were on task did not vary across grades or subject areas.
The only category of observed activity that correlates significantly with a school’s reading fluency was verbal instruction. The percentage of observations during which teachers were providing verbal instruction has a correlation coefficient of r = 0.66 with the average words per minute correctly read by Grade 3 students. Interestingly, the frequency of reading activity observations does not correlate significantly with reading fluency.
The relationship between observed categories of instructional activities and reading fluency appears to have been complex. The combination of classroom activities may have contributed to students acquiring reading fluency. For example, schools that performed best in terms of students’ average words per minute had more instances of verbal instruction, more observed seatwork activity, and slightly more reading activities. The worst performing schools had fewer verbal instruction, seatwork, and reading activities, and more instances of discussion, demonstration, and copying. Another interpretation could be that the low correlation between activity categories or percentage of students on task and reading fluency was indicative of how little relationship there was between instruction and reading acquisition, a disheartening, but entirely possible circumstance. If most instructional strategies were not designed with literacy acquisition or reinforcement in mind, then it follows that no relationship would appear between instruction and student reading ability.
An Additional Factor: School Support We collected data on two types of support received by schools and teachers: on-site support from school directors, other teachers, and parents and external support from Ministry of Education or Save the Children staff, teacher trainers, and donors. We defined on-site support as school directors observing and meeting with teachers as well as support from parents. External support included

89
CASE ST
UD
Y: CASE ST
UD
Y: Using O
pportunity to Learn and Early Grade Reading Fluency to M
easure School Eff ectiveness in Ethiopia
visits from Ministry of Education or Save the Children staff, off-site teacher training, the schools’ financial support, and the length of participation in Save the Children’s program.
How regularly did school directors and teachers support each other?All the data concerning school support were self-reported, so must be interpreted with caution. Nevertheless, school directors and teachers reported great variation in the frequency with which the director observes teachers giving lessons. There was less variation in teachers meeting among themselves in a school: most indicated that they meet twice each month. Table 11 shows the number of schools reporting various frequencies of observations and teacher meetings.
Table 11: School director and teacher support
# of Obs. of Lessons by School Director
Teacher Meetings
Never 1 -Twice per year 6 -
Four times per year 3 -Monthly 5 3
Twice per month 3 13Weekly 1 3
What roles did parents play in supporting their schools?We collected data on 12 possible roles played by parents at schools such as raising and managing funds, purchasing and managing equipment, managing personnel, monitoring student and teacher attendance, monitoring quality, setting the calendar or schedule, resolving conflicts, and maintaining property and buildings. All schools noted that parents helped raise funds and maintain school infrastructure. No school indicated that parents helped monitor quality or set the calendar and schedule and we found no variation in how the school day was organized. At only three schools did parents provide support other than raising funds and maintaining infrastructure.
How regularly were schools visited and supported by outsiders?Twenty schools provided information about visits from outside officials. When asked separately how frequently their school was visited, directors and teachers tended to answer consistently. Twelve schools reported monthly visits while one school reported two visits per month and five reported being observed weekly. Government schools reported being visited twice per month, compared to once per month for community schools. The frequency of support visits relates neither to a school’s provision of opportunities to learn nor to students’ reading outcomes.
When asked how many times their school had been visited by outside support staff since the beginning of the school year, responses ranged from zero to five. Visits were usually from district-level education officials and from Save the Children project staff. School directors reported that these visits focused on a range of issues, including administration, teaching and learning, classroom management, and assessment. On average, government schools reported being visited slightly more than community schools.
Did teachers participate in training activities?Teachers were asked if they had participated in formal training activities during the previous year. In five out of eight government schools, none of the teachers interviewed had attended training. In contrast, in 7 out of 15 community schools all the interviewed teachers reported having participated in training. Table 12 shows the number of schools in which the given fractions of teachers participated in training the previous year.

90
Opp
ortu
nity
to L
earn
: A h
igh
impa
ct st
rate
gy fo
r im
prov
ing
educ
atio
nal o
utco
mes
in d
evel
opin
g co
untr
ies
Table 12: Schools in which given fractions of teachers participated in training
Community Government
All 7 1Two-thirds 3 -
Half 2 -One-third 2 2
None 1 5Total 15 8
What financial support did schools receive?Schools were asked if they received financial support for salaries, materials, equipment, buildings, and other school expenses from any of four outside sources: government, Save the Children, the community, and other sources. As shown in Table 13, all but 1 of the 21 schools that answered this question received government support for teacher salaries. Save the Children paid teacher salaries in this one non-government supported school. Government financial support for equipment and buildings was evident almost exclusively in government schools. Eleven community schools indicated that they received teacher salary support from Save the Children. All the responding community schools and two government schools received support from Save the Children for materials and equipment and buildings. Three government and 14 community schools stated that they received support from the community for teacher salaries.
It is worth noting that schools that reported receiving more support had neither more materials, nor smaller classes, nor better average reading outcomes.
Table 13: Type of financial support received by schools
Salaries Materials & Equipment Buildings Other
Expenses
Government8 7 4 0 Govt.
12 1 0 2 Comm.
Save the Children1 2 2 0 Govt.
11 15 15 6 Comm.
The community3 6 7 7 Govt.
14 7 12 13 Comm.
Other sources1 2 2 1 Govt.
1 2 0 0 Comm.
How did Save the Children support affect schools? Save the Children’s presence in Woliso, Dendi, and Goro was the single most important variable in determining the reading outcomes obtained by schools. For community schools, the duration of Save the Children support correlated with the average reading fluency of students in each school (r = .68). Schools supported by Save the Children for the longest time had higher average reading fluency and a lower percentage of students unable to read. Table 14 and Figure 6 show these relationships.
The reading fluency of Grade 3 students in a community school had a correlation coefficient of r = 0.68 with years of support from Save the Children (significant at the p < .05 level). The percentage of students not able to read (scoring zero wpm on the EGRA test) had a correlation coefficient of r = -0.80 with years of Save the Children support (significant at the p < .005 level). The number of years

91
CASE ST
UD
Y: CASE ST
UD
Y: Using O
pportunity to Learn and Early Grade Reading Fluency to M
easure School Eff ectiveness in Ethiopia
of Save the Children support by itself accounted for 45 percent of the variation in the percentage of students unable to read in community schools. This may be partially attributed to the fact that many of the community schools opened upon Save the Children’s arrival to the area.
Therefore, the longer Save the Children had supported these schools, the longer they had existed and were able to stabilize a teaching force and gain school management experience.
Table 14: Student reading ability based on number of years of Save the Children support
Years of Support Average Words Per Minute
7 317 206 205 235 235 254 154 193 153 52 41
new 7new 13
Note: Each row represents one Save the Children-supported school.
Figure 6: Percentage of students unable to read and years of Save the Children support
80%
70%
80%
d
50%
60%
ble to re
ad
R² = 0 4530%
40%
uden
ts una
R = 0.45
20%
30%
% of stu
0%
10%
1 2 3 4 5 6 7
Years of Save the Children Support

92
Opp
ortu
nity
to L
earn
: A h
igh
impa
ct st
rate
gy fo
r im
prov
ing
educ
atio
nal o
utco
mes
in d
evel
opin
g co
untr
ies
Perhaps Save the Children’s greatest success in this part of Ethiopia lies in helping create and stabilize schools in communities that otherwise would not have them. Over time, these schools become official and sustainable, but the level of school effectiveness as measured by Grade 3 reading aptitude, while better than at other schools we studied, remained low.
When government-supported and government control group schools were included, the relationships between reading fluency, the percentage of students unable to read, and levels of school support weaken, but remain significant.
How Did the Opportunity to Learn Factors Inter-Relate?Table 15 looks across the opportunity to learn factors and other key variables for each school. Schools were ranked according to the average reading fluency of Grade 3 students and were identified as either government (G) or community (C) schools.
Table 15: Summary of OTL factors, schools ranked by reading fluency Factors
1-2Factor
5Factor
6Factor
7Factor
8Factor
9
Avg wpm
Gov/ Com
% Earn $
% of Available
Time
% Not Absent
Class Size (3rd)
Textbook Ratio
% Students Off Task
% Observed Reading
Save Support
41 C 20% 74% 95% 37 0.74 53% 1% 0.2931 C 15% 83% 95% 37 1.00 51% 1% 1.0025 C 10% 77% 85% 43 1.00 44% 0% 0.7123 C 22% 80% 50 0.7123 C 20% 55% 94% 39 0.87 79% 3% 0.7120 C 40% 87% 95% 60 0.85 77% 1.0020 C 20% 86% 90% 68 0.88 73% 1% 0.8619 C 25% 79% 95% 41 0.66 53% 0% 0.5719 G 15% 83% 85% 48 0.99 51% 3% 0.0018 G 16% 88% 47% 31 0.77 69% 4% 0.0017 G 30% 76% 53% 28 1.00 58% 7% 0.2016 C 15% 81% 90% 45 0.92 57% 5% 0.4315 C 6% 75% 38 1.00 67% 3% 0.5715 C 60% 89% 75% 54 1.00 57% 8% 0.4315 G 40% 78% 90% 70 0.98 45% 12% 0.6014 G 55% 76% 85% 77 4% 0.8013 C 20% 82% 70% 35 1.00 40% 0% 0.1412 G 5% 85% 55% 39 0.72 59% 1% 0.0012 G 40% 80% 47 0.98 60% 2% 0.0011 C 25% 81% 70% 37 0.50 32% 8% 0.148 G 47% 89% 43 0.83 81% 5% 0.007 C 30% 84% 80% 41 0.55 55% 6% 0.145 C 15% 77% 45% 39 0.77 58% 4% 0.43

93
CASE ST
UD
Y: CASE ST
UD
Y: Using O
pportunity to Learn and Early Grade Reading Fluency to M
easure School Eff ectiveness in Ethiopia
Data were then presented on the percentage of students who said they worked outside of their home to earn money (a correlate of reading fluency) and on the following variables as proxies for the key opportunity to learn factors:
• Percentage of Available Time: a calculation that accounts for time lost at each school due to school closure and teacher and/or student absence (Factors 1 through 4).
• Percentage Not Absent: the percentage of students at each school reporting they had not been absent the previous week (Factor 4, used because it correlated strongly with reading fluency).
• Grade 3 Class Size: number of students in the Grade 3 class from which students were randomly sampled for the EGRA (Factor 5).
• Student to Textbook Ratio: the average ratio of students to language textbooks in Grades 1 through 3 (Factor 6).
• Percentage of Students Off Task: the average percentage of students identified as being off-task across all the observations in each school (Factor 7).
• Percentage Observed Reading: the percentage of observations at the school during which any students were seen to be engaged in reading activities (Factor 8).
• Save Support: a calculation that, for community schools, represents the number of years the school has received support out of the seven years possible. For government schools, this represents the number of supports received out of the five Save the Children makes available to government schools (additional classrooms, de-worming, furniture, latrines, and wells).
A cell was shaded if it was in the top five values for each variables in order to visually represent the confluence for some of the top performing schools among some of these variables and/or opportunity to learn factors.
Conclusions and ImplicationsThis research brings into question several issues about school effectiveness in Woliso and its surrounding districts. Schools varied considerably in the nature and quality of their provision of opportunities to learn and varied also in the level of reading fluency obtained by their students upon reaching Grade 3. However, every school in the sample could be called underperforming. Why were opportunities to learn and learning so severely compromised in this part of Ethiopia?
First and foremost, our research indicates that most of the time available for effective instruction in these schools was wasted. Days were lost when school was closed and when teachers and students were absent. However, these factors were dwarfed by the loss of opportunity to learn stemming from off-task teachers and students in Grade 1, 2, and 3 classrooms. At least one student was off task during 89 percent of the observations, usually because their teacher was also off task. In general, we observed limited amounts of useful instruction in a typical lesson.
In addition to the loss of time-on-task evident in schools and classrooms in Woliso, Bacho, Dendi, and Goro, we observed that reading instruction is virtually non-existent. The vast majority of classroom activities we observed could be neither classified as instruction in reading, nor did they involve students reading text. While most students had Afan Oromo textbooks for their grade, we rarely observed students using these books. These books also contained neither reading passages nor stories. Students had little to no opportunity to interact with text at school. Most of the interaction observed was with simple sentences written on the blackboard and recited by individuals or groups. There appeared to be no structured approach to the teaching of reading in the schools included in this study.
While students’ reading performances varied across schools, instructional practice was relatively homogeneous. Lessons were hauntingly similar across grades, subjects, and schools. A single approach to teaching seemed to predominate: demonstration at the blackboard followed by

94
Opp
ortu
nity
to L
earn
: A h
igh
impa
ct st
rate
gy fo
r im
prov
ing
educ
atio
nal o
utco
mes
in d
evel
opin
g co
untr
ies
seatwork and copying. Save the Children is expending resources to train all community school teachers through one year rotations at a teacher training institute. This training focuses on certifying community school teachers and moving them onto the government payroll. However, no evidence of the pedagogical value of the Save the Children training was observed or revealed in our data.
As all teachers become certified and the school becomes an official government school, Save the Children can claim success in having helped establish a community’s first officially recognized school. Investing in the sustainability of the schools launched by Save the Children and the participating communities is a laudable goal. However, the program in this part of Ethiopia appears to be sacrificing pedagogical and educational innovation for the sake of institutionalization.
Perhaps because of this overriding concern for institutionalization, we saw no innovation in the organization of the school day. In fact, every school followed the same or very similar schedules. The only variations were found in community schools that included a health and hygiene subject and in schools’ usage of a free period. All schools used a compartmentalized approach to teaching, meaning teachers rotated in and out of classrooms based on subject.
This approach had two repercussions. First, compartmentalization led to some loss of time-on-task as teachers moved between classrooms, oftentimes ending lesson early. Second, teachers were underused. Every period two or three teachers were observed not teaching as their subject was not scheduled at that time. All the schools therefore had more teachers than pedagogical groups. Many of the schools also had more classrooms than pedagogical groups and could easily have reduced class sizes and increased teacher’s contact time by doing away with a compartmentalized approach.
In other studies of community-based complementary education programs, EQUIP2 found that support services are a critical factor permitting community schools to produce results comparable to or better than government schools in some settings (DeStefano et al., 2007). However, the Save the Children program in Woliso, Bacho, Dendi, and Goro has been unable to provide the frequency of visits or the caliber of instructional support required to achieve these results. The Save the Children field offices have lacked sufficient staff to provide regular school visits although they have started working with Woliso’s Woreda Education Office to share responsibility for supporting community-based schools. Whether such support can make up for the teaching deficiencies revealed by our research is an open question.
Save the Children has also introduced kindergarten through its community schools. This appears to boost the enrollment of younger students and may increase the net intake rate for schools in the area. However, we did not find a relationship between kindergarten attendance and acquisition of an acceptable level of reading fluency by Grade 3. Even with an additional year of schooling, students showed no statistically significant difference in reading fluency. We cannot assess the quality of teaching and learning occurring in kindergarten classrooms as none were observed.
We did not find a strong relationship between opportunity to learn or other school factors and students’ reading fluency. However, we may have stumbled upon a useful insight into the relationship between schools, instruction, and learning: There is no relationship. If we do not observe the teaching of reading, why should we expect to find a relationship between teaching and reading ability? Schools vary in an assortment of ways: how regularly teachers attend, how regularly students attend, whether or not schools have enough books, whether class size is reasonable, and how regularly schools are visited by education support personnel. In fact, we noted variation across all the opportunity to learn factors included in our research framework. However, despite those variations, in Woliso, Bacho, Dendi, and Goro there was a consistent lack of reading instruction, little exposure to text, and a common lack of opportunity for students to read. These observations go a long way to explain why 36 percent of students at the start of Grade 3 could not read a word.

95
CASE ST
UD
Y: CASE ST
UD
Y: Using O
pportunity to Learn and Early Grade Reading Fluency to M
easure School Eff ectiveness in Ethiopia
The research team did note that community schools outperform government schools and, among community schools, those receiving Save the Children support the longest performed better, indicating that this support has improved opportunities to learn and learning outcomes. However, even in the best performing schools, opportunities to learn were few and reading fluency outcomes were low. There is significant room for improvement.
Given that Save the Children is supporting schools, the question then becomes how to maximize the impact of that support to ensure a consistent opportunity to learn and better literacy acquisition. Our research points to the following approaches as ways to obtain more impact for the effort being expended.
Teacher and student absenteeism need to be more closely monitored and the factors that impact them addressedWhile we have no data on the causes for teacher absenteeism, systems for local accountability in other contexts have proven useful in combating teacher absenteeism. The maintenance of a teacher attendance book does not appear, by itself, to establish the needed accountability; teacher and student attendance may be worse than recorded in the register. Additionally, certain categories of students, such as those who earn money outside their homes, may be more prone to miss school. Strategies to address students’ specific needs should be explored.
More of the school day needs to be effectively used and more time should be devoted to readingThe biggest loss of classroom time-on-task was due to students and teachers being off task. The compartmentalized schedule and subject-specific teaching assignments greatly reduced the efficient use of time and space during the school day. However, even when time is used effectively, schools must give more attention to reading. In particular, the early grades in primary school need to devote more time to reading: teachers reading to students, students reading aloud, and students reading in groups and individually. These activities, which are commonplace in any developed country primary school classroom, were rare to non-existent in the classrooms observed in Ethiopia.
Teacher training activities need to do more than ensure official certificationTeachers need teaching strategies to help students learn to read (either as part of or in addition to their certification-based training). Most students in this study recognized letters fairly well and could complete the CAP pre-literacy tasks. However, far too few made the transition from those initial steps to reading fluency. Teachers appear to lack techniques such as those that build site vocabulary or teach basic decoding.
More reading material needs to be made availableTextbooks were usually the only written material to which students were exposed, and we found these did not contain stories or other examples of connected text. Other than textbooks, students only had their notebooks to read, which contained text copied from the blackboard. There appeared to be an insufficiently literate environment to support regular reading. Schools need books and other printed materials that offer students a variety of opportunities and purposes to read.
While the building blocks of literacy need to be reinforced, students also need higher-order skillsIt was not apparent that any activities observed in these schools help children learn to read for meaning. All subject areas should present opportunities for children to use text to develop higher-order reading skills and to use text as a tool of learning.

96
Opp
ortu
nity
to L
earn
: A h
igh
impa
ct st
rate
gy fo
r im
prov
ing
educ
atio
nal o
utco
mes
in d
evel
opin
g co
untr
ies
Schools need to employ remediation and more individualized instructionGiven that large numbers of students are not learning to read, schools need to employ remediation strategies to address this problem. Within any classroom, students’ reading abilities vary dramatically, and therefore teachers should learn techniques to identify their students’ reading levels and tailor instruction to each level. Simple tools for classifying students along a logical hierarchy would prove useful (e.g., knows letters, able to read simple words, able to read sentences, able to read connected text). Pratham, an NGO operating in India, has developed simple techniques for assessing students, analyzing reading levels within classrooms, and designing instructional approaches to meet each level’s needs. Approaches like this would prove useful in Ethiopia.

97
CASE ST
UD
Y: CASE ST
UD
Y: Using O
pportunity to Learn and Early Grade Reading Fluency to M
easure School Eff ectiveness in Ethiopia
ReferencesClay, Marie. (2000). Concepts About Print: What Have Children Learned about the Way We Print Language? Portsmouth, NH: Heinemann.
DeStefano, Joseph, Audrey Moore, David Balwanz & Ash Hartwell. (2007). Meeting EFA: Reaching the Underserved through Complementary Models of Education. Washington, D.C.: EQUIP2, FHI 360, and USAID.
Gillies, John & Jessica Jester Quijada. (2008). Opportunity to Learn: A high impact strategy for improving educational outcomes in developing countries. Washington, D.C.: EQUIP2, FHI 360, and USAID.
Jukes, Mathew, Shaher Banu Vagh & Young-Suk Kim. (2006). Development of Assessments of Reading Ability and Classroom Behavior, a report prepared for the World Bank. Cambridge, MA: Harvard Graduate School of Education.
Kellaghan, Thomas. (2004). Public Examinations, National and International Assessments, and Educational Policy. Dublin, Ireland: Education Research Center, St. Patrick’s College.
Stallings, Joan. (1980). Allocated learning time revisited: Or beyond time-on-task. Educational Researcher, 9(11), 11–16.


99
CASE ST
UD
Y: Using O
pportunity to Learn and Early Grade Reading Fluency to M
easure School Eff ectiveness in Guatem
ala
Using Opportunity to Learn and Early Grade Reading Fluency to Measure School Effectiveness in Guatemala
Executive SummaryHow do we know if and when schools are effective? To most educational planners, the term “effective” is the search for factors and variables that enhance a child’s learning irrespective of their background. While many definitions of school effectiveness exist in the literature, the “Five-Factor” model of school effectiveness suggests that leadership, acquisition of basic skills, a secure environment, high expectations of students, and frequent assessment of performance are critical elements of effectiveness (Sheerans, 2000).
This study argues that to improve school effectiveness, schools and educators should focus on even more basic elements than those posited by other research. The focus should be on providing a basic opportunity to learn by having the school open every day; the teacher present; students present and ready to learn; and instructional time on task. The educational value of that basic opportunity then depends on how teachers and students use the time available during the day, whether materials are present and used by them, and whether class sizes are reasonable. The study further established an opportunity to learn (OTL) index based on 12 factors and measures the extent to which opportunity to learn is optimized in a sample of schools in Guatemala. The study answers the following questions:
• How well do schools provide opportunity to learn?• How does actual opportunity to learn compare to potential opportunity to learn?• How does opportunity to learn vary across schools?
MethodologyData for the study were collected through first-hand field research in each of the four countries, made possible through collaboration with Save the Children (SC) US and their country office in Guatemala. The sample of schools was drawn from those participating in the SC education programs in each respective country, based on stratification by school size and location. Control schools – those not participating in the NGO supported programs – were also sampled.
Field research teams visited 26 schools and collected data through the use of a series of instruments, including Early Grade Reading Assessments (EGRA); Stallings classroom observation instrument; school observations; and interviews with teachers and principals. Data analysis included regression, ANOVA, and factor analysis along with qualitative analysis of interviews.
ContextSave the Children has been operating in Guatemala for more than 10 years with programs focused on hunger, malnutrition, emergency preparedness, child/reproductive health, and education. More recently, SC’s education interventions have focused on three states within Guatemala: K’iche’, Huehuetenango, and Solola (the poorest and most marginalized), as it works to ensure that each child is afforded the basic right to attend school.
Students included in the sample reported speaking four different languages at home: 34 percent of the students spoke K’iche as their mother tongue, 30 percent Mam, 25 percent Ixil, and 11 percent spoke only Spanish. Students in the study were evenly split by gender. The average age of the students in the sample was 10 and 73 percent reported having participated in kindergarten.

100
Opp
ortu
nity
to L
earn
: A h
igh
impa
ct st
rate
gy fo
r im
prov
ing
educ
atio
nal o
utco
mes
in d
evel
opin
g co
untr
ies
ResultsSchools in Guatemala were open on average 97 percent of the days they should be, and teacher and student attendance rates are fairly high (88 and 92 percent, respectively). However, time loss because of late starts, early close and time-on-task is quite significant. Schools on average are using only 72 percent of the available day for instruction because of late start, early end, and prolonged breaks in the day for recess, and students are on task only 59 percent of the time.
When we combine the time loss caused by school being closed, teachers and students being absent, time lost during the day and students being off task during lessons, schools on average are using only 33 percent of the equivalent available time (days) for instruction (OTL Factor 6). Expressed in terms of the number of days in the school year, this equivalent time comes out to approximately 56 days.
In terms of the remaining OTL factors, on average 63 percent of students in the sample have language textbooks in the classroom. However, students were observed using those books a very small percentage of the time (3 percent of the time). Students were also observed reading any material in class at similarly low percentages of the time (11 percent of the time). In terms of oral reading fluency, students were able to read on average 46 words per minute (wpm). The average class sizes for schools included in the study was 27 students and schools on average reported to be receiving sufficient support visits during the year.
Variation of opportunity to learn across schools was fairly extensive. The smallest amount of variation was found in the first OTL indicators: schools open, with the greatest variation in teacher and student attendance and textbook availability. Time spent on task in classrooms also varied greatly between schools, with the lowest time on task at 47 percent and the highest at 71 percent.
ConclusionsThe main findings suggest that a) a great deal of time that could be used for instruction is being lost; b) little if any reading instruction is taking place in the classroom; and c) while textbooks exist, their effective use is suspect. Additionally, while students had fairly good knowledge of Concepts about Print (CAP), their reading fluency scores were generally below the acceptable threshold of 60 wpm.
The OTL index further revealed that the variation among schools in each country was considerable and none of the 12 OTL factors was significantly correlated with learning. While sample sizes were small and likely impacted regression results, researchers believe the lack of a relationship is because little or no reading instruction was taking place in the classrooms.
The OTL index and subsequent analysis from this case study provides useful insights into the relationship between schools, instruction and learning—namely that unless there is a minimum amount of instruction, specifically instruction in reading, then we should not expect to find a relationship between opportunity to learn and learning. This finding has important policy implications for those implementing programs or making sector policy.
This study proposes a number of interventions and policies that could improve the classroom environment and help children learn. Teacher and student absenteeism need to be more closely monitored and the factors that impact their attendance addressed. More of the school day needs to be effectively used and more time should be devoted to reading. There needs to be increased investment in teacher training in the areas of literacy development and reading resources need to be provided to schools and students. Curriculum needs to be restructured to help build a strong link between reading and writing. Finally, remediation and more individualized instruction should be introduced.

101
CASE ST
UD
Y: Using O
pportunity to Learn and Early Grade Reading Fluency to M
easure School Eff ectiveness in Guatem
ala
IntroductionDeveloping countries and international agencies are recognizing that gains in access to schooling alone are not sufficient to build the human resource base needed for economic development in the 21st century. This recognition has pushed agencies to increasingly direct attention and investment to improving learning outcomes for students—shifting the focus from increased access to improving quality. Ensuring that lessons learned from approaches to schooling that effectively promote and support student learning outcomes are well-documented and shared is critical to shaping where and how future education investments are used.
Research conducted by the Education Quality Improvement Program (EQUIP2) on complementary education programs showed how NGO-supported programs are able to cost-effectively promote school completion and learning. Cases studies of various complementary education programs completed in 2007 identified a series of policies and practices that improve the opportunities to learn offered at the school level. For example, the study showed that policies that promote mother-tongue instruction at the school level for early grades helped students build foundational literacy and numeracy skills more effectively than if they began instruction in the official country language. Based on the findings from this research, EQUIP2 developed an opportunity to learn index intended to describe and measure the basic elements required for initial learning to occur. The concept of opportunity to learn mainly focuses on the time allocated to teaching, learning, and curriculum coverage and is supported throughout the literature (Gillies and Quijada, 2008). The OTL factors that are necessary for basic foundational skills to be developed include the following:
1. Percentage of days school is open; 2. Teacher attendance;3. Student attendance;4. Percentage of the school day available for instruction;5. Percentage of student time-on-task;6. Equivalent percentage of days available for instruction;7. Percentage of students with a textbook;8. Percentage of observed textbook use;9. Percentage of time spent reading;10. Grade 3 reading ability;11. Class size; and12. School support.
To build on the existing opportunity to learn and effectiveness research, the team elaborated a new study to quantify the relationship between the OTL indicators, time loss in the classroom and student’s learning outcomes. One drawback of the EQUIP2 complementary education research was the lack of data in most countries on student learning outcomes. Proxies such as end-of-cycle exams or other standardized tests had to be used, which only include students who make it to the end of the cycle, focus on discriminating between high achieving students, and therefore do not reflect the full range of performance of students in the system (Kellaghan, 2004). Because Guatemala lacked a national or school level reading assessment that could easily be used as the learning measure, the team drew on the refinement and growing use of early grade reading assessment (EGRA) methodologies, which offered EQUIP2 a chance to further its research on school effectiveness.
EGRA provides a fairly easy to design and implement methodology to quickly assess a variety of early literacy skills, and therefore to gauge school and/or system effectiveness at fostering acquisition of those skills. The EdData II project in particular has been instrumental in promoting and improving the use of EGRA as a measure of school effectiveness and has now supported its application in almost 20 countries. However, one of the drawbacks of EGRA is that it has a floor

102
Opp
ortu
nity
to L
earn
: A h
igh
impa
ct st
rate
gy fo
r im
prov
ing
educ
atio
nal o
utco
mes
in d
evel
opin
g co
untr
ies
effect. It fails to measure the skills of students who are below the “floor” of being able to read letters, words, or connected text. Working with Save the Children, EQUIP2 introduced the Concepts about Print methodology as an additional assessment tool to ensure the evaluation of pre-reading skills in students who are non-readers.
The combination of the opportunity to learn framework, EGRA, and CAP are what inspired the design of the current EQUIP2 research on effective schools. This research is based on the idea that school effectiveness, as measured by whether the school enables children to learn to read, is a function of how well the school assures a foundational opportunity to learn and whether it draws on teaching approaches that make the best possible use of the instructional time that is available. This study posits that school effectiveness is a function of the optimization of opportunity to learn, time spent on learning tasks and the instructional methods that make good use of the available opportunity to learn (Benavot and Amadio, 2004). Through a partnership with Save the Children, EQUIP2 was able to access schools in the areas of Guatemala where SC operates to successfully conduct the study.
Building on EQUIP2’s complementary education and opportunity to learn research, this study seeks to answer the following questions:
• How well do schools provide opportunity to learn?• How does actual opportunity to learn compare to potential opportunity to learn?• How does opportunity to learn vary across schools?
ContextGuatemala is one of the northernmost countries of Central America and is the region’s most populous nation. Its 13 million inhabitants represent a cosmopolitan mix of Mestizo (59 percent) and multiple Amerindian groups which speak a total of 24 distinct languages, including Spanish and various Mayan dialects (CIA, 2009). Spanish, however, is not universally spoken. A significant part of the population does not even speak it as a second language.
Access to and quality of education in Guatemala has substantively improved in the past decade. According to UNESCO (2009), in 2006, net enrollment rate jumped to 94 percent, almost reaching the Latin American average of 95 percent. Guatemala has nearly reached full primary school coverage for its school-aged children.
Save the Children began operations in Guatemala in 1999 with programs focused on hunger, malnutrition, emergency preparedness, child/reproductive health, and education. More recently, SC’s education interventions have focused on three states within Guatemala: K’iche’, Huehuetenango, and Solola (the poorest and most marginalized). SC’s main goal is to increase access to quality early childhood development, pre-primary, primary, and secondary education at 80 schools (SC, 2009). SC’s education program is based on active teaching, which includes a dynamic, flexible, and creative process through significant activities (SC, 2006). To reach the objectives of this active methodology, SC has focused their interventions on the following activities:
• Promoting Mayan culture by implementing an intercultural bilingual education program• Offering teachers, administrators, and school board members skill-building training• Refurbishing and equipping schools with educational materials• Encouraging parents to become involved in their children’s education
The implementation of SC’s educational program was designed to be carried out in phases: diagnosis, identification of children’s needs, planning, execution, monitoring and evaluation, and results. When this program started in 2001, it supported 54 schools. By 2007, the total coverage

103
CASE ST
UD
Y: Using O
pportunity to Learn and Early Grade Reading Fluency to M
easure School Eff ectiveness in Guatem
ala
of this program was 72 schools that enrolled 16,985 children (SC, 2006). Table 1 summarizes the breadth and depth of the SC program in Guatemala.
Table 1. Universe of schools
Total Number of Schools 72Total Enrollment 16,985
% Girls 49%
Number of Schools in Huehuetenango 14 Number of Schools in K’iche’ 32 Number of Schools in Solola 16
Number of Schools Receiving Support 72-for More than 5 years 1
-for 3 to 4 years 57-for 1-2 years 14
Sampling and MethodologyBased on a mutual interest to understand what interventions best support student success and effectiveness in schools, EQUIP2 partnered with SC to conduct this case study. SC provided access to a sample of their schools; field support from their offices for data collection, transportation and materials; and hired two Save-University Partnership for Education Research (SUPER) fellows who served as the main researchers/data collectors for the study. The following discussion elaborates on the methodology used for collecting and analyzing the data presented in the case study. The results represent the establishment of a baseline of time loss, instructional time on task, and student reading fluency for a sample of SC and control schools. The purpose of the baseline is to assist SC in refining their interventions to better assist teachers and students in the classroom. It is not an evaluation of SC performance.
SamplingThe study examines data at the student, classroom and school level. Twenty SC supported schools were randomly selected, representing 15 percent of the 72 schools SC currently supports in Guatemala. The sample was stratified by distance from an urban center and size of school. Schools were then proportionally selected from three of the areas where SC Guatemala currently works: Nebaj, K’iche’, and Huehuetenango. To ensure a point of comparison, six control schools – two from each area – were also selected. The control schools were selected based on the matched characteristics of distance, size, language and student socio-economic status to ensure comparability. Table 2 summarizes data for the schools.

104
Opp
ortu
nity
to L
earn
: A h
igh
impa
ct st
rate
gy fo
r im
prov
ing
educ
atio
nal o
utco
mes
in d
evel
opin
g co
untr
ies
MethodologyThe research team spent one day visiting each school. A visit consisted of six activities:
• A general observation noting the presence of certain school facilities and whether students and teachers were inside or outside the classroom;
• One hour of observation in Grade 1, 2, and 3 classrooms using the Stallings classroom observation instrument;
• An interview with the principal to obtain information on student enrollment, teachers, teacher and student attendance, support visits received by the school and community participation at the school level;
• Interviews with each of the teachers observed;• Individual student interviews; and • Administration of two reading assessments to measure print awareness and basic literacy skills.
Table 2. Characteristics of sample schoolsSC
HuehuetenangoControl
HuehuetenangoSC
K’iche’Control K’iche’
Overall Sample
Number of schools 6 1 14 5 26Total Enrollment 1,699 208 2,708 1,567 6,182
Enrollment in Grade 3 368 26 442 258 1,094Average Class Size
(Grade 3)30 26 38 32 26
Average Distance from Urban Center
43 min. n/a 47 min. n/a 45 min.
Mother Tongue Mam Mam K’iche’ and Ixil
K’iche’ and Ixil
n/a
Years of SC Support 3 years n/a 3 years n/a 3 years
For the student survey and reading tests, the team randomly selected 20 students from Grade 3 at each school in a boy-to-girl ratio reflective of the gender balance in the full class. The students were first asked a number of questions pertaining to their home environment and attendance at school. The literacy tests included CAP questions to assess pre-reading skills and student familiarity with printed text and books and EGRA components to assess the number of letters recognized in isolation, the number of words read correctly in isolation, and the number of words read correctly in context per minute. The number of words read correctly per minute was used as the measure of reading fluency, a recognized and robust index of reading comprehension that reliably differentiates between strong and poor readers as demonstrated in Matthew Jukes’ 2006 study, Development of Assessments of Reading Ability and Classroom Behavior. The letter recognition, reading fluency, and reading comprehension assessments similar to the elements of the EGRA had been developed by a Save the Children Alliance team as part of the four country study of Rewrite the Future (Naylor et al., 2008).
Save the Children staff pilot tested additional passages for this sample by choosing grade-appropriate passages from past editions of government-issued textbooks (passages were altered slightly to prevent the possibility of children who had seen them previously reading from memory). Those students who were able to read at least 40 words in the first minute were asked to finish the passage and answer four reading comprehension questions.

105
CASE ST
UD
Y: Using O
pportunity to Learn and Early Grade Reading Fluency to M
easure School Eff ectiveness in Guatem
ala
Within each school, each Grade 1, 2, and 3 classroom was observed to record time loss and time-on-task data, and a random sample of 20 Grade 3 students from each of the sample schools was selected to be included in the reading assessments. Table 3 presents the student characteristics for this study.
Table 3. Characteristics of students in the sample
Number of Grade 3 students tested 505Boys 50%Girls 50%
Language spoken as mother tongue:Spanish 11%
K’iche 34%
Mam 30%Ixil 25%
Average age (years) 10% over age (older than 10 years) 40%
% who attended kindergarten 73%% who did not repeat Grade 3 88%
% who live 10 min. or less from school 51%% who walk 10 to 30 min. to school 39.7%
% who walk more than 30 min. to school 9.5%
Average family size 7
% of students who earn money for work 29%% who have in their home:
-a radio 94%-a toilet 82%
-electricity 79%-a television 63%
-a refrigerator 22%The study sample consisted of an even 50 percent gender split. The average age of students in the study was 10 with 40 percent of the sample consisting of overage students. Seventy-three percent of students had attended kindergarten and only 12 percent of students had previously repeated Grade 3. Approximately 34 percent of students spoke K’iche as their mother tongue with an additional 30 percent speaking Mam at home and 25 percent speaking Ixil. Only 11 percent of the study sample spoke Spanish only as a mother tongue. There was no significant variance in characteristics between the students in the SC schools and those in the control schools. In terms of age and mother tongue spoken, 92 percent of students fell within the ages of 9-12 regardless of mother tongue. Moreover, the average age for students was 10 regardless of language. When differences between gender and mother tongue were examined, the same number of boys and girls spoke Mam; 16 more boys than girls spoke Ixil; 13 more girls than boys spoke K’iche; and 8 more girls spoke Spanish. These results were statistically significant at the (0.05) level.

106
Opp
ortu
nity
to L
earn
: A h
igh
impa
ct st
rate
gy fo
r im
prov
ing
educ
atio
nal o
utco
mes
in d
evel
opin
g co
untr
ies
Limitations of the studyWhile the data from this study are robust and representative of education in these SC supported schools, there are important limitations to the methodology and data. First, while the study selected 15 percent of SC schools as the sample, the sample remains small in comparison to the number of schools in Guatemala. EQUIP2 is unable to make larger assumptions about the population of schools as a whole in Guatemala. Moreover, the small school sample reduced the applicability of regression results because small sample sizes reduce the effect. Total number of students tested was 507; 100 classrooms were observed across 26 schools. Second, because of resource and time constraints, this study included only six control schools, which were matched to the SC schools, but again are not sufficient to draw broader conclusions. Finally, many of the countries where this study will be implemented use mother-tongue instruction to teach early grades. However, creating reading assessments in mother tongue – particularly in countries where more than one native language exists—is complicated and expensive (i.e., Guatemala has 24 native languages in addition to Spanish, many of which are not written languages). All EGRA assessments were applied in Spanish language only. The CAP was applied in both Spanish and mother tongue.
FindingsTo look at school-level factors we returned to EQUIP2’s opportunity to learn framework. This study used the 12 OTL factors both individually and collectively to determine the effectiveness of each school in the study at maximizing opportunities to learn.
OTL Factor 1: Percentage of days the school is openThe 2005 Global Monitoring Report proposes that a quality education must start with minimum instructional time of 850-1000 hours per year. In many developing countries, these kinds of target hours are difficult to reach with school days split into shifts, which are required to achieve national coverage with limited infrastructure (Gillies and Quijada, 2008). In Guatemala, the number of official schools days is 180 (900 hours) and the school day is officially five hours in length.
In order to measure the number of actual days that schools in Guatemala are open, the team triangulated data from attendance books and records, principal reported and teacher reported closures (not including planned holidays). Based on these documents, we were able to calculate that schools in this study lost an average of six days of instructional time per year. When compared to the control schools (in red), SC schools were consistently open more often (i.e., an average of two days more).
As Figure 1 demonstrates, an overall average can often mask what is happening at the school level. When we examined school level data, we found a great deal of variance in terms of how many days the schools were closed. The variance ranged from one day to 14 days. The majority of the unplanned school closures were because of training days for teachers or unplanned holidays. On average, teachers missed one or two days/month of school because of training provided by the Ministry of Education (MINEDUC); an average of one day/month as a result of training provided by SC.
The World Bank Rural Access Initiative conducted research in the early 2000s that indicated that the location of the school has a significant impact on student attendance and time loss in schools. In the 26 sample schools we visited in Guatemala, students’ average travel time was an 18 minute walk. However, this time varied significantly across schools, ranging from three to 30 minutes depending on the school. Distance traveled was not significantly correlated with student attendance (0.383) or reading performance (0.019); however, interviews and school observations noted that at least 30 minutes a day (on average) of instructional time was lost when teachers and students arrived late at the schools, which delayed the initiation of the school day.

107
CASE ST
UD
Y: Using O
pportunity to Learn and Early Grade Reading Fluency to M
easure School Eff ectiveness in Guatem
ala
Figure 1. Number of days school was open, school-level variation
175
180f D
ays Scho
ol W
as Ope
n
165
170
Num
ber o
f
Save the Children Schools Control Schools
OTL Factor 2: Teacher attendanceA measure that is difficult to quantify, teacher absenteeism is a widely recognized problem—particularly in rural areas. High rates of teacher absenteeism is associated with a number of factors, including poor, urban communities; limited monitoring and discipline by school directors; infrequent school inspections; and distance from the branch MINEDUC office (Rogers, et al., 2004 as cited in Gillies and Quijada, 2008). Teacher absenteeism affects the motivation of students, continuity of learning, ability to cover curricula, and the overall quality of learning. If students are to learn, it is critical that teachers be in the classroom.
In Guatemala, teacher absenteeism data was difficult to collect and an average absenteeism rate had to be triangulated between the principal log book and the teachers’ student absenteeism logs across the seven months that the schools had been opened. On average across the 26 schools, teachers were absent two days a month, or approximately 11 percent of the year. There was little variance across the schools in terms of teacher absenteeism (i.e., one to five days). This absentee rate is consistent with a study conducted by Chaudhury (2005), which showed teacher absenteeism rates ranging from 11 to 27 percent in countries such as Bangladesh, Ecuador, India, Indonesia, Peru, and Uganda. There was no documented difference in teacher attendance between the SC and control schools.
OTL Factor 3: Student attendanceStudent attendance is another factor that is critical to improved learning. If the student is not present and ready to learn, he or she cannot take advantage of opportunities to learn. Similar to teacher absenteeism, there are few studies that have been able to quantify student absenteeism because school and teacher records tend to be sparse.
An FHI 360 project evaluation study in Guatemala found that children who were promoted from Grade 1 to 2 had a significantly higher attendance and punctuality record than those who did not pass (Chesterfield as cited in Gillies and Quijada, 2008). The data collected by this study indicates that across the sample schools, students were present more than 98 percent of the school year.

108
Opp
ortu
nity
to L
earn
: A h
igh
impa
ct st
rate
gy fo
r im
prov
ing
educ
atio
nal o
utco
mes
in d
evel
opin
g co
untr
ies
Because most students traveled only 15-18 minutes to school every day, the high student attendance rate could be because of the close proximity of the school to the students’ homes.
The analysis of variance for student absenteeism under the current study showed that the difference in attendance rates by school was statistically significant (p<0.01). The average number of days lost per student over the school year ranged from three to 31 days which represents between 2 and 17 percent of the total learning time available to them.
OTL Factor 4: Percentage of school day available for instructionThe official school day in Guatemala begins at 7:30 a.m. and ends at 12:30 p.m. Across almost all the schools that were visited, classes did not begin until 8 a.m. Principals and teachers interviewed indicated that classes were not planned to start until 8:00 a.m., and in several cases teachers arrived later than the students. On average, 24 of the 26 schools lost 30 minutes at the beginning of the day waiting for teachers and/or students to arrive at the school. While there was not a significant correlation between distance traveled to school and official start times, interviews with teachers and school directors clearly indicated that the late start was a result of the distance students had to travel—and that they consistently arrived late.
In addition to the late start, recess—normally scheduled for 30 minutes—ran over time between five to 30 minutes depending on the school. The average extra time for recess across the sample was 20 minutes. When counted together with actual recess, this represents an average loss of 50 minutes of class time. While EQUIP2 is not advocating for removing recess time, it is important to note that recess is lost instructional time and when it extends beyond its planned 30 minutes, lost instructional time is increased. If the average time taken for recess is then aggregated with a 30 minute late start, and an average 15 minute early close to the school day for the purposes of classroom management (i.e., cleaning blackboards, straightening the room) activities, the useable instructional time has been reduced by more than an hour. Over the course of the year, this daily lost time adds up to an average total loss of 38 instructional days (See Annex III for calculations). Again, the variation in time loss ranged from a low of 23 days to a high of 75 days.
OTL Factor 5: Percentage of student time-on-taskFor the purposes of this study, measured time on task refers to the engaged time that students are paying attention to materials with instructional goals; time on specific academic activities; and academic learning time, compared to the allocated time for each subject. In Guatemala, total instructional time in one day is five hours, 180 days per year, for a total of 900 hours.
Using the Stallings classroom observation instrument, the EQUIP2 team observed 100 Grade 1, 2, and 3 classrooms to document how teachers were using instructional time and whether teachers and students were engaged in learning activities. It should be noted that the Stallings classroom observation instrument measures the percentage of time the teacher is engaged in a task. However, for students, it measures the percentage of students that are engaged in activities over the course of the observation period. The following analysis presents the findings of this study.
Classroom instructional use of timeThe Stallings classroom observation instrument considers both teachers and students as “off task” when they are not engaged in academic learning activities. Off-task activities include discipline, classroom management, socializing, unengaged in the activity, or when out of the room. On-task activities include: reading aloud, demonstration/lecture, discussion/debate, practice/drill, seatwork, verbal instructions, reading silently, and interpreting text.
When examining variation across the 26 schools, we found some variance in terms of the percentage of time that teachers were on task, though it was not significant. Overall teachers were on task 70

109
CASE ST
UD
Y: Using O
pportunity to Learn and Early Grade Reading Fluency to M
easure School Eff ectiveness in Guatem
ala
percent of the time with the range of time-on-task running between 53 and 85 percent. There was no statistical difference between the SC and control schools in terms of teachers and students on task.
Figure 2 demonstrates the variations in time on task by school, teachers and students. In 16 schools, teachers were on task more than 70 percent of the time and in five schools teachers were on task at least 80 percent of the time. In these cases, 14 schools had students who were on task at least 50 percent of the time. In five cases, students were on task for a larger percentage of time than teachers. While the teacher time-on-task is reasonable, student time-on-task is still low in most of the sample schools, particularly because in many cases students are on task only 50 to 60 percent of the time they are in class, which is already significantly reduced because of daily time loss and absenteeism. By comparison, U.S. teachers reported that only 64 percent or instructional time was related to academics—the remainder being used in maintenance, enrichment and recess. (Massachusetts 2002 Research Digest as cited in Gillies and Quijada, 2008). However, in the United States, daily time loss and absenteeism are less of an issue, which increases the number of overall days students have for instruction.
The result of this analysis indicates that teachers in the sample schools could use additional support with classroom management as well as use of instructional time for academic learning.
Figure 2. Percentage of students on task when teacher was on task, by school
ools
mpl
e Sc
ho
Student on Task
Teacher on Task
vidu
al S
am
Teacher on Task
Indi
v
0% 10% 20% 30% 40% 50% 60% 70% 80% 90%
Percentage of Students On Task
Teacher off task and on taskBased on observations in this study, on average when teachers were off task, 68 percent of students were also off task (i.e., engaged in social interaction or just not engaged). When the teacher was on task, on average only 32 percent of students were off task. However, while teacher on and off task was positively correlated to student performance, the results were not statistically significant. It is important to note that being on-task does not necessarily mean that quality teaching and learning is occurring in the classroom. The category simply implies that teachers and students were engaged in academic activities. While the team was interested in the correlations among time-on-task and

110
Opp
ortu
nity
to L
earn
: A h
igh
impa
ct st
rate
gy fo
r im
prov
ing
educ
atio
nal o
utco
mes
in d
evel
opin
g co
untr
ies
student performance, it was also critical to document the amount of time being lost in the classroom and understand what the teachers were doing to engage students in academic activities.
Figure 3 indicates that when teachers were off task, students read silently (2 percent); copied text from the blackboard (7 percent); or did seatwork (23 percent). The rest of the students (68 percent) were either engaged in social interaction or some other “non-academic” activity.
Figure 3. Student activities when teacher was off task
Read Out Loud
Discussion
Demonstration
tivity
Seatwork
Practice
dem
ic A
ct
Verbal Instr
Copying
pe o
f Aca
d
Reading Silently
Verbal Instr
Typ
0% 5% 10% 15% 20% 25%
Interpretation
Percentage of Students Engaged in Activitye ce tage o Stude ts gaged ct ty
Figure 4. Student activities when teacher was on task
Read Out Loud
Discussion
Demonstration
ivity
Seatwork
Practice
dem
ic A
ct
Copying
pe o
f Aca
d
Reading Silently
Verbal Instr
Typ
0% 5% 10% 15% 20%
Interpretation
P t f St d t E d i A ti itPercentage of Students Engaged in Activity
When the teacher was on task and working with students to present or oversee academic activities, there was a greater variation in the types of pedagogical approaches being employed by the teacher, and more students engaged in learning. As Figure 4 indicates, students still spend more time doing seatwork than other types of activities; however, there is increased discussion or debate in the classroom that is related to academic content as well as reading aloud and demonstration.
Time-on-task by department and subjectIn an effort to understand whether time on task differed by region, we disaggregated the results by areas visited (i.e., Nebaj, Huehuetenango, and K’iche’). Table 4 presents a synthesis of the percentage of students on task by subject and geographical area.

111
CASE ST
UD
Y: Using O
pportunity to Learn and Early Grade Reading Fluency to M
easure School Eff ectiveness in Guatem
ala
Table 4. Percentage of on-task students by subject and department
Department Math Science ReadingHuehuetenango 51% 52% 53%
Nebaj 47% 36% 45%K’iche’ 49% 61% 44%
Students in Huehuetenango had little variation in terms of their time on task across subjects. In Nebaj and K’iche’, there was more variation in the engagement of students in science classes. There were also differences in the types of pedagogical activities linked to each subject. For math, students were engaged in more practice and drill activities. In science, the majority of students’ time-on-task was spent in demonstration and lecture. For reading, students spent most of their engaged time doing seatwork or copying. These categories did not vary when disaggregated by department.
When researchers examined the total time left for instruction when students were on task (i.e., accounting for all previous OTL indicators); Huehuetenango had the most instructional time left at 66 days compared to 55 days in Nebaj and 48 days in K’iche’. While students in K’iche’ spend more time on task by subject than Nebaj, it is important to note that there is greater time loss in K’iche’ accounted for by the other OTL factors, such as absenteeism and daily time loss caused by late starts, recess, and early close.
Time-on-task by gradeAfter examining time-on-task by subject and department, the team wanted to understand whether there were any differences in teacher and student time-on-task by grade. As Table 5 shows, there is little variation in the types of pedagogical activities across the grades.
As indicated in Table 5, the majority of academic learning time is spent copying text from the blackboard or doing seatwork. The percentage of engaged students declines across all activities (except copying, which increases in Grade 3). The percentage of students off task also increases as students get further along in their education. Over the entire sample it was found that students were off task an average of 41 percent of the time, which represents a drastic reduction in the time used for learning.
Table 5: Percentage of students engaged in academic activities, by grade
Activity Grade 1 Grade 2 Grade 3Reading Out Loud 6% 3% 3%
Demonstration and Lecture 6% 6% 6%Debate/Discussion 6% 8% 7%Practice and Drill 6% 4% 4%
Seatwork 24% 22% 18%Copying 5% 5% 9%
Verbal Instruction 4% 8% 7%Students Reading 0% 1% 0.4%Interpreting Text 0% 0% 0%
Students Off Task 40% 41% 44%
Time loss caused by students and teachers off taskOut of the 180 official instructional days, students are only receiving an average of 97 days of instruction after accounting for days the school is closed, late start, extended recess, early close, and

112
Opp
ortu
nity
to L
earn
: A h
igh
impa
ct st
rate
gy fo
r im
prov
ing
educ
atio
nal o
utco
mes
in d
evel
opin
g co
untr
ies
teacher/student absenteeism (44 percent loss of time annually). When the additional time loss within the classroom caused by students and teachers who are off task is calculated, there are approximately 56 days left of instructional time spent on task that students receive annually.
OTL Factor 6: Equivalent percentage of days available for instructionIn this study, researchers combined factors 1-5 into a factor termed “equivalent percentage of days for instruction” (Factor 6). The objective was to compare the amount of time actually available for instruction to the amount of time potentially available based on the official school calendar.
To estimate the number of days available for instruction, researchers subtracted the number of days the school was closed, the number of days lost because of teacher and student absence, the amount of instructional time lost because of late openings/early closes/extended recesses, and the number of days lost because students were off task from the number of days in the school calendar (180 days). Figure 5 shows the total time loss for the OTL factors in Guatemala.
Figure 5. Total time loss for OTL indicators
180
200
180175
146150Lear
ning
135
97aila
ble
for L
Official DaysSchool Closed97
56
100
f Day
s Av
a School ClosedTeacher AbsenceStudent AbsenceDaily Time LostTime-on-Task56
50
Num
ber o
f Time on Task
0
Figure 6. Days of lost instruction by OTL component and geographical area180
6757 51
140
160
180
Lear
ning
4838
100
120
140
ilabl
e fo
r L
Time remaining
Time-on-Task
38 41
39
42
60
80
f Day
s Av
a Daily Time Lost
Student Absence
Teacher Absence
14 1933
10 13
1538 41
20
40
Num
ber o
f
School Closed
9 2 40
Huehuetenango Nebaj Quiche
N
Geographic Area

113
CASE ST
UD
Y: Using O
pportunity to Learn and Early Grade Reading Fluency to M
easure School Eff ectiveness in Guatem
ala
In Guatemala, the greatest loss of instructional time occurs from the late start, early close, and extended recess—or daily time loss. This was true for both the SC and the control schools in the sample. Of the 180 official instructional days, students are only receiving an average of 97 days of instruction (44 percent loss of time annually). When the total time was disaggregated by SC and the control schools, SC performed slightly better with 61 days of total instructional time compared with 51 days in the control schools.
The overall school results vary slightly by area, as shown in Figure 6. In Huehuetenango, the greatest loss of time occurs with daily time loss (i.e., late start, recess, early close). However, there is less teacher and student absenteeism as well as time-on-task loss than in the other areas and an overall average of 67 days of instructional time remaining for instruction when all the OTL indicators are taken into account.
In Nebaj, there is a greater loss of time caused by “daily time loss, while teacher and student absenteeism are about equal to the time loss for these components in Huehuetenango. However, students are losing six more days to time loss in the classroom (42 compared to 48), leaving only 57 days of instructional time remaining when all the OTL indicators are calculated.
The schools in the area of K’iche’ had the highest teacher absenteeism rate of the three areas and are losing almost 39 days of instruction because of late starts, extended recesses and early closings of the school. This area retains the least number of instructional days: 51.
Across the three areas, an increased focus on ensuring that school started on time and that recess only ran for 30 minutes (i.e., instead of 15-20 minutes longer) would add an average of 4.5 additional hours a week of instructional time, or almost 33 days over the school year.
At the school level, there was greater variation in the components of the opportunity to learn. Schools varied in the time remaining for instruction from 32 to 82 days. Daily time loss and time lost to time-on-task were the two areas where the major losses of time occurred. The chart below shows the time loss by school. As Figure 7 illustrates, schools varied significantly in time loss for the first four factors. Instructional time remaining ranged from a low of 56 days to a high of 129 days, with the daily time loss generally having the greatest impact on effective time remaining for instruction.
Figure 7: School-level variation
e Sc
hool
s
School Closed
Teacher Absence
ual S
ampl
e
Student Absence
Daily Time Lost
Time-on-Task
Indi
vidu Time-on-Task
Time remaining
0 20 40 60 80 100 120 140 160 180
Number of Days Available for Learning

114
Opp
ortu
nity
to L
earn
: A h
igh
impa
ct st
rate
gy fo
r im
prov
ing
educ
atio
nal o
utco
mes
in d
evel
opin
g co
untr
ies
In addition to the snapshot tool used to collect information on classroom activities and time on task, the research team designed a general observation instrument based on the Guatemalan standards for what teachers and students should be doing in the classrooms. For example, teachers were rated on their ability to manage time effectively, their classroom management skills, and the manner in which they engage students in learning. For each activity or competency, teachers were rated on a scale of zero to three: zero meaning the activity was not observed; one if the teacher executed the activity poorly; two for somewhat well, and three for very well.
In terms of the pedagogical skill level of teachers through the overall sample, the average score for classroom management skills, time management skills, and for the use of different instructional resources was 2, or somewhat well. Overall, teachers were rarely observed teachers engaging students in activities to develop problem solving skills or higher order and critical thinking skills. Teachers were also more likely to be observed giving students feedback, or supervising seatwork. Students are rarely led in reading activities (0.87) or asked to use their reading skills to assimilate information in other subjects (0.23). The study shows that teachers need more support to build connections between the different subjects they are teaching, and to help students connect their learning to their own life experiences and problems. The activities with the highest averages included effective use of different instructional resources and strategies (1.74); asking students probing and open-ended questions (1.59); providing students with the opportunity to voice and debate their own opinions (1.03); engaging the teacher in open-ended discussions and asking questions about content (0.95).
OTL Factor 7: Percentage of Students with a TextbookAs Figure 8 demonstrates, classroom observations revealed a great deal of variation in the percentage of students who have language arts books. The range went from 0 to 123 percent, indicating the school had more books than students. Nearly 100 percent of students in all the schools had notebooks and pencils. In terms of notebooks, only three schools indicated less than 95 percent of students with notebooks. In terms of pencils/pens, seven SC schools fell under the 95 percent threshold and could use additional support in the provision of these types of materials to students.
Figure 8: Percentage of reading textbooks by schools
60
80
100
120
140
ays
Avai
labl
e fo
r Lea
rnin
g
0
20
40
1 2 3 4 5 6 7 8 9 10 11 12 13 14 15 16 17 18 19 20 21 22 23 24 25Num
ber o
f Da
SC Schools Control Schools
Materials, furniture, and school environmentMaterials relate to a broad category of items such as textbooks, instructional guides, workbooks, audio-visual materials, and supplementary readers in libraries, classrooms, or homes. Of these, textbooks are the most commonly utilized, or at least studied and documented, input for classroom instruction (Gillies and Quijada, 2008).
As part of this study the team conducted school observations, classroom observations, and interviewed principals about the availability of materials (i.e., textbooks, pencils, pens, notebooks)

115
CASE ST
UD
Y: Using O
pportunity to Learn and Early Grade Reading Fluency to M
easure School Eff ectiveness in Guatem
ala
and furniture in their school. When principals were asked to report on the availability of chairs, desks, and reading materials at their schools, 64 percent reported that their schools had enough basic furniture for all of their students. For SC schools, 68 percent of principals reported having enough basic furniture. For the schools without enough furniture, 79 percent had only half or less than half of the necessary amount of chairs and desks needed for their students.
When the schools were disaggregated by SC and control, SC schools were able to provide 74 percent of students with textbooks compared to 52 percent at the control schools, though it was not always clear whether the books on the shelves were being used. The better performance by SC schools is supported by the fact that SC interventions ensure schools have sufficient materials to support student learning. Table 6 provides a summary of the percentage of students who have each of the types of materials available in the classroom.
Table 6. Percentage of students with learning materials, disaggregated by Save the Children and Control schools
Language Arts Textbooks Notebooks Pencils
Save the Children 74% 98% 95%Control 52% 99% 96%
Combined Average 70% 98% 95%
OTL Factor 8: Percentage of Observed Textbook UseFew students were observed using textbooks in Guatemala, with a great deal of variation among schools. Figure 9 combines OTL factors 7 and 8 to show how textbook availability and use were interrelated in the schools studied. The vertical axis plots the percentage of observations during which textbook use was noted and the horizontal axis plots the percentage of students with a language arts textbook. Each data point represents a school.
Figure 9. Percentage of students observed using a textbook for a given level of textbook availability
6%
8%
10%
12%
14%
16%
dent
s O
bser
ved
Usi
ng T
extb
ooks
0%
2%
4%
0% 10% 20% 30% 40% 50% 60% 70% 80% 90% 100%
Perc
enta
ge o
f Stu
Percentage of Students with Textbooks
It is interesting to note that the majority of data points for schools in Guatemala cluster in the lower-right side of the graph. This indicates high textbook availability in a school was associated with relatively low observed textbook use.

116
Opp
ortu
nity
to L
earn
: A h
igh
impa
ct st
rate
gy fo
r im
prov
ing
educ
atio
nal o
utco
mes
in d
evel
opin
g co
untr
ies
OTL Factor 9: Percentage of Time Spent ReadingClassroom observations revealed that reading instruction was almost nonexistent. Students were rarely observed reading aloud, reading silently, or interpreting text. This occurred less than 12 percent of the time in Guatemala.
While more than 90 percent of students in the study had access to language arts textbooks, researchers rarely observed textbook use in class. Reading passages and stories were easy to locate, but were rarely in the mother tongue. In fact, the only schools possessing Mayan story books were those supported by Save the Children, and even then these books were usually locked in the principal’s office. No structured approach to reading was observed in any classroom in this study.
OTL Factor 10: Grade 3 Reading FluencyReading ability is both an outcome of opportunity to learn and is a critical factor determining whether students can continue to learn and advance through school. If students do not acquire an adequate level of reading ability early on in their schooling, they fall further and further behind, thus their continued opportunity to learn depends on their level of reading ability.
Given the lack of focus on reading and reading instruction, it was not surprising to find reading performance among students in Grade 3 was low, averaging 47 wpm. However, approximately 30 percent of students were able to read 60 wpm or better and 19 percent of students could read 70 wpm or more; 33 percent were between 41-60 wpm; and only 35 percent were below 40 wpm (see Figure 10). Research conducted by Helen Abadzi (2008) suggests that students learning English or Spanish should be able to read 80–90 wpm by Grade 3.
Figure 10. Reading fluency results for all students, percentage of students who can read
Zero wpm
Between 10 and 20 wpm
Up to 10 wpm
Flue
ncy
Between 30 and 40 wpm
Between 20 and 30 wpm
Rea
ding
F
Between 50 and 60 wpm
Between 40 and 50 wpm
Leve
l of
More than 70 wpm
Between 60 and 70 wpm
0% 5% 10% 15% 20%
Percentage of Students
When results were disaggregated by mother tongue, students who spoke K’iche outperformed the other language groups (57 wpm) compared with 40 wpm for Mam speakers and 41 wpm for Ixil Speakers. Table 7 summarizes findings by language group.

117
CASE ST
UD
Y: Using O
pportunity to Learn and Early Grade Reading Fluency to M
easure School Eff ectiveness in Guatem
ala
Table 7. Reading fluency, by language groups
LanguageAverage correct
wpmAverage words read correct in passage
Mam 40 91Ixil 41 90
K’iche 57 94Spanish 55 95
When results were disaggregated by department, students in K’iche’ outperformed students in Nebaj and Huehuetenango. Students in K’iche’ were able to read an average of 60 wpm compared to 40 wpm in Huehuetenango and 42 wpm in Nebaj. Students in the SC schools slightly outperformed the control schools. However, the one control school was a significant outlier, with students outperforming all other schools in the sample. This outlier skewed the results for the control schools. Once this outlier was removed from the control sample, SC schools outperformed control schools.
There was a strong correlation between how students performed in the CAP and EGRA components of the study. Concepts about Print were used to probe the pre-reading skills in the students with the lowest reading fluency scores. The 80 students who read 40 wpm or less were still able to answer an average of 7.5 out of 10 questions correctly on the Spanish CAP. The students who answered less than five questions on the CAP correctly were asked to retake the CAP in their mother tongues (MT). When the CAP was applied in MT to students reading less than 4 wpm, they also were able to answer an average of 7.5 questions correctly in MT on the CAP. This result indicates students in Grade 3 are acquiring pre-literacy skills and understand Concepts about Print in either Spanish or MT.
Table 8. Student reading fluency by CAP scores in Spanish and mother tongue
0-40 wpm 41+ wpmNumber of Students 80 192
Average # of correct CAP questions in Spanish 7.5 8
Number of Students 107 126Average # of correct CAP
questions in MT 7.5 9
As shown in Table 8, students who were able to read 41 wpm or more answered an average of eight CAP questions correctly in Spanish. Those who took the CAP in their mother tongue answered an average of nine questions correctly. On average, students who read less than 60 wpm retook the CAP in MT.
When the team examined the number of reading comprehension questions students were able to correctly answer, 52 percent of students who read 40 wpm or less answered two reading comprehension questions correctly. Of the students who read more than 40 wpm correctly, 46 percent answered two reading comprehension questions correctly and 45 percent answered all three questions correctly. These results indicate that while students are reading slowly, they do seem to understand what they read and are therefore acquiring a basic level of reading fluency.
Table 9 identifies the best- and lowest-performing schools. As the table demonstrates, all but one of the top performing schools were SC-supported schools with reading fluency scores that ranged

118
Opp
ortu
nity
to L
earn
: A h
igh
impa
ct st
rate
gy fo
r im
prov
ing
educ
atio
nal o
utco
mes
in d
evel
opin
g co
untr
ies
from 59-67 wpm. Students in this group were able to answer two to three reading comprehension questions correctly, and on average completed reading the entire paragraph with 94 percent accuracy.
Table 9. Top and lowest performing schools
Top Performing
Schools Average wpm% not reading
SC or Control
Years supported by
SAVE SC Supporta
11 67 0% C n/a n/a 2 67 0% S 3 1,2,4,53 64 0% S 5 1,3,4,54 59 0% S 3 1,3,4,55 59 0% S 3 1,3,4,5
Lowest Performing
Schools Average wpm% not reading
SC or Control
Years supported by
SAVE SC Supporta
1 25 10% S 3 1,2,4,52 26 20% C n/a n/a 3 33 0% S 3 1,2,4,54 34 0% S 3 1,2,4,5
15 37 15% S 3 1,2,4,5a. SC interventions are as follows: 1) pre-primary support (materials, pedagogy, technical Assistance); 2) primary support Grades 1-6 (materials, pedagogy, technical assistance); 3) primary support Grades 1-3 (materials, pedagogy, technical assistance; 4) teacher training; 5) community involvement.
Students in the lowest performing schools were unable to reach the 40 wpm threshold with the Grade 3 text and had several students who were unable to read at all. When the students in this group were dropped to an easier text—Grade 2, Unit 4—their performance on the reading fluency did not improve, indicating the students were struggling with the fundamentals of reading in general.
Understanding variations in student outcomes—individual factorsTo try and understand the variations in reading performance both at the aggregate level (i.e., by area) and individual student level, the team examined individual factors such as gender, age, repetition rates, mother tongue language, and socio-economic indicators.
Gender and ageThere was no significant correlation between the age of the student and performance on the reading assessments, though students between the ages of 10-12 tended to have higher fluency scores. Repetition rates were also generally not statistically significant against reading fluency.
Gender was also not significantly correlated with reading outcomes. However, girls outperformed boys on the reading fluency assessment. On average, girls read 49 wpm correctly compared to 46 wpm for boys. Twenty-five percent of girls read up to 32 wpm correctly; 50 percent read at least 49 wpm correctly; and 75 percent or more read 67 wpm correctly, compared to 29 wpm, 46 wpm, and 62 wpm, respectively, for boys.

119
CASE ST
UD
Y: Using O
pportunity to Learn and Early Grade Reading Fluency to M
easure School Eff ectiveness in Guatem
ala
Socioeconomic indicatorsData gathered to determine the children’s socioeconomic status included information about the type of roof, walls, and floors and the number of rooms children had in their homes, the number of children and adults living in the home, and whether families had basic utilities such as a radio, electricity, or a toilet. The differences found for each category were minimal. More than 90 percent of the students attending SC schools had either tile or metal roofs, 80 percent had adobe or cinderblock walls, and 60 percent had dirt floors. Only 22 percent of children had a refrigerator, while the majority of the sample reported having a radio, electricity, a television, and a toilet. There was little variation across the sample.
Similar to children attending SC schools, 90 percent of children in the control schools had tile or metal roofs, 75 percent had adobe or cinderblock walls, and 50 percent had dirt floors. Over 80 percent of children reported having electricity, a radio, and a toilet inside their home.
Language The language spoken in the students’ homes was the main factor that was correlated with students’ performance on the reading fluency assessments.
Spanish most often served as the language of instruction within the Grade 3 classrooms included in the sample. However, for many children in this study, Spanish was not the language spoken in the home. Only 11 percent of students reported that they used Spanish in their homes. Within both the overall sample and the sample of SC schools, the differences in results for reading fluency between students speaking K’iche’ and Mam, K’iche’ and Ixil, Spanish and Mam, and Spanish and Ixil were statistically significant (see Table 10).
Table 10. Reading fluency of students by language
K’iche’ Mam Ixil SpanishOverall 57 41* 42* 55
Save the Children 53 42* 40* 52Control 52 42* 41* 53
* = average student wpm correct significantly lower than average among both K’iche’ and Spanish groups.
In the overall sample, on average students who spoke K’iche’ at home had a reading score of 57 wpm. Those who spoke Spanish scored an average of 55 wpm, while those who spoke Ixil and Mam read an average of 41 wpm, respectively. As previously discussed, schools in the K’iche’ area were closer to urban centers, so researchers speculate that students might have access to more print materials in Spanish than in the other regions.
The average reading scores by mother tongue for children within SC schools differed only slightly from the overall sample and were also statistically significant (p<.000). On average K’iche’ and Spanish speakers’ scores were very close: 53 and 52, respectively. Mam speakers scored slightly higher than Ixil speakers: 42 and 40, respectively.
The differences in results for the reading fluency scores by mother tongue for the control schools were also statistically significant (p<.000). Children who spoke Mam and Spanish at home had the highest average reading score (59), while children who spoke Ixil and K’iche’ at home had the lowest score. Of the children who spoke only Spanish, K’iche’, Mam, or Ixil at home, Spanish speakers’ average reading score was almost the same as those speaking K’iche’ (53 and 52, respectively). The average reading score for children who spoke Ixil was just below those who spoke Mam (41 and 42, respectively).

120
Opp
ortu
nity
to L
earn
: A h
igh
impa
ct st
rate
gy fo
r im
prov
ing
educ
atio
nal o
utco
mes
in d
evel
opin
g co
untr
ies
AttendanceThere was also a correlation between student absenteeism and performance on the reading assessments, but the correlation was not statistically significant. Students who were absent more often performed worse on the reading assessment. While age was not correlated with student reading performance, Grade 2 absentee rates were negatively correlated and significant at the (.005) level. For each additional day the student missed in Grade 2, there was a 0.125 drop in correct words per minute.
OTL Factor 11: Class SizeWhile class sizes in the study varied significantly—ranging from 10 to 55 in Grades 1 through 3—more than two-thirds of classrooms had fewer than 30 students. The average class size across the 26 schools was 27 students per teacher. When the data was correlated with the results for the reading assessment, average class size had no relationship with student reading fluency or performance on the CAP. However, we did find that larger schools performed better on the reading assessment, though it was also not statistically significant. We speculate that larger schools performed better due to their proximity to urban areas and therefore, more access to print materials. However, there was also no significant correlation between class size and distance of schools from a town district.
OTL Factor 12: School SupportIn principle, government systems of education provide ongoing training and supervision/support for teachers. However, as the EQUIP2 complementary education research (2007) demonstrated, regional or district education support personnel rarely if ever visit all the schools in their jurisdictions, especially those in the most remote parts of the country.
As Table 11 indicates, the schools and teachers in this study are being visited and observed by either principals or external school support personnel. In terms of formal observations, 48 percent of principals indicated they never formally observed their teachers. However, nearly 76 percent of principals indicated that they did informally observe teachers at least once or twice a month. The nature of these informal observations included verifying teachers were following their lesson plans; verifying student attendance; and verifying teachers were following the methodologies they had been asked to use in the training program.
In addition to formal and informal observations, 58 percent of principals indicated that they reviewed teachers’ lesson plans weekly. Principals also indicated that they met individually with teachers daily, weekly, or twice a month. Principals in the SC schools met with teachers on a more regular basis (56 percent of principals had individual meetings).
The total number of visits that schools received by August of 2008 ranged from zero to 30 with 50 percent of schools within the overall sample reporting between one and seven visits this year. Forty-five percent of schools in the overall sample reported that they receive support visits from outside personnel or education officials once a month, but few of those visits focused on supporting teacher’s pedagogic improvement. Another 19 percent of schools reported being visited twice a month, while 10 percent said they were only visited once a semester or once a year. All but one school reported they had been visited in the year of 2008; the remaining school was last visited in 2007.
Within the sample of SC schools, 100 percent of the schools reported receiving visits from someone from SC; 47 percent reported an education staff member from the local municipality had visited the school; and 32 percent were visited by someone from MINEDUC. By comparison, 33 percent of control schools were visited by an education staff member from the local municipality, 17 percent by MINEDUC, and 33 percent by other organizations. In the majority (65 percent) of cases, these visits were a surprise.

121
CASE ST
UD
Y: Using O
pportunity to Learn and Early Grade Reading Fluency to M
easure School Eff ectiveness in Guatem
ala
Table 11. Characteristics of school support services
Overall SCFormal Principal Observations of Teachers:
Never 48% 53%Weekly or Twice per Month 32% 15%
Informal Principal Observations of Teachers:Never 8% ---
Weekly or Twice per Month 76% 74%Principal Reviews Lesson Plans Weekly 58% 58%
Principal Meets Individually with Teachers:Never 27% ---
Daily, Weekly, or Twice per Month 40% 56%Principal Meets with Groups of Teachers Daily, Weekly,
or Twice per Month 60% ---
School Support Visits from External Stakeholders:Once per Month 45% 100%Twice per Month 19% ---
Once per Year/Never 10% ---For the overall sample, the length of time that the outside personnel stayed at the school ranged from just one hour to a full day (five hours), while the majority (64 percent) of visits lasted between three to five hours. During most visits (63 percent), personnel observed teachers teaching, but in only about half of the schools the visitor met with teachers individually or in groups (50 and 46 percent, respectively). In only about 20 percent of the schools did the visitors work with the principal on administration or management issues (26 and 17 percent, respectively). Teachers indicated they would like to have the school support personnel spend more time working with them on their pedagogical approaches because they thought this support was generally lacking.
Finally, all 25 schools reported having a school management committee (SMC), the majority of which met monthly (50 percent) or weekly (29 percent). In 65 percent of schools, the SMC met with the principal weekly or twice a semester but in terms of teachers, in the majority of schools (56 percent) the committee only met with them once or twice a month. Eighty percent of schools reported their SMC receives special training in how to support schools.
Financial supportThe previous complementary education research demonstrated that when communities contribute to the financial aspects of running the schools, there is a higher level of accountability for performance expected by all stakeholders—especially the community. When researchers examined aspects of financial support, they found the following:
• All schools within the sample report receiving financial support from the government to pay for teachers’ salaries
• 68 percent report receiving funding from the government for materials• 48 percent report for infrastructure and only 6 percent receive funds for other expenses • Within the sample of SC schools, 64 percent receive financial support from SC for materials and
equipment, while only 13 percent receive funding from SC for infrastructure • Only nine schools in the entire sample report receiving funding from the community, support
that is provided for infrastructure and other expenses such as snacks

122
Opp
ortu
nity
to L
earn
: A h
igh
impa
ct st
rate
gy fo
r im
prov
ing
educ
atio
nal o
utco
mes
in d
evel
opin
g co
untr
ies
While financial support provided to the schools comes mostly from the government, parents played an important role at the schools through donated labor to help maintain and improve the schools. Sixty-three percent of principals within the sample reported parents support the school through building and maintaining property and infrastructure. At 25 percent of schools within the sample, parents help to raise or manage school funds.
In the complementary education research, school support services played a critical role in improving the effectiveness of the complementary models when compared to government schools. While all participants indicated the importance of this support—even requesting additional support—none of the factors were correlated with improvements in student learning.
ConclusionsDeveloping countries and international agencies recognize that gains in access to schooling alone are not sufficient to build the human resource base needed for economic development and are increasingly directing their attention and investment to improving learning outcomes for students. To improve learning, students must be given a basic opportunity to learn—meaning the teacher needs to be in class every day; students need to be present; they need materials to learn; and they need to spend increasing time-on-task. This study examined whether a sample of schools in Guatemala provides students with a basic opportunity to learn. Conclusions are presented below.
What variation is there in schools’ provision of opportunity to learn and how does actual opportunity to learn compare to potential opportunity to learn?The potential opportunity to learn in Guatemala is approximately 180 days or 900 hours of instructional time, of which students are entitled to a 30 minute recess during the school day. When the actual levels of opportunity to learn provided by the schools was examined, the team found that students across the 26 schools were receiving approximately 56 days of solid instructional time on task—a loss of almost 70 percent of instructional time resulting from factors such as unexpected school closings, daily time loss, absenteeism, and unfocused time-on-task. The greatest loss of time in all 26 schools was a result of classes starting late – an average of 30 minutes per day; extended recess that tended to run 15-20 minutes longer than planned; and early close for classroom management activities.
In terms of variations across the schools, the number of instructional days ranged from a high of 82 days (46 percent of total available time) to a low of 32 days (18 percent of available instructional time). The SC schools outperformed the control school, offering approximately 10 days additional instruction per year. Schools in the area of Huehuetenango offered the most instructional days (66) on average.
In terms of the school characteristics that were examined that could influence OTL, the only significant factor that impacted student learning was the language spoken at home. Overall, students who spoke K’iche—or a combination of K’iche and Spanish—outperformed students who spoke Mam, Spanish, and Ixil in the home. While more research is needed to better understand why students in this language group performed better, EQUIP2 speculates that students in the K’iche’ area were closer to urban areas and had more access to print material both in school and in the home. Additionally, the schools in K’iche’ were the only schools were researchers found the presence of the Mayan storybooks provided by SC.

123
CASE ST
UD
Y: Using O
pportunity to Learn and Early Grade Reading Fluency to M
easure School Eff ectiveness in Guatem
ala
What is being done by teachers with the existing opportunity to learn to assist students in building foundational reading skills?As the classroom observations reflected, approximately 40 to 44 percent of in-class time is being lost to teachers and students off task (i.e., discipline, social interaction, unengaged time, and classroom management). Of the time spent on task, students across the three grades spend the majority of their time doing seatwork or copying from the blackboard. However, when the teacher is fully engaged with the students, there is a wider variety of pedagogical approaches used in the classroom.
Within subjects, results showed teachers spend more time in practice and drill activities in math; demonstration-type activities in science; and seatwork when focused on reading activities. These types of pedagogical approaches are consistent with the particular subject areas. However, it is important to note that across the 26 schools and 100 classrooms, researchers observed almost no direct reading instruction, nor did observations reveal students reading aloud, to themselves, or analyzing/interpreting text.
While the students in this case study were generally able to read at an average of 50 wpm, the fluency speed is still lower than one would expect by the time students reach Grade 3. An increased focus on reading instruction and time to read would assist students in solidifying their foundational reading skills as they ready for the upper grades of primary school.
Policy implicationsDecades of school improvement work have focused on assisting children to learn. Yet, school quality still poses a challenge for educators and policy-makers alike (World Bank, 2006). As this study has demonstrated, students are losing important instructional time in the classroom; reading at relatively low levels; and in some instances, lack the learning materials to improve or even assist performance. The following discussion provides insights into possible interventions that could improve the classroom environment and help kids learn.
This research brings into question several issues about school effectiveness in a series of sample schools in three regions of Guatemala. The findings show schools vary considerably in the nature and quality of the opportunities to learn provided; vary in the level of reading fluency students obtain by Grade 3; and the amount of time teachers and students spend on task. While the variation in Guatemala is at the higher end of the spectrum compared to studies conducted in Nepal and Ethiopia, there is much room for improvement—particularly in reading and time loss
The amount of useful instruction in a typical lesson was very limited and instruction in reading was almost non-existent: less than 10 percent of the time remaining for instruction. Most of the reading that was observed was reading text for particular lessons. Students were not seen reading story books, participating in reading activities, or even reading silently—activities often associated with reading acquisition. Most of the observed interaction around text was related to reading simple texts off the blackboard or from textbooks as it related to other subject matter. There appeared to be no structured approach to the teaching of reading in the schools included in this study.
Given that Save the Children is investing resources to support schools, where and how can the organization better maximize the impact of that support in terms of both assuring a more consistent opportunity to learn and contributing to better acquisition of literacy. The following issues should be considered as ways to possibly obtain more impact.

124
Opp
ortu
nity
to L
earn
: A h
igh
impa
ct st
rate
gy fo
r im
prov
ing
educ
atio
nal o
utco
mes
in d
evel
opin
g co
untr
ies
Teacher and student absenteeism need to be more closely monitored and the factors that impact them addressedWhile teacher and student absenteeism was less of an issue in Guatemala than in other cases researched by EQUIP2, it is still an area where SC or other school support providers can do additional work. Systems for local accountability in other contexts have proven useful in combating teacher absenteeism. In several community school models such as Bangladesh’s BRAC, Guatemala’s PRONADE, and the Mali Community Schools use SMCs and parent-teacher associations (PTAs) to ensure that teachers and students are present in the schools. Guatemala also pilot tested the use of cell phones as a way of collecting and reporting education management information system (EMIS) absentee data to MINEDUC on an on-going basis.
In addition to monitoring, policy-makers should explore ways to support absent teachers. In the United States, there is a system to provide substitute teachers to schools when the main teacher is absent. In Guatemala, there are huge numbers of certified teachers without teaching posts. Is there a way to use and deploy these teachers in an effective way to ensure that when teachers are absent, classes can continue uninterrupted? While more costly, this solution might ensure that students spend more time in school learning than currently occurs in the sample schools.
Finally, many schools have parent and community committees (i.e., PTAs and SMCs). Policy-makers could explore ways to engage the community in improving the “reading culture” around schools. Perhaps communities could explore after school reading clubs, or reading camps that engage literate community members to support children learning to or improving reading skills.
These are a few of many possible options that would increase the opportunity to learn and help mitigate some of the effects of teacher absenteeism.
More of the school day needs to be effectively used and more time should be devoted to readingThe biggest loss of time is occurs when teachers and students are off task and when the school starts late and ends early. Teachers and principals indicated that school often begins at 8:00 a.m. instead of 7:30 a.m. because educators are waiting for students to arrive; they end early because teachers often need to leave for afternoon shifts in other schools; and recess extends beyond the allocated 15 minutes because of lag time in getting students back into the classroom. Principals, SMCs, and PTAs need to assist schools and teachers to begin and end school on time so students receive the benefit of more instructional time.
Investments in teacher training need to do more than assure official certificationTeachers need to learn specific teaching strategies that are focused on helping students learn to read (either as part of or in addition to their certification-based training). Most students in this study recognized letters fairly well, could complete the CAP pre-literacy tasks successfully, and read at an average of 50 wpm. However, many students were still not making the transition from initial foundational reading skills to actually reading with fluency. While there are teacher and student standards in place for the type of teaching that should happen in the classroom, it was not clear that an actual reading curriculum existed in Guatemala. Teachers appear to lack techniques such as those mentioned above that build site vocabulary or teach basic decoding. Ensuring teachers have the skills to carry out the following types of reading activities will improve students’ reading abilities:
1. Focus on oral language development. Literacy starts with oral language. Children in most countries are familiar with certain local songs. Teachers should use local songs and customs to teach reading and word association.

125
CASE ST
UD
Y: Using O
pportunity to Learn and Early Grade Reading Fluency to M
easure School Eff ectiveness in Guatem
ala
2. Use of high frequency sight words. Sight words are learned through repeated exposure. Teachers should be taught to use word games such as BINGO or flash cards to teach high frequency words. Teachers should be able to write a sentence on the chalkboard that has a high frequency word (e.g., “here”) and draw students’ attention to the word. Students can learn to be word trackers before they read a page to see if they recognize any “old friends” in sentences or paragraphs.
3. Picture walk. Most beginning texts carry some sort of illustration. Teachers often rush too quickly to have students focus on the printed words, but beginning readers first read the pictures, construct a text in their heads, then reading becomes a process of matching the texts they constructed with the text the writer constructed. Focus on ensuring that teachers can do “picture walks” by showing students the pages of the book they are about to read and talking with them about what is in the pictures. (e.g., “What do you see?” “Does that give you an idea about what the author might be saying?”) A picture walk builds motivation and engagement in reading as children become eager to see whether their ideas are the same as the author’s.
4. Repeated reading. Whether adult competent readers or children just starting out, it is an absolute certainty that all readers improve accuracy and rate with repeated reading of the same passage. Unfortunately in school, teachers seldom give children an opportunity to do repeated reading, and almost no repeat reading was observed in the classrooms in this study. Teachers should be taught to use techniques such as reading in pairs, reading in small groups, or even just having time in class to read silently to encourage a “culture of reading” in the classroom.
5. Use of patterned text. Another way to create instant readers is to use texts that have clear, strong patterns. Think about the song “I Know an Old Lady Who Swallowed a Fly.” She swallowed the fly to catch the spider, etc. By the time the student gets to the fourth verse they have memorized the pattern. They might not be reading letters and words, but this action will get students into the game. It is up to the teacher then to help the child match which word is “Lady.”
6. Use of dictated sentences. It is much easier for children to read what they have just said. These texts can be read by students and become the focus of instruction.
More reading material needs to be made availableTeachers often think of reading as reading books, when in fact most reading is not book reading. There appears to be an insufficiently literate environment to support regular reading. Teachers should take an inventory of the print in the school, classroom, or school community. Even in the poorest communities there are some amazing examples of literacy: package labels, T-shirts, bibles, and billboards. These are texts, and teachers can begin supporting children’s literacy by building on their ability to read them.
Schools need storybooks and other printed materials that offer students a variety of opportunities and purposes to read. Teachers also need to be trained to provide students with a structured environment for reading to occur. Activities such as reading corners, reading silently for some time period, and peer reading are activities that increase the amount of time students read in class and strengthen their reading skills.
Remediation and more individualized instruction should be introducedGiven that large numbers of students are not learning to read, schools need to put in place remediation strategies designed to address this problem. Within any classroom teachers might have students across the full range of reading abilities, and therefore should learn techniques to identify where students are at and then tailor instruction to different groups operating at different levels. Simple tools for classifying students along a logical hierarchy would prove useful – does not know letters, knows letters, able to read simple words, able to read sentences, able to read connected text.

126
Opp
ortu
nity
to L
earn
: A h
igh
impa
ct st
rate
gy fo
r im
prov
ing
educ
atio
nal o
utco
mes
in d
evel
opin
g co
untr
ies
MINEDUC should also invest in enriching the professional dialogue around teaching reading and writing. This enrichment means creating professional libraries in schools and teacher centers; ensuring teachers have access to journals, web resources, even government circulars on reading and literacy; and continue to build a constructive dialogue with the teacher unions around issues of professionalizing the teaching workforce. The teacher union can and must be a partner for promoting excellence.
Ensure there is a strong link between reading and writingEven kindergarten students learn to read and write concurrently. Reading and writing are mutually informing and reinforcing, so teachers need to focus on ways to ensure students have an opportunity to write stories and practice writing, and then reading what they have written.
When teachers do teach reading skills, they tend to do so in isolation. They generally teach discrete skills as though these were pieces of a giant puzzle and then expect kids to put the pieces together on their own. Often students do not understand how the pieces of the puzzle fit together. Teachers need to teach high-utility reading and writing strategies in the context of authentic reading and writing activities, such as writing a story about a sibling, creating a poem for a parent, reading about a hero, or trying to find out whether the lost kids will make it back home. Teaching reading and writing in authentic contexts provides an opportunity for children to see how the skills of reading and writing can help them read and write better, and it allows them to play with words.
In 2009, AED published Success in First Grade highlighting four principles of success: maximizing opportunities to learn, creating learning communities, providing redundant support, and integrating child-oriented systems. These principles are at the core of the recommendations above and provide a foundation to engage policy-makers in discussions on how to ensure that all kids learn to read.

127
CASE ST
UD
Y: Using O
pportunity to Learn and Early Grade Reading Fluency to M
easure School Eff ectiveness in Guatem
ala
ReferencesAbadzi, H. (2007). Absenteeism and Beyond: Instructional Time Loss and Consequences. Washington, D.C.: Independent Evaluation Group, World Bank.
Anderson, M. E. (2001). Guatemala: the Education Sector, Technical Paper No. 2. Washington, D.C.: World Bank and Tulane University.
Benavot, A. and M. Amadio. (2004). A Global Study of Intended Instructional Time and Official School Curricula, 1980-2000. Geneva, Switzerland: IBE.
Bloom, B.S. 1968. “Learning for Mastery.” UCLA Evaluation Comment, 1(2), 1–8.
CARE. (2009). “CARE’s work in Guatemala.” Available at: http://www.care.org/careswork/countryprofiles/59.asp
Carrol, J.B. (1963). “A Model of School Learning.” Teachers College Record, 64, 723–733.
CIA. (2009). “The World Factbook: Guatemala.” Available at: https://www.cia.gov/library/publications/the-world-factbook/geos/gt.html#Intro
Clay, M. (2000). Concepts About Print: What Have Children Learned about the Way We Print Language? Portsmouth, NH: Heinemann.
EdData II. (2009). EdData II Project. Available at: www.eddataglobal.org.
Edwards, J. (2002). Education and Poverty in Guatemala, Technical Paper No. 3. Washington, D.C.: World Bank and Tulane University.
Gettinger, M. (1984). “Individual Differences in Time Needed for Learning: A Review of the Literature.” Education Psychologist, 19(1), 15–19.
Gillies, J. and J. Jester Quijada. (2008). Opportunity to Learn: A high impact strategy for improving educational outcomes in developing countries. Washington, D.C.: United States Agency for International Development (USAID), Educational Quality Improvement Program 2 (EQUIP2), and FHI 360.
Save the Children. (2006). Metodología del Programa de Educación. Guatemala City: Save the Children, US.
Save the Children. (2009). “Guatemala.” Available at: http://www.savethechildren.org/countries/latin-america-caribbean/guatemala.html.
UNESCO. (2009). “Overcoming inequality: why governance matters.” EFA Global Monitoring Report. Paris, France: UNESCO.
UNESCO and Latin American Laboratory for Assessment of the Quality of Education (LLECE). (2008). “Los aprendizajes de los estudiantes de América Latina y el Caribe. Primer Reporte de Resultados del Segundo Estudio Regional Comparativo y Explicativo. Santiago, Chile.: UNESCO and LLECE.


129
CASE ST
UD
Y: CASE ST
UD
Y: Using O
pportunity to Learn and Early Grade Reading Fluency to M
easure School Eff ectiveness in Honduras
Using Opportunity to Learn and Early Grade Reading Fluency to Measure School Effectiveness in Honduras
Executive SummaryIn 2009, the Educational Quality Improvement Program 2 (EQUIP2), in partnership with CARE, conducted a study of school effectiveness in Honduras. Data were collected from 28 schools supported by CARE and 6 non-CARE schools in the municipality of Guajiquiro and the peri-urban areas of Tegucigalpa. The study aimed to determine whether schools provide adequate opportunities to learn (OTL) and whether teachers and students use those opportunities to ensure children learn to read fluently in the language of instruction (Spanish) by Grade 3. In particular, this study looked at whether schools are opening and functioning through the school year, how teachers and students use the time available during the day, whether materials are present and used by them, and whether class sizes are reasonable.
The data collected on opportunities to learn show that CARE schools were open on average 92 percent of the days they should be and teacher and student attendance rates were quite high: 94 percent and 98 percent, respectively. However, time loss caused by late start, early close and time-on-task was quite significant. Schools used only 82 percent of the available day for instruction because of late start, early end, and prolonged breaks in the day for recess, and students were on task only 56 percent of the time. While CARE and non-CARE schools varied for each of these factors, the greatest difference was in terms of time loss at the school level. CARE schools used 82 percent of the school day for instruction, while non-CARE school only used 76 percent of the day, losing more time to delayed starts and prolonged recess.
In terms of availability and use of materials, the majority of students in both CARE (67 percent) and non-CARE schools (63 percent) had language arts books. However, across the entire sample students were observed using textbooks less than 25 percent of the time. In both types of schools, students spent approximately 28 percent of their on-task time in Grade 3 Spanish language arts classrooms involved in some sort of reading activity.
When looking at reading competencies, the study found by the middle of Grade 3, CARE students were able to read at a satisfactory level. On average, students in the CARE sample could read at a speed of 73 words per minute (wpm). The non-CARE schools did not demonstrate the same level of reading fluency results. Compared to 1 percent of students in CARE schools, 40 percent of students in non-CARE schools could not read a single word, and the average reading speed for this group was 36 wpm. In terms of reading comprehension, while the majority of students in the sample could answer approximately three of the four comprehension questions correctly, only 23 percent of the students were able to answer all four questions.
While students in CARE schools demonstrated adequate reading competencies, researchers still found there was a large range in reading abilities from school to school and from student to student in the same class. Schools in the sample varied considerably in terms of the number of days they were open, how regularly teachers attended, the frequency and length of breaks provided throughout the school day, and the availability of teacher and student materials. Schools also varied in terms of the time students spent on task within the classroom and between multi- and single-grade classrooms, and the types of activities in which students were more often engaged.

130
Opp
ortu
nity
to L
earn
: A h
igh
impa
ct st
rate
gy fo
r im
prov
ing
educ
atio
nal o
utco
mes
in d
evel
opin
g co
untr
ies
This research shows that more of the school day needs to be effectively used. Furthermore, while students in CARE schools did demonstrate adequate reading fluency, students still demonstrated some weakness in basic comprehension skills. More time in both CARE and non-CARE schools should be devoted to reading with a particular emphasis on interpretation and discussion of text.
IntroductionCARE began its work in Honduras in 1954, when the organization provided emergency assistance to hurricane victims. It has since expanded its programmatic scope to include the provision and support of quality educational opportunities for children in disadvantaged areas.
In 2009, EQUIP2 teamed with CARE to research the effectiveness of the schools that receive support from the organization. Literacy is perhaps the most critical outcome of primary education. This study assesses whether students are learning to read by Grade 3. School effectiveness is measured and evaluated in terms of both specific student learning outcomes and the opportunity to learn provided by the school. To evaluate students’ opportunity to learn, data were gathered to determine whether schools consistently provide opportunities for students to learn and, in particular, to learn to read. CARE is in the process of evaluating the support services it provides to schools and will use the findings presented in this report to identify ways to improve its school support efforts in Honduras.
Although significant progress has been made toward expanding education opportunities, many countries are still struggling to find ways to secure and fund a quality education for all their children. In previous research, EQUIP2 considered whether complementary, community-based schools could serve as a viable alternative for the provision of universal primary education. Ten case studies of complementary programs allowed EQUIP2 to develop a methodology for assessing how effective and cost-effective these programs are in terms of providing access, ensuring completion, and promoting learning (DeStefano, Moore, Balwanz & Hartwell, 2007).
The EQUIP2 research on complementary models found some alternative programs are more effective and cost efficient than public schools in their countries in part because they more consistently ensure a basic opportunity to learn. The complementary program schools are located closer to where students live, the calendar and daily schedule is tailored to fit the community’s lifestyle, teachers are recruited locally, and the curriculum is scaled down to allow more focused time on core skills. These adjustments help ensure that teachers and students attend school more regularly and students’ learning is concentrated on mastery of essential, basic skills.
To build on these findings, EQUIP2 examined opportunity to learn as a framework for understanding how schools can improve teaching and learning. In Opportunity to Learn: A high impact strategy for improving educational outcomes in developing countries, EQUIP2 identified 12 factors that are necessary to establish a foundational opportunity to learn:
1. Percentage of days school is open; 2. Teacher attendance;3. Student attendance;4. Percentage of the school day available for instruction;5. Percentage of student time-on-task;6. Equivalent percentage of days available for instruction;7. Percentage of students with a textbook;8. Percentage of observed textbook use;9. Percentage of time spent reading;10. Grade 3 reading ability;11. Class size; and12. School support.

131
CASE ST
UD
Y: CASE ST
UD
Y: Using O
pportunity to Learn and Early Grade Reading Fluency to M
easure School Eff ectiveness in Honduras
These factors provide a practical framework for assessing whether a school is providing children the maximum opportunity to learn. However, to understand whether these factors contribute to students’ learning, it is necessary to develop tools to evaluate students’ educational achievement, especially in terms of their ability to read. One drawback of the EQUIP2 complementary education research was the lack of data in most countries on student learning outcomes. Proxies such as end-of-cycle exams or other standardized tests had to be used, which only include students who make it to the end of the cycle, and therefore do not reflect the full range of performance of students in the system (Kellaghan, 2004).
While Honduras is currently developing a national achievement exam to provide school-level outcome data, schools in this sample have not been included in the pilot of these tests. To obtain current and accurate achievement data on the students in our sample, EQUIP2 decided to draw on early grade reading assessment (EGRA) methodologies and tools. EGRA provides an easy way to design and implement a methodology for quickly assessing a variety of early literacy skills, and therefore to gauge school and/or system effectiveness at fostering acquisition of those skills. The EdData II project in particular has been instrumental in promoting and improving the use of EGRA as a measure of school effectiveness and has now supported its application in almost 20 countries. However, one of EGRA’s drawbacks is its floor effect: It fails to measure the skills of students who are below the ‘floor’ of being able to read letters, words, or connected text. Beginning with previous school effectiveness studies, EQUIP2 worked with Save the Children to refine the Concepts about Print (CAP) methodology developed by Marie Clay (2000) as an additional assessment tool to ensure the evaluation of pre-reading skills in students who are non-readers.
The combination of the opportunity to learn framework, EGRA, and CAP inspired the design of the current EQUIP2 research on effective schools. This research is based on the idea that school effectiveness, as measured by whether the school enables children to learn to read, is a function of how well the school assures a foundational opportunity to learn and whether it draws on teaching approaches that make the best possible use of the instructional time that is available. The research questions for the study are as follows:
• How well do schools provide opportunity to learn?• How does actual opportunity to learn compare to potential opportunity to learn?• How does opportunity to learn vary across schools?
Through the partnership with CARE, EQUIP2 was provided access to schools in the municipality of Guajiquiro in the department of La Paz and in the peri-urban areas of Tegucigalpa where CARE currently works. This paper presents the results of the collaboration between CARE and EQUIP2 in Honduras.
ContextHonduras was selected to participate in the Education for All (EFA) Fast Track Initiative in 2002. While the country has made progress toward meeting its EFA goals and achieving universal basic education, challenges in terms of governmental leadership, donor harmonization, and capacity development have hindered some of the country’s work (Opazo, 2008). As of 2007, the net enrollment rate for primary school was 94 percent, but only 38 percent for pre-primary and 64 percent for secondary. Survival rate to Grade 5 is only 78 percent, and in rural areas students only finish four years of schooling on average (UNESCO, 2009; UNICEF, 2009).
CARE officially established its first country office in Honduras in 1959 and has worked in areas including health and nutrition, small enterprise development, agro-forestry, and education. Through its education initiatives, CARE strives to secure quality education for children in urban, peri-urban, and rural areas and to support Honduras in the achievement of EFA targets. In Guajiquiro and
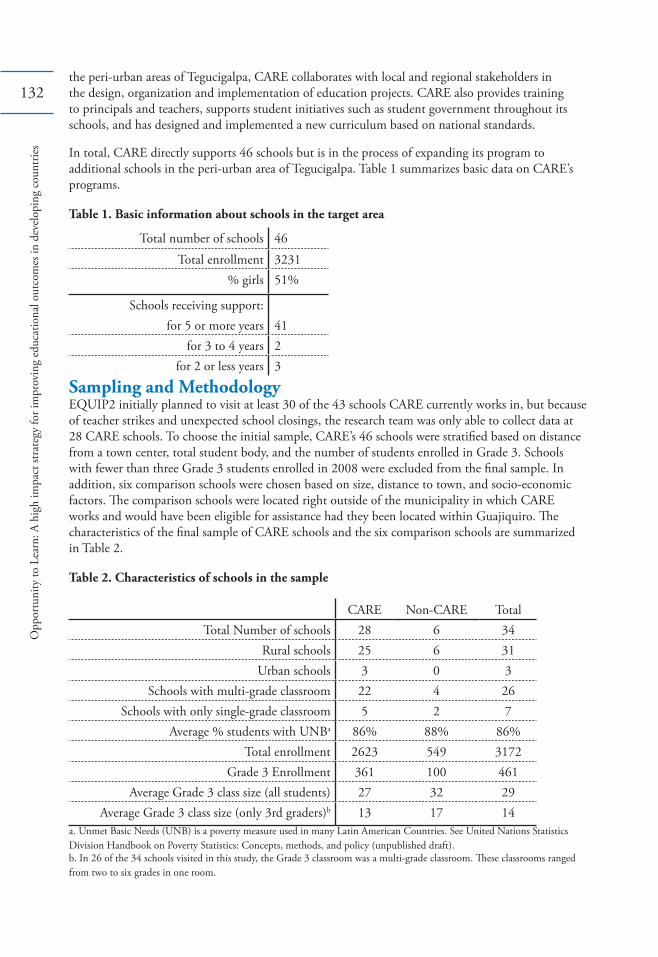
132
Opp
ortu
nity
to L
earn
: A h
igh
impa
ct st
rate
gy fo
r im
prov
ing
educ
atio
nal o
utco
mes
in d
evel
opin
g co
untr
ies
the peri-urban areas of Tegucigalpa, CARE collaborates with local and regional stakeholders in the design, organization and implementation of education projects. CARE also provides training to principals and teachers, supports student initiatives such as student government throughout its schools, and has designed and implemented a new curriculum based on national standards.
In total, CARE directly supports 46 schools but is in the process of expanding its program to additional schools in the peri-urban area of Tegucigalpa. Table 1 summarizes basic data on CARE’s programs.
Table 1. Basic information about schools in the target area
Total number of schools 46
Total enrollment 3231% girls 51%
Schools receiving support:for 5 or more years 41
for 3 to 4 years 2for 2 or less years 3
Sampling and MethodologyEQUIP2 initially planned to visit at least 30 of the 43 schools CARE currently works in, but because of teacher strikes and unexpected school closings, the research team was only able to collect data at 28 CARE schools. To choose the initial sample, CARE’s 46 schools were stratified based on distance from a town center, total student body, and the number of students enrolled in Grade 3. Schools with fewer than three Grade 3 students enrolled in 2008 were excluded from the final sample. In addition, six comparison schools were chosen based on size, distance to town, and socio-economic factors. The comparison schools were located right outside of the municipality in which CARE works and would have been eligible for assistance had they been located within Guajiquiro. The characteristics of the final sample of CARE schools and the six comparison schools are summarized in Table 2.
Table 2. Characteristics of schools in the sample
CARE Non-CARE TotalTotal Number of schools 28 6 34
Rural schools 25 6 31Urban schools 3 0 3
Schools with multi-grade classroom 22 4 26Schools with only single-grade classroom 5 2 7
Average % students with UNBa 86% 88% 86%Total enrollment 2623 549 3172
Grade 3 Enrollment 361 100 461Average Grade 3 class size (all students) 27 32 29
Average Grade 3 class size (only 3rd graders)b 13 17 14a. Unmet Basic Needs (UNB) is a poverty measure used in many Latin American Countries. See United Nations Statistics Division Handbook on Poverty Statistics: Concepts, methods, and policy (unpublished draft).b. In 26 of the 34 schools visited in this study, the Grade 3 classroom was a multi-grade classroom. These classrooms ranged from two to six grades in one room.

133
CASE ST
UD
Y: CASE ST
UD
Y: Using O
pportunity to Learn and Early Grade Reading Fluency to M
easure School Eff ectiveness in Honduras
The research team spent one full day at each of the schools working with the principal, teachers and students. The visits included: 1) a general observation of the school documenting the presence of the principal, teachers and students, the condition of the facilities, and the actual time students and teachers spent in class; 2) interviews with the principal to obtain school-level data such as student enrollment, teacher and student attendance, school schedule, and information on personnel, trainings, support visits, and community participation; 3) one–hour observation of classroom instruction and activities in Grade 1, 2, and 3 classrooms using the Stallings Classroom Observation Instrument; 4) interviews with each of the teachers observed; 5) interviews with Grade 3 students; and 6) administration of two reading assessments (EGRA and CAP) to Grade 3 students to measure print awareness and basic literacy skills.
Table 3. Characteristics of students in the sample
CARE Non-CARENumber of Grade 3 students tested 318 69
Boys 158 35Girls 157 34
Average age (years) 9 9% over age (older than 10 years) 9% 4%
% who attended kindergarten 86% 87%% who did not repeat Grade 3 96% 94%
% who did not repeat any grade 73% 78%% students whose parent reads to them 87% 83%% who live 10 min. or less from school 43% 30%
% who walk 10 to 30 min. to school 36% 21%% who walk more than 30 min. to school 21% 49%
Average family size 7 7% of students who earn money for work 14% 17%
% who have in their home:
- a radio 96% 99%- a toilet 51% 23%
- electricity 32% 19%- a television 35% 14%
- a refrigerator 17% 0.06%- running water 22% 30%
Given the small universe of Grade 3 students at each school, the research team made the effort to interview every third grader present on the day of the visit. In the few schools with more than 25 Grade 3 students present, a group of 20 were randomly selected to be interviewed and to participate in the reading assessments. The number of boys and girls in the sample was selected to match the gender ratio in the classroom. The students were first asked a number of questions pertaining to their home environment and attendance at school. The literacy tests included CAP questions to assess pre-reading skills and student familiarity with printed text and books and EGRA components to assess the number of letters recognized in isolation and the number of words read correctly in context per minute. The number of words read correctly per minute was used as the measure of reading fluency, a recognized and robust index of reading comprehension that reliably differentiates

134
Opp
ortu
nity
to L
earn
: A h
igh
impa
ct st
rate
gy fo
r im
prov
ing
educ
atio
nal o
utco
mes
in d
evel
opin
g co
untr
ies
between strong and poor readers as demonstrated in Matthew Jukes, Shaher Banu Vagh, and Young-Suk Kim’s 2006 study, Development of Assessments of Reading Ability and Classroom Behavior.
Table 3 provides a summary of student characteristics in the CARE and non-CARE schools. The sample was equally divided between boys and girls who had an average age of nine. While only a small percentage of CARE and non-CARE students had already been in Grade 3 (4 and 6 percent, respectively), more than 20 percent of the students in each group had repeated a grade at least once in their schooling career. The majority of CARE students lived within a 30 minute walk to school. Students also had an average family size of seven and 14 percent worked outside their homes. While almost all children reported having radios in their homes, only 32 percent had electricity and 22 percent had running water. On average, almost 50 percent of students in comparison schools lived farther than 30 minutes from school. A smaller percentage of students from non-CARE schools had electricity (19 percent) or a toilet (23 percent) but more had running water (30 percent).
Limitations of the StudyWhile the data presented in this study are robust and representative of education in these schools, there are important limitations to the methodology and data that must be recognized. Although the researchers were able to visit 65 percent of the schools which CARE supports plus six additional comparison schools, this is not a representative sample of schools throughout Honduras. We are therefore unable to use the data to make larger assumptions about schools across Honduras. Furthermore, the school sample size was limited because of the day-long school visits. The small sample of schools made it difficult to build a reliable model that could determine statistically significant relationships between variables at the school level. This study presents descriptive statistics and analyzes simple relationships among the different variables measured using two-tailed t-tests with and α≤0.05. Furthermore, students’ performance on the reading assessments might have been negatively affected by their unfamiliarity with the EGRA methodology.
This study focuses on results from the CARE schools but data from the comparison schools will also be included to help provide insight into the state of education at non-CARE rural schools in the department of La Paz. While the comparison group can help demonstrate what happens in public rural schools around the area in which CARE works, this is not to be seen as a representative sample of non-CARE schools throughout Honduras and does not serve as a control group. Although the conclusions presented here are mainly limited to CARE schools, findings will still shed light on weaknesses within the education sector as a whole and highlight approaches Honduras could take to strengthen its education system.
FindingsTo look at school-level factors EQUIP2’s opportunity to learn framework was used. The researchers used the 12 OTL factors both individually and collectively to determine the effectiveness of each school in the study at maximizing opportunities to learn.
OTL Factor 1: Percentage of days school was open Before schools can consider improving the actual learning process, it is necessary to ensure adequate learning time is provided. In Honduras, the official school year lasts 200 days, beginning in February and ending in November. Using data gathered from school records and interviews with school principals, it was found that students in the sample of CARE schools lost 2.3 days of classes on average because of a late start of the academic year. Few of the schools in the CARE sample started on time and some schools began as late as nine days after the official start date. In addition to the late start of the academic year, schools had been closed on average five additional days by the time of data collection, not counting official holidays. This leads to an annual average of 14 school days lost per year, with some schools losing as few as 4 days and others losing as many as 29 days per year.

135
CASE ST
UD
Y: CASE ST
UD
Y: Using O
pportunity to Learn and Early Grade Reading Fluency to M
easure School Eff ectiveness in Honduras
Schools with multi-grade classrooms lost on average 16 days, whereas schools with single-grade classrooms lost on average only 9 days (see Figure 1). This difference might be attributed to the fact that in Guajiquiro, where most of the schools with multi-grade classrooms are located, schools often closed one day a month around pay day so that teachers could go to the bank and attend to personal errands.
Figure 1. Days lost per year because of unofficial school closings, by school
12
28
19
29
23
14
20 20
17
19
16
21
15
26
17
13 13
22
30
23
15
20
25
30
year
due
to s
choo
l clo
sing
s
4
0
4
65
4
0 0 0
5
0
5
10
Days
lost
per
y
Non-CARECARE, Single-grade CARE, Multi-grade
Non-CARE schools lost, on average, fewer instructional days than CARE schools because of school closings. Non-CARE schools started the academic year later than CARE schools (an average of 5 days versus 2.3 days, respectively), but lost fewer instructional days because of unofficial school closings during the academic year (10 days per academic year).
OTL Factor 2: Teacher attendanceTeacher absenteeism rates were calculated based on data provided by teachers in interviews and triangulated with school documents and student attendance books. At the time of the interview, CARE teachers had been absent 2.6 days on average for official reasons (such as attendance to teacher training activities, or meetings at the district offices), and 1.16 days for personal reasons. Teachers in non-CARE schools had been absent five days on average for official reasons, and 2.3 days for personal reasons. Based on this information, the researchers calculated an estimate of teacher absences throughout the school year. According to this estimate, teachers in the sample of CARE schools were absent on average 10 days per school year, with some teachers missing no class and others absent as many as 27 days. Teachers in schools with multi-grade classrooms tended to be absent less frequently than teachers in schools with single-grade classrooms, an average of 10 days an academic year versus 12 days, respectively. Teachers in non-CARE schools were absent 17 days per academic year, with individual absenteeism rates ranging from five days per year to as many as 42 days per year.
OTL Factor 3: Student attendanceStudent absenteeism rates were calculated based on information provided by teachers during interviews, triangulated with information from student attendance records. As with teacher

136
Opp
ortu
nity
to L
earn
: A h
igh
impa
ct st
rate
gy fo
r im
prov
ing
educ
atio
nal o
utco
mes
in d
evel
opin
g co
untr
ies
absenteeism rates, the researchers estimated yearly student absenteeism rates. On average, students in CARE schools in Honduras were absent from school 4.5 days per year, with a range of zero to 30 days. Students in non-CARE schools missed 8 days per year, with a variation ranging from 3 to 22 days per year. This low absenteeism rate was supported by teachers in many schools who said that students tended not to miss class. However, teachers also reported that absenteeism rates often increased during the rainy season in June, which was after the data collection team had completed the school visits.
Distance between the school and home of students does not appear to affect student absenteeism. In the sample of CARE schools, students lived on average 25 minutes away from school, with a range of 8 to 46 minutes. Schools with single- and multi-grade classrooms were located at a similar distance from the homes of their students. Regarding student absenteeism, the researchers found no correlation between distance traveled to school and students’ self-reported absenteeism from school the week before the interview took place. Furthermore, no significant correlation was found between reading fluency and distance to school, or between reading fluency and student absenteeism.
OTL Factor 4: Percentage of the school day available for instructionIn addition to school closings and teacher and student absenteeism, instructional time was lost as a result of late start and early school closing, transition time before and after the official recess or lunch break, and prolonged recess and lunch. Actual instructional time was calculated based on the school observation records generated by the research team during the field visits. The researchers calculated the actual instructional time as the difference between the official duration of the school day in Honduras (five hours) and the total time lost when students were not engaged in instructional activities inside their classrooms. Counting official recess as time lost to instruction, the average CARE school lost 56 minutes per day, with total time loss ranging from zero to 125 minutes. Non-CARE schools lost 76 minutes on average, with a total time loss ranging from 60 to 95 minutes. Schools with multi-grade classrooms lost, on average, less time than schools with single-grade classrooms (53 minutes versus 70 minutes).
OTL Factor 5: Percentage of student time-on-taskUsing the Stallings Observation Instrument, researchers observed single- and multi-grade classrooms for periods of 60 minutes. The activities of the teacher and the students in the classroom were coded and broadly divided into those that are “on task” and “off task.” On-task activities include reading aloud, demonstration/lecture, discussion/debate, practice/drill, seatwork, verbal instructions, silent reading, and interpreting text. Off-task activities include leaving the room, socializing, dealing with discipline/classroom management, or being unengaged.
Students in non-CARE schools were on task more often than students attending CARE schools. On average, students in CARE schools were observed to be involved in academic activities 55 percent of the time as compared to 59 percent for students in non-CARE schools. When students were on task, both in CARE and comparison schools, they were mostly engaged in seatwork activities (25.8 percent of students in CARE schools and 30.6 percent of students in non-CARE schools). Apart from seatwork, students in CARE schools were most often observed copying or engaged in discussion while in comparison schools, students tended to engage more in demonstration activities or reading texts. Table 4 shows the average percentage of students engaged in different types of activities across all classroom observations.

137
CASE ST
UD
Y: CASE ST
UD
Y: Using O
pportunity to Learn and Early Grade Reading Fluency to M
easure School Eff ectiveness in Honduras
Table 4. Average percentage of students by type of activity in classroom observations
Type of activity CARE Non-CAREReading aloud 2% 2%
Demonstration/lecture 5% 4%Discussion 6% 3%
Practice/drill 4% 2%Copying 6% 7%
Reading text 2% 4%Interpreting and discussing text 1% 0.3%
Seatwork 26% 31%Verbal instructions 5% 3%
Time-off-task 45% 41%
Table 5 disaggregates student engagement in CARE schools by type of classroom. There was only a 2 percentage point difference in time spent off task between the two types of classrooms. Not surprisingly, students in multi-grade classrooms spent more time doing seatwork and were less often engaged in drills or discussion exercises. However, while independent reading was rarely observed in single-grade classrooms, students in multi-grade classrooms were observed reading 2.5 percent of the time.
Table 5. Average percentage of students by type of activity in classroom observations, CARE single- and multi-grade classrooms
CARE Single-grade
CARE Multi-grade
Reading aloud 1% 2%Demonstration/lecture 6% 5%
Discussion 9% 4%Practice/drill 8% 2%
Copying 8% 5%Reading text 0% 3%
Interpreting and discussing text 0% 1%Seatwork 17% 30%
Verbal instructions 6% 4%Time off task 44% 46%
In terms of teachers’ activities, CARE teachers were observed to be involved in academic activities 72 percent of time with a range of 0 to 100 percent. In comparison schools, teachers were observed to be involved in academic activities only 63 percent of time. When teachers in either type of school were off task, they were mostly engaged in classroom management, while other activities such as social interaction, being outside the classroom, or disciplining students were less prevalent.
Not surprisingly, when teachers were off task, students were also more likely to be off task. When teachers were observed as off task at CARE schools, on average 64 percent of the students would be off task as well. When the teacher was on task this percentage dropped to 38 percent. In comparison

138
Opp
ortu
nity
to L
earn
: A h
igh
impa
ct st
rate
gy fo
r im
prov
ing
educ
atio
nal o
utco
mes
in d
evel
opin
g co
untr
ies
schools, 53 percent of students tended to be off task when the teacher was off task, compared to 35 percent when the teacher was on task. In general, when teachers were on task, students tended to engage more in learning activities although there are different patterns in activities. When the teacher was on task, students in CARE schools tended to engage in activities such as interpreting and discussing text, practice, and discussion more often than students in non-CARE schools. Students in comparison schools tended to engage more often in seatwork, reading text, and reading aloud when the teacher was on task. When the teacher is off task, students in both CARE and non-CARE schools tended to do more copying. Seatwork is equally present when the teacher is on or off task. Figure 2 depicts the main types of student activities when the teacher is on task and off task.
Figure 2. Student activities when the teacher was on and off task, by type of school
Verbal Instruction
Reading Text
Interpret and Discuss Text
S t k
Copying
Practice
Seatwork CARE, teacher off taskCARE, teacher on taskNon-CARE, teacher off taskNon-CARE, teacher on task
Demonstration
Discussion
,
Reading Aloud
0% 10% 20% 30% 40% 50% 60% 70%
Student off task
While teachers in multi-grade classrooms tended to be on task more often than teachers in single-grade classrooms (74 percent versus 69 percent), the percentage of students on task in multi-grade classrooms was not significantly different from the percentage of students on task in single-grade classrooms. However, while students in both types of classrooms were on task approximately the same amount of time, their time was distributed differently in terms of activities. Figures 3 and 4 depict the distribution of students’ time by activity within single- and multi-grade classrooms depending on whether the teacher was on or off task.
When the teacher was on task, students in multi-grade classrooms were off task more often than students in single-grade classrooms. When engaged in learning activities, students in multi-grade classrooms tended to spend more time on seatwork, interpreting and discussing text, and reading text. In turn, they did less practice, copying, discussion, and demonstration than students in single-grade classrooms.

139
CASE ST
UD
Y: CASE ST
UD
Y: Using O
pportunity to Learn and Early Grade Reading Fluency to M
easure School Eff ectiveness in Honduras
Figure 3. Student activities when teacher was on task, by type of classroom
Student Off Task
Interpret and Discuss Text
Verbal Instruction
Copying
Reading Text
P ti
Seatwork
Discussion
Practice
Reading Aloud
Demonstration
0% 10% 20% 30% 40% 50%
Single-grade Multi-grade
Figure 4. Student activities when teacher was off task, by type of classroom
Student Off Task
Interpret and Discuss Text
Verbal Instruction
Copying
Reading Text
P ti
Seatwork
Discussion
Practice
Reading Aloud
Demonstration
0% 10% 20% 30% 40% 50% 60% 70%
Single-grade Multi-grade
When the teacher was off task, students in multi-grade classrooms were on task more often than students in single-grade classrooms. While on task, students in multi-grade classrooms engaged in more seatwork, reading text, discussion, and reading aloud activities than students in single-grade classrooms.
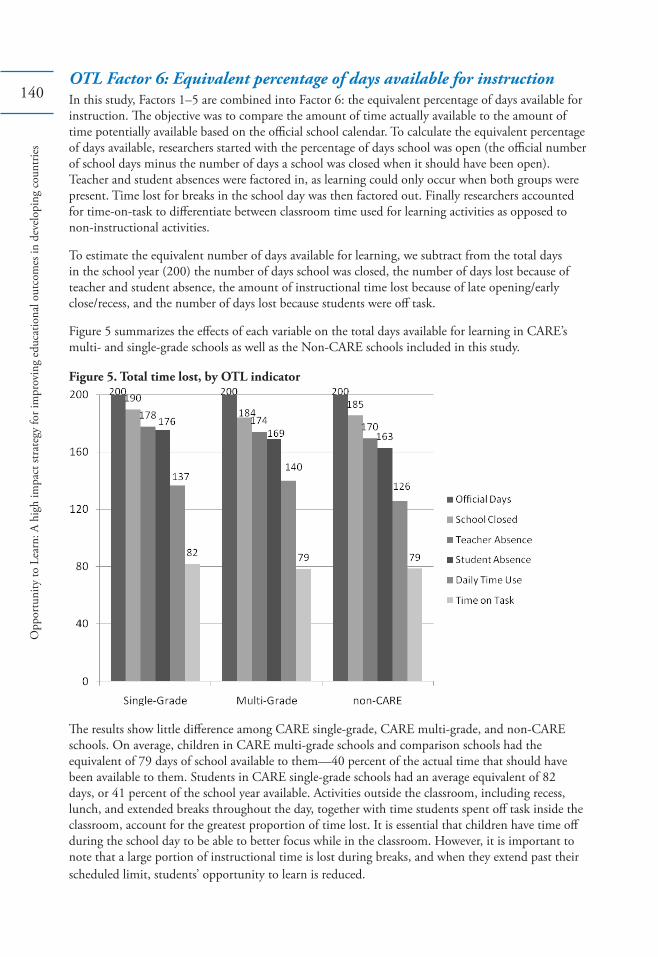
140
Opp
ortu
nity
to L
earn
: A h
igh
impa
ct st
rate
gy fo
r im
prov
ing
educ
atio
nal o
utco
mes
in d
evel
opin
g co
untr
ies
OTL Factor 6: Equivalent percentage of days available for instruction In this study, Factors 1–5 are combined into Factor 6: the equivalent percentage of days available for instruction. The objective was to compare the amount of time actually available to the amount of time potentially available based on the official school calendar. To calculate the equivalent percentage of days available, researchers started with the percentage of days school was open (the official number of school days minus the number of days a school was closed when it should have been open). Teacher and student absences were factored in, as learning could only occur when both groups were present. Time lost for breaks in the school day was then factored out. Finally researchers accounted for time-on-task to differentiate between classroom time used for learning activities as opposed to non-instructional activities.
To estimate the equivalent number of days available for learning, we subtract from the total days in the school year (200) the number of days school was closed, the number of days lost because of teacher and student absence, the amount of instructional time lost because of late opening/early close/recess, and the number of days lost because students were off task.
Figure 5 summarizes the effects of each variable on the total days available for learning in CARE’s multi- and single-grade schools as well as the Non-CARE schools included in this study.
Figure 5. Total time lost, by OTL indicator
The results show little difference among CARE single-grade, CARE multi-grade, and non-CARE schools. On average, children in CARE multi-grade schools and comparison schools had the equivalent of 79 days of school available to them—40 percent of the actual time that should have been available to them. Students in CARE single-grade schools had an average equivalent of 82 days, or 41 percent of the school year available. Activities outside the classroom, including recess, lunch, and extended breaks throughout the day, together with time students spent off task inside the classroom, account for the greatest proportion of time lost. It is essential that children have time off during the school day to be able to better focus while in the classroom. However, it is important to note that a large portion of instructional time is lost during breaks, and when they extend past their scheduled limit, students’ opportunity to learn is reduced.

141
CASE ST
UD
Y: CASE ST
UD
Y: Using O
pportunity to Learn and Early Grade Reading Fluency to M
easure School Eff ectiveness in Honduras
OTL Factor 7: Percentage of students with a textbook Research on school effectiveness in developing countries suggests that availability of materials is a crucial factor in student achievement (Zhang, et al., 2008). On average, the majority of students in both CARE (67 percent) and non-CARE schools (63 percent) had language arts books. However, while 54 percent of CARE students were observed with a Spanish language activity book, only 22 percent of students in comparison schools had such books. While there was still a wide variation in the availability of language arts books (see Figure 6), in most schools language arts books were available in quantities that would enable teachers to use them to support instructional activities. However, language arts textbooks and workbooks were observed to be in very poor condition due to the fact that new books had not been supplied to students recently. Students are supposed to be provided their own individual books each year but some schools were using books from three years past.
Figure 6. Percentage of students with language arts book, by school
90
100
70
80
ts b
ooks
60
70
lang
uage
art
40
50
stud
ent w
ith
20
30
erce
ntag
e of
10
20Pe
0
Non-CARECARE, Single-grade CARE, Multi-grade
Teacher materials, such as teacher guides, were scarcer than student textbooks. Spanish language arts teacher guides were found in 32 percent of CARE classrooms observed, mathematics teacher guides in 45 percent, science teacher guides in 32 percent, and social studies teacher guides in 29 percent. In general, teaching materials were less available in schools with multi-grade classrooms than in schools with single-grade classrooms. With regard to language arts in particular, while teacher guides were found in 58 percent of single-grade classrooms, in multi-grade classrooms teacher guides were found in only 25 percent of observations (see Table 6).
Teacher materials were scarcer in non-CARE schools than in CARE schools, with the exception of teacher guides for Spanish language arts. In comparison schools, Spanish language arts teacher guides were found in 42 percent of classrooms observed, while mathematics, science, and social studies teacher guides were found in only 25 percent of observed classrooms.

142
Opp
ortu
nity
to L
earn
: A h
igh
impa
ct st
rate
gy fo
r im
prov
ing
educ
atio
nal o
utco
mes
in d
evel
opin
g co
untr
ies
Table 6. Availability of teacher guides, by subject and type of classroom observed
CARE Single-grade classrooms
CARE Multi-grade classrooms
Non-CARE classrooms
Language Arts 58% 25% 41%Mathematics 54% 40% 25%
Science 45% 28% 25%Social studies 47% 24% 25%
OTL Factor 8: Percentage of observed textbook useIn all but two schools, textbooks were available in large enough quantities to enhance instruction. However, across the entire sample, students were observed using textbooks less than 25 percent of the time. Students in CARE single-grade classrooms had the lowest overall percentage of textbook use (4 percent), while use in CARE multi-grade and non- CARE schools was similar (23 and 22 percent respectively). For teachers in multi-grade classrooms, textbooks are an important resource to help ensure that students are engaged in a learning activity while she/he is occupied with another grade. It is therefore important that teachers know how to make the best use of these materials to ensure students are maximizing their independent learning time. The limited use of textbooks in single-grade classrooms might be attributed to teachers’ ability to give the same lecture to the entire class.
OTL Factor 9: Percentage of time spent readingTo analyze opportunities schools are providing for students to learn to read by the third grade, the researchers looked at both the teachers’ approach and the time dedicated to teaching literacy skills in their classrooms. Data on students’ time engaged in reading activities were gathered during observations of Grade 3 Spanish Language Arts classrooms (or multi-grade classrooms that contained Grade 3 students). Reading activities were categorized as reading aloud, reading texts, and interpreting and discussing texts.
Literacy instruction practices in CARE and comparison schools were found to be roughly similar. In both types of schools, at least one student was involved in some sort of reading activity 28 percent of their total time-on-task. In CARE schools, there was a significant difference between single-grade and multi-grade classrooms in terms of the amount of total time students spent reading. While in multi-grade classrooms students were observed involved in a reading activity about 33 percent of their total time-on-task, students in single-grade classrooms spent less than 1 percent of their time doing so. In non-CARE schools, students were observed reading 18 percent of the time.
While the government of Honduras has implemented the communicative approach as the official method for teaching reading, this study found that teachers varied considerably in terms of what method they chose to use in their own classrooms. When asked how they teach reading and literacy skills, the majority of teachers in the entire sample of schools said they ask their students to read individually or in groups (47 percent) while 28 percent of teachers were unable to articulate the method they use (categorized as “unclear”). Other commonly used methods included storytelling (“metodo de cuentos”), in which the teacher reads a text out loud to students while they follow along and are then asked questions, and workshops where an entire group of activities are planned around one text to teach vocabulary, concepts, and the actual reading itself.
Teachers in CARE schools preferred methods such as phonics, the communicative approach, workshops, syllabic approach, and reading in general. CARE is currently piloting a workshop approach in some of their schools that encourages utilizing a number of different strategies to

143
CASE ST
UD
Y: CASE ST
UD
Y: Using O
pportunity to Learn and Early Grade Reading Fluency to M
easure School Eff ectiveness in Honduras
teaching reading. The implementation of this pilot might have had an impact on the types of teaching strategies many teachers reported using. In turn, methods such as storytelling, generative words, inductive-deductive, and a combination of syllabic and generative words were more prevalent in non-CARE schools. The full range of teaching methods employed by teachers is shown in Figure 7.
Figure 7. Methods of teaching reading, by percentage of teacher use and school type
Phonics
Inductive-deductive
Unclear
Storytelling
Communicative approach
S ll bi th d d ti d
Workshop
Syllabic method
Syllabic method and generative words
Reading
Generative words
0 5 10 15 20 25 30 35 40 45
Multi-grade Single-grade
CARE single- and multi-grade teachers tended to use different methods in their classrooms to teach reading. Forty-one percent of teachers in multi-grade classrooms said the method they used most often in class was to give children time to read. In single-grade classrooms, teachers employed a wider variety of methods. The most frequent methods were reading (24 percent), workshop (14 percent), and storytelling (19 percent), as shown in Figure 8.
Figure 8. Methods of teaching reading, by percentage of teacher use and classroom type
Phonics
Inductive-deductive
Unclear
Storytelling
Communicative approach
S ll bi th d d ti d
Workshop
Syllabic method
Syllabic method and generative words
Reading
Generative words
0 5 10 15 20 25 30 35
CARE Non-CARE

144
Opp
ortu
nity
to L
earn
: A h
igh
impa
ct st
rate
gy fo
r im
prov
ing
educ
atio
nal o
utco
mes
in d
evel
opin
g co
untr
ies
Beyond the specific teaching methods employed to teach reading and literacy skills, there were additional differences in pedagogy between single-grade and multi-grade classrooms. Teachers in multi-grade classrooms were more likely to ask students to work in a collaborative manner using active pedagogy strategies (75 percent of teachers in single-grade classrooms versus 95 percent of teachers in multi-grade classrooms), and to pose open-ended questions that promote previous knowledge utilization on the part of the students (83 percent versus 75 percent, respectively). Teachers in single-grade classrooms, in turn, were more likely to provide students with opportunities for meta-cognitive reasoning (67 percent of teacher in single-grade classrooms versus 43 percent of teachers in multi-grade classrooms), to provide feedback on student work (96 percent versus 74 percent of teachers, respectively), to promote higher order thinking (46 percent versus 15 percent, respectively), and to promote problem-solving activities (17 percent versus 1 percent, respectively).
OTL Factor 10: Grade 3 reading abilityAs explained previously, students were given a series of CAP and EGRA tests to evaluate their reading skills: 1) 10 CAP questions; 2) a letter recognition test; 3) a timed reading passage; and 4) four comprehension questions. The CAP and letter recognition tests assess students pre-reading skills and are especially important measures for students who are still unable to read. Overall, students in CARE schools have mastered reading skills at a higher level than students in non-CARE schools. In the CAP portion of the test, students attending CARE schools could answer an average of 8.5 (out of a possible 10) questions correctly, with 77 percent of students answering between 9 and 10 of the questions correctly. The average CAP score for students in non-CARE schools was 8, only slightly lower. In the letter recognition test, students in CARE schools had a clear advantage over students in non-CARE schools. While the former could identify an average of 26 letters, the latter could only identify 18 (p<0.001), a fact that certainly might hinder a student’s ability to decode written text. These results show that on average, students in the CARE sample demonstrated mastery of pre-reading skills where students in the comparison schools were still building these skills.
In terms of reading fluency and comprehension, CARE students achieved satisfactory performance. On average, students in the CARE sample could read at a speed of 73 wpm. For Spanish language, the literature suggests that by Grade 3, children should be able to read at least at a speed of 60 wpm to achieve comprehension (Abadzi, 2007). The non-CARE schools did not demonstrate the same level of reading fluency results. More students in non-CARE schools than in CARE schools could not read a single word, (40 percent of the sample versus 1 percent, respectively), and the average reading speed for this group was 36 wpm. Moreover, the percentage of students who could read at a pace of 60 words or more per minute in non-CARE schools (26 percent) was much lower compared to CARE schools (68 percent). Figure 9 depicts the distribution of oral reading fluency scores for CARE vs. non-CARE students.
There were no significant differences between CARE and non-CARE schools in terms of their students’ decoding ability or the number of correct reading comprehension questions that students could answer correctly. In other words, the main differences between CARE and non-CARE schools seem to be in the number of students who can read at a minimum level. Once they achieved that threshold, there were no significant differences in CARE and non-CARE students’ reading skills.
Pre-reading test results for students unable to reach the threshold of 60 wpm were also examined. Students reading between 40 and 59 wpm on average identified 26 words correctly and answered 9 of 10 CAP questions correctly. Students reading 20 to 39 wpm identified 25 letters and answered an average of 8 CAP questions correctly. Those students reading less than 20 wpm were still able to answer 7 CAP questions and identify 23 letters. These results demonstrate that even though some students read at an extremely slow pace, they had at least some foundational knowledge of written

145
CASE ST
UD
Y: CASE ST
UD
Y: Using O
pportunity to Learn and Early Grade Reading Fluency to M
easure School Eff ectiveness in Honduras
materials and were acquainted with the alphabet, both of which are necessary tools for building reading fluency.
Figure 9. Percentage of Grade 3 students, by number of words per minute read
91–100 wpm
> 100 wpm
71–80 wpm
81–90 wpm
91 100 wpm
51–60 wpm
61–70 wpm
p
31–40 wpm
41–50 wpm
p
11–20 wpm
21–30 wpm
p
0 wpm
1–10 wpm
0% 5% 10% 15% 20% 25% 30% 35% 40% 45%
Non-CARE CARE Figure 10. Relationship between reading speed and number of correct reading comprehension questions
3> 90 wpm
2.980–90 wmp
2 7
2.5
60 70
70–80 wpm
2.5
2.7
50–60 wpm
60–70 wpm
2.440–50 wpm
0 0.5 1 1.5 2 2.5 3 3.5 4
Number of correct reading comprehension questions
The EGRA assessment also takes into account reading accuracy. Students who were able to read at least 40 wpm were asked to finish the entire paragraph in order to measure their ability to decode. These students read 97 percent of the words in the paragraph correctly, which suggests they had developed decoding skills. While the assessment of decoding skills serves as a measurement of reading fluency, it does not fully evaluate students’ ability to read for understanding. To evaluate students’ comprehension level, students who read at least 40 wpm were asked four reading comprehension questions. On average, students could answer correctly 2.8 questions out of the 4 questions. There was a medium positive correlation between average reading speed and number of reading comprehension questions answered correctly (r=0.26, p<0.001), which indicated students

146
Opp
ortu
nity
to L
earn
: A h
igh
impa
ct st
rate
gy fo
r im
prov
ing
educ
atio
nal o
utco
mes
in d
evel
opin
g co
untr
ies
who could read at a faster speed could answer a greater number of reading comprehension questions correctly (see Figure 10). While the majority of students in the sample could answer approximately three comprehension questions correctly, only 23 percent of the students were able to answer all four questions. This could suggest that while the majority of students in the sample have mastered decoding, many students are still working on building their comprehension skills.
On average, for students in each words per minute category, those in non-CARE schools could correctly answer a slightly greater number of comprehension questions than students in CARE schools. However, in non-CARE schools only 31 out of the total sample of 69 were able to answer any questions as compared to 284 out of 318 in CARE schools. As Table 7 shows, a smaller percentage of students of the entire sample in non-CARE schools were actually able to read at rates above 40 wpm. As discussed in the previous section, about 70 percent of the students in the sample of CARE schools in Honduras could read at an average speed of more than 60 wpm, a key threshold to achieving comprehension. However, Figure 9 demonstrates that variation still existed in reading fluency across students in the sample. The researchers considered individual-, classroom-, and school-level factors in order to explain some of the differences in reading fluency.
Table 7: Relationship between reading speed and number of correct reading comprehension questions, by CARE and non-CARE schools
Correct Answers –
CARE schools% of total
sample
Correct Answers – non-CARE schools
% of total sample
> 90 wpm 3 30% 4 10%80 – 90 wpm 3 11% 3 3%70 – 80 wpm 3 12% 2 7%60 – 70 wpm 3 14% 3 6%50 – 60 wpm 2 14% 3 9%40 – 50 wpm 2 9% 3 10%
Individual-level factorsResearchers collected individual student level data to analyze the relationship between variations in reading fluency and individual characteristics. One of the factors most often related to differences in student outcomes is poverty level. In this study, researchers measured poverty level using an index of unmet basic needs (UBN); an index that is commonly used in several countries in Latin America and the Caribbean (UNESCO, UN Statistics Division). Students in the sample varied little in terms of UBN, with 86 percent of the CARE students interviewed having at least one basic need unmet. This indicates that most students in this sample were coming from highly disadvantaged backgrounds. However, some differences still existed in student achievement according to their poverty level. Students without UBN could read, on average, eight more words per minute than students with UBN (79 wpm versus 71 wpm respectively), although this difference was only marginally statistically significant (p=0.07).
Another factor that researchers commonly analyze when explaining variation in student outcomes is previous educational history (Barnett, Young & Schweinhart, 1998; Camilli, Vargas, Ryan & Barnett, 2010). During the school visits, researchers gathered student-level data regarding repetition and access to preschool education. This data enabled the team to analyze the relationship between reading fluency and the students’ educational experience. In the sample of CARE schools, students who had access to preschool education could read on average 19 more words per minute than

147
CASE ST
UD
Y: CASE ST
UD
Y: Using O
pportunity to Learn and Early Grade Reading Fluency to M
easure School Eff ectiveness in Honduras
students who did not attend preschool (p<0.001). On average, students who had attended preschool read 75 wpm, whereas students who had not attended preschool could read, on average, at a speed of only 56 wpm.
Researchers found that grade repetition had a negative effect on reading fluency. Students who had repeated one grade of primary school (including students who had repeated any grade at least once between Grades 1 and 3) read, on average, 12 wpm less than students who had never repeated a grade (p<0.001).
Family background factors, such as the availability of a literary environment or family support outside the school usually serve as strong predictors for difference in reading outcomes (Britto & Brooks-Gunn, 2007; Jordan, Snow & Porche, 2000; Bennett, Weigel & Martin, 2002). Most students in the sample of CARE schools reported that their parents read at home (78 percent for mothers and 80 percent for fathers). In addition, 87 percent of students in the sample reported that either their mother or their father reads to them. These students could read at an average speed of 74 wpm, whereas students who said their parents do not read to them read, on average, just 62 wpm, a difference of 12 wpm (p=0.004).
Researchers found that other individual-level factors including age, gender, and family size had no significant effect on student reading fluency.
Classroom-level factors In many of the CARE schools, teachers taught in multi-grade classrooms. Multi-grade schools differed in terms of how many classrooms and grades were combined. Some schools had only one teacher for six grades; others had between two and five teachers to cover all the classrooms. Each school also combined classrooms differently. Classes consisted of consecutive grades, early and late grades (Grade 1 and Grade 6), or groups that were based on enrollment size. In all multi-grade classrooms visited, students sat together according to grade level. Because the use of instructional time and approach to pedagogy might vary between multi-grade and single-grade classrooms, it is relevant to analyze the variation in student reading ability according to the type of classroom they attend.
Regarding reading fluency, students in CARE multi-grade classrooms performed better than students in CARE single-grade classrooms. Students in multi-grade classrooms read an average of 6 wpm more than students in single-grade classrooms (p=0.06). However, there was no significant difference between the two groups in terms of reading accuracy. Students in both single- and multi-grade classrooms could read, on average, 97 percent of the words in the paragraph correctly. Regarding reading comprehension, students in single-grade classrooms could answer 2.9 reading comprehension questions correctly; students in multi-grade classrooms could answer 2.7 reading comprehension questions (p=0.05). Students in multi-grade classrooms read at a faster pace than students in single-grade classrooms, although this does not mean that they were better able to comprehend what they read.
Multi-grade classrooms also showed a slightly larger variance in student reading scores than single-grade classrooms. Scores in single-grade classrooms clustered more tightly together, with a difference of 34 wpm between the top 25 percent of students and the bottom 25 percent. However, in multi-grade classrooms scores spread out more, with a difference of 42 wpm in multi-grade classrooms. While students in multi-grade classrooms read at a faster pace than students in single-grade classrooms, a wider variation existed among reading scores in multi-grade classrooms than in single-grade classrooms.

148
Opp
ortu
nity
to L
earn
: A h
igh
impa
ct st
rate
gy fo
r im
prov
ing
educ
atio
nal o
utco
mes
in d
evel
opin
g co
untr
ies
School-level factorsIn addition to individual or family characteristics, this study takes into account what factors at the school level might have an effect on students’ opportunity to learn and thus their reading abilities. As Figure 11 shows, while there is variation in student reading fluency within each individual school, there is also a considerable amount of difference between schools. In fact, the intra-class correlation is 0.27 for the sample of CARE schools, a number that is relatively high as compared to those found in other studies in the education field (Hedges & Hedberg, 2007). This suggests that differences in student reading fluency might be explained by some school-level factors, a number of which have been analyzed in this study using the OTL index.
Figure 11. Intra-class and between-school variance in student reading fluency in CARE schools
020
4060
8010
0w
ords
per
min
ute
LC01 LC02 LC03 N12 N13 N14 N15 N16 N17 N18 N19 N20 N21 N22 N23 N24 N25 N27 N29 N30 S04 S05 S06 S07 S08 S09 S10 S11
Note:. Intra-class correlation measures proportion of the variability in student reading fluency that is caused by differences between schools rather than differences between students inside schools. A very low intra-class correlation (close to zero) suggests students within a school behave fairly independently from one another with regard to reading fluency. A very high intra-class correlation (close to 1) suggests differences in student achievement can be better explained by school-level factors than by individual-level factors.
OTL Factor 11: Class sizeResearchers collected class size information from school records and triangulated this with information gathered from teachers during interviews. In this sample of CARE schools, class size varied from 14 to 45 students. The average class size varied slightly depending on grade level. As Table 8 shows, non-CARE schools had an average class size larger than CARE schools, with the total variation in class size ranging from 16 to 49 students.
The team found no significant differences in total class size between schools with single-grade and multi-grade classrooms. In addition, no significant correlation was found between class size and student reading fluency. Table 8 shows the average class size for each grade and type of school.

149
CASE ST
UD
Y: CASE ST
UD
Y: Using O
pportunity to Learn and Early Grade Reading Fluency to M
easure School Eff ectiveness in Honduras
Table 8. Average class size by grade and type of school
CARE, Single-grade classrooms
CARE, Multi-grade classrooms Non-CARE schools
Grade 1 25 24.27 28Grade 2 23.6 24.5 30Grade 3 27.2 26.27 32
Class size is relevant as an OTL factor because it acts as a proxy for the time a teacher can provide to his or her students. In multi-grade classrooms, the teacher must simultaneously engage students who are at different grade levels, which means the organization of classroom activities is necessarily different from the one found in single-grade classrooms. Because it might be more difficult for the teacher to assign or lead an activity that all students can follow, he or she might need to deviate from traditional teacher-centered methods of instruction and often must divide his or her time among the different grade level groups within the classroom. Each student in a multi-grade classroom may therefore receives less direct attention than in a single-grade classroom. This is indeed what the research team found during the classroom observations. In multi-grade classrooms, each observation was coded so as to determine what grade level group the teacher was working with at the time. These codes where subsequently averaged across all observations, which enabled the researchers to estimate the amount of time teachers spent with each grade level in multi-grade classrooms.
As shown in Figure 12, teachers in the sample of multi-grade schools tended to spend more time with Grade 1 students than any other grade level. During classroom visits, the team often observed teachers spending the class period interacting with the lower grade(s) in the classroom and leaving students in higher grade(s) to do exercises from textbooks or wait for further instruction.
Figure 12. Time the teacher spends with each grade level in multi-grade classrooms
18%Grade 6
24%Grade 5
23%Grade 4
25%Grade 3
37%Grade 2
43%Grade 1 43%
0% 5% 10% 15% 20% 25% 30% 35% 40% 45% 50%
Grade 1
Note: The total proportion of time is greater than 1, since most classrooms did not have all the grade levels.
OTL Factor 12: School supportCARE implements a variety of interventions to support schools and works with principals and teachers to ensure schools receive the specific support needed. The most commonly noted interventions received by schools in the sample included: provision of textbooks, notebooks, and other school supplies; teacher training activities; and help organizing school government structures and parent associations.

150
Opp
ortu
nity
to L
earn
: A h
igh
impa
ct st
rate
gy fo
r im
prov
ing
educ
atio
nal o
utco
mes
in d
evel
opin
g co
untr
ies
More than half of the schools in the CARE sample (54 percent) received at least one visit from some educational support staff during the year in which data collection took place. Most of these visits were conducted by personnel from the Ministry of Education or the local district education director (83 percent), while only 9 percent of these visits were from CARE staff (see Figure 13). Given that CARE schools are located in very rural areas, it is relevant to note that at the time of the visit, a large percentage of schools had already been visited by someone from the local or national education sector.
Figure 13. School support visits by entity
Ministry, 13
CARE, 9
Other, 8
CARE, 9
District, 70
About 65 percent of the support visits received by CARE schools involved classroom observations. Seventeen percent of the visits involved individual meetings with the teachers and 43 percent involved group meetings with the teachers. According to the principals’ interviews, most of these group meetings were intended to provide recommendations and evaluate the teachers’ work. Local education officials also came to communicate important information from the Ministry of Education, review school records, and check on teacher and student attendance.
School support, however, is not limited to personnel external to the school. Principals also provide pedagogic support and serve as an important resource for teachers. In CARE schools, 28 percent of teachers said the school principal visited their class at least once a week. In addition, 50 percent of the teachers said their classroom plans were monitored daily (5 percent) or weekly (45 percent). In multi-grade schools, teachers also filled the role of principal and often said it was a challenge to attend both to their classroom and visit other teachers in the school.
Although comparison schools do not receive support from CARE, they do get support from the government. In non-CARE schools, 66 percent of principals said they had been visited at least once during the year that data collection took place, which was actually a higher percentage than in CARE schools. Personnel from the government performed all support visits and were either from the Ministry of Education (25 percent), or from the local district education director (75 percent).
Similarly to the case of CARE schools, about 75 percent of the support visits received by the schools during the year data collection took place involved classroom observations. Of the visits to comparison schools, 50 percent involved individual meetings with the teachers and 25 percent involved group meetings with the teachers.
Conclusions and Policy ImplicationsWhile national and international organizations and governments working in education might strive toward the same outcome of improving student learning, not every agency targets the same inputs

151
CASE ST
UD
Y: CASE ST
UD
Y: Using O
pportunity to Learn and Early Grade Reading Fluency to M
easure School Eff ectiveness in Honduras
to reach this goal. In this study, EQUIP2 argues that in order to improve student learning children must first be guaranteed basic opportunities to learn. Ensuring that schools are open and teachers and students are present will support the impact of interventions at a higher level.
This study set out to answer three basic questions:
• How well do schools provide opportunity to learn?• How does actual opportunity to learn compare to potential opportunity to learn?• How does opportunity to learn vary across schools?
Often, the greatest challenge schools face is ensuring students are provided the opportunities necessary to learn. In this study, the researchers found that schools varied considerably in terms of the number of days they were open, how regularly teachers attended, the frequency and length of breaks provided throughout the school day, and the availability of teacher and student materials. Schools also varied according to the time students spent on task within the classroom and, between multi- and single-grade classrooms, the types of activities in which students were more often engaged.
The results of the EGRA and CAP exams suggest the majority of students in CARE schools have developed adequate reading skills by the Grade 3. These students demonstrate strong pre-reading skills and most are able to read and comprehend text at a level appropriate to their grade. Comprehension proved to be one of the bigger challenges for students, with only 25 percent of children able to answer all the questions they were asked about the text. The range in reading abilities among CARE students in the same classroom should also be highlighted. While all students learn to read at a different pace, it is important that teachers are aware of who is struggling in their classroom and work to ensure the student does not fall behind. This is especially important in multi-grade classrooms where students spend a significant portion of the class working and reading independently.
There was a greater range within the sample in terms of reading abilities in non-CARE schools. Children fell into two categories: those who can versus those who cannot read. Students who were able to decode text managed to do so with a relatively similar level of fluency and comprehension as students in CARE schools. However, a greater proportion of students in comparison schools (40 percent of the sample) were unable to read a single word.
Given the small sample of schools, the researchers were unable to determine a significant relationship between the OTL factors measured in this study and students’ learning outcomes. However, variations documented in some of the variables point to areas on which schools might want to focus. For example, the variation in time spent engaged in reading activities aligns with an interesting pattern in reading outcome data. Overall, students in CARE schools were observed more often reading silently or aloud, which might explain some of the difference in reading scores between CARE and non-CARE schools. Within CARE schools, students in multi-grade classrooms were more often engaged in reading activities than those in single-grade classrooms. This additional time spent reading might account for the difference in reading speeds between the two groups. The researchers did find a number of variables to be related to learning outcomes at the student level. Attendance of preschool and parents who engage students in reading activities were both positively related to students’ reading scores.
The findings uncovered in this study point to a variety of interventions schools can take to ensure students are provided with the learning opportunities necessary to build reading skills and successfully complete their education.

152
Opp
ortu
nity
to L
earn
: A h
igh
impa
ct st
rate
gy fo
r im
prov
ing
educ
atio
nal o
utco
mes
in d
evel
opin
g co
untr
ies
Secure preschool opportunitiesAs the data from this and other studies shows, providing children with a quality preschool education can have a positive impact on their learning in subsequent years. In this sample, 86 percent of CARE students and 87 percent of students in comparison schools attended preschool. In most of the schools visited by the research team, preschool teachers were volunteers and often classes were conducted at hours different than those of the rest of the school. While this study did not collect data to determine why students did not attend, a structured assessment of preschools and student attendance would help CARE and other education officials to identify and address issues surrounding preschool attendance.
Strengthen parents’ participation in student learningStudents in this sample whose parents read to them tended to have stronger decoding skills than students who were not read to at home. Teachers need to increase their communication with parents and encourage them to assist their children in the learning process at home. Parents often believe it is the school’s responsibility to provide their child with an education and do not realize how essential their own role is. Because schools tend to close their doors right at the end of the school days, parents do not often have the opportunity to speak with teachers and receive feedback on their children’s progress. Time outside of the school day needs to be available for parents to meet with teachers and receive guidance on how best to support their children’s learning. As part of CARE’s current initiatives in Guajiquiero, there is a great focus on mobilizing communities, schools, and parents in the effort to secure quality education for children in the area. Part of this initiative could include a campaign to strengthen parent-teacher relationships and help parents learn how they can specifically support the development of their children’s literacy skills. This is particularly important for families where the parents themselves cannot read.
Provide a structured approach to learning While Honduras has a specific language arts curriculum, teachers approach the teaching of reading in many different ways. Teachers cited nine different methods for teaching reading. One possible explanation for the multitude of approaches is that Honduras has changed its curriculum numerous times over the past years. The implementation of a specific reading curriculum with which teachers are comfortable using is essential to ensuring students continue to develop reading skills. It is also important that teachers have the opportunity to develop their own skills around the teaching of reading and are provided support through that process. Even though most students in this sample of third graders are able to decode, teachers need to focus on increasing reading comprehension, fluency, and building vocabulary. Teachers also need to be aware of their students’ reading level. Training teachers to systematically test their children’s reading levels throughout the school year would help ensure that struggling students are not being left behind.
Increase time spent on reading The majority of observations were conducted in language arts classes, however, the activity most often observed in both CARE and non-CARE schools was seatwork (45 and 41 percent, respectively). More time needs to be dedicated to reading activities, especially activities guided by teachers. Training specific to the type of classroom, whether multi- or single-grade, needs to be provided to teachers to help them structure activities to build students’ reading and comprehension skills. For students in multi-grade classrooms, comprehension skills are particularly important to master. Children in these classrooms spend more time practicing lessons on their own out of textbooks as they move up in grades, and therefore must be able to read and understand in order to learn.

153
CASE ST
UD
Y: CASE ST
UD
Y: Using O
pportunity to Learn and Early Grade Reading Fluency to M
easure School Eff ectiveness in Honduras
Ensure delivery of teacher guides and student textbooks and materials Only five schools in the entire sample had language arts books available for all of the students observed. Teachers said it had been two to three years since they received new books for their students and were using what was left over from years past. During the data collection process, researchers visited the district education office and saw that new books had arrived for students yet they were not to be distributed until June, halfway through the school year. Teaching guides were also scarce, and many teachers used photocopied teaching guides. Without proper materials, teachers face great challenges as they try to follow the national curriculum. The lack of textbooks in multi-grade classrooms is especially problematic because teachers must leave students to work on their own as they pass to other grade levels. Honduras must ensure teachers and students receive materials on time and that they are useful resources for the classroom. As part of this process, it is necessary that schools learn to advocate for themselves and voice their needs to local governments. CARE’s support to the region of Guajiquiro has included helping schools to create student councils and working with teachers and principals to increase student participation and leadership. Expanding on this work, CARE could help student governments advocate for their schools with regional governments to demand timely delivery of school learning materials. CARE could also support the coordination of school governments throughout Guajiquiero to help schools collectively communicate their shared needs to the government.
Ensuring the school calendar is adjusted to local needsSchools varied widely in terms of the date that they actually began classes for students and how often they had closed during the school year. Teachers in some areas said the late start to class was caused by teacher training sessions that took place at the beginning of the year. Schools in rural areas also tend to close one day a month (a total of 10 days of school closings) so teachers could pick up their pay checks. Adjustments in the school calendar must be made to account for time lost because of trainings and to fit the needs of teachers and the community. Working with the local community and district education officials, schools need to ensure that classes are held for the total 200 days mandated by the government.
Maximizing classroom timeThe greatest loss of time documented in this study was the time students lost while in class. As seen from the data on time-on-task, the strongest determinant of whether students are on task is whether the teacher is on task. Student involvement in reading activities all but disappears when teachers are off task and more time is devoted to seatwork and copying. Students in multi-grade classrooms were often observed wasting time waiting for further instruction from the teacher as he or she worked with another group of students. Multi-grade teachers need to be provided specific training on how to ensure classroom time is maximized for all students. Teachers in single-grade classrooms need instruction on how to move away from seatwork and copying and to begin to integrate more interactive teacher techniques into their classrooms. In this case, examples from Active Schools in Colombia and Peru might help teachers to increase student engagement time in their classrooms.

154
Opp
ortu
nity
to L
earn
: A h
igh
impa
ct st
rate
gy fo
r im
prov
ing
educ
atio
nal o
utco
mes
in d
evel
opin
g co
untr
ies
ReferencesAbadzi, H. (2007). Absenteeism and Beyond: Instructional Time Loss and Consequences. Independent Evaluation Group. Washington, D.C.: World Bank.
Barnett, W. S., J.W. Young & L.J. Schweinhart. (1998). “How preschool education influences long-term cognitive development and school success: A causal model.” In Early care and education for children in poverty: promises, programs, and long-term results, edited by W. Barnett & S. Boocock. Albany, NY: State University of New York.
Bennett, K.K., D.J. Weigel & S.S. Martin. (2002). “Children’s acquisition of early literacy skills: Examining family contributions.” Early Childhood Research Quarterly. Vol. 17, 295–317.
Britto P.R. & J. Brooks-Gunn. (2001). “Beyond shared book reading: Dimensions of home literacy and low-income African-American preschoolers’ skills.” In New directions for child development: Vol. 92. The role of family literacy environments in promoting young children’s emerging literacy skills, edited by P.R. Britto & J. Brooks-Gunn J. San Francisco, CA: Jossey-Bass.
Camilli, G., S. Vargas, S. Ryan & W.S. Barnett. (Forthcoming). Meta-analysis of the effects of early education interventions on cognitive and social development. New York City, NY: Teachers College Record.
Clay, Marie. (2000). Concepts About Print: What Have Children Learned about the Way We Print Language? Portsmouth, NH: Heinemann.
DeStefano, Joseph, Audrey-marie Schuh Moore, David Balwanz & Ash Hartwell. (2007). Meeting EFA: Reaching the Underserved through Complementary Models of Education. Washington, D.C.: United States Agency for International Development (USAID), Educational Quality Improvement Program 2 (EQUIP2), and FHI 360.
Gillies, John & Jessica Jester Quijada. (2008). Opportunity to Learn: A high impact strategy for improving educational outcomes in developing countries. Washington, D.C.: USAID, EQUIP2, and FHI 360.
Hedges, L. V. & E.C. Hedberg. (2007). “Intraclass correlation values for planning group-randomized trails in education.” Educational Evaluation and Policy Analysis. Vol. 29(1), 30–59.
Jordan, G.E., C.E. Snow & M.V. Porche. (2000). “Project EASE: The Effect of a Family Literacy Project on Kindergarten Students’ Early Literacy Skills.” Reading Research Quarterly. Vol. 35(4), 524–546.
Jukes, Mathew, Shaher Banu Vagh & Young-Suk Kim. (2006). Development of Assessments of Reading Ability and Classroom Behavior, a report prepared for the World Bank. Cambridge, MA: Harvard Graduate School of Education.
Kellaghan, Thomas. (2004). Public Examinations, National and International Assessments, and Educational Policy. Dublin, Ireland: Education Research Center, St. Patrick’s College.
Opazo, Juan Enrique. (2008). Overcoming Inequality: Why governance matters. Paris: UNESCO.
UNESCO, United Nations Statistics Division. (Unpublished). Handbook on Poverty Statistics: Concepts, methods, and policy. Paris: UNESCO, United Nations Statistics Division.

155
CASE ST
UD
Y: CASE ST
UD
Y: Using O
pportunity to Learn and Early Grade Reading Fluency to M
easure School Eff ectiveness in Honduras
UNESCO Institute for Statistics. “UIS Statistics in Brief, 2009.” Montreal, QC: UIS. Viewed in 2009 at http://stats.uis.unesco.org/unesco/TableViewer/document.aspx?ReportId=121&IF_Language=eng&BR_Country=3400&BR_Region=40520.
UNICEF. “Honduras Statistics.” Tegucigalpa, Honduras: UNICEF Honduras. Viewed in 2009 at http://www.unicef.org/infobycountry/honduras_statistics.html.
Zhang, Y., et al. (2008). A view inside primary schools. A World Education Indicators (WEI) cross-national study. Montreal: UNESCO Institute for Statistics.


157
CASE ST
UD
Y: CASE ST
UD
Y: Using O
pportunity to Learn and Early Grade Reading Fluency to M
easure School Eff ectiveness in Mozam
bique
Using Opportunity to Learn and Early Grade Reading Fluency to Measure School Effectiveness in Mozambique
Executive SummaryMozambique is one of the poorest countries in the world, ranking 172 of 182 countries in 2009 (HDI, 2009). More than half of its population lives below the poverty line without access to basic services such as education. More than 40 percent of the state budget still depends on external assistance (MDG Goals, 2010). Cabo Delgado, the northernmost province of Mozambique, has among the highest poverty rates in the country. Sixty-three percent of Cabo Delgado’s population lives below the poverty line (the national average is 54 percent). Per capita GDP for Cabo Delgado was just $170 in 2010 (INE, 2010). Primary net enrollment rates nationwide average 92 percent (UIS, 2010).
School effectiveness is measured and evaluated in terms of both specific student learning outcomes and the opportunity to learn provided by the school. Building on findings from a series of 10 case studies of complementary programs (DeStefano, et al., 2007) as well as research on opportunities to learn (OTL) (Gillies & Quijada, 2007), EQUIP2 identified the following 12 factors as foundational in terms of providing students the basic opportunities needed for learning:
1. Percentage of days school is open 2. Teacher attendance3. Student attendance4. Percentage of the school day available for instruction5. Percentage of student time-on-task6. Equivalent percentage of days available for instruction (calculated based on factors 1–5)7. Percentage of students with a textbook8. Percentage of observed textbook use9. Percentage of time spent reading10. Grade 3 reading ability11. Class size12. School support
These factors provide a practical framework for assessing whether a school is providing children the maximum opportunity to learn.
The research questions for the study are as follows:
• How well do schools provide an opportunity to learn?• How does the actual opportunity to learn compare with the potential opportunity to learn?• How does the opportunity to learn vary across schools? • Based on the provision of an opportunity to learn, are students in Grade 3 learning to read?
Through collaboration with the Provincial Directorate, and a partnership with the Aga Khan Foundation (AKF), EQUIP2 was provided access to schools in six districts of Cabo Delgado Province: Ibo, Pemba Metuge, Macomia, Meluco, Quissanga, and Mecufi. Over 60 schools were visited during this study and complete data were collected at 49 schools. A total of 631 Grade 3

158
Opp
ortu
nity
to L
earn
: A h
igh
impa
ct st
rate
gy fo
r im
prov
ing
educ
atio
nal o
utco
mes
in d
evel
opin
g co
untr
ies
students were tested for foundational reading skills. Researchers conducted classroom observations in more than 100 Grade 1–3 classrooms.
FindingsOverall, students in Grade 3 are struggling to read. Of the 631 Grade 3 students sampled, 59 percent were unable to read a single word in Portuguese. Approximately 33 percent were only able to read from 1 to 5 words per minute (wpm) and only 6 percent of students in the sample were able to read more than 11 wpm. On average, a greater percentage of boys were able to read and at a faster rate than the girls in the sample.
It is not clear if students in Cabo Delgado understand spoken Portuguese or have the requisite vocabulary base to read. Although 25 percent of the overall sample was able to answer 10 or more of the oral vocabulary questions, the remaining 75 percent of students struggled considerably with the oral vocabulary exam. The average number of correct responses on the oral vocabulary test was 10 of 20 questions with variations in student performance ranging from 0–18 questions answered correctly.
Students in Cabo Delgado struggle with letter recognition, but understand the concepts behind learning the alphabet. Across the sample, Grade 3 students were able to recognize an average of 8 letters correctly in one minute; 14 percent were able to identify 20 or more correct letters. Some students recited the alphabet or gave Arabic letters as responses. Although the behavior did not follow the directions for the assessment, it did demonstrate that a group of students understood the idea behind the identification of letters but simply lacked the skills to complete the exercise.
Students in Cabo Delgado are gaining knowledge of concepts about print, but slowly. On average, Grade 3 students in the study sample were able to answer 4 out of 10 questions related to understanding concepts about print material. Over 70 percent of students were able to identify the cover of the book and open to the page where the story began, but struggled when asked to follow along as the enumerator read and to select a word from the text and read it aloud. There was a great deal of variation in student scores ranging from 0–10 responses answered correctly. These results suggest that students are developing some fundamental pre-reading skills but struggle when asked to perform at a higher level.
Students’ mother tongue is an important factor to consider in the reading assessment results. Ninety-three percent of students in the sample reported speaking one or more mother tongue languages at home. On average, students speaking only ShiMakonde, Emakhuwa or KiMuani at home had very similar scores on each of the tests and struggle the most to read. Students who spoke more than one mother tongue language at home scored slightly higher than those speaking only one language. For example, students in the multiple mother tongue groups read on average 13 letters and eight words per minute (wpm). Students who speak only one mother tongue read seven to eight letters and only two wpm. Results were much higher for students who spoke Portuguese at home; these students scored an average of 18 of 20 on the oral vocabulary and identified 25 letters of the alphabet. Students who speak Portuguese plus another mother tongue language scored 12 on the oral vocabulary; identified 38 letters of the alphabet correctly; and read an average of 25 wpm. Sample schools in Macomia had the lowest percentage of non-readers (57%).
At a minimum, all students need books, reading and writing materials, as well as focused time for reading to develop foundational reading skills. The majority of students in Grades 1–3 had language textbooks (80 percent). Nearly 32 percent of students in the sample did not have notebooks and 27 percent of students did not have writing utensils. Students in Grade 3 were less likely to have textbooks compared to Grades 1 and 2 (63 percent compared to 79 percent and 80 percent respectively). Time dedicated to using the printed materials is also important; although over 80

159
CASE ST
UD
Y: CASE ST
UD
Y: Using O
pportunity to Learn and Early Grade Reading Fluency to M
easure School Eff ectiveness in Mozam
bique
percent of students in the sample had a textbook, the books were only used 40 percent of the time or less in Portuguese classes.
In addition to the lack of foundational reading skills, several other factors were found that influence the quality and opportunity to learn provided by schools in Cabo Delgado:
• The school year in Mozambique officially runs from January to October and includes 183 days. Schools in this study opened, on average, 4 days after the official start date and had been closed an average of 6 days by the time of the school visits in May 2010, with a variance of 0–60 days reported among the sample of 49 schools.
• The average teacher attendance rate according to official documentation from the sample schools was 87 percent, but observed attendance rates were much lower, suggesting that actual rates are likely lower than reported. Teachers reported missing an average of 21 teaching days from the start of the school year to May 2010, with a variance among schools of 5–92 days.
• The average student attendance rate was 78 percent, equivalent to a loss of 32 school days a year (nearly two months). Schools reported a range of attendance rates, from a low of 39 percent to a high of 98 percent.
• Students are losing more than 50 percent of potential learning time as a result of late start times, early closing, and extended recesses.
• When teachers are engaged in academic activities (on task), Grade 1–3 students spent 75 percent of the time on task. In comparison, when teachers were off task, students only spent 21 percent of the time engaged in academic activities.
When all the opportunity to learn (OTL) factors are accounted for, only 30 days a year remain for actual instruction to take place compared to the expected 183 days mandated by the Ministry of Education.
Policy ImplicationsImprove the school scheduleWhen addressing time variables, the implications for policy reform need to distinguish between factors that are easily addressed and those that require more complicated policy interventions. OTL factors such as school closures, absenteeism, and daily time losses are more easily corrected than ensuring quality time-on-task, teacher training, and support services, because policy-makers can engage communities in solving the former set of problems and holding schools accountable. EQUIP2 complementary education research supports the idea that community-run or supported programs are designed to engage parents help to ensure that schools are open, and teachers and students are present.
Provision and use of reading materials and textbooks:
• Textbooks are not a useful tool unless teachers have training on how to integrate the books into their instructional practice. Training to effectively use textbooks should include pedagogically sound approaches such as including activities that emphasize the development of phonological awareness skills, silent reading of story books, and peer reading.
• Government textbooks and other supplemental books, such as storybooks, should include stories and texts that allow students to practice reading. Examples of texts that children could read (such as storybooks) were limited and failed to engage children’s imaginations and excite them about learning to read. Practice reading is critical for early grade students to learn to read. The government should consider strengthening efforts to introduce more reading instruction in mother tongue languages and to evaluate, strengthen, and possibly expand the bilingual educa-

160
Opp
ortu
nity
to L
earn
: A h
igh
impa
ct st
rate
gy fo
r im
prov
ing
educ
atio
nal o
utco
mes
in d
evel
opin
g co
untr
ies
tion program that is currently implemented on a small scale. • Classroom practices must include use of textbooks and other reading materials to improve lear-
ning and to engage students. Teachers need to apply these strategies consistently in the classroom. The implication for policy-makers is twofold. First, classrooms must be equipped with additional materials such as easels, storybooks, and supplies for students to create and use reading materials. Second, the link between providing these new materials to pre-service and in-service teacher training and support must be clear to ensure the materials are used in ways that help students learn to read. In this lies a more complex set of investments with unclear financial trade-offs that should be carefully examined in each context.
• Introduce interventions such as accelerated learning programs, after-school tutoring, and special classes for students who are behind. Implementing community and/or school libraries would also provide students and families the opportunity to interact with more print material and extend learning past the classroom.
The OTL index developed under EQUIP2 includes reading fluency as an indicator of school effectiveness. This index provides a tool that could be used to contextualize the information about learning outcomes provided by Early Grade Reading Assessments (EGRA). The OTL index provides educators, program managers, and policy-makers with useful, time-relevant data about variations among schools across the 12 factors. These school effectiveness data can allow more targeted support where assistance is needed. For example, one school may have high time-on-task percentages, but high teacher absentee rates. This knowledge could help a community or education official focus on the specific issue at the school, in this case determining why teachers are consistently absent. The OTL index would allow individualized and on-going support to schools by allowing supervisors to collect school-relevant data.
In addition, the successful implementation of EGRA in this study demonstrates that literacy assessments in general can be designed to serve as useful diagnostic tools in a variety of settings and languages. Such assessments—once adapted to the local context—need to be used more systematically, not only to gauge whether learning is occurring, but also to allow teachers to spot check their students’ progress. Literacy assessment tools such as EGRA can help teachers deploy instructional interventions that respond to their students’ needs, including identifying students who need significant remedial support.
ConclusionAlthough national and international organizations and governments working in education may strive towards the same outcome of improving student learning, not every agency targets the same inputs to reach this goal. In this study, we argue that to improve student learning, we must first guarantee that children are provided the basic opportunities to learn. Ensuring that schools are open and that teachers and students are present will ensure there is more time available for instruction. But providing time is not enough. There needs to be an increased focus on building foundational skills in reading. Teaching students to unlock the meaning of text is the single most powerful skill teachers can foster (Lemov, 2010). To help early grade students improve their reading, teachers need to dedicate more classroom time to teaching skills such as decoding, fluency, vocabulary, and comprehension and provide sufficient time for individual, small group, and/or shared practice around reading. Parents are also essential elements in supporting students to become successful learners and can serve as valuable resources both inside and outside the classroom. By reaching out to parents and the broader community, schools can extend their educational reach and expand the space for learning past its walls.

161
CASE ST
UD
Y: CASE ST
UD
Y: Using O
pportunity to Learn and Early Grade Reading Fluency to M
easure School Eff ectiveness in Mozam
bique
IntroductionMozambique is one of the poorest countries in the world, ranking 172 of 182 countries in 2009 (HDI, 2009). More than half of its population lives below the poverty line without access to basic services such as education. More than 40 percent of the state budget still depends on external assistance (Republic of Mozambique, 2010). Cabo Delgado, the northernmost province of Mozambique, has among the highest poverty rates in the country. Sixty-three percent of Cabo Delgado’s population of 1.6 million lives below the poverty line (the national average is 54 percent). Per capita GDP for Cabo Delgado was just $141 (half the national average) in 2002, well below the UNDP extreme poverty line of $1 per day (Bechtel, 2003). Despite some areas of economic growth in the province, the majority of the population in Cabo Delgado live in isolated villages, with poor access to year-round passable roads and corresponding poor access to markets, education and health services, and power and communication infrastructure.
In 2010, the USAID-funded EQUIP2 project teamed with the Aga Khan Foundation (AKF) to examine the effectiveness of primary schools in terms of time spent on and off task and children’s ability to read in Grade 3. In this study, school effectiveness is measured and evaluated in terms of both specific student learning outcomes and the opportunity to learn provided by the school.
Building on findings from a series of ten case studies of complementary programs (DeStefano, et al., 2007) as well as research on the opportunity to learn (Gillies & Quijada, 2007), EQUIP2 identified the following 12 factors as necessary to establish a foundational opportunity to learn:
1. Percentage of days school is open2. Teacher attendance3. Student attendance4. Percentage of the school day available for instruction5. Percentage of student time-on-task6. Equivalent percentage of days available for instruction (calculated based on factors 1–5)7. Percentage of students with a textbook8. Percentage of observed textbook use9. Percentage of time spent reading10. Grade 3 reading ability11. Class size12. School support
These factors provide a practical framework for assessing whether a school is providing children with the maximum opportunities to learn and whether it draws on teaching approaches that make the best possible use of the instructional time that is available. The research questions for the study are as follows:
• How well do schools provide an opportunity to learn?• How does the actual opportunity to learn compare to the potential opportunity to learn?• How does the opportunity to learn vary across schools? • Based on the provision of an opportunity to learn, are students in Grade 3 learning to read?
Through collaboration with the Provincial Directorate, and in partnership with AKF, EQUIP2 was given access to schools in six districts of the Cabo Delgado Province: Ibo, Pemba Metuge, Macomia, Meluco, Quissanga and Mecufi. Over 60 schools were visited during this study and complete data were collected at 49 locations. The data from this study will be used by AKF who, in collaboration with the Provincial Directorate, district education departments, communities, and schools, will

162
Opp
ortu
nity
to L
earn
: A h
igh
impa
ct st
rate
gy fo
r im
prov
ing
educ
atio
nal o
utco
mes
in d
evel
opin
g co
untr
ies
modify their current interventions with the aim that collectively all stakeholders involved can improve the opportunity to learn that schools provide their students.
ContextEducation opportunities in Cabo Delgado over the past 10 years have been largely influenced by the Government of Mozambique’s Education for All efforts. The government removed enrollment fees in primary education, provided free textbooks to students, introduced a new curriculum, removed exams between primary education grades, promoted accelerated construction of schools, built teacher training institutes in each province, and increased the number of trained teachers. Despite these reforms, Mozambique continues to trail behind other African countries in its major education indicators. Table I summarizes the main education indicators in Mozambique and more specifically, in the province of Cabo Delgado.
Table I: Select education indicators
Country Cabo DelgadoAdult female literacy rate (MICS 2008) 47% 29%Adult illiteracy rate (World Bank 2003) 54% 68%% of secondary school age girls attending secondary school (MICS 2008)
20% 11%
% of primary school age girls attending school (MICS 2008) 80% 74%Primary school net enrollment rate (MICS 2008) 82% 74%Primary school net completion rate (MICS 2008)1 15% 9%Grade 1–5 teacher:student ratio (MOE 2004) 66:1 75:1Proportion of female teachers, Grade 1–5 (MOE 2004) 29% 12%
The existing primary education system includes the following categories: Escola Primaria do I Grau (EP1) referring to Grades 1–5; Escola Primaria do II Grau (EP2) referring to Grades 6–7; and Escolas Primarias Completas (EPC) referring to schools with Grades 1–7. More than 70 percent of primary schools in Cabo Delgado accommodate two shifts a day (and sometimes up to three in urban areas), resulting in an increased workload for teachers and a shortened school day for students.
The number of EP1 students in Cabo Delgado increased from 224,000 to 312,000 from 2003 to 2008 (Bechtel, 2003). However, the province has the lowest EP1 completion rates in the country (62.1 percent); the lowest EP2 net completion rates (8.8 percent); and one of the highest EP1 teacher student ratios (75:1) in Mozambique (Republic of Mozambique, 2010). In Pemba, the provincial capital, 12 of its 14 primary schools are EPC schools. In stark contrast, only 41 of the 151 (27 percent) primary schools located in the 5 districts where AKF (Mozambique) worked at the time of the study were EPCs. Opportunities for children to complete seven years of full primary schooling are severely limited.
Mother tongue instruction is an important factor in Mozambican education. Nationally 6 percent of the population speaks Portuguese as a first language and an additional 39 percent speak Portuguese as a second language (Patel, Chambo & Tempe, 2010). Bi-lingual instruction was introduced in 2001 and the Instituto Nacional de Estatisticas (INDE) has adopted an official bilingual program in its education system; however, by 2008 of the 11,859 schools, only 75 were bilingual (Patel, Chambo & Tempe, 2010). The current Plano Curricular do Ensino Básico (PCEB, Basic Education Curriculum Plan) suggests that pedagogically the ideal model is bilingual education in which initial

163
CASE ST
UD
Y: CASE ST
UD
Y: Using O
pportunity to Learn and Early Grade Reading Fluency to M
easure School Eff ectiveness in Mozam
bique
learning (reading and writing) would be in the child’s mother tongue. Although the Ministry of Education is moving toward this approach, teachers are expected to use ‘on-the-spot’ translation to assist students to learn Portuguese. The languages most commonly spoken in Cabo Delgado are Emakhuwa (67 percent), ShiMakonde (20 percent) and KiMwani (6 percent), and in the first years of school, students are expected to learn to speak, read, and write in what for most is an entirely new language (Portuguese).
The Aga Khan Foundation and Education in Cabo DelgadoAga Khan Foundation (Mozambique) (AKF(Moz)) has been operating in Cabo Delgado since 2001. AKF’s multi-sectoral program (Coastal Rural Support Programme) combines interventions in education, health, civil society, enterprise and rural development, and the built environment to address development priorities that include poverty reduction, food security, and improved quality of life. AKF(Moz) actively promotes partnerships between the government, private sector actors, and civil society institutions. AKF (Moz)’s education interventions began with adult literacy programs in 2003, and more broadly work with local communities and the Government to understand and begin to improve access to and quality of educational opportunities available in Cabo Delgado.
Currently, the foundation’s education program in Cabo Delgado supports early childhood development (ECD), adult literacy, school improvement, and access to technical and tertiary education through scholarships.
At the primary level, the School Improvement Program (SIP) has followed a complementary approach to government actions providing technical, material, and financial support for planned in-service training for existing teachers, scholarships for new teachers (over 60), assisting with the orientation of teachers to the new curriculum, distribution of teaching and learning materials, training community school councils, and supporting school and latrine construction. Since 2004, and beginning in two districts, AKF’s SIP has been concerned with improving children’s timely enrollment (closer to the expected age 6 rather than 8 or older as is common), creating opportunities for additional learning outside school hours, and increasing family and community involvement in children’s education.
The AKF education team has to date been limited in size (one to two SIP staff in Pemba working with usually one education person based in each of the five districts). This structure, where AKF staff are informed through ongoing dialogue with communities and provincial education authorities, has enabled AKF to support parents and community members to contribute directly to improving their children’s education on the one hand and school directors and district staff on the other to reach teachers rather than the AKF education team themselves providing separate professional development and in-class coaching. In addition to supporting primary education, AKF has supported the development of 58 community libraries linked with the adult literacy initiatives and is piloting 14 ‘community learning spaces’ (espaços comunitários de aprendizagem—ECAs) that are operated by communities in the targeted districts and provide primary students with opportunities to practice writing and access reading materials. The ECAs aim to allow students to get support on school matters from volunteer ‘Friends of School’ who are largely local community resource persons.
Table II provides primary school enrollment data for the schools situated in AKF (Moz)’s target area in 2009. In 2009 there were 151 primary schools across the five districts in which AKF was working with government and communities, reaching more than 43,000 students.
To provide AKF (Moz) with relevant comparison data, the study was also conducted in the neighboring district of Mecufi. In 2009, there were 19 schools in Mecufi—14 EP1 schools and 5 EPC schools—with a combined student population of 9,484 students in Grades 1–7.

164
Opp
ortu
nity
to L
earn
: A h
igh
impa
ct st
rate
gy fo
r im
prov
ing
educ
atio
nal o
utco
mes
in d
evel
opin
g co
untr
ies
Table II: AKF supported schools in target areas
Ibo Pemba Metuge
Macomia Meluco Quissanga Total
Year AKF began working in district/schools
2004 2007 2007 2008 2004
Number of EP1 schools
7 18 37 20 28 110
Number of EPC schools
3 10 10 9 9 41
Total number of schools:
10 28 47 29 37 151
Total enrollment: Grades 1–5 (% girls)
2,062
(53%)
12,048
(47%)
15,442
(47%)
4,787
(46%)
9,504
(46%)
43,843
(48%)
Total enrollment: Grades 6–7 (% girls)
376
(53%)
1,611
(44%)
1,916
(36%)
822
(30%)
803
(32%)
5,528
(39%)
Total enrollment: Grades 6–7 (% girls)
376
(53%)
1,611
(44%)
1,916
(36%)
822
(30%)
803
(32%)
5,528
(39%)
DPEC data 2009
Study Sample and Methodology Based on mutual interest to understand what interventions best support student success in schools, EQUIP2 partnered with the Aga Khan Foundation (AKF) to conduct this case study. AKF provided a co-investigator, facilitated access to schools in the districts where AKF is implementing activities, and provided field support from their offices for data collection, transportation, and materials. The following discussion elaborates on the sampling and methodology used for collecting and analyzing the data presented in the case study. The results represent the establishment of a baseline of time lost by students, instructional time on task, and student reading fluency in a sample of government schools in six districts of Cabo Delgado. The purpose of the study is to assist AKF to refine their interventions to better assist teachers and students in the classroom and was not an evaluation of AKF’s performance.
Study SampleAt the time of the study, AKF supported 151 schools in five districts in Cabo Delgado. The research team stratified the 151 schools by distance and size of school and then randomly selected 52 (34 percent of the total) schools, which were proportionately distributed between size and distance categories. Researchers also selected 10 matching comparison schools, which were chosen based on a similar socio-economic status of the families, distance, and size of school.
The district and provincial government offices provided access to the selected schools. The team made 70 school visits, returning twice to any school that was closed the first time. On 19 occasions (27 percent of the time) the visited school was found to be unexpectedly closed. Data collection did not occur in a number of schools because some schools were found closed during the second visit or students from Grade 3 were not present on the day of the visit. Of the total original sample of 62 schools, researchers were able to collect complete data from 49 schools (44 in the AKF program

165
CASE ST
UD
Y: CASE ST
UD
Y: Using O
pportunity to Learn and Early Grade Reading Fluency to M
easure School Eff ectiveness in Mozam
bique
area and 5 comparison schools). Schools often divided the grades between a morning and afternoon shift. In general the research team arrived at the schools in the morning and would stay for the second shift if it included Grade 3 students. Given the small sample size of comparison schools where data could be collected and similarity found within the data, the two groups were combined for this study and the findings will be presented together.
The characteristics of the final sample of 49 schools are summarized in Table III by district.
Table III: Characteristics of schools in the sample
Number of Schools
Total Grades 1–3 Enrollment
Total Grade 3 Enrollment
Average Grade 3 class size
Ibo 3 553 184 46Pemba Metuge 7 1,720 419 38Macomia 18 3,960 1,187 47Meluco 6 773 193 32Quissanga 10 2,115 519 40Mecufi 5 1,645 441 44Total 49 10,766 2,943 45
The research team interviewed a total of 631 Grade 3 students (50 percent girls) in 49 schools. In each of the schools, the research team randomly selected 20 Grade 3 students to participate in a series of early grade reading assessments (EGRA). The number of boys and girls in the sample was selected to match the gender ratio in the classroom. When researchers found fewer than 20 students in a classroom (e.g., due to absenteeism or small class size) all of Grade 3 students were assessed. On a number of occasions, the school day would end prematurely and enumerators were unable to interview the entire sample of students. The research team was able to interview an average of 13 students per visit but the range in the number of interviews conducted at each school went from as few as 4 to as many as 23. Classroom observations were conducted in over 100 Grade 1-3 classrooms. Table IV provides a summary of the characteristics of the students included in the sample as reported by the students.
As the table demonstrates, the sample was divided equally between male and female students. The average age of students was 11 and 89 percent of students in Grade 3 were over age. Although the majority of the sample was over the target age for Grade 3 (8 years old), only half of the students reported having repeated a grade.
In terms of household characteristics, the most common possession was a radio and almost half of the families had a toilet. However, only 3 percent of the students’ homes had electricity or a refrigerator. Approximately 21 percent of students in the sample worked outside the home mainly selling different goods or produce while others reported working in the fields or washing clothes. Sixty-eight percent of students walk between 10 and 30 minutes to school each day while only 25 percent of students walk less than 10 minutes to get to school.
When asked about their own reading habits, 24 percent of children reported they read at home and 28 percent said that someone at home reads to them and only 33 percent of students had a book at home.

166
Opp
ortu
nity
to L
earn
: A h
igh
impa
ct st
rate
gy fo
r im
prov
ing
educ
atio
nal o
utco
mes
in d
evel
opin
g co
untr
ies
Table IV: Characteristics of students in the sample
Total SampleNumber of Grade 3 students sampled 631% Boys 50%% Girls 50%
Average age (years) 11Range in age (years) 5–18% over age (older than 8 years) 89%% who attended preschool 13%% students who did not repeat Grade 3 88%% student who did not repeat any grade 52%
% student who walk less than 10 min. to school 25%% students who walk 10 to 30 min. to school 68%% students who walk more than 30 min. to access water 27%
% students who work outside their home 21%% students who have in their home: a radio 67% a bicycle 57% a toilet 48% a mattress 34%
a refrigerator 3% access to electricity 3%
% students who read independently at home 24%% students who have someone to read to them 28%% students with at least one book at home 33%
When asked about the education level of their parents, students in the sample schools reported the following:
• Forty-one percent of children did not know the education level of their mother and 54 percent did not know the education level of their father.
• For those children that did know: – 48 percent reported that their mother had no education. – 46 percent reported that their mother had finished primary school. – 38 percent reported that their father had no education. – 50 percent reported that their father had finished primary school.

167
CASE ST
UD
Y: CASE ST
UD
Y: Using O
pportunity to Learn and Early Grade Reading Fluency to M
easure School Eff ectiveness in Mozam
bique
Of the characteristics described above, both gender and age were strongly associated with students’ reading outcomes. Boys tended to display greater rates in fluency than girls and older students could also read at a faster speed. Students who reported reading at home also had on average a higher reading rate relative to the others. Interestingly, there was no relationship between the number of books students reported having at home and reading fluency. Similarly, students who reported having someone at home to read to them did not score on average higher than those who did not have such support. There was no difference in reading scores when results were disaggregated according to socio-economic indicators. Greater analysis of the differences in literacy skills will be provided in later sections.
Data Collection MethodologyThe protocols for this research were adapted from instruments used in EQUIP2 Opportunity to Learn studies in Latin America and elsewhere in Africa. The instruments were carefully modified with the support from the local AKF team to be appropriate for Mozambique and specifically the province of Cabo Delgado. All instruments were translated into Portuguese, piloted in-country and revised accordingly. The following protocols were used in the study:
• Stallings Observation Instrument: The Stallings Observation Instrument is a classroom snapshot that records what academic and non-academic activities teachers and students are engaged in and the materials being used in a classroom.
• Interview Protocols: A teacher and school director interview protocol were developed and used to collect data on teacher and student absenteeism as well as school support services. A student protocol was also included to gather information on family socioeconomic background, lan-guage use, and reading habits.
• School Observation Instrument: A school observation instrument was developed to document environmental data, and in particular, the actual and observed timings for school opening, recess, and closure.
• Reading Assessments: Five EGRA assessments were adapted for use in the Grade 3 reading assessments, including oral vocabulary, letters, concepts about print, reading fluency, and reading comprehension. These instruments were originally developed by RTI under the USAID-funded Ed Data II project and adapted for use in Mozambique.2
The EQUIP2 research team spent one day visiting each school. Each visit consisted of six activities:
• Capture general observations about the school, including the presence of certain facilities and whether students and teachers were inside or outside the classroom.
• Observations in Grades 1, 2, and 3 for 45 minutes each using the Stallings Observation Instru-ment.
• Interview the school director to obtain information on student enrollment, teacher and student attendance, teachers background data, support visits received by the school and community participation at the school level.
• Interview each of the teachers observed to gather information on background, experience, atten-dance, classroom support and reading instruction.
• Interview individual students in Grade 3 to obtain information on the students’ background, language use, and reading habits.
• Conduct an oral vocabulary exam and three reading assessments to measure print awareness and basic literacy skills of Grade 3 students.
The EQUIP2 team trained local data collectors to use the instruments to collect all data during the school visits. Data collectors were assigned to teams based on their knowledge of and fluency

168
Opp
ortu
nity
to L
earn
: A h
igh
impa
ct st
rate
gy fo
r im
prov
ing
educ
atio
nal o
utco
mes
in d
evel
opin
g co
untr
ies
in the mother tongue spoken in the given districts. Interviews with students to gather data on socioeconomic (SES) factors and students’ academic engagement in the home as well as the Concepts about Print (CAP) assessment were conducted in the child’s mother tongue. All other student assessments were conducted in Portuguese, the language in which children are taught to read; however, the directions given to the student for each assessment were stated in the child’s mother tongue.
Data collected from the schools was entered into Excel and then uploaded into SPSS for analysis.
Limitations of the studyAlthough the data presented in this study are robust and representative of education in these schools, there are important limitations to the methodology and data that must be recognized:
• Since only schools in a limited portion of the Cabo Delgado province were visited, the data cannot be used to make larger assumptions about schools across Mozambique. The results offer insights into the situation of education in rural Mozambique, however, and offer a framework for developing further research in this area of the country.
• The research team was only able to gather complete data from 49 schools compared to the intended 62 from the initial sample.
• Because the number of schools is small, this study presents descriptive statistics and analyzes simple relationships among the different variables measured using two-tailed t-tests with ≤0.05.
• Although efforts were made to create a positive interaction with the children, students’ perfor-mance on the reading assessments may have been negatively affected by their unfamiliarity with one-on-one interviews or the EGRA methodology.
• Data on student age, time to travel to school and their parents’ education was self-reported. The data cannot be triangulated with any other source and likely includes some errors. In particular, students were unsure of their age and over half of the group reported they did not know their parents’ level of education.
• Data for school closings and student and teacher attendance were taken from attendance books and triangulated with self-reported information. The research team noted that there was a lack of consistency in terms of how the school gathered and recorded absenteeism and school closure data. Attendance data for a given week or month was often filled in to attendance books before the time period had actually passed. In addition, dates of attendance did not always correspond to the actual school calendar. Students or teachers were often marked as present on national holidays when the school should have been, and most likely was, closed. In this study, data that were documented in record books were used whenever possible. For schools without documented data, self-reported data were used and as a last resort, district averages were used when no infor-mation was available. Given what was actually observed on the day of the visit, it is most likely the data presented here underestimate the actual absenteeism and school closing rates, especially in terms of student attendance rates, since very limited information was available.
Although the conclusions presented in this report are limited to 49 schools, the findings still shed light on weaknesses with the rural education sector and highlight areas that the Ministry of Education in Mozambique pay particular attention to for strengthening its education system.
FindingsFactors that have an impact on students’ abilities to learn to readLearning how to read is perhaps one of the most critical outcomes of primary education. Studies in the United States have shown that students who have not developed at least a moderate level

169
CASE ST
UD
Y: CASE ST
UD
Y: Using O
pportunity to Learn and Early Grade Reading Fluency to M
easure School Eff ectiveness in Mozam
bique
of literacy skills by the end of Grade 3 are unlikely to graduate from high school (Annie E Casey Foundation, 2010). In Mozambique—where only 54 percent of students who enter Grade 1 graduate from Grade 5—the development of literacy skills in the early grades, among other factors, could positively impact the possibility of a student completing primary school (UIS, 2010). Furthermore, if children are not going to make it past Grade 5, it is essential that at minimum students have the basic reading skills they will need for the rest of their adult life.
The data gathered from Grade 3 students in this research study demonstrate a strong relationship among each component of the EGRA: oral vocabulary, letter recognition, concepts about print, and reading fluency. Students who scored higher on the oral vocabulary, letter recognition, and CAP assessments were more likely to read at a faster rate. The numbers also clearly show that students in the Cabo Delgado region are struggling to read. Figure I shows the results of the student reading fluency diagnostic by words read per minute in Portuguese for the entire sample.
Figure I. Percentage of Grade 3 students by number of words read per minute
Grade 3 reading abilityOverall, 59 percent of the sample was unable to read a single word in Portuguese. Approximately 33 percent of students were able to read from one to five wpm and 6 percent of students in the sample were able to read more than 11 wpm. According to research conducted by Helen Abadzi, students learning the Romance-based languages should be able to read 80–90 wpm by Grade 3 and to comprehend the text they were given, students need to be able to read at least 40–60 wpm.3 In this sample, less than 2 percent of students read at least 40 wpm. On average, boys were more likely to be able to read at least one word more than girls (43 percent of boys versus 37 percent of girls). The boys who could read performed at a faster rate (8 wpm) when compared to girls who could read (3 wpm). When comparing students within and across schools, there is very little variation in outcomes.
Research on early grade reading shows that students need to understand spoken language, read letters, and understand concepts about print as foundational skills for learning to read. The following results help us to understand why students in Cabo Delgado are struggling to read.

170
Opp
ortu
nity
to L
earn
: A h
igh
impa
ct st
rate
gy fo
r im
prov
ing
educ
atio
nal o
utco
mes
in d
evel
opin
g co
untr
ies
Portuguese oral comprehensionOral vocabulary is a key element to learning to read and the relationship between oral vocabulary and reading is among the oldest and most clearly articulated findings in educational research (Blachowicz & Fisher, 1996; Snow, Burns, and Griffin 1998; Stahl, 1999). In addition to oral vocabulary skills, students have to develop alphabetic principles and an awareness of print concepts in order to begin decoding and understanding text. If a child comes to school with an underdeveloped oral vocabulary, it is essential that classroom time is dedicated to helping resolve this deficiency (Foundations for Learning to Read, eduplace.com).
Although many factors can explain students’ inability to perform well on the oral Portuguese vocabulary assessment, classroom observations and data collected on students’ mother tongue indicate that many students in Grade 3 were receiving very little exposure to Portuguese. If students miss school often, where they are taught in Portuguese, and do not speak the language at home, it would be very difficult for them to develop a mastery of the Portuguese language. To assess whether students in the sample had developed a basic oral vocabulary in Portuguese, they were asked to identify body parts and everyday objects (e.g., eyes, head, pencil, stone) and to complete a number of basic instructions using common prepositions (e.g., put the pencil on the paper). Only 25 percent of the overall sample was able to answer 10 or more of the 20 oral vocabulary questions. The remaining 75 percent of students struggled considerably with the oral vocabulary exam. The average number of correct responses on the oral vocabulary test was 10 of the 20 questions with variations in student performance ranging from 0–18 questions answered correctly. Students struggled the most with questions related to prepositions, answering an average of one question correctly out of six compared to questions on objects such as pencils and paper, where the average correct response was four out of six. As with the reading fluency assessments, boys outperformed girls on the preposition portion of the oral vocabulary assessment, but just slightly. Boys answered an average of 2.1 questions correctly compared to the average of 1.7 for girls. Variation of students’ scores on the preposition portion of the assessment at the individual level was large, ranging from 0–6 questions answered correctly.
As Table V demonstrates, there was almost no difference in the results among students who reported speaking one of the three mother tongue languages. However, the small sample of students that reported speaking Portuguese and/or more than one mother tongue language scored higher than those speaking only Emakhuwa, KiMwani, or ShiMakonde. These results were consistent across schools and districts.
Table V: Average oral Portuguese comprehension by students’ reported mother tongue language
Language N Body Parts/8
Objects/6 Prepositions/6 Total Average
/20
Individual Range
Portuguese 2 6 6 6 18 17–18ShiMakonde 70 2 3 1 6 0–16Emakhuwa 392 2 4 1 7 0–18KiMwani 152 2 4 1 7 0–18Multiple MT 11 2 4 3 9 2–16Portuguese +MT 4 3 5 4 12 4–17Sample Average 631 3 4 3 10 0–18
Letter recognitionKnowing letter names often serves as a ‘marker’ for more complex skills in the ‘learn to read’ process (Foundations for Learning to Read, eduplace.com). Although knowing letters does not have a causal

171
CASE ST
UD
Y: CASE ST
UD
Y: Using O
pportunity to Learn and Early Grade Reading Fluency to M
easure School Eff ectiveness in Mozam
bique
relationship to reading, research shows that it does signal a sensitivity to oral language patterns, concepts about print, and a motivation to learn to read. A child’s recognition and knowledge of letters is a good predictor of learning to read (Chall, 1967; Anderson, et al., 1985; and Snow, Burns & Griffin, 1998).
In terms of students’ ability to recognize letters, across the sample, students in Grade 3 were able to recognize an average of 8 letters correctly in a minute with 14 percent of students able to identify 20 or more correct letters in the same period of time. Forty-three percent of the sample was unable to read a single letter. Although students were asked to read the letters in the order that they appeared on the page, students would often look for letters that they recognized, such as ‘A’, and identify those letters throughout the page. Some students would also recite the alphabet or name any letter they thought of (sometimes in a different language such as Arabic). While the behavior did not follow the directions for the assessment, it did demonstrate that a group of students understood the idea behind the identification of letters but simply lacked the skills to complete the exercise.
Concepts About Print (CAP)Adams (1990) states that, “children’s performance on tests designed to measure print awareness is found to predict future reading achievement and to be strongly correlated with other, more traditional measures of reading readiness and achievement.” On average, students in Grade 3 were able to answer 5 of 10 questions correctly when it came to knowledge of CAP. Over 70 percent of students were able to identify the cover of the book and open to the page where the story began, but struggled when asked to follow along as the enumerator read and to select a word from the text and read it aloud. These results suggest that students are developing some fundamental pre-reading skills, but when asked to perform at a higher level (such as follow along in the text or read a word) children were often unable to complete the task successfully. Results at the individual student level varied considerably, ranging from 0 to 10.
As Table VI demonstrates, there was little variation across districts on the average CAP score and variations at the student level were also similar across districts. Macomia performed the best on the CAP assessment in relation to the number of students in the sample from that district.
Table VI: Concepts About Print (CAP) by district
District N Average CAP Score
Variation in student scores (CAP)
Ibo 45 4 0–10Pemba Metuge 115 3 0–9Macomia 245 5 0–10Meluco 100 5 0–9Quissanga 86 5 1–10Mecufi 40 5 1–7Sample average 631 5 0–10
Research from studies cited in this section indicates that a strong foundation in oral vocabulary, letter recognition, and CAP facilitates and strengthens students’ ability to read. Table VII illustrates this and results were strongly correlated with performance on the reading fluency diagnostic.

172
Opp
ortu
nity
to L
earn
: A h
igh
impa
ct st
rate
gy fo
r im
prov
ing
educ
atio
nal o
utco
mes
in d
evel
opin
g co
untr
ies
Table VII: Vocabulary, letter, and CAP scores by level of reading fluency (words per minute)
0 wpm 1-10 wpm 11-40 wpm 41+ wpmN 377 219 27 8Average # vocabulary words identified correctly/20
6 7 12 12
Average # of letters identified correctly/min
3 8 56 81
Average # of correct CAP questions/10 4 5 8 7
Students who read over 40 wpm correctly were able to read an average of 81 letters correctly in one minute, respond correctly to 12 of 20 oral vocabulary questions, and answer 7 of 10 CAP correctly. In comparison, students who were unable to read any words on average were only able to read three letters correctly per minute, identify six of 20 Portuguese vocabulary words, and answer 4 of 10 questions on the CAP assessment.
Reading fluency was also positively correlated with age, SES variables, and students’ reporting reading at home and was negatively correlated with gender (p<0.01). Older male students who reported reading at home tended to score higher on all assessments. Repetition and reported working outside the home were not correlated to assessment scores.
For those students who could read at least 11 words in one minute, 74 percent were boys with an average reported age of 13 (5 years older than the expected age of a Grade 3 student). Seventy-one percent of these students were from the district of Macomia, although they were spread out across 10 different schools.4 Proportionate to the total number of students in the sample from each district, Macomia still had the greatest number of students reading 11 wpm and above. Ten percent of the total population of students from Macomia could read at this rate as compared to 5 percent from Quissanga, 3 percent from Meluco, 2 percent from Pemba Metuge and Ibo, and 0 percent from Mecufi. Forty-seven percent of students reading at this rate also reported that they read at home and 26 percent have someone who reads to them.
Mother tongue and language of instructionThe majority of the students in the sample reported speaking one or more mother tongue languages at home. In Mozambique, less than 6 percent of the population speaks Portuguese as their first language. In the study sample, only six students reported that they spoke Portuguese at home, four of whom also spoke a mother tongue language with their families. Although the sample size is too limited to draw generalizations across the population, it is interesting to look at the results of the reading assessments by language. There is a pattern similar to what was seen in the results from the oral language assessment. On average, students speaking only Emakhuwa, ShiMakonde, or KiMwani at home struggle the most to read, as demonstrated by a very low average test score for each language group. However, as was seen with the oral vocabulary results, also documented here, students that spoke more than one mother tongue language at home scored slightly higher than those speaking only one language. For example, students in the multiple mother tongue groups read on average 13 letters and eight wpm. Students speaking only one mother tongue language read seven to eight letters and only two wpm.

173
CASE ST
UD
Y: CASE ST
UD
Y: Using O
pportunity to Learn and Early Grade Reading Fluency to M
easure School Eff ectiveness in Mozam
bique
Figure II: Results on EGRA assessments by language spoken by students
As Figure II demonstrates, on average students who reported Portuguese as one of the languages used at home did considerably better on the oral vocabulary (18 of 20 correct) and letter assessments (25) and scored 10 out of 10 on the CAP assessment. However they did surprisingly poorly on the fluency assessment (5 wpm). In comparison, students speaking Portuguese plus one mother tongue language scored only slightly lower on the CAP assessment as other mother tongue-only speakers (6 out of 10) but much higher on the fluency assessment (25 wpm). In the first years of school, students are expected to both learn an entirely new language (Portuguese) and acquire all of the building blocks and basic skills essential to becoming successful learners throughout their education. These results demonstrate that students in the early grades are not developing the needed foundation reading skills in Portuguese.
Although the official language policy in Mozambique is to train teachers to teach in Portuguese and provide spot translation when necessary, Grade 1–3 classroom observations noted that Portuguese was used on average 93 percent of the time. The only area with a noticeable difference was Ibo where teachers were observed using the mother tongue language 57 percent of the time of the classroom observation. In other words, teachers in Ibo were observed giving lessons or conversing with students in the mother tongue language for over half of the class period. In 2008, there were 11,380 primary schools in Mozambique, of which 75 schools (approximately 1,100 classrooms) are in the government’s bilingual program (Patel, Chambu & Tempe, 2010). Of the districts visited by the research team only Ibo has schools that belong to the bilingual program, which may partially explain why more mother tongue instruction was observed at these schools. Only one school in the sample (which was located in Ibo) identified itself as participating in the bilingual program through having a few select bilingual classrooms. However, on the day of the school visit, the bilingual teacher was absent and the students were sent to join a Portuguese classroom even though the only materials they had were in the mother tongue.
Introducing bilingual education into schools can be a challenge, especially if the supporting resources, including trained teachers and appropriate materials, are not consistently available to

174
Opp
ortu
nity
to L
earn
: A h
igh
impa
ct st
rate
gy fo
r im
prov
ing
educ
atio
nal o
utco
mes
in d
evel
opin
g co
untr
ies
students. Even if a school does not participate actively in a bilingual program, it is still critical to have teachers who speak the same language(s) as the students in their classrooms. Data from the study show that in the overall sample only 48 percent of the Grade 3 teachers interviewed spoke the same mother tongue language as their students, but results varied considerably by district. In Ibo only 15 percent of the teachers spoke the same language as their students; however, they were observed the most often actually using mother tongue languages in the classroom to communicate with students. In Mecufi almost all teachers interviewed spoke the language of their students, but during classroom observations they rarely used the mother tongue to communicate with students.
Table VIII: Percentage of Grade 3 teachers speaking students’ mother tongue by district
District % Grade 3 teachers speaking students’ mother tongue
Ibo 15%Pemba Metuge 49%Macomia 38%Meluco 74%Quissanga 45%Mecufi 98%Total sample 48%
Time and materials for reading skillsResearch on school effectiveness in developing countries suggests that the availability of quality, relevant materials is a crucial factor in student achievement (Zhang, et al., 2008). In Mozambique, the government provides free textbooks for students every year and the children are responsible for their textbooks, which will not be replaced if they are lost. This means that for those students in the sample without a book at the time of the visit, it is very likely that they will spend the rest of the year without materials. For Grade 1 and 2 students the loss of the textbook has an even greater impact since the books served as workbooks and the majority of in-class assignments require the use of the text.
The majority of students in the sample (Grades 1–3) had language textbooks (80 percent), yet nearly one third of students did not have notebooks (32 percent) or writing utensils (27 percent). Students in Grade 3 were less likely to have language textbooks compared to Grade 1 and 2 (63 percent compared to 79 percent and 80 percent respectively).
In addition to the availability of student materials, teachers also require teaching guides and supplemental materials for their classes. In the 49 schools visited, only 39 percent of the Grade 1–3 teachers interviewed had a language arts teaching guide. In terms of supplementary materials, only 6 percent of the classrooms had any materials besides the textbooks.
Having textbooks in the classroom does not guarantee that the books are being used effectively to support student learning. Figure III compares the overall availability of language textbooks in the sample to their observed use. Although over 80 percent of the sample had a textbook, these books were used only 40 percent of the time or less when students in Grades 1–3 were in Portuguese class.

175
CASE ST
UD
Y: CASE ST
UD
Y: Using O
pportunity to Learn and Early Grade Reading Fluency to M
easure School Eff ectiveness in Mozam
bique
Figure III: Language textbook availability to textbook use in Portuguese class across Grades 1–3
Reading in the classroomIf students are going to learn to read, teachers need to provide focused time dedicated to reading activities. During interviews, Grade 1–3 teachers were asked to report how often they give their students time in class to read; only 55 percent reported that their students read independently or as a group on a daily basis, while 18 percent report that they never have students read during the school day. These self-reported data were quite different when compared to data from the classroom observations where students were observed reading independently or in a group less than 5 percent of the time (in all subjects) and only 8 percent of the observation time in Portuguese classes.
Interestingly, the ability to read or write was not the most common criterion used to determine if students would pass to the next grade. Of the 134 teachers interviewed for this study, only 9 percent indicated that students had to be able to read and/or write to pass to the next class. Forty-three percent said they based the decision on the students’ grades, 16 percent report that the parents play a role in the decision and 13 percent say their students are automatically passed to the next grade.5
In conclusion, the data clearly demonstrates that Grade 3 students within these districts of Cabo Delgado are struggling to read. Although students are beginning to grasp the foundational skills behind print and letter recognition, they still have a very difficult time reading letters in isolation or demonstrating basic print concepts. Compounding the delayed onset of reading skills is the finding that only 63 percent of Grade 3 students have language textbooks and those textbooks are used less than 40 percent of the time in classrooms. Since the majority of the students in the sample (77 percent) reported having no books at home, the classroom is where they will have the greatest opportunity to interact with text. If students’ access to print is also limited at school, then they are even more likely to struggle to develop the basic literacy skills essential for reading. Given students’ level of vocabulary and knowledge of foundational reading skills, it was not surprising to find that less than 1 percent of students in the sample were able to read 50 or more words correctly per minute, while 33 percent read only 1–5 words correctly.

176
Opp
ortu
nity
to L
earn
: A h
igh
impa
ct st
rate
gy fo
r im
prov
ing
educ
atio
nal o
utco
mes
in d
evel
opin
g co
untr
ies
Factors that influence quality and opportunity to learn in Cabo DelgadoOTL Factor 1: Percentage of days school is openBased on the research conducted in the 49 schools in Cabo Delgado, schools are effectively open 168 of 183 days a year, but instruction is only happening during approximately 30 effective days during the year. Before schools can consider improving the actual learning process, it is necessary to ensure adequate learning time is provided. In Mozambique, the official school calendar for the academic year of 2010 included 183 instructional days, with classes beginning in January and ending in October. The official start date for students to begin school in 2010 was 18 January; however, only one (out of the 49 schools in the study) began classes on this date and, on average, schools started four days later.
Data taken from teacher attendance books and triangulated with information reported by directors show that at the time of the school visits, in addition to beginning the school year late, schools had already been closed on average 6 days (3 percent of the total number of official school days) four to five months into the school year with a variance of 0–60 days reported among the school sample. Four of the schools reported that they had been closed for more than 30 days since the beginning of the school year. After factoring in the number of days schools lost at the start of the year and throughout the year, it can be estimated that schools in the sample were open on average 168 days out of the 183 planned.
The data from the school records showing consistent time loss due to school closures were reinforced by actual observations by the research team. On 19 occasions, the team arrived at the school they were scheduled to visit to find that it was actually closed that day. Directors and teachers reported that schools closed during the year for a variety of unofficial reasons, including school cleaning, holiday preparations, municipal ceremonies, visits from government officials, weather, submission of enrollment data, death in the community, and outbreak of disease in the community. Policies and regulations made at the national level also impact routines at the school level. For example, the Government of Mozambique recently changed the payment regulations making it necessary for teachers to open bank accounts and access their pay directly instead of their salaries being distributed in cash. Rural areas of Mozambique have no banks and teachers therefore have to travel long distances to the larger town of Pemba to receive their paycheck. The impact of this policy was observed first hand by the research team when, for example, in the district of Ibo, the enumerators found a number of schools closed because the teachers had chosen that week to travel to Pemba to pick up their salaries at the Bank.6
OTL Factor 2: Teacher attendance7
To ensure learning occurs teachers need to be present in the school and prepared to teach. Attendance records at the schools revealed that the average teacher attendance rate for schools in the sample was 87 percent. On average, teachers reported missing an average of 21 days (independent of school closings) throughout the school year, with a variance among schools of 5–92 days in a year. There was a significant positive correlation between students’ scores on the CAP assessment and teacher attendance rates.
Collecting teacher attendance data proved to be challenging, since not all directors ensured that attendance records were completed daily. Interviews with school directors revealed that the attendance records were often kept at home and therefore not available on the day of the school visit. There also appeared to be no oversight or consistency in recording the data; and teachers whose classrooms were not physically located in the same school area as the main buildings were often not included on the school ledger or were only asked to sign once a week or month.8

177
CASE ST
UD
Y: CASE ST
UD
Y: Using O
pportunity to Learn and Early Grade Reading Fluency to M
easure School Eff ectiveness in Mozam
bique
Teachers reported missing school for a variety of reasons ranging from official trainings or seminars, distance education, or recertification to illness, a death in the family or community, or personal travel. Teachers also reported that they had to often miss a day of school to travel to the city to receive their paycheck as a result of the new Ministry policy. Directors and community members reported that teachers sometimes extend these trips for personal business, which added to the number of days they were absent from the schools.
When teachers are absent, the director would most often either ask another teacher to cover the class, keeping the two groups in separate spaces, or dismiss the students without a teacher, adding to the time lost in the school day. During the school observations, the research team noted that students covered by another teacher were often left on their own with little attention. If in fact the teacher tried to cover both classes, time on task was drastically reduced for both groups so that all students lost most of the day. Teachers did not have lessons planned for the additional classes they were asked to cover, nor did they have teacher guides since the principle teacher kept her materials at home with her when she was absent. As a result, teachers who were asked to cover additional classes were unprepared to lead the students in any activities. On occasions when two or more teachers were absent, enumerators observed that the director would sometimes dismiss the entire school.
OTL Factor 3: Student attendance9
The average student attendance rate (according to official school records) was 78 percent, equivalent to a loss of 32 days a year. Schools reported a range of attendance rates, from a low of 39 percent to as high as 98 percent. Student attendance rates at the district level were similar, with schools in the Mecufi district having the highest attendance rates at 84 percent. Student attendance rates were positively correlated with the number of words they could read per minute, (p=.06).
Gathering student attendance data was challenging because teachers did not take attendance on a consistent basis. Only 67 percent of teachers had an attendance book on hand on the day of the visit. Teachers gave a variety of reasons to explain the lack of attendance records; most often stating they had left the book at home or that they were not keeping attendance because the government had yet to provide them with official record books. Teachers also stated that students did not all arrive at the same time and since many would enter class late in the day, it was difficult to keep track of attendance. When teachers were assigned to cover other classes, either on a short-term or long-term basis, they would often be left without an attendance book because the previous teacher would store it at home or had taken it to their new school. The government-issued attendance books that were found at schools were often those designed for secondary schools and teachers were unwilling to use them in their own classes.
During the interviews, Grade 3 students were asked whether they missed class last week; 24 percent reported missing school the previous week. These students were absent, on average, three days during the previous week. Fifty-four percent of students said they did not come to school because they were sick, 15 percent had to work in their fields, 7 percent did not want to come, 4 percent had to work at home and the rest provided reasons varying from taking care of younger siblings to that they were not sure. Only a small sample of students reported that they tended to miss school regularly throughout the year to work outside the home. A positive correlation was found between the distance students reported traveling to school and whether the child missed school the week before (p=0.02) meaning that students who had to travel longer distances were more likely to miss a greater number of days of school.
Enumerators also took attendance in the classes that they observed. When comparing the attendance taken on the day of the visit and the official number of students enrolled in the class, the attendance rate was found to be on average 45 percent. This means that on the day of the visit,

178
Opp
ortu
nity
to L
earn
: A h
igh
impa
ct st
rate
gy fo
r im
prov
ing
educ
atio
nal o
utco
mes
in d
evel
opin
g co
untr
ies
over half of the class tended to be absent. Attendance rates varied between and within schools, from only 11 percent of the enrolled students present on the day of the visit to 100 percent. Based on this finding, it is likely that the student attendance rates are much lower than school records suggest, and should be a focus of any intervention designed to improve learning outcomes.
OTL Factor 4: Percentage of the school day available for instruction10
A great deal of instructional time is lost during the school day because of a shortened school day (late start and early release) and extended recess times. In Mozambique the official school schedule includes six 45-minute periods and five break periods (four 5-minute breaks and one 15–20 minute break). Based on this schedule, there should be a total of 310 minutes (5 hours) in a school day, of which at minimum 270 minutes (4.5 hours) should be used for instructional time. Schools in the sample were observed to only use a total of 161 minutes (2.7 hours) of the 270 minutes (4.5 hours) for actual class time. Researchers noted that schools almost always started late and ended several hours earlier than scheduled leading to an average loss of time of 111 minutes (almost 2 hours). The variance among schools ranged from a minimum of zero minutes to a maximum of 206 minutes of time lost, with similar patterns observed in all six districts.
In addition to late starts and early release, schools in the sample lost an average of 40 minutes during the recess periods, with a variance among schools of between 0–104 minutes. When the time lost because of a late start, an early release, and extended recess was combined, students spent an average of 158 minutes in the classroom—or the equivalent of only two-and-a-half hours, i.e., only half their scheduled lesson time was available. As with the other indicators, there was little if any difference between the districts with Ibo having the lowest potential time for instruction at 42 percent and Pemba Metuge had the highest amount of potential learning time remaining at 59 percent.
To accurately document this situation, the research team arrived at each school at least 10 minutes before the official start time and stayed until school was dismissed. Classes often started late because not enough students had arrived and/or the teachers were not present on time. In the morning shift at many schools, if teachers arrived in the middle of the scheduled first period, they would wait to begin classes until second period officially started. Directors and teachers reported a variety of reasons for ending the school day early including students’ hunger, weather conditions, lack of light in the classrooms, and the long distances students and staff walk to get to school. In some areas at a certain time, contact with wild animals such as elephants can become an issue and teachers do not want children walking alone then. Even though schools have the autonomy to adjust the daily start and end times to fit the needs of the community, schools in the sample appeared to prefer to cut the school day as opposed to adjusting the class schedule.
OTL Factor 5: Percentage of student time-on-taskInstructional time is a multi-faceted concept (Berliner, 1990). Although the importance of sufficient instructional time and its impact on student achievement is well documented in literature (Berliner, 1990; Benavot & Amadio, 2004; Abadzi, 2009), the length, type, and focus of time for improving student learning remains unclear. Although research may not yet have determined how many hours are sufficient for improving academic achievement, it is important that schools are maximizing the time provided to support students’ learning. To begin to examine the loss of ‘effective’ instructional time in the classrooms included in the study, measures were included to evaluate how much time teachers and students spend on and off task during the time they are in class.
Overall, when Grade 1–3 teachers in the sample were observed to be on task, their students also tended to remain engaged in the classroom activity. This pattern demonstrates that student engagement in academic activities depends greatly on the level of engagement by the classroom teacher. In fact, student and teacher time off task showed a strong positive correlation.11 If we

179
CASE ST
UD
Y: CASE ST
UD
Y: Using O
pportunity to Learn and Early Grade Reading Fluency to M
easure School Eff ectiveness in Mozam
bique
consider student participation only during that time when teachers themselves were on task, the data show that in the overall sample, when teachers are actively engaged in the classroom activity, students spent 75 percent of the time on task. In comparison, when teachers were off task, students only spent 21 percent of the time engaged in academic activities. When not engaged in an academic activity, teachers in the sample spend their time engaged either in classroom administration activities (23 percent), out of the classroom (12 percent), socializing (9 percent) or disciplining students (4 percent).
Types of activitiesAcross the sample, students spent an average of 50 percent of the time on task and teachers an average of 52 percent. However, there was a considerable difference in time use between schools. Student time-on task ranged from 14 percent to 80 percent, while for teachers it varied between 0 percent and 83 percent. As shown in Table VIII, when students were engaged in an academic activity, the majority of the time was spent on seatwork (individual tasks assigned to the students) (14 percent), followed by copying (9 percent) and question/answer exercises (9 percent). Children were never observed reading silently, but on average, during classroom observations, children did read aloud 5 percent of the time.
Table VIII: Average percentage of students by type of activity in classroom observations
Type of activity Sample schoolsReading aloud 5%Silent reading 0%Demonstration/lecture 8%Question/answer 9%Practice/drill 2%Seatwork 14%Copying 9%Verbal instructions 3%Student Time off task 50%Teacher Time off task 48%
There was little variance between districts, but students were observed to be off task most often in Macomia (55 percent) and least often in Meluco (40 percent). There was also very little difference in the types of activities conducted in the classroom across districts or grades.
OTL Factor 6: Equivalent percentage of days available for instructionTo estimate the equivalent number of days available for learning, we subtract from the total days in the school year (183) the number of days school was closed, the number of days lost due to teacher and student absence, the amount of instructional time lost because of late opening/early close/recess, and the number of days lost because students were off task.
Using the graph that represents data from the total sample of the schools visited, it is possible to construct the reality of an average student. The student may show up to school every day and find that on average, the school is closed 15 days out of the year, leaving only 168 for instruction. However, on average, that student’s teacher comes to school only 147 days of the remaining 168. The student is also often absent, attending only 116 days out of the year. On the 116 days the school is open and the student and teacher are present, s/he loses a considerable amount of time in the classroom due to the fact that the school opens late, ends early or does not adhere to the recess

180
Opp
ortu
nity
to L
earn
: A h
igh
impa
ct st
rate
gy fo
r im
prov
ing
educ
atio
nal o
utco
mes
in d
evel
opin
g co
untr
ies
schedule. At this point, the student is only left with the equivalent of 61 days of full instruction. Yet, even when the student is in the classroom, there is time loss. The student waits passively as the teacher copies pages on the chalkboard; he or she spends the period chatting with a neighbor; the student did not bring a notebook so he or she cannot complete the assigned exercise. As demonstrated in Figure IV, after accounting for this loss of time within the classroom, the student’s 183 days of learning have now been reduced to the equivalent of 30 days spent on task in the classroom.
Figure IV. Total number of effective days of instruction lost by indicator
There was some variance in time lost across districts, but not much. After these five factors were accounted for, differences in the days remaining for instruction varied from 22 days (12 percent of the school year) in Quissanga to 34 days (20 percent of the school year) in Pemba Metuge. The greatest time lost across all districts was related to daily time lost (i.e., late school opening, early closure, extended recesses).
OTL Factor 11: Class sizeClass size is relevant as a factor because it acts as a proxy for the time a teacher can provide to his or her students. Class size data were taken from the director’s official record and triangulated with teacher’s attendance books when possible. The average class size across the sample was 43 with a range of 14–110 per class. These results were similar across all districts but varied slightly by grade. The average class size for Grade 1 was 46 with a range across the sample of 16–80 students. In Grade 2, the average was slightly lower—44—but had a much wider variance of 19–110 students per class. In Grade 3 the average was lower at 41 with a variance of 14–98 students per class, depending on the school. It is also important to note that on the day of the school visit, the observed class size was consistently smaller than the reported enrollment rates. During the classroom observation, enumerators noted the average observed class size was 20, with a range of 2–64 students.

181
CASE ST
UD
Y: CASE ST
UD
Y: Using O
pportunity to Learn and Early Grade Reading Fluency to M
easure School Eff ectiveness in Mozam
bique
OTL Factor 12: School supportSchool support visits are critical to school improvement process and important to provide direct instructional support to teachers. In the sample, 34 schools reported that they had been visited at least once by either someone in the Ministry of Education, the district education director, someone from AKF, or someone from another organization. Seventy percent of the schools reported they had been visited by the district education director. Twenty-three percent of schools in AKF-supported districts reported receiving a visit from someone in the organization. Eighteen percent of all schools had been visited by another organization.
Table IX summarizes what types of visits were made by the different groups to the schools. Each visit could have been related to more than one area. Few of the visits were related to parents and/or the community and the majority had something to do with school management or teaching and learning.
Table IX: Total number of schools that reported receiving visits by type of visit and percentage of visits that related to different support services
Visitor
# of schools
receiving visit
Teaching and
LearningClassroom
Mgmt EvaluationSchool Mgmt
Materials Delivery
Parents and Community
MOE 9 50% 50% 50% 60% 0% 10%District Education Director
32 77% 50% 70% 73% 41% 14%
AKF 9 14% 0% 0% 20% 0% 7%
Although 25 percent of teachers in the sample reported that the school director or the pedagogical director visits their classrooms one to three times a year and 12 percent reported being visited on a weekly basis, 17 percent of teachers reported that the feedback was generally focused on positive or negative comments rather than direct instructional support. Thirty-eight percent reported that the director commented that there was a need to improve the teaching and learning in the classroom, 28 percent received comments on improving classroom management and 9 percent were specifically told they needed to work on the students’ reading and writing skills. The others received no specific feedback. Directors indicated that 50 percent of the time, visits focused on improving teaching and learning, while 11 percent of the time, visits focused on improving classroom management. Interestingly, the feedback provided by the director was more often around classroom management (54 percent) than on ways to improve teaching and learning (27 percent).

182
Opp
ortu
nity
to L
earn
: A h
igh
impa
ct st
rate
gy fo
r im
prov
ing
educ
atio
nal o
utco
mes
in d
evel
opin
g co
untr
ies
Policy Implications and RecommendationsResearch indicates that to improve students’ learning levels, a basic opportunity to learn must exist (Bloom, 1968; Gettinger, 1984; Benavot & Amadio, 2004; Abadzi, 2007a). This opportunity to learn requires that teachers and students are present every day and that they spend most of the day engaged in learning activities. Research further indicates that too much instructional time is wasted in classrooms due to poor classroom management, disciplinary action, long transition times, and teacher and student absenteeism; educators must make more efficient use of the existing time available for instruction (Stallings, 1980; Aronsen, et al.,1998).
The main findings across the five districts of Cabo Delgado include: a) a great deal of instructional time is being lost—more than 75 percent of the total effective days of available instruction; b) little, if any, classroom reading instruction is taking place (i.e., 5 percent of in-class time is spent on any kind of reading activity); and c) students’ reading abilities were low—more than 90 percent of the sample could not read even 10 wpm.
Time spent on learning activities matters and is predictive of academic achievement if properly used for engaged academic activities (Latham, 1985; Hollowood, et al., 1994; Brophy & Good, 1986; Greenwood, 1991). Research by Stallings (1980), Aronson, et al. (1998), and Abadzi (2007a) also shows that the amount of time allocated to and used for learning is significantly reduced by non-academic activities, students’ transitions between classes or topics, poor classroom management, and disciplinary activities.
Sample schools in the districts of Ibo, Meluco, Macomia, Pemba Metuge, Quissanga, and Mecufi used on average less than a quarter of the available opportunity to learn (30 of the 183 available days for instruction). In the classroom, students spent the majority of the time doing individual assignments at their desks, discussing subjects, and copying. A limited amount of reading (5 percent of the time observed) took place in the lower primary grades and no classroom time involved students reading silently or analyzing text. Although textbooks were often available in the classroom—in limited supply in some cases—researchers witnessed limited use of these books (less than 40 percent of available time).
Decades of school improvement work have focused on helping children learn through interventions such as teacher training, the provision of materials, and improved pedagogical methods. Yet, school quality still poses a challenge for educators and policy-makers alike. The answer to improving school quality and learning at times seems elusive. Where should policy-makers and educators invest their resources? How should they prioritize interventions? The following discussion and recommendations provide insights into interventions that could improve the classroom environment and help children learn.
Ensure availability and use of print materialsIn the Cabo Delgado sample schools only 63 percent of Grade 3 students had Portuguese textbooks and the use of textbooks was fairly limited. Snow, et al. indicate that in the early grades, factors such as time, materials, and resources should support both daily independent reading of texts (selected based on student interest) and daily assisted reading and rereading of more difficult texts that advance students’ linguistic abilities. This approach to reading was rarely seen in classroom observations.
The availability and use of textbooks and other complementary reading materials has important policy implications. First, as noted by Snow, et al., textbooks should not be provided without helping teachers integrate these books into their instructional practice. Training to effectively use

183
CASE ST
UD
Y: CASE ST
UD
Y: Using O
pportunity to Learn and Early Grade Reading Fluency to M
easure School Eff ectiveness in Mozam
bique
textbooks should include pedagogically sound approaches such as activity centers that emphasize phonological awareness, silent reading of story books, and peer reading.
Second, as Snow, et al. point out, students should have storybooks that are below their frustration level (to encourage reading), and students should practice frequently. Practice reading is essential for literacy among lower primary grade students. Schools should consider providing storybooks in Portuguese (and mother tongue if possible) to encourage reading. These storybooks should be age and culturally appropriate and illustrated so students are drawn to the content and relate to the stories the books tell. Examples of texts that children could read should engage children’s imaginations and excite them about learning to read.
Except for a handful of schools, no storybooks were available in Portuguese for students to read in the classrooms visited during this study and the passages within the textbooks were far above the students’ reading levels. Reading materials in their mother tongue language were also limited to the textbook and only for those children enrolled in the bilingual stream. Since the textbooks (in Portuguese) were produced at a national level, the stories within the books often did not relate to the reality of the students who were reading the books.
International development organizations and developing country governments need to recognize the lack of children’s storybooks as a missing ingredient in promoting literacy. Learning to read will always be an uphill battle in environments devoid of interesting reading material. Projects, programs, and policy need to recognize that creating literate environments and developing a culture of reading are as important as the need to focus on better in-school reading instruction. Projects, programs, and policy also need to ensure that providing storybooks is accompanied by their use. These storybooks ideally connect children to their culture and and can open student up to new worlds and contexts. When possible, the books should be provided in both the official language of instruction and mother tongue language. For example, in Guatemala, Save the Children provided schools with Mayan storybooks. These storybooks told children stories about their Mayan ancestry in simple and easy-to-access language that the students could relate to given their own heritage. The books were also rich in pictures and drawings that visually engaged children.
Link teacher professional development to literacy acquisition strategiesLinked to the idea of promoting the proper use of books in classrooms is the prevailing approach to teacher in-service training and support. Too often teacher professional development models focus on simply providing new instructions to teachers in a general area and expecting them to transfer this knowledge into practice. This form of teacher training fails to bring about any substantial improvement in teaching practices, as noted by Villegas-Reimers. Instead, a behavior change approach is needed that identifies the specific classroom-based practices needed by teachers, and breaks down these practices into manageable increments of behavior change. This help must consist of the chance to practice in a safe environment, of clear benefits to teachers exhibiting the new behavior, of consistent evaluation and feedback, and of supportive organizational cultures within schools and communities that encourage these behaviors.
Observations in the schools indicated fairly low time on task and a consistent lack of engaging instruction in the early grades. In particular, the study found a lack of instruction tailored to the acquisition of the foundational aspects of literacy. Behavior changes for teachers should improve time on task, specifically in literacy acquisition-related activities. This could be as simple as creating time for reading: teachers reading to students, students reading to students, and students reading by themselves. More importantly, early primary teachers need to learn the fundamental elements of teaching reading (e.g., sound–letter correspondence, oral blending of sounds to read words, sight vocabulary) and need specific classroom practices that reinforce these elements. Classroom practices

184
Opp
ortu
nity
to L
earn
: A h
igh
impa
ct st
rate
gy fo
r im
prov
ing
educ
atio
nal o
utco
mes
in d
evel
opin
g co
untr
ies
must link to the use of textbooks and other reading materials to improve learning and engagement of students. These strategies also need to be consistently applied by teachers in the classroom.
The implication for policy-makers is twofold. First, classrooms must be equipped with additional materials such as easels, storybooks, and supplies for students to create reading materials (including letter and word cards). More important is the link between the provision of these new materials and teacher training and support to ensure they are used in ways that help students learn to read. In this lies a more complex set of investments with unclear financial trade-offs that should be carefully examined in each context.
Provide remedial or accelerated supportSchools also need help developing remedial strategies, given the high percentages of students found in this study that were unable to read or reading at low levels of fluency in Grade 3. Vaughn and Linan-Thompson write that students should learn to read by the end of their first year in school but almost all of the students in this study were not reaching that goal. Unless specific strategies are deployed to ensure those students learn to read, they will simply fall further behind. Introducing interventions such as accelerated learning programs, after-school tutoring, and special classes for students who are behind are strategies that need to be deployed more systematically in schools similar to those in this study. If schools do not make an effort to help students catch up, it is more likely that children will drop out before they finish Grade 5. Furthermore, if students are not leaving schools with an increased skill set, parents are going to be reluctant to send children back for another year or to enroll their siblings.
Use formative and summative assessmentsLinked to the idea of providing remedial support to students who are behind is the ability to assess students’ literacy levels and identify those who are acquiring the building blocks for competent literacy and those who are not. The USAID-funded Ed Data II project continues to improve the Early Grade Reading Assessment employed in this study, demonstrating its utility in a variety of settings and languages. Such tools need to be used more systematically, not only to gauge whether learning is occurring, but also to allow teachers to spot check their students’ progress. Diagnostic instruments such as EGRA, continuous assessments that assess students knowledge against smaller benchmarks (i.e., completion of a mathematics unit), and monthly formative assessments can help teachers deploy instructional interventions that respond to their students’ needs, including identifying students who need significant remedial support.
The OTL index includes reading fluency as an indicator of school effectiveness. This index provides a tool that can be used to contextualize the information about learning outcomes provided by EGRA. The OTL index provides educators, program managers, and policy-makers with useful, time-relevant data about variations among schools across the 12 factors. This set of school effectiveness data can direct more targeted support to where it is needed. For example, one school may have high time-on-task percentages, but high teacher absentee rates. This knowledge could help a community or education official focus on the specific issue at the school, in this case determining why teachers are consistently absent. The OTL index would allow individualized support to schools by allowing supervisors to collect school-relevant data.
Increase school support servicesEQUIP2 complementary education research (DeStefano, et al., 2007) found that school support services (i.e., visits to the schools by supervisors, Ministry officials, or NGO support personnel) were critical to the effectiveness and cost-effectiveness of complementary models.12 However, the data on school support services in Cabo Delgado suggest that the investments in school support are

185
CASE ST
UD
Y: CASE ST
UD
Y: Using O
pportunity to Learn and Early Grade Reading Fluency to M
easure School Eff ectiveness in Mozam
bique
translating appreciably into neither improved opportunities to learn nor better learning outcomes for students. Although the schools receive some, albeit uneven, support from both Ministry support personnel and NGOs, the type of support tends to be focused on classroom management or school management rather than on direct instructional support (i.e., providing direct instruction to teachers on how to teach lessons they are struggling to deliver). If schools that receive ongoing support are unable to implement the changes that lead to better use of time, then how can one expect schools to meet these challenges on their own? Support resources need to be devoted to instruction, in particular to ensuring teachers know how to teach lessons in mathematics and reading. Unless there is a greater focus on instructional alongside administrative support, visits to schools by officials will continue to have limited impact on the actual OTL and learning outcomes obtained in schools.
ConclusionsAlthough national and international organizations and governments that work in education may strive toward the same outcome of improving student learning, different inputs may be required to reach this goal. In this study, based on observations and data collected, AKF (Moz) observed that a key area for improving student learning is to first guarantee that children are provided the basic opportunities to learn and they are learning to read. Ensuring that schools are open and teachers and students are present will support the impact of classroom and support interventions by ensuring that there is more time available for instruction, but this is not enough. There needs to be an increased focus on building foundational skills in reading. Teaching students to unlock the meaning of text is the single most powerful skill teachers can foster (Lemov, 2010). To help early grade students improve their reading, teachers need to have a clear reading curriculum and be trained on how to teach reading. They need to spend increased classroom time teaching skills such as decoding, fluency, vocabulary, and comprehension, and students need quality time reading with interesting and engaging print materials. Mother tongue instruction can be a critical factor for children in the first years of school to help build their understanding, interest, and confidence for learning.
Although there are trade-offs and political challenges to each of the implications discussed above, it is important that educators begin to look at concrete ways to ensure that students learn to read. The OTL index can serve as a useful tool to gauge students’ progress. As an evaluative tool, the index allows ministries of education to see school variation at the region, district, or national levels and target appropriate interventions according to need. For example, schools in one region may consistently start late, causing a loss of instructional time that simply requires better supervision to ensure on-time starts. Another region may face extreme losses due to off-task teachers and students. Understanding these nuanced differences can help target interventions. At the school level, principals and community members can compare their school to a national average, yet understand the variations in their community and region and gauge their progress against other schools. Finally, the OTL index can serve as a tool for communities to improve the accountability, governance, and management of schools.
Communication and DisseminationThe dissemination of findings from the present study has occurred throughout most of 2011 from the school/community level up through district, provincial, and national levels involving key stakeholders from the government, civil society, and teachers and local parents. Results from the study have also been shared internationally through conference presentations at CIES, UKFIET, SID, and at various universities that are partners under the EQUIP2 program. From both AKF and EQUIP2/FHI 360’s perspective, this purposeful and layered dissemination process is needed to encourage debate, problem solving, and joint ownership with all relevant actors regarding next steps and address the different factors that affect opportunities for learning that are so clearly outlined in

186
Opp
ortu
nity
to L
earn
: A h
igh
impa
ct st
rate
gy fo
r im
prov
ing
educ
atio
nal o
utco
mes
in d
evel
opin
g co
untr
ies
this report. At national level, there are good indications that the findings have begun to inform the current planning related to the Ministry of Education’s next five year strategic plan for education. The district and local school/community level, however, is where AKF (Moz)’s education team has focused most diligently.
At the school/community level, local school councils, parents, school directors and teachers, and students have been brought together to reflect on the findings and think together what solutions and strategies might work in their locale. During these gatherings, several school council members articulated a desire to tackle the issues related to teacher and student absenteeism themselves. The discussions also highlighted that many school council members are not necessarily fully aware of their rights and responsibilities to oversee student, teacher, and school director attendance. As a result, AKF has begun to disseminate the official guidelines and regulations for school councils and changes are now being observed. For example, one school council now requires the school director and teachers to request permission for any anticipated absence.
At the school cluster level (called ZIPs), the ZIP coordinators along with district and education officials requested AKF (Moz) to work with them on clarifying the roles and responsibilities of different stakeholders and strengthening their capacity to do so. Their hope is to improve district and regional level monitoring systems functioning and encourage their effective support of local schools needs. A fundamental aim of this process has been to ensure broader understanding of the different factors at play undermining learning and then create strong buy-in (ownership) of different stakeholders for moving forward.
The findings have also shaped and refined AKF (Moz)’s planning regarding what needs to happen inside classrooms and within the broader school and community environments so that the quality of learning improves. In terms of availability of reading materials, the team already had begun to collect local traditional stories over the last few years with the aim of adapting these for beginning readers and for use with others, including the community preschools as well as for those participating in/or completing adult literacy classes to read with their children. They plan to make these available in multiple mother tongue languages and also distribute them to the ECAs—the community learning spaces that are managed by local communities and are based outside the formal school setting. The ECAs are also under review to improve their functioning and use—including for learners enrolled in double shift schools—as a way to creatively provide more opportunities for learning.
In addition, and related to the need to strengthen teachers understanding and capacities, AKF(Moz) will be working jointly with district education officials and local ZIP coordinators to reinforce support to teachers in the early grades so that the foundational skills are indeed in place by end of Grade 5. Particular focus will be given to fostering early language, literacy and numeracy skills through better use of effective teaching and learning approaches, textbooks and other materials; introducing doable continuous assessment in the classroom; as well as, encouraging peer-to-peer interactions and support within schools and clusters. In sum, the study’s results reinforce clearly AKFs and others’ experiences that to ensure regular, relevant and sustainable opportunities to learn—especially in very poor and underserved areas such as Cabo Delgado—it is critical to tackle the various factors identified in this study. Tackling only student/teacher attendance, making relevant materials available, or ensuring teachers are confident and know how to teach foundational literacy and numeracy is not sufficient.
Internationally, the findings from this and the four additional EQUIP2case studies have influenced country projects in Guatemala, Nepal, Ethiopia, Honduras, and Peru. The World Bank and DFID have adapted various aspects of the study to collect additional data in both Latin America and Africa, with the World Bank training more than 650 teachers, supervisors, and MOE officials across six countries in the LAC region in how to conduct classroom observations to better understand time

187
CASE ST
UD
Y: CASE ST
UD
Y: Using O
pportunity to Learn and Early Grade Reading Fluency to M
easure School Eff ectiveness in Mozam
bique
use and the quality of teaching in classrooms. As international, national, and local dissemination continues, it will be critical to continue learning and ensuring the impact of the interventions intended to improve time use and teaching and share the results broadly.

188
Opp
ortu
nity
to L
earn
: A h
igh
impa
ct st
rate
gy fo
r im
prov
ing
educ
atio
nal o
utco
mes
in d
evel
opin
g co
untr
ies
Notes1 In 2009, only 7.6% of students (up from 6% in 2008) finished the lower cycle of primary education at the appropriate age.
2 The reading assessment tools for this study were adapted from the EGRA instruments developed by RTI under the USAID-funded ED DATA II project. The Concepts about Print tool was adapted from a similar instrument developed by Mary Clay and used by Save the Children.
3 The authors note the research on Romance-based languages because 60 wpm has become the standard internationally for reading fluency. However, there is no clear research around other non-Romance-type languages such as Arabic that indicates appropriate benchmarks for reading fluency at Grade 3.
4 Proportionate to the total number of students in the sample from each district, Macomia still had the greatest number of students reading 11 wpm and above. Ten percent of the total population of students from Macomia could read at this rate as compared to 5 percent from Quissanga, 3 percent from Meluco, 2 percent from Pemba Metuge and Ibo, and 0 percent from Mecufi.
5 Primary education in Mozambique is divided into three cycles: Cycle 1 includes grades 1 and 2; Cycle 2 includes grades 3 to 5; and Cycle 3 includes grades 6 and 7. Automatic promotion exists within cycles, but students must pass an assessment to move to the next cycle.
6 This new policy had just been implemented when the data collection began so schools had yet to develop a way to get teachers paid and keep the schools open. The visit to Ibo also occurred after Easter break and teachers may have taken advantage of the holiday to extend their stay to open bank accounts.
7 Teacher absenteeism rates were calculated based on data recorded in staff attendance books and triangulated with data provided by teachers in interviews. In schools where the director also taught a class, his/her attendance is included in the overall teacher attendance rate.
8 Many of the schools visited had a main campus and an annex school that is formally linked to it. Annex schools were introduced mostly in remote villages with the goal of encouraging younger children to enroll in school earlier. They are generally located closer to the main village and most often include only the early grades.
9 Attendance rates were calculated based on the number of days that teachers took attendance and the number of students in the class list. The calculation is: total number of student absences recorded to date(total number of students x total number of days attendance taken).
10 Actual instructional time was calculated based on the school observation records generated by the research team during the field visits. The team calculated the actual instructional time as the difference between the official duration of the school day in Mozambique (five hours and ten minutes) and the total time lost when students were not engaged in instructional activities inside their classrooms. This lost time is made up of official and unofficial breaks, extended recess, time lost to a late start to the school day or an early dismissal. Although breaks and recess are a necessary part of the school day, this is time when students are not engaged in learning activities in the classroom.
11 The correlation was (p<0.000)
12 Complementary education approaches are defined as models that work to support the formal public system, offering students an alternative route to achieving the same educational outcomes as students in the government schools. The programs are designed to feed students into the

189
CASE ST
UD
Y: CASE ST
UD
Y: Using O
pportunity to Learn and Early Grade Reading Fluency to M
easure School Eff ectiveness in Mozam
bique
government system at various entry points and are large enough to exhibit many of the same characteristics as mainstream schools. However, by using similar (though often reduced) curriculum as the government schools, providing instruction in the student’s mother tongue language; and ensuring that the teacher and learning materials are present in the classroom, the models more effectively keep children in school and help them learn.

190
Opp
ortu
nity
to L
earn
: A h
igh
impa
ct st
rate
gy fo
r im
prov
ing
educ
atio
nal o
utco
mes
in d
evel
opin
g co
untr
ies
ReferencesAbadzi, Helen. 2007a. Absenteeism and Beyond: Instructional Time Loss and Consequences. (Policy Research Working Paper No. 4376). Washington, DC: World Bank.
Abadzi, Helen. 2007b. “Instructional Time Loss and Local-Level Governance.” Prospects. 37 (1): 13–16.
Abadzi, Helen. 2009. “Instructional Time Loss in Developing Countries: Concepts, Measurement, and Implications.” World Bank Research Observer. 24 (2): 267-290.
Adams, M. J. (1990). Beginning to Read: Thinking and Learning about Print. Cambridge, MA: The MIT Press.
Anderson, Stephen R. 1985. “Inflectional morphology.” Shopen. 1985d: 150–201
Annie E. Casey Foundation. 2010. Viewed at http://www.aecf.org/
Aronson, Julia, Joy Zimmerman, and Lisa Carlos. 1998. Improving Student Achievement by Extending School: Is It Just a Matter of Time? Presented at the PACE Media/ Education Writers Seminar in San Francisco on 20 April 1998.
Benavot, Aaron, and Massimo Amadio. 2005. “A Global Study of Intended Instructional Time and Official School Curricula, 1980–2000.” In Education for All Global Monitoring Report 2005, The Quality Imperative. Geneva: UNESCO International Bureau of Education.
Berliner, David. 1990. “What’s All the Fuss About Instructional Time?” In The Nature of Time in Schools. Theoretical Concepts, Practitioner Perceptions, edited by M. Ben-Peretz and R. Bromme. New York: Teachers College Press.
Blachowicz, C., and Fisher, P. (1996). Teaching vocabulary in all classrooms. Englewood Cliffs, NJ: Prentice-Hall.
Bloom, Benjamin. 1968. “Learning for Mastery.” UCLA Evaluation Comment 1 (2): 1–8.
Brophy, Jere, and Thomas Good. 1986. “Teacher Behavior and Student Achievement.” In The Handbook of Research on Teaching (3rd ed.), edited by M. C. Wittrock. New York: Macmillan.
Chall, Jeanne S. 1967. Learning to read: The great debate. New York: McGraw-Hill.
Clay, Mary. 2000. Concepts about Print: What Have Children Learned about the Way We Print Language? Portsmouth, NH: Heinemann.
DeStefano, Joseph, Audrey-marie Schuh Moore, David Balwanz, and Ash Hartwell. 2007. Reaching the Underserved: Complementary Models of Effective Schooling. Washington DC: EQUIP2, FHI 360, and USAID.
EQUIP2. 2008. Framework for School Effectiveness Research. Washington, DC: EQUIP2, FHI 360, and USAID.
Fisher, Douglas. 2009. “The Use of Instructional Time in the Typical High School Classroom.” The Education Forum. 73 (2): 168-176.
Foundations for Learning to Read. 2011. Viewed at www.eduplace.com

191
CASE ST
UD
Y: CASE ST
UD
Y: Using O
pportunity to Learn and Early Grade Reading Fluency to M
easure School Eff ectiveness in Mozam
bique
Gettinger, Maribeth. 1984. “Individual Differences in Time Needed for Learning: A Review of the Literature.” Education Psychologist. 19 (1): 15–19.
Gillies, John, and Jessica Jester-Quijada. 2008. Opportunity to Learn: A high impact strategy for improving educational outcomes in developing countries. Washington DC: EQUIP2, FHI 360, and USAID.
Greenwood, Charles. 1991. “Longitudinal Analysis of Time, Engagement, and Academic Achievement in At-risk and Non-risk Students.” Exceptional Children. 57 (6): 521-535.
Hollowood, Tia, Christine Salisbury, Beverly Rainforth, and Mary Palombaro. 1995. “Use of Instructional Time in Classrooms Serving Students With and Without Severe Disabilities.” Exceptional Children. 61 (3): 242-253.Holsinger, Donald B. 1982. “Time, Content and Expectations as Predictors of School Achievement in the US and other Developing Countries: A Review of IEA Evidence.” Presented at a Meeting of the National Commission on Excellence in Education, in New York on 28 September 1982.
Hossler, Carol-Anne, Frances Stage, and Karen Gallagher. 1988. “The Relationship of Increased Instructional Time to Student Achievement.” Policy Bulletin. No. 1. Bloomington, IN: Consortium on Educational Policy Studies.
Human Development Report (HDR). 2009. Overcoming Barriers: Human Mobility and Development. New York: United Nations Development Programme.
INE. 2010. Viewed at www.ine.gov.mz
Jukes, Matthew, Shaher Banu Vagh, and Young-Suk Kim. 2006. Developing Measures of Reading Ability and Classroom Behaviour for Use in Multi-country Evaluations. Washington, DC: World Bank.
Lemov, Douglas (2010). Teach like a champion. Jossey-Bass.
Lowe, Robert, and Robert Gervais. 1988. “Increasing Instructional Time in Today’s Classroom.” NASSP Bulletin. 72 (19): 19-22.
Millenium Development Goals Report (MDG). 2010. United Nations: New York.
Moore, Mary, and Janie Funkhouser. 1990. More Time to Learn: Extended Time Strategies for Chapter 1 Students. Washington, DC: Decision Resources Corp.
Mozambique Ministry of Science and Technology (MST). 2007. Viewed at http://www.mct.gov.mz
Nelson, Steve. 1990. Instructional Time as a Factor in Increasing Student Achievement. Washington, DC: Office of Educational Research and Improvement.
Patel, Chambo, and Tempe. (2010). Bilingual Education in Mozambique: Nowadays Situation. Maputo, Mozambique: Eduardo Mondlane University.
Quartarola, Bob. 1984. A Research Paper on Time on Task and the Extended School DaylYear and Their Relationship to Improving Student Achievement. Burlingame, CA: Association of California School Administrators.
Republic of Mozambique. 2010. Report on the Millennium Development Goals.
Snow, Catherine, Susan Burns, and Peg Griffin. 1998. Preventing Reading Difficulties in Young Children.

192
Opp
ortu
nity
to L
earn
: A h
igh
impa
ct st
rate
gy fo
r im
prov
ing
educ
atio
nal o
utco
mes
in d
evel
opin
g co
untr
ies
Scheerens, Japp. 2000. Improving School Effectiveness. Paris: UNESCO International Institute for Education Planning.Stahl, Steven A. 1999. Vocabulary Development. Brookline Books.
Stallings, Jane, and David Kaskowitz. 1974. Follow Through Classroom Observation Evaluation. Washington, DC: Office of Education.
Stallings, Jane. 1978. The Development of the Contextual Observation System. Presented at the Annual Meeting of the American Educational Research Association in Ontario on 27–31 March 1978.
Stallings, Jane. 1980. “Allocated Academic Learning Time Revisited, or Beyond Time on Task.” Educational Researcher. 9 (11): 11–16.
Stallings, Jane, and H. Jerome Freiberg. 1991. “Observation for the Improvement of Teaching.” In Effective Teaching: Current Research, edited by H. Waxman and H. Walberg. Berkeley, CA: McCutchan Publishing Corporation.
UNESCO Institute for Statistics (UIS). 2010. Viewed at http://www.uis.unesco.org/Pages/default.aspx
Vaughn, Sharon, and Sylvia Linan-Thompson. 2004. Research-Based Methods of Reading Instruction: Grade K–3. Association for Supervision and Curriculum Development: Alexandria, VA.
Villegas-Reimers, Eleonora. 2003. Teacher Professional Development: an International Review of the Literature. UNESCO: International Institute for Educational Planning.
Zhang, Yanhong, Neville Postlehwaite, and Aletta Grisay, eds. 2008. A View Inside Primary Schools. Montreal: UNESCO.

193
CASE ST
UD
Y: CASE ST
UD
Y: Using O
pportunity to Learn and Early Grade Reading Fluency to M
easure School Eff ectiveness in Mozam
bique


195
CASE ST
UD
Y: CASE ST
UD
Y: Using O
pportunity to Learn and Early Grade Reading Fluency to M
easure School Eff ectiveness in Nepal
Using Opportunity to Learn and Early Grade Reading Fluency to Measure School Effectiveness in NepalExecutive SummaryIn 2008, the Educational Quality Improvement Program 2 (EQUIP2), in partnership with Save the Children, conducted a study of school effectiveness in Nepal. Data were collected from 23 Save the Children-supported schools in the districts of Kailali and Kanchanpur. The study aimed to determine whether schools provide adequate opportunities to learn and whether teachers and students use those opportunities to ensure that children learn to read fluently in the language of instruction (Nepali) by Grade 3.
The study found that few children at the start of Grade 3 had learned to read fluently enough to ensure comprehension. Forty-four percent of the students could not read a single word of Grade 3 text. Only 38 percent of students could read at a rate of 40 words per minute (wpm) or faster, a rate that may ensure comprehension. Although most students read below a desirable level for Grade 3, almost all students had adequate pre-literacy skills: they recognized letters and could orient themselves in relation to text. Differences in reading fluency were most pronounced between native and non-native Nepali speakers. Fifty-two percent of non-native Nepali speakers were unable to read compared to only 36 percent of native Nepali speakers. Girls speaking Tharu at home tended to score lower in areas of letter knowledge, reading fluency, and comprehension than the rest of the sample. We also found that the percentage of Grade 3 children who could not read at all varied considerably from 4 percent of students at one school to 81 percent of students at another school.
The data collected on opportunities to learn reveal that the low student reading performance was, in part, attributable to the amount of unused potential instructional time. School being closed, teacher absence, and time lost during the school day combined to reduce the amount of time available for instruction by as much as 26 percent, an equivalent of 49 out of 192 days in the school year.
The actual time available for instruction—when school was open and teachers and students were present—was further reduced by the manner in which teachers and students used their time in class. Observations of student and teacher activity in Grade 1, 2, and 3 classrooms revealed that, on average, 40 percent of students were off task and not engaged in learning during a lesson. Students were most frequently off task when the teacher was off task and not actively leading a lesson or assigning activities to the students. When these measures of time-on-task were taken into account, we found that schools lost the equivalent of an additional 58 days of potential instruction time because of off-task teachers and students.
Closer examination of the data on classroom activity determined the amount of time students spent on reading-related activities. We observed little instruction in reading, little student use of books or other written materials, and almost no students reading. Students were observed participating in these reading activities during only 8 percent of the classroom observations.
This research demonstrates that: a) teacher and student attendance need to be more closely monitored and the factors that impact them addressed; b) the daily school schedule needs to be better managed to ensure adequate time for reading instruction in the early grades; and c) teachers need to learn instructional strategies to engage students in reading or reading-related exercises. Furthermore, given the low levels of reading fluency, schools need strategies for building the reading skills of students

196
Opp
ortu
nity
to L
earn
: A h
igh
impa
ct st
rate
gy fo
r im
prov
ing
educ
atio
nal o
utco
mes
in d
evel
opin
g co
untr
ies
throughout the primary grades, as few, if any, are learning to read well enough to learn across all subject areas.
IntroductionSave the Children USA has supported schools and communities in the Kailali and Kanchanpur districts of Nepal for the last 25 years. Their current program serves more than 70,000 students in these districts. In 2008, the Education Quality Improvement Program 2 (EQUIP2) teamed with Save the Children to investigate the effectiveness of the schools receiving Save the Children support. School effectiveness was treated two ways in this study. First, since literacy is perhaps the most critical outcome of primary education, the study assessed whether students were learning to read by Grade 3. Second, the study gathered and analyzed data to determine whether schools consistently provided opportunities for students to learn, and in particular, to learn to read. The findings presented in this report are a first step in helping Save the Children, and others, identify ways to improve school support efforts in Nepal and elsewhere.
Background and FrameworkProgress toward providing education for all requires countries to identify and employ models of effective schooling that can reach rural, poor children. Beginning in 2003, the Education Quality Improvement Program 2 (EQUIP2) examined whether complementary, community-based schools were such a model. Through a series of ten case studies titled Meeting EFA: Reaching the Underserved through Complementary Models of Education, EQUIP2 developed a methodology for assessing complementary programs’ cost-effectiveness in terms of providing access, ensuring completion, and promoting learning.
Based on this research, EQUIP2 found that some programs supporting complementary models are more cost-effective than their public school counterparts in part because they offer a more consistent opportunity to learn. Complementary program schools were found to share a number of characteristics: schools located near students, school schedules adjusted to fit the local lifestyle, more regular student attendance, more regular teacher attendance, and scaled-back curriculum focused on core skills.
To build on these findings, EQUIP2 examined opportunity to learn as a framework for understanding how schools can improve teaching and learning. In Opportunity to Learn: A high impact strategy for improving educational outcomes in developing countries, EQUIP2 identified and justified 12 factors of a foundational opportunity to learn:
1. Percentage of days school is open; 2. Teacher attendance;3. Student attendance;4. Percentage of the school day available for instruction;5. Percentage of student time-on-task;6. Equivalent percentage of days available for instruction;7. Percentage of students with a textbook;8. Percentage of observed textbook use;9. Percentage of time spent reading;10. Grade 3 reading ability;11. Class size; and12. School support.
To understand how these factors interact to promote learning, better tools for evaluating student literacy skill development are needed. One drawback of the EQUIP2 complementary education research was the scarcity of data on student learning outcomes. The use of proxies such as end-

197
CASE ST
UD
Y: CASE ST
UD
Y: Using O
pportunity to Learn and Early Grade Reading Fluency to M
easure School Eff ectiveness in Nepal
of-cycle exams is not ideal because, as Thomas Kellaghan (2004) noted, such exams discriminate between high achieving students rather than reflect the range of all students’ performance. USAID investment in early grade reading assessment (EGRA) methodologies offered EQUIP2 a chance to expand its research on school effectiveness.
EGRA provides a methodology for quickly assessing a variety of early literacy skills, which can be used to gauge school and/or system effectiveness at fostering acquisition of those skills. The EdData II project in particular has been instrumental in promoting and improving EGRA and has supported its application in almost 20 countries. However, one of EGRA’s limitations is the floor effect: It does not measure the skills of students unable to read letters, words, or connected text. To remedy this, the Concepts about Print (CAP) methodology was used to evaluate pre-reading skills in students who are non-readers.
The combination of the opportunity to learn framework, EGRA, and CAP is the inspiration behind EQUIP2’s research on effective schools. This research is based on the idea that school effectiveness, as measured by whether the school enables children to learn to read, is a function of how well the school ensures an opportunity to learn and whether it draws on teaching approaches that make the best use of instructional time. With this in mind, the study attempts to answer the following research questions:
• How well do schools provide opportunity to learn?• How does actual opportunity to learn compare to potential opportunity to learn?• How does opportunity to learn vary across schools?
Save the Children afforded EQUIP2 access to schools in Kailali and Kanchanpur where the organization operates and lent the services of a Research Fellow. This paper presents the results of the collaboration between Save the Children and EQUIP2 in Nepal.
ContextNepal has rich cultural, ethnic, and linguistic diversity, but struggles against high rates of poverty, ethnic discrimination, and an often unstable political atmosphere. Nepal’s economic and social development has lagged far behind that of other South Asian countries and remains one of the poorest nations in the world. According to UNICEF, as of 2007, 55 percent of Nepal’s population lived below the international poverty line, earning less than USD1.25 per day. Although the incidence of poverty has declined slightly over time, income inequality has continued to rise. A key factor behind this growth in inequality has been the head of household’s education level as women and ethnic minorities are often excluded from the education system or provided with the poorer services (ADB, 2009).
While Nepali is the country’s national language, it is spoken by only 41 percent of the population. The majority of Nepalese speak over 100 other languages spoken by different ethnic groups. While many children do not learn Nepali at home, they find themselves in a school system that expects them to learn in the national language.
Save the Children works in partnership with local NGOs in over 40 districts to implement early childhood development, primary education, school health and nutrition, and adolescent development programs. The primary education program in Kailali works with the Nepali NGO Backward Society Education (BASE) and the program in Kanchanpur works with the Nepali NGO the Nepal National Social Welfare Association (NNSWA). These programs include several components that create more positive learning environments for children, improve school effectiveness, and strengthen community involvement. Table 1 summarizes basic information about

198
Opp
ortu
nity
to L
earn
: A h
igh
impa
ct st
rate
gy fo
r im
prov
ing
educ
atio
nal o
utco
mes
in d
evel
opin
g co
untr
ies
the Save the Children programs. More than half of the schools have received support from Save the Children for five years or more, including all of the schools in the Kanchanpur district.
Table 1. Basic information about schools in the target area
Kailali District
Kanchanpur District Total
Total Number of Schools 140 115 255 Total Enrollment 39,062 31,421 70,483
% girls 47% 51% 49%
Number of Schools Receiving Support for at Least 5 Years 21 115
Number of Schools Receiving Support for 3 to 4 Years 119 0
In both districts, Save the Children programming supports teachers, students, and school administrators. As part of the Child Friendly Schools Initiative, Save the Children works with schools to establish reading corners, provides active learning and child-centered instruction training and workshops, and conducts classroom visits. Save the Children also provides learning materials to schools. Through the School Management Committee Strengthening Program, Save the Children provides management committees with training and support to conduct school self-assessments and to develop school improvement plans. Save the Children also works with local governments and parents to ensure that all children under five years receive immunization, de-worming, and vitamin A supplements provided by the Government of Nepal.
Sampling and MethodologySamplingFrom the universe of 255 Save the Children schools, the five schools that had been exposed to the selected reading passage during piloting were eliminated. The remaining 250 schools were stratified based on district location, distance from a town center, and participation in each of the Save the Children education programs.
Table 2. Characteristics of sample schools
SC Kailali District
Control Kailali District
SC Kanchanpur
District
Control Kanchanpur
District TotalTotal Number of Schools 10 4 6 3 23
Receiving SC support:
16for more than 7 years 3 - 3 -
for 5 to 7 years 3 - 2 -for 3 to 4 years 4 - 1 -for 0 to 2 yearsa 3 1
Total Enrollment 5,394 2,469 3,074 461 11,398Grade 3 Enrollment 502 318 423 79 1,322
Average Grade 3 Class Size 43 59 50 20 44a. Three of the control schools were participating in Save the Children’s School Health and Nutrition program. Given that this was the only aspect of the program in which they were participating, they were still considered control schools within this sample.

199
CASE ST
UD
Y: CASE ST
UD
Y: Using O
pportunity to Learn and Early Grade Reading Fluency to M
easure School Eff ectiveness in Nepal
Save the Children was implementing eight programs in the districts of Kailali and Kanchanpur and schools were categorized by the number of programs in which they participated and by the number of years of participation. A sample of 20 Save the Children-supported schools was then randomly selected to mirror the characteristics of the universe. However, due to weather conditions, unofficial school closings, and other complications, researchers were unable to visit 4 of the schools, resulting in a final sample of 16 Save the Children-supported schools. In addition to these 16 schools, 7 other schools located in the same districts were chosen as a control group. The control schools were similar to Save the Children schools in terms of size, distance from town, and students’ socio-economic background, but they were not receiving support from Save the Children primary education programs at the time of the study. Also, 55 percent of students in control schools reported speaking Nepali at home compared to only 45 percent of students at Save the Children schools. The characteristics of the final sample of 23 schools are summarized in Table 2 and in Annex A.
MethodologyThe research team spent one day visiting each school. A visit consisted of six activities:
• A general observation noting the presence of certain school facilities and whether teachers and students were inside or outside the classroom;
• A one hour observation in Grade 1, 2, and 3 classrooms using the Stallings Observation Instrument;
• An interview with the principal to obtain information on student enrollment, teachers, teacher and student attendance, support visits received by the school, and community participation at the school level;
• Interviews with each of the teachers observed;• Interviews with individual students; and• Two reading assessments measuring print awareness and basic literacy skills.
For the student interviews and reading tests, the team randomly selected 20 students from Grade 3 at each school in a boy-to-girl ratio reflective of the gender balance in the full class. The students were first asked a number of questions pertaining to their home environment and attendance at school. The literacy tests included CAP questions to assess pre-reading skills and student familiarity with printed text and books and EGRA components to assess the number of letters recognized in isolation, the number of words read correctly in isolation, and the number of words read correctly in context per minute. The number of words read correctly per minute was used as the measure of reading fluency, a recognized and robust index of reading comprehension that reliably differentiates between strong and poor readers as demonstrated in Matthew Jukes’ 2006 study, Development of Assessments of Reading Ability and Classroom Behavior.
The letter recognition, reading fluency, and reading comprehension assessments were developed by a Save the Children Alliance team as part of the four country study of Rewrite the Future (Naylor et al., 2008).
Save the Children staff pilot tested additional text for this sample by choosing grade-appropriate passages from past editions of government issued textbooks. Passages were altered slightly to prevent the possibility of children who had seen them previously reading from memory. Those students who were able to read at least 40 words in the first minute were asked to finish the passage and answer four reading comprehension questions.
Table 3 provides a summary of student characteristics. Clearly, students were split between two linguistic groups: those who reported speaking Nepali as their mother tongue (47 percent) and those who did not (53 percent). Of those who reported not speaking Nepali at home, the vast majority spoke Tharu. Schools varied in the percentage of Grade 3 students who reported speaking Nepali

200
Opp
ortu
nity
to L
earn
: A h
igh
impa
ct st
rate
gy fo
r im
prov
ing
educ
atio
nal o
utco
mes
in d
evel
opin
g co
untr
ies
at home. In 30 percent of the schools, between 75 and 100 percent of students reported speaking Nepali, while in another 30 percent of the schools, less than 25 percent of students reported speaking Nepali. The two districts also differed significantly in terms of language: 58 percent of students in Kanchanpur reported speaking Nepali, while in Kailali, 51 percent reported speaking Tharu and only 41 percent spoke Nepali.
Table 3. Characteristics of students in the sample
Number of Grade 3 students tested 480Boys 54%Girls 48%
Language spoken as mother tongue:Nepali 47%Tharu 41%
Rana Tharu 8%Doteli 2%Other 2%
Average age (years) 10% overage (older than 10 years) 30%
% who attended kindergarten 66%% who did not repeat Grade 3 94%
% who live 10 min. or less from school 48%% who walk 10 to 30 min. to school 38%
% who walk more than 30 min. to school 15%
Average family size 7% of students who earn money for work 0%
% who have in their home: - a radio 66%
- an inside toilet 22%- electricity 68%
- a television 25%- a refrigerator 0%
The majority of students in the sample (94 percent) were in their first year in Grade 3 and 66 percent reported having attended kindergarten. Almost all children in the sample (86 percent) reported living within a 30 minute walk to school. Two-thirds of students said they had electricity, but only 25 percent reported having a television and 22 percent said their house had an inside toilet.
Limitations of the StudyWhile the data from this study are robust and representative of education in the Kanchanpur and Kailali districts, there are important limitations to the methodology and data. While 480 students were tested, the school sample size was limited due, in part, to the day-long school visits. The small sample of schools made the identification of relationships between variables at the school level more challenging, limiting the conclusions drawn from the study about schools in Nepal as a whole.

201
CASE ST
UD
Y: CASE ST
UD
Y: Using O
pportunity to Learn and Early Grade Reading Fluency to M
easure School Eff ectiveness in Nepal
Furthermore, students’ performance on the reading assessments may have been negatively affected by their unfamiliarity with the EGRA methodology. Only 47 percent of the students identified Nepali as their mother tongue, limiting their performance on the Nepali-only reading assessment. Students were tested in Nepali because it was the official language of instruction in which students were expected to be literate. Also, the EGRA and CAP assessments were not developed to be comprehensive measures of learning. They are targeted evaluations of students’ pre-reading and reading skills, and thus only measure specific skills.
The classroom observations covered multiple types of lessons, and the data do not reflect only reading or language instruction. Rather, the observation data provided a picture of instruction in general. The data show that the use of time in class was fairly consistent across all subjects observed. The observation data also included information from visits to Grade 1, 2, and 3 classrooms. The intention was to observe the nature of instruction across all early grades, which reflected students’ instructional experiences during their first three years in a particular school.
All instruments were translated from English into Nepali and were adapted to be relevant and culturally appropriate. Responses and data were translated back into English for analysis and it is quite possible that some errors occurred when moving information between the two languages.
Finally, the interview protocols and questionnaires were developed in English and translated into Nepali and culturally adapted for the Kanchanpur and Kailali districts, after which the responses were translated back into English for analysis. It is likely that some errors occurred while moving between languages.
FindingsEGRA ResultsThere was a strong correlation between students’ CAP scores, letter recognition, and oral reading fluency of text from Grades 2 and 3. Therefore, Grade 3 reading fluency was used as the indicator of student literacy. Letter recognition and CAP were used to examine the pre-reading skills in the students with the lowest reading fluency scores.
Figure 1 depicts the distribution of oral reading fluency scores for students in the sample. Forty-four percent of Grade 3 students assessed were unable to read a single word. Moreover, the sample was clearly split between students unable to read a single word (44 percent) and those able to read 40 words per minute (wpm) or more (38 percent).
Research conducted by Helen Abadzi (2008) suggests that students learning English or Spanish should be able to read 80–90 wpm by Grade 3. As no studies on the development of reading fluency for Nepali speakers have been conducted, it is difficult to determine a similar benchmark for the students in this study. However, the results suggest that the immediate issue is not whether students are reading too slowly, but whether they are reading at all.
Given this distribution, student demographic variables were examined to better understand the split in reading scores. Figure 2 shows that non-native Nepali speakers were more likely to be unable to read at all (52 percent of non-native Nepali speakers compared to 36 percent for native Nepali speakers). Also, fewer non-native Nepali speakers read more than 40 wpm (34 percent compared to 40 percent of native Nepali speakers). However, in general, the same pattern of non-readers and readers persisted for native and non-native Nepali speakers. In fact, if students scoring zero on the reading fluency assessment are removed, there was no difference in the average words per minute read by students in the three main language groups (see Table 4).

202
Opp
ortu
nity
to L
earn
: A h
igh
impa
ct st
rate
gy fo
r im
prov
ing
educ
atio
nal o
utco
mes
in d
evel
opin
g co
untr
ies
Figure 1. Reading fluency for all students, percentage of students who could read12%More than 60 wpm
16%
10%
12%
Between 50 and 40 wpm
Between 50 and 60 wpm
More than 60 wpm
6%
7%
16%
Between 20 and 30 wpm
Between 30 and 40 wpm
Between 50 and 40 wpm
3%
3%
Up to 10 wpm
Between 10 and 20 wpm
Between 20 and 30 wpm
44%
0% 5% 10% 15% 20% 25% 30% 35% 40% 45%
Zero wpm
p p
0% 5% 10% 15% 20% 25% 30% 35% 40% 45%
Figure 2. Reading fluency by linguistic group, percentage of students able to read
Between 50 and 40 wpm
Between 50 and 60 wpm
More than 60 wpm
Between 20 and 30 wpm
Between 30 and 40 wpm
Between 50 and 40 wpm
Up to 10 wpm
Between 10 and 20 wpm
0% 5% 10% 15% 20% 25% 30% 35% 40% 45% 50% 55%
Zero wpm
Nepali Speakers Other Mother Tongue
There was also a significant difference in the average reading scores between the two districts. As reported previously, 58 percent of students spoke Nepali in Kanchanpur and 41 percent spoke Nepali in Kailali. As shown in Table 5, Kailali, with a higher percentage of non-native Nepali speakers, had a higher percentage of non-readers. When non-readers were removed, the average oral reading fluency of students from Kailali was considerably higher than the average for those from Kanchanpur.
Socio-economic status (SES) differences among students families do not help explain these differences in reading performance. To measure SES, students were asked about the type and size of their home, their family’s possessions, and whether the student earned money outside of the home (as summarized in Table 3). No relationships appeared between reading fluency results and these socio-economic proxy data for individual students. In fact, students from Kailali, the district with a higher percentage of non-native Nepali speaking students and whose families rank lower on various SES indicators, had both a higher percentage of non-readers and a higher average reading fluency score for students who able to read.
This suggests that linguistic and SES disadvantages manifested themselves when a larger share of students from disadvantaged groups did not learn to read at all. However, those from disadvantaged groups who did learn to read, on average, outperformed the linguistic majority group and students from families with higher SES.

203
CASE ST
UD
Y: CASE ST
UD
Y: Using O
pportunity to Learn and Early Grade Reading Fluency to M
easure School Eff ectiveness in Nepal
Table 4. Words per minute read by language, with and without non-readers
Language Na
Average wpm all students (WPM≥0)
% Students not reading (wpm=0)
Average wpm readers only
(wpm>0)Nepali 212 29 36% 46Tharu 192 22 52% 46
Rana Tharu 32 23 50% 46
Other 16 29 31% 43a. While 480 students were interviewed, only 452 were given the Grade 3 reading assessment.
Table 5. Words per minute read by district, with and without non-readers
District N
Average wpm All Students (WPM≥0)
% Students not reading (wpm=0)
Average wpm Readers Only
(wpm>0) Kanchanpur 153 23 41% 39
Kailali 299 27 45% 50
Concepts About Print and Letter Recognition ResultsThe CAP and letter recognition assessments helped determine whether students struggling to read had at least acquired some of the basic skills necessary to build reading fluency. As shown in Table 6, students unable to read could, on average, identify 20 out of the 36 letters in the Nepali alphabet and answer 6 out of 10 CAP questions correctly. Students knew where a story began and ended and the correct direction of text, but were unable to choose a word or a letter from the text and read it aloud. The fact that the students with the lowest reading ability could answer six CAP questions correctly suggests that students were at least exposed to printed materials.
Table 6. CAP and letter recognition scores by level of reading fluency
0 wpm
1–10 wpm
11–40 wpm
41+ wpm
Number of students 198 15 72 167Average # of correct CAP questions 6 6 8 9
Average # of letters identified correctly 20 30 34 35
Table 7 highlights schools within the sample with the highest and lowest average reading scores. While a greater percentage of students in the top performing schools were more likely to speak Nepali, language appeared not to be the only determining factor for high performance. Of the three schools with over 60 percent Nepali speakers, two were in the highest performing group and one was in the lowest performing group. Similarly, of the three schools with almost no Nepali speakers, one was among the highest performing group and the other two were among the lowest performing group. The number of years of Save the Children support also varied very little between the two groups. The average number of years of support for the top schools was six and a half, while the bottom schools reported an average of seven and a half years of support.
An obvious difference between the highest and lowest performing schools was the percentage of students unable to read. In each of the lowest performing schools, 47 percent or more of the students were unable to read a single word. In contrast, at only one top performing school were more than 30 percent of students not reading.

204
Opp
ortu
nity
to L
earn
: A h
igh
impa
ct st
rate
gy fo
r im
prov
ing
educ
atio
nal o
utco
mes
in d
evel
opin
g co
untr
ies
Table 7. Highest and lowest performing schools in reading fluency
Highest performing schools
Average wpm
% not reading
Save or Control
Years supported by SC
% Nepali speakers
1 50 5% S 4 100%2 45 6% S 4 41%3 42 24% S 13 0%4 39 11% C - 83%5 36 33% S 5 38%
Lowest performing schools
Average wpm
% not reading
Save or Control
Years supported by SC
% Nepali speakers
1 2 90% S 8 5%2 8 55% S 3 64%3 8 79% S 5 15%4 14 47% S 15 45%5 18 57% S 7 5%
The researchers examined other factors that could influence literacy acquisition, such as gender, age, and participation in early childhood education. In this sample, none of these indicators was significantly correlated with reading scores. There was an interaction between gender and reading scores: girls speaking Tharu at home tended to score lower in areas of letter knowledge, reading fluency, and comprehension than the rest of the sample. However, there was no statistically significant difference between reading scores of girls speaking Nepali, Doteli, or Rana Tharu and the rest of the sample. Participation in kindergarten also had no relationship with the levels of oral reading fluency achieved by students in Grade 3.
Beyond the individual or family characteristics that may have accounted for variations in student levels of learning, this study explores how differences at the classroom and school levels may have impacted students’ opportunities to learn and thus their learning outcomes.
Opportunity to Learn Factors as Measures of School EffectivenessTo look at school-level factors we returned to EQUIP2’s opportunity to learn framework. This study used the 12 OTL factors both individually and collectively to determine the effectiveness of each school in the study at maximizing opportunities to learn. Recall that the factors include:
1. Percentage of days school is open; 2. Teacher attendance;3. Student attendance;4. Percentage of the school day available for instruction;5. Percentage of student time-on-task;6. Equivalent percentage of days available for instruction;7. Percentage of students with a textbook;8. Percentage of observed textbook use;9. Percentage of time spent reading;10. Grade 3 reading ability;11. Class size; and12. School support.

205
CASE ST
UD
Y: CASE ST
UD
Y: Using O
pportunity to Learn and Early Grade Reading Fluency to M
easure School Eff ectiveness in Nepal
OTL Factor 1: The Percentage of Days School Is OpenThe official school calendar in Nepal includes 192 days, with the school year starting in mid-April and ending in March. Based on data triangulated from teacher and principal interviews, the researchers found that schools, on average, opened 15 days after the official start date. In addition, principals reported that schools were closed, on average, an additional four days during the school year for non-official reasons. Therefore, the equivalent of about 19 days, on average, was lost due to school closure.
Figure 3. Number of days closed by school
45Kanchapur District Kailali District
30
35
40
15
20
25
5
10
15
0
Principal Reported Teacher Reported
Figure 3 summarizes the number of days each school was closed as reported by both teachers and principals. The equivalent number of days lost varied greatly by school, with as many as 40 days lost in some places and as few as 3 days lost in others. At six schools, there was a considerable difference between the number of days school was closed as reported by teachers compared to the number reported by principals. Schools often kept only informal records of school closure such as notes in student attendance books, making it difficult for researchers, principals, and teachers to determine the number of school days lost. While the researchers collected this data from both principals and teachers, the final calculations of equivalent school days lost were based on principals’ reports since it is officially their role to document such information.
OTL Factor 2: Teacher AttendanceThe research team was unable to obtain official records for teacher attendance. However, during interviews, principals reported on teacher attendance from the previous week. Based on this information, the researchers estimated teacher attendance rates for the entire school year. On average, teachers were present 91 percent of days that their school was open. Given that principals and teachers were likely to answer this question positively, these attendance rates may overestimate teacher presence at school.
OTL Factor 3: Student AttendanceThe research team was unable to obtain data on student attendance. However, during the survey, students reported whether they missed school the previous week. Thirty-three percent of students said they had missed school the previous week on days when school was open. Although these numbers could not be used to calculate a student attendance rate, this self-reported estimate suggests that student absenteeism was high. On average, students reported having to walk about 20 minutes to school, implying that distance to school did not contribute to student absenteeism.

206
Opp
ortu
nity
to L
earn
: A h
igh
impa
ct st
rate
gy fo
r im
prov
ing
educ
atio
nal o
utco
mes
in d
evel
opin
g co
untr
ies
OTL Factor 4: Percentage of the School Day Available for InstructionThe percentage of the school day available for instruction takes into account the non-instructional components of the school day, such as recess. It also recognizes that school may start late, end early, or experience interruptions in instructional time.
In Nepal, the only data collected for OTL Factor 4 was a 30 minute recess each day. This data was not collected at the schools, but rather, from the government’s official policy that each school give students a 30 minute break. No data was collected on the actual start and end times of the school day. Using this estimate, 92 percent of the day was available for instruction. In other case studies in this series, EQUIP2 observed school days starting late and ending early and an extended recess. Thus, it is likely that more time was lost during the day in Nepal than the minimal calculation included here.
OTL Factor 5: Percentage of Student Time-on-TaskThe researchers observed classrooms in Grades 1, 2, and 3 for approximately one hour each, as appropriate to class sessions, using the Stallings Observation Instrument. The Stallings Observation Instrument consists of a series of 10 snapshot observations over the course of one hour. During each snapshot, the researcher records teacher activities, classroom activities, materials use, and student engagement in learning activities. The teacher and student activities were categorized and broadly divided into those that were “on task” and “off task.” On-task activities included reading aloud, demonstration/lecture, discussion/debate, practice/drill, seatwork, verbal instructions, reading silently, and interpreting text. Off-task activities included leaving the room, socializing, discipline or classroom management, and disengagement. Students were considered to be reading when observed reading syllables, words, or text silently or aloud or discussing text with other students or the teacher. If students were involved in exercises such as repeating the alphabet, sounds, and words, the activity was coded as practice/drill.
Across the 23 schools, the percentage of on-task time for Grade 1, 2, and 3 teachers ranged from 50 to 87 percent with an average of 74 percent. In Kanchanpur, teachers were on task an average of 79 percent of the time and in Kailali 70 percent of the time. However, the difference between districts was not statistically significant.
Overall, students were engaged in on-task activities 60 percent of the time. In Kanchanpur, students were on task, on average, 70 percent of the time, while in Kailali they were on task only 55 percent of the time; a small, but statistically significant difference. Interestingly, students from Kailali, the district with lower time-off-task, had the higher average fluency scores for students who could read. This suggests that off-task students may have been the non-readers. In all cases, students were more likely to be engaged in learning activities when their teacher was on task. When the teacher was observed to be on task, 77 percent of students were also on task.
As demonstrated in Table 8, on-task student activities differed by grade. In Grade 1, 14 percent of instructional time was focused on practice and drill activities and 13 percent on copywork. In Grade 2, instructional time was spent primarily on seatwork, demonstration and lecture, and copywork. In Grade 3, instructional time-on-task was spent mostly on seatwork, copywork, and demonstration and lecture.

207
CASE ST
UD
Y: CASE ST
UD
Y: Using O
pportunity to Learn and Early Grade Reading Fluency to M
easure School Eff ectiveness in Nepal
Table 8. Time-on-task by activity and grade
Activity Grade 1 Grade 2 Grade 3
Reading aloud 7% 2% 7%Demonstration and lecture 9% 15% 12%
Debate/discussion 1% 2% 3%Practice and drill 14% 12% 8%
Seatwork 10% 15% 13%Copywork 13% 14% 11%
Verbal instruction 3% 2% 2%Students reading 0% 0% 0%Interpreting text 0% 0% 0%Students off task 41% 38% 42%
OTL Factor 6: Equivalent Percentage of Days Available for Instruction In this study, researchers combined OTL Factors 1–5 into a factor termed equivalent percentage of days available for instruction (Factor 6). The objective was to compare the amount of time actually available for instruction to the amount of time potentially available based on the official school calendar.
To estimate the number of days available for instruction, researchers subtracted the number of days a school was closed, the number of days lost due to teacher absence, the 30 minutes of lost instructional time due to recess, and the number of days lost due to students being off task from the number of days on the school calendar (192). Figure 4 summarizes the effects of each variable on the total days available for learning in both districts.
Figure 4. Number of days available for instruction
192 192192 192
173 174158 157
145 145150
200
Official Days
101
79100
150School Closed
Teacher Absence
Daily Time Lost79
50
Time‐on‐task
0Kanchapur Kailali
After accounting for school closures, teacher absenteeism, and time available in the school day for instruction, the equivalent of 145 days in Kanchanpur and Kailali were available for learning. However, once time-on-task data was included the number of days available for learning dropped to 101 in Kanchapur and 79 in Kailali. On average, the equivalence of 47 percent of the school year was lost in Kanchanpur and 59 percent in Kailali. Across all sample schools in Nepal, 87 days were available for learning, on average. Taking student attendance into account would have further

208
Opp
ortu
nity
to L
earn
: A h
igh
impa
ct st
rate
gy fo
r im
prov
ing
educ
atio
nal o
utco
mes
in d
evel
opin
g co
untr
ies
reduced the amount of time available for learning, as would more accurate data on when school days started and ended.
When examining the relationships between OTL Factors 1–5, teacher attendance was positively correlated with reading fluency and reading comprehension, suggesting that students at schools with high teacher attendance had greater oral reading and comprehension skills. There was no significant correlation between reading scores and the other four factors.
OTL Factor 7: Percentage of Students with a TextbookIn general, materials were equally available in each district. On average, 87 percent of Grade 3 students in Kanchanpur had a language arts book, 98 percent had notebooks, and 84 percent had a pencil or pen. In Kailali, 84 percent of Grade 3 students had a language arts book, 93 percent had notebooks, and 85 percent had a pencil or pen. However, there was some variation in the availability of materials across schools. Figure 5 shows the percentage of Grade 3 students with a language arts book. In one school, almost no students had a textbook. In six others, all students had the language arts book. In the vast majority of schools (20 out of 23), at least 75 percent of students had a language arts textbook.
Figure 5. Percentage of Grade 3 students with language arts books by school
greater than 60 students
between 40 & 50 students
between 50 & 60 students
greater than 60 students
less than 30 students
between 30 & 40 students
between 40 & 50 students
0 2 4 6 8
less than 30 students
G d 3 A G d 1 G d 3Grade 3 Average Grade 1 ‐ Grade 3
OTL Factor 8: Percentage of Observed Textbook UseIn all but one school, textbooks were available in large enough quantities to enhance instruction. However, there was variation in the percentages of students observed in Grades 1, 2, and 3 using any textbook during classroom time. Textbook use was observed in some schools as frequently as 32 percent of the time, while in others, textbooks were used only 3 percent of the time (about five minutes during a period of three hours). On average, 14 percent of students were observed using textbooks as part of a lesson. No significant relationship was found between these findings and students’ oral reading fluency.
OTL Factor 9: Percentage of Time Spent ReadingThe only reading activity observed in all three grades was reading aloud. No students read on their own in any of the observed grades. As shown in Table 9, reading accounted for 6 percent of instruction-related activity in the schools observed in this study.
The strongest determinant of student engagement was, not surprisingly, teacher engagement. As shown in Table 10, students were on task most often when their teacher was on task. However, when teachers were observed to be off task, 88 percent of students were off task as well.

209
CASE ST
UD
Y: CASE ST
UD
Y: Using O
pportunity to Learn and Early Grade Reading Fluency to M
easure School Eff ectiveness in Nepal
In the classrooms observed, all reading activities occurred only when the teacher was on task, but even then, only 8 percent of students, on average, were observed reading. The amount of reading aloud in Kailali (the district with higher reading fluency of literate students) was much greater than in Kanchanpur. When the teacher was on task in Kanchanpur, more students were involved in practice and drill activities and copying than reading and understanding written text. In Kailali, more students were involved in seatwork, an activity that could use reading skills. This breakdown of activities suggests that it is not only important to keep students on task, but also necessary that learning time is dedicated to activities that use and strengthen students’ reading abilities.
Table 9. Percentage of students engaged in activities
Student Category of Activity OverallWhen Teacher Is
on TaskWhen Teacher Is
Off TaskReading 6% 8% 0%
Demonstration 12% 16% 0%Discussion 2% 3% 0%
Practice/Drill 11% 15% 0%Seatwork 13% 16% 4%Copying 13% 15% 8%
Verbal Instruction 3% 4% 0%Off Task 40% 23% 88%
As shown in Figure 6, the level of student engagement in instructional activities (time-on-task) and the percentage of time spent reading varied considerably across schools. For this sample of schools, these two opportunity to learn factors were not correlated with each other and neither correlated with oral reading fluency. This study suggests that, for these schools, instruction had no relationship with literacy acquisition because, in many schools, little instruction related to literacy took place.
Figure 6. Average percentage of students engaged in different activities by school

210
Opp
ortu
nity
to L
earn
: A h
igh
impa
ct st
rate
gy fo
r im
prov
ing
educ
atio
nal o
utco
mes
in d
evel
opin
g co
untr
ies
OTL Factor 10: Grade 3 Reading AbilityReading ability is both an outcome of opportunity to learn and a critical determinate of whether students continue to learn and advance in school. If students do not acquire an adequate level of reading ability early in their schooling, they fall further behind. Thus, students’ continued opportunity to learn depends on their level of reading ability.
Given the lack of focus on reading and reading instruction, it was not surprising to find low Grade 3 reading performance. As shown in Table 10, 44 percent of students could not read at all, 63 percent of students read between 0 and 40 wpm, only 26 percent read 41–60 wpm, and 12 percent read above 60 wpm.
Table 10. Frequency Distributions of Reading Fluency, Grade 3
wpm Zero 1-10 11-20 21-30 31-40 41-50 51-60 61-70 >70% students 44% 3% 3% 6% 7% 16% 10% 5% 7%
Identifying the causes of these reading level patterns in Nepal is essential to improve students’ reading abilities. This study used Concepts about Print to assess whether students were acquiring foundational reading skills. As Table 11 demonstrates, the majority of students had acquired pre-literacy foundation in either their mother tongue or the language of instruction. While students had low reading scores, they knew their letters and print concepts. Higher Concepts about Print scores were correlated with better reading performance, but 85 percent of students answered at least five Concepts about Print questions correctly.
Table 11. Concepts about Print
# CAP Correct Answers Zero 1 2 3 4 5 6 7 8 9 10% students 1% 2% 3% 3% 6% 8% 8% 11% 20% 29% 11%
Average wpm 5.1 8.7 39.8
OTL Factor 11: Class SizeClass sizes within the sample varied greatly between schools and between grades. The largest was a Grade 1 classroom with 213 students while the smallest was a Grade 2 classroom with 14 students. Table 12 summarizes average class sizes for each grade in the two districts and the overall sample. Grade 1 classes were, on average, the largest.
Table 12. Average class size
District Grade 1 Grade 2 Grade 3Kanchanpur 44 39 40
Kailali 54 43 47All schools 50 42 44
Figure 7 highlights the variability in class size. Most classrooms (52 percent) had 40 or fewer students, with many containing fewer than 30. Twenty percent of Grade 3 classrooms had more than 60 students. Class size, however, had no relationship with student reading fluency.

211
CASE ST
UD
Y: CASE ST
UD
Y: Using O
pportunity to Learn and Early Grade Reading Fluency to M
easure School Eff ectiveness in Nepal
Figure 7. Frequency distribution for class size
greater than 60 students
between 40 & 50 students
between 50 & 60 students
greater than 60 students
less than 30 students
between 30 & 40 students
between 40 & 50 students
0 2 4 6 8
less than 30 students
G d 3 A G d 1 G d 3Grade 3 Average Grade 1 ‐ Grade 3
OTL Factor 12: School SupportSchool improvement efforts usually involve external help that builds local capacity to administer and manage the school, improves teaching, and works with parents and community members to support and manage their schools. Regular visits to schools are one way through which support to administration, teaching and learning, and community participation is usually delivered. In Nepal, principals and teachers were asked how frequently their schools receive visits from outside support personnel. These included visits by regional, local, or other education officials, as well as support of project staff from Save the Children or other NGOs. Figure 8 shows that schools in this study were all visited at least once per year. Most schools (18 of 23) were visited between once and twice per semester.
Figure 8. Frequency of visits during the school year
10
8
4
6
2
4
0
Once per semester
Three times per year
Twice per semester
Five times per year
Three times per semester
Four times per semestersemester per year semester year per semester per semester
Interestingly, there was no difference in the frequency of school support visits between schools participating in Save the Children’s programs and the six control schools. Further, the reliability of self-reported data was questionable, as principals and teachers may have been motivated to over-report visits (to give what is perceived to be the right answer) or to under-report (to convey that they need support). Principals and teachers at the same school did sometimes give different answers to the school support question but neither group’s responses were consistently biased in one direction or the other.
School support showed no relationship to the other OTL factors or to students’ reading fluency scores. The number of school visits did not influence a school’s ability to organize and provide opportunities to learn. This finding is contrary to what earlier EQUIP2 research found, namely,

212
Opp
ortu
nity
to L
earn
: A h
igh
impa
ct st
rate
gy fo
r im
prov
ing
educ
atio
nal o
utco
mes
in d
evel
opin
g co
untr
ies
that community-based schools are able to organize opportunities to learn more consistently than government schools in part because of more regular NGO support. It is important for Save the Children and its partners to investigate whether their school support in Nepal focused on improving school management, teaching, and learning.
Conclusions and ImplicationsThis study set out to answer the following questions:
• How well do schools provide opportunity to learn?• How does actual opportunity to learn compare to potential opportunity to learn?• How does opportunity to learn vary across schools?
The findings from this case study suggest that: a) a great deal of opportunity to learn, as measured by instructional time, was lost; b) little, if any, of the actual classroom reading instruction took place; c) textbook use was suspect; and d) students’ reading abilities were low. Out of the 192 days of instruction potentially available at schools in Nepal, only the equivalent of 87 days, on average, were actually available for opportunity to learn.
Given the small amount of classroom time spent on reading and the lack of a reading curriculum, it was not surprising that students’ reading abilities were low. While major variations existed across all OTL factors included in this study’s research framework, variation in all of the non-reading factors other than teacher attendance was of little significance, as they did not impact the one factor that could have contributed to students learning to read: time spent reading or in reading-related activities.
Far too many children in the schools surveyed had not learned to read adequately by Grade 3. Too many students, especially non-native Nepali speaking students, were unable to read at all, even after two or three years of schooling. For the students who did learn to read, their levels of fluency were below the basic standard for reading in Grade 3. Research conducted by Abadzi (2008) argues that students learning to read script languages need to read between 45 and 60 wpm by Grade 2 to demonstrate adequate comprehension and fluency skills. Children whose mother tongue was not Nepali were more likely to be unable to read by Grade 3. However, about half of the non-native Nepali speaking students were literate and obtained levels of oral reading fluency equal to or surpassing their native Nepali speaking peers. This phenomenon was particularly common in Kailali where Nepali was not the mother tongue for 59 percent of students.
This study revealed considerable variation in a school’s ability to respond to students’ needs. Schools varied in how often they were open and how regularly their teachers and students were present. Schools also varied in how classroom time was used, how frequently students were on task, and how regularly reading activities were featured.
As for the factors that account for variations in student learning, the study found time spent reading to be an important opportunity to learn variable. For example, schools in Kailali had a slightly lower percentage of student time-on-task than their counterparts in Kanchanpur. However, during the time that was spent on task in Kailali, twice as many students were involved in reading activities. In fact, by itself, the percentage of students involved in reading activities at school accounted for 38 percent of the variation in the average oral reading fluency of students in that school who could read at least one word. While reading activities were observed more often in Kailali, it is important to note that, on average, only 14 percent of students in Kailali were involved in reading activities when those activities occurred.
213
CASE ST
UD
Y: CASE ST
UD
Y: Using O
pportunity to Learn and Early Grade Reading Fluency to M
easure School Eff ectiveness in Nepal
Save the Children’s efforts in Nepal are intended to provide support to help schools improve. Since receiving the results of this study, Save the Children has begun implementing Literacy Boost at 17 pilot schools in 2009 with plans to expand in 2010 if results indicate success.
Even in the best performing schools, opportunities to learn and reading outcomes can be greatly improved. This study’s findings point to a variety of interventions, mentioned below, that could lead to more consistent opportunities to learn and, therefore, better learning outcomes.
Providing a Structured Approach to Teaching ReadingIn Nepal, as in other countries EQUIP2 has researched, the absence of a specific reading curriculum or reading program has contributed to low levels of reading instruction. The building blocks of reading were not part of the curriculum, as most instruction focused on language, not reading. Introducing a reading program that fits within the existing primary school curriculum is one challenge that school improvement projects must take on. As seen in the time-on-task data, the strongest determinant of students being on task was the teacher being on task. With respect to reading-related activities, across all the observations in all the schools, no students were observed reading when their teacher was off task. A structured reading program is one way to help teachers know how to be on task and to devote a higher percentage of time to reading instruction and practice.
Increasing Time Spent ReadingIncreasing the amount of time spent reading is one area where opportunity to learn can be substantially improved in Nepal. Much more class time needs to be devoted to reading activities, and more students need to be engaged in these activities. In this sample of schools, students in Grades 1, 2, and 3 spent an average of 12 minutes per day on reading-related activities; about 40 percent of the students were off task during these 12 minutes. This could explain why such a high percentage of students had not learned to read at all. Teachers need training on how to include classroom activities that build reading skills and provide students with time to read.
Making Better Use of Available MaterialsIn most of the schools sampled, more than 75 percent of students had a language textbook. However, this study revealed that these books were rarely used to supplement instruction. Teachers need professional development that demonstrates how to use materials in their lessons.
Providing Additional Reading MaterialClassrooms lack other books and reading materials. If the objective is to increase the time spent reading, then other materials such as story books, articles, and letters are needed. Classrooms must be rich in reading material if teachers are expected to promote reading in school.
Addressing the Needs of Students Struggling to ReadMany students are not learning to read at all. Engaging students who are not able to read is an additional, more complex challenge for teachers in Nepal. First, teachers need to be helped to recognize that a substantial percentage of their students cannot read. This implies introducing easy-to-use assessments, including versions of the tools used in this study, at the school level and training teachers to periodically use such assessments to identify their students’ learning needs. When struggling students are identified, teachers then need explicit strategies for helping these children not only learn to read, but learn to read at an accelerated pace. This implies the need for supplemental instructional time as well as more individualized instructional techniques that make use of proven reading strategies. Increased reading instruction will not, by itself, improve students’ skills unless teachers use methods proven to strengthen students’ oral reading abilities. When

214
Opp
ortu
nity
to L
earn
: A h
igh
impa
ct st
rate
gy fo
r im
prov
ing
educ
atio
nal o
utco
mes
in d
evel
opin
g co
untr
ies
possible, encouraging parental involvement and providing opportunities to read outside school may also help students learn to read.
Ensuring that School Starts On-time and Teachers Are PresentOn average, schools lost 15 days at the start of the school year. This percentage equated to a loss of 8 percent of potential opportunity to learn before the school doors even open. Additional time lost during the year, particularly because of teacher absence, reduced the available time for instruction even further. Given that this study probably grossly under-estimated teacher absenteeism and did not account for student absenteeism, it is likely that interventions aimed to improve the amount of time students are in school would greatly impact opportunity to learn. In other contexts, using school management committees to ensure local accountability has been an effective strategy for making sure school is open and teachers are present.

215
CASE ST
UD
Y: CASE ST
UD
Y: Using O
pportunity to Learn and Early Grade Reading Fluency to M
easure School Eff ectiveness in Nepal
ReferencesAsian Development Bank. 2009. Nepal: Critical Development Constraints. Philippines: Asian Development Bank, Department for International Development and International Labour Organization.
Abadzi, Helen. 2008. Efficient Learning for the Poor: New Insights into Literacy Acquisition for Children. Journal International Review of Education, 54 (5-6): 581-604.
Clay, Marie. 2000. Concepts About Print: What Have Children Learned about the Way We Print Language? Portsmouth, NH: Heinemann.
DeStefano, Joseph, Audrey Moore, David Balwanz & Ash Hartwell. 2007. Meeting EFA: Reaching the Underserved through Complementary Models of Education. Washington, D.C.: EQUIP2, FHI 360, and USAID.
Gillies, John & Jessica Jester Quijada. 2008. Opportunity to Learn: A high impact strategy for improving educational outcomes in developing countries. Washington, D.C.: EQUIP2, FHI 360, and USAID.
Jukes, Mathew, Shaher Banu Vagh & Young-Suk Kim. 2006. Development of Assessments of Reading Ability and Classroom Behavior, a report prepared for the World Bank. Cambridge, MA: Harvard Graduate School of Education.
Kellaghan, Thomas. (2004). Public Examinations, National and International Assessments, and Educational Policy. Dublin, Ireland: Education Research Center, St. Patrick’s College.
Seymour, Philip, Mikko Aro & Jane Erskine. 2003. Foundation literacy acquisition in European orthographies. British Journal of Psychology, (94): 143-174.
Stallings, Joan. 1980. Allocated learning time revisited: Or beyond time-on-task. Educational Researcher, 9(11), 11–16.

216
Opp
ortu
nity
to L
earn
: A h
igh
impa
ct st
rate
gy fo
r im
prov
ing
educ
atio
nal o
utco
mes
in d
evel
opin
g co
untr
ies
Annex A: Additional Information on Sample Schools
Save schools
Total enrollment
% Grade 3 students speaking
Nepali as MT
Teacher years of
experience
% female
teachers
% teachers with teach.
cert
Years in the SC
program
# of implemented SC programs at
school
1 238 85% 5.7 50% 50% 8 1
2 449 64% 12.4 25% 100% 5
3 278 45% 10.2 33% 100% 15 8
4 1271 35% 9.9 50% 100% 6 8
5 129 5% 6.2 20% 40% 8 8
6 709 41% 12.8 33% 83% 4 7
7 782 0% 14 6.7% 93% 13 8
8 178 15% 11.5 25% 75% 3 8
9 341 15% 17.3 29% 86% 3 8
10 196 75% 4.2 40% 80% 5 4
11 237 100% 4.2 17% 50% 4 6
12 1139 46% 13.9 24% 76% 6
13 275 5% 5 33% 33% 14 7
14 693 77% 7 27% 55% 6 5
15 1055 72% 7 27% 73% 4 2
16 498 41% 5.3 50% 83% 5 1
Total 8468 45% 9.2 31% 74%
Control schools
Total enrollment
% Grade 3 students speaking
Nepali as MT
Teacher years of
experience
% female
teachers
% teachers with teach.
cert
1 190 95% 10.6 25% 100%
2 143 90% 6.4 60% 80%
3 128 88% 16.3 25% 100%
4 525 40% 10 63% 88%
5 691 17% 7.5 13% 11%
6 941 24% 10.5 18% 71%
7 312 33% 13.3 82%
Total 2930 55% 10.7 34% 76%

217
CASE ST
UD
Y: CASE ST
UD
Y: Using O
pportunity to Learn and Early Grade Reading Fluency to M
easure School Eff ectiveness in Nepal


219
ANN
EX: C
omplem
entary Education Research Methodology
Complementary Education ResearchMethodology
IntroductionBased on a mutual interest to understand what interventions best support student success and ef-fectiveness in schools, EQUIP2 partnered with Save the Children (SC), CARE, and the Aga Khan Foundation to conduct these case studies. These NGO partners provided access to a sample of their schools, field support from their offices for data collection, transportation and materials, and in several cases, co-lead investigators or research assistants to support the work. The following discus-sion elaborates on the methodology used for collecting and analyzing the data from a sample of 163 schools across Guatemala, Ethiopia, Honduras, Mozambique, and Nepal. The study aims to answer the following questions:• Howwelldoschoolsprovidestudentswithanopportunitytolearn(OTL)?1
• HowdoesactualOTLcomparetopotentialOTL?• HowdoesOTLvaryacrosscountriesandschools?
The study uses a mixed-methods approach, drawing on interviews, classroom observations, surveys, and student reading assessments.
Selection of the CasesThe study examines data at the student, classroom and school level. In each country, a representa-tive sample of NGO- supported schools was randomly selected, representing 15 percent of the total number of schools that the organization supported in the country. The sample was stratified by two factors: distance from an urban center and size of school. Schools were then proportionally selected from the regions or districts where the NGO partner worked.
To ensure a point of comparison, five to 10 government comparison schools that were not receiving NGO support were also selected. The comparison schools were selected based on matched char-acteristics of distance, size, language and student socio-economic status (SES) in order to ensure comparability.2
In each school, classroom observations were conducted in all grade 3 classrooms and as many grade 1 and 2 classrooms as time allowed during the school day. Twenty grade 3 students were randomly selected by enumerators to complete an early grade reading assessment (EGRA). When a class had fewer than 20 pupils, all students were tested.
1 An Opportunity to Learn (OTL) is defined as the criteria for, and basis of assessing the quality of resources, practices, and conditions necessary at each level of the education system to provide all students with the opportunity to learn the material in national curriculum (Ysseldyke, Thurlow, and Shin, 1995; Mereku, 2005).2 Student SES was provided by SC Guatemala and based mainly on general family earnings. When actual SES data was collected, analysis revealed that the schools were not necessarily properly matched according to SES characteristics col-lected by the researchers.

220
Opp
ortu
nity
to L
earn
: A h
igh
impa
ct st
rate
gy fo
r im
prov
ing
educ
atio
nal o
utco
mes
in d
evel
opin
g co
untr
ies
Table 1. Sample of Schools and Students Across All Five Case Studies
Ethiopia Guatemala Honduras Mozambique NepalNGO Compa-
risionNGO Compa-
risionNGO Compa-
risionNGO Compa-
risionNGO Compa-
rision
# of schools sampled
15 9 20 6 28 6 44 5 23 7
# of Grade 3 students tested
456 505 388 631 480
Boys 51% 50% 50% 50% 54%Girls 49% 50% 50% 50% 48%
Data CollectionThe research protocols were adapted from instruments used by the World Bank and Research Tri-angle International (under the USAID-funded ED-Data II project). The instruments were carefully modified for each locale with support from the local NGO team. In addition, the protocols were translated into the relevant language, piloted in-country and revised accordingly.
The following protocols were used in the study:
• Stallings Observation Instrument: This classroom snapshot records the academic and non-academic activities that teachers and students are engaged in, as well as the materials being used in the classroom.
• Interview Protocols: A teacher and school director interview protocol were used to collect data on teacher and student absenteeism as well as school support services. A student protocol was also included to gather information on family socioeconomic background, language use, and reading habits.
• School Observation Instrument: This tool documents environmental data such as the actual and observed timings for school opening, recess, and closure.
• Reading Assessments: Five EGRA assessments were adapted for use in the Grade 3 reading as-sessments, including oral vocabulary, letters, concepts about print, reading fluency, and reading comprehension. These instruments were originally developed by RTI under the USAID-funded Ed Data II project.
In each country, the EQUIP2 team trained local data collectors to use the instruments to collect all data during the school visits. Data collectors were assigned to teams based on their fluency in the mother tongue spoken in the given districts, and teams spent one full day at each school. Each visit consisted of six activities:1. Capture general observations about the school, including the presence of certain facilities and
whether students and teachers were inside or outside the classroom.2. Observation in Grades 1, 2, and 3 for 45 minutes using the Stallings Observation Instrument.3. Interview the school director to obtain information on student enrollment, teacher and student
attendance, teacher background data, support visits received by the school and community participation at the school level.
4. Interview each of the teachers observed to gather information on background, experience, at-tendance, classroom support and reading instruction.
5. Interview individual students in Grade 3 to obtain information on the students’ background,

221
ANN
EX: C
omplem
entary Education Research Methodology
language use, and reading habits.6. Conduct an oral vocabulary exam and three reading assessments to measure print awareness
and basic literacy skills of Grade 3 students.
Interviews with students to gather data on socioeconomic (SES) factors and students’ academic engagement in the home, as well as the Concepts about Print (CAP) assessment, were conducted in the child’s mother tongue. All other student assessments were conducted in the official language of instruction; however, the directions given to the student for each assessment were stated in the child’s mother tongue. Data collected from the schools was entered into Excel and then uploaded into SPSS for analysis.
Data AnalysisA case study approach was used for this study. The case study approach allows the researcher to fully understand or depict client’s experiences in a program, and conduct comprehensive examination through cross comparison of cases. Each of the five cases was individually analyzed in terms of the OTL indicators. The results from each case study were then synthesized in a summary paper.
The following eleven indicators were collected to form the basis for measuring Opportunity to Learn.1. Number of days the school was closed2. Number of days the teacher was absent3. Number of days the students were absent4. Amount of time lost in a typical day (i.e. late opening, early close, extended recess)5. Time on task6. Number of Equivalent days of instruction7. Percentage of students with a reading textbook8. Time observed in class when students were using textbooks9. Percentage of time spent on any kind of reading activity10. Class size11. Number of school support visits
Early grade reading assessments served as the proxy for grade three learning.
The data collected from each of the first six variables was annualized (where appropriate) and entered into teacher, principal, and student databases. The data was then converted into equivalent days of instruction. Each indicator was then subtracted from the number of official days of instruc-tion – or the previous indicator. Figure 1 explains the final OTL time loss calculation.
Once the data was converted into time variables, cross tabulations, uni- and multivariate regression analysis, and frequencies were run on the data to determine which, if any, of the variables impacted student’s ability to read. In many cases, few, if any variables had any significant correlations with reading results, due in large part to a floor effect (i.e. very little variance in the student reading results).
The team also compared other variables such as time spent reading, availability of textbooks and ac-tual textbook use in the classroom. While data was collected on class size and school support visits, no significant correlations were found with these variables when correlated to reading results or time use.

222
Opp
ortu
nity
to L
earn
: A h
igh
impa
ct st
rate
gy fo
r im
prov
ing
educ
atio
nal o
utco
mes
in d
evel
opin
g co
untr
ies
Figure 1: OTL time loss calculation
In terms of the comparison schools, across all countries, the NGO-supported schools generally per-formed better on the reading assessments than the comparison schools. However, since the sample of comparison schools were so small – and at times lacking in data – the schools were omitted from the final analysis.
The school visits were unannounced, which meant that certain data was sometimes not available dur-ing the visit. In such cases, decisions on what to do in the case of missing data were made based on specific circumstances. When schools were found to be closed, the team accurately documented these instances and those schools were not included in the sample. In schools with no attendance or record books available, it was necessary to rely on self-reported data from directors and teachers, although student attendance was never based on director or teacher self-reporting. When a school was engaged in non-academic activities for an entire day, such as preparing for a holiday celebration, it was not possible to perform classroom observations. However, in these cases it was still possible to interview teachers and the school director.
On some occasions, the team replaced missing data with the sample average for that data point. For example, when teacher or student absence data was not available at the school, researchers calculated the average attendance rate for the district (i.e. based on the other schools in the sample) and used that average as the data point, rather than counting the school as missing the data and further reduc-ing the sample size. This average was compared to the number of students and teachers present at the school during the day of the visit and was in all cases found to be a reasonable substitute.
Opportunity to Learn=
Total number of official school days x % of days when school was open out of all pos-sible days x teacher attendance rate x student attendance rate x % of classroom time that children actually spend in the classroom x % of time in the classroom that children spend
“on task”
EXAMPLECompile information collected in the previous sections:
Total number of official school days = 180% of days when school was open out of all possible days = 86%Teacher attendance rate = 96%Student attendance rate = 98%% of school day that children actually spend in the classroom = 75% % of time in the classroom that children spend “on task” = 50%
Opportunity to Learn = 180 x 86% x 96% x 98% x 70% x 50% = 51
Out of all 180 possible school days, students receive 51 days of instruction. In other words, only 28% of total possible school time is spent on instruction.

223
ANN
EX: C
omplem
entary Education Research Methodology
Validity and ReliabilitySelection bias exists in all cases, because the purpose of the research was to select schools supported by our NGO partners. However, the team attempted to reduce selection bias by randomly select-ing the schools in the sample, and randomly selecting grade 3 students for reading assessments. The team also visited a small set of comparison schools that were not receiving NGO support. However, the sample of comparison schools was too small to make any broad generalizations of the results.
Triangulation is based on the assumption that any bias inherent in particular data sources, investiga-tor, and/or method is neutralized when used in conjunction with other methods, data sources and investigators. In the traditional sense, triangulation seeks the convergence of results because it allows overlapping data to bring different facets of the program to the surface. Where possible, researchers triangulated results in the following manner.1. The use of multiple data sources where possible, particularly attendance data;2. Interviews or discussions with project staff when possible with overlapping questions intended
to collect the same information in different ways; and3. Cross case comparisons.
Protection of Human SubjectsFHI 360 maintains a system which assures the confidentiality of data acquired in the conduct of its investigations and research. Further, this system is designed to ensure that protections for study par-ticipant privacy are implemented in a manner that maximizes the effectiveness of such protections while not compromising the quality of the research. This study implemented the following steps to ensure the protection of all human subjects included in the study, including the students tested with the EGRA instruments.1. Permission was sought through local MOE Education offices to obtain data from all participat-
ing schools. Upon arriving at the schools, the data collection teams met with the principal and requested permission to collect data from teachers and students at the schools.
2. As part of the research protocol, teachers were given the opportunity to refuse to be observed, and such requests were always respected.
3. Students were given the opportunity to opt out of the study, and such decisions were always respected.
4. All participant identities were kept anonymous. The names of teachers, principals, and students were never recorded. Each participant was assigned an identification number. The codes were securely kept with the lead investigator and returned to FHI 360 for confidential storage.
5. The current data has been password protected and is shared only among relevant researchers working on the study. The data cannot be traced back to specific teachers or students in the study.
Limitations of the StudyAlthough the data presented in this study are robust and representative of education in the set of schools represented by the samples, there are important limitations to the methodology and data that must be recognized related to the sample, data collection and the triangulation of results.
There were certain limitations related to the sample. Since only schools in a limited portion of each of the countries (i.e. specific regions or districts) were visited, the data cannot be used to generalize results to the entire country. The results offer insights onto the situation of education in rural areas, and offer a framework for developing further research in the country. Because the number of schools is small, this study presents descriptive statistics and analyzes simple relationships among the differ-ent variables measured using two-tailed t-tests with α≤0.05. Also, the comparison schools selected for the study were few in number (5-10 in each country) and provided illustrative comparisons at best.

224
Opp
ortu
nity
to L
earn
: A h
igh
impa
ct st
rate
gy fo
r im
prov
ing
educ
atio
nal o
utco
mes
in d
evel
opin
g co
untr
ies
Limitations related to data collection efforts were also present. Although efforts were made to create a positive interaction with the children, students’ performance on the reading assessments may have been negatively affected by their unfamiliarity with one-on-one interviews or the EGRA methodol-ogy. Schools that were closed upon a first visit by the data collection team were revisited later in the study. If the schools were closed upon the second visit, they were dropped from the study as a result of time constraints and the ability of the data collection team to return to the schools. It is likely that these schools may have different characteristics and results from the schools that were open and received the data collection teams.
In terms of triangulation, it must be noted that data on student age, time to travel to school, and parents’ education was self-reported. The data cannot be triangulated with any other source and likely includes some errors. In particular, students were sometimes unsure of their age and a large majority reported that they did not know their parents’ level of education. Data for school clos-ings and student and teacher attendance were taken from attendance books and triangulated with self-reported information. The research team noted that there was a lack of consistency in terms of how the school gathered and recorded absenteeism and school closure data. Attendance data for a given week or the month was often filled in to attendance books before the time period had actu-ally passed. In addition, dates of attendance did not always correspond to the actual school calendar. Students or teachers were often marked as present on national holidays when the school should have been, and most likely was, closed. In this study, data that were documented in record books were used whenever possible. For schools without documented data, self-reported data were used and district averages were used as a last resort. Given what was actually observed on the day of the visit, it is most likely the data presented here underestimate the actual absenteeism and school closing rates, especially in terms of student attendance rates, since very limited information was available.
All of these limitations do impact the generalizability of the results. However, the findings still shed light on weaknesses with the rural education sector and highlight areas that the Ministry of Educa-tion in each country should pay particular attention in order to strengthen the education system.

225
ANN
EX: C
omplem
entary Education Research Methodology


If you have questions,please contact:
USAIDPatrick CollinsBasic Education Team LeaderEGAT Office of EducationUSAID Washington1300 Pennsylvania Ave., NWWashington, DC 20532Tel: 202-712-4151Email: [email protected]
FHI 360Audrey-marie Schuh MooreEQUIP2 Project Director1825 Connecticut Ave., NWWashington, DC 20009Tel: 202-884-8187Email: [email protected]: www.equip123.net
This book was made possible by the generous support of the American people through the United States Agency for International Development (USAID) under Cooperative Agreement No. GDG-A-00-03-00008-00. The contents are the responsibility of FHI 360 through the Educational Quality Improvement Program 2 (EQUIP2) and do not necessarily reflect the views of USAID or the United States Government.