Opportunity Day Presentation | 1Q/15
28
The Stock Exchange of Thailand May 25, 2015 Opportunity Day Presentation | 1Q/15
Transcript of Opportunity Day Presentation | 1Q/15
The Stock Exchange of ThailandMay 25, 2015
Opportunity Day Presentation | 1Q/15

This presentation includes forward-looking statements that are subject to risks anduncertainties, including those pertaining to the anticipated benefits to be realized fromthe proposals described herein. This presentation contains a number of forward-lookingstatements including, in particular, statements about future events, future financialperformance, plans, strategies, expectations, prospects, competitive environment,regulation and supply and demand.
PTTGC has based these forward-looking statements on its views with respect to futureevents and financial performance. Actual financial performance of the entities describedherein could differ materially from that projected in the forward-looking statements dueto the inherent uncertainty of estimates, forecasts and projections, and financialperformance may be better or worse than anticipated. Given these uncertainties, readersshould not put undue reliance on any forward-looking statements.
Forward-looking statements represent estimates and assumptions only as of the date thatthey were made. The information contained in this presentation is subject to changewithout notice and PTTGC does not undertake any duty to update the forward-lookingstatements, and the estimates and assumptions associated with them, except to theextent required by applicable laws and regulations.
DISCLAIMER
2

3
• Overview• Strategic Actions Progress• Financial Performance• Market Outlook
AGENDA
4
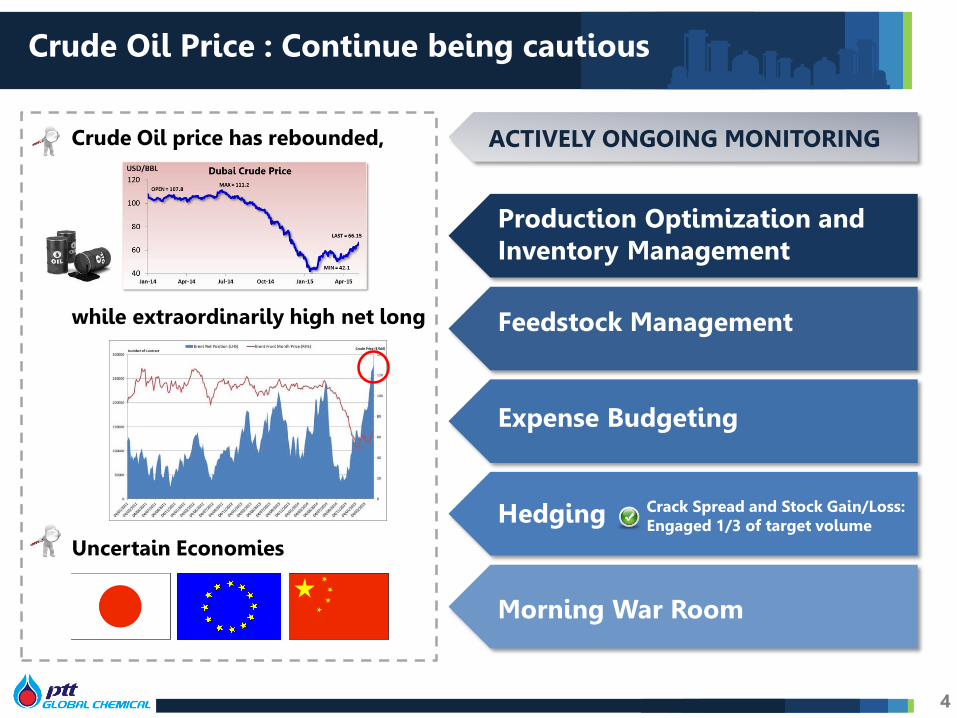
Crude Oil Price : Continue being cautious
Feedstock Management
Expense Budgeting
Hedging
Morning War Room
Crude Oil price has rebounded,
while extraordinarily high net long
Production Optimization and Inventory Management
Crack Spread and Stock Gain/Loss:Engaged 1/3 of target volume
ACTIVELY ONGOING MONITORING
Uncertain Economies

5
• Overview• Strategic Actions Progress• Financial Performance• Market Outlook
AGENDA

6
MORE CLARITY ON STRATEGIESWITH PRUDENT ROADMAP

REFINERY
AROMATICS
Ethylene
Propylene
Mixed C4
Benzene
mLLDPE
Pygas SM
PS
ABSPO/Polyol
PCPhenol/Acetone
PPSBR
PU
PMMA
880-1,320 KTA
Potential ProductsExcess volume available for asset reconfiguration
* 425 KTA of which 230 KTA contract expiring in 2016
425 KTA*
180 KTA
70 KTA
70 KTA
3Q/15 4Q/15 2016 2017 2018 2019 2020 2021
Phenol II
TOCGC Improvement
PO/Polyol
USPetrochemical Complex
2015
Short Term Mid Term Long Term
2022
Asset Reconfiguration
PTTGC Project Timeline
DOWNSTREAM OPPORTUNITIES
Upstream Product Available
IndonesiaPetrochemical Complex
Aromatics II Debott.
HDI Monomer France
mLLDPE
HDI Derivative Thailand
OLEFINS
Reformate 970 KTA
Naphtha
7

CORE UPLIFTS
2015 COMPLETING PROJECTS
SYNERGY PROJECT PROGRESS
Off Gas Upgradingat Olefins
Delay to 2Q/15
99%
DEBOTTLENECKING& EXPANSION
CAPACITY/CAPEX
PROGRESS
Phenol 2 Project
Target COD: 4Q/15
Phenol +250 KTAAcetone +155 KTA
97%
CAPEX 345 M$
TOCGC PlantImprovement Project
Target COD: 3Q/15
EOE +90 KTA
85%
CAPEX 94.2 M$
Aromatics 2Debottlenecking
Project
Target COD: 4Q/15
PX +115 KTABZ +35 KTAOX +20 KTA
76%
CAPEX 128.8 M$
*
*19 45 68 83 86 86
156 129 86 74 14 13
35 38 149 149
149 149 21 0.3
75 108
108 108 231
211
378 414
357 356
2013A 2014A 2015 2016 2017 2018
Operational Excellence Marketing Excellence Synergy Excellence
Additional Synergy Debottleneck Total
Core UpliftPrograms
2015Target(MUSD)
1Q/15Actual(MUSD)
FY2015Estimate
(MUSD)
Synergy Excellence 149 11 35
Marketing Excellence 86 26 112
Operational Excellence
68 18 76
Total 303 55 223
8*Updated as of March 2015

World Scale Ethane Cracker• Utilize ethane from shale gas as feedstock• Capacity : 1 MTA Ethylene• Derivatives
• HDPE : 700 KTA• MEG : 500 KTA• EO : 100 KTA
• Location : Dilles Bottom, Ohio• Capex: Approx. US$ 5.7 Billion
9
Petrochemical Complex
1-STEP ADJACENCIES: US Petrochemical Complex
Timeline
• Investment cost justify investment return• Enough ethane capacity with capped price• Partner can distribute products in N. America
Key Criteria for FID
FEED Selection
Dual-FEED Contractor Selection
FID3Q/16
COD4Q/20
BOD approvedFEED StudyMar, 2015
CHECK POINTS
Construction

Site Location: Ohio’s Key Advantages
1-STEP ADJACENCIES: US Petrochemical Complex
Close to feedstock supply• Site location is in the center of ethane
network with nearby fractionation units • Allowing the project to utilize existing
pipelines and provide flexibility for ethane delivery
• Pipelines in this region are mostly newly built with less than 2 years of use.
Availability and Quality of Workforce• 90,000 local skilled workers in Ohio• JobsOhio with the construction trades and
educational system will deliver the required workforce.
: organization promoting job creation and economic development of Ohio• JobsOhio offers an aggressive incentive package
for the Project i.e. state job creation tax credits, workforce training grants, infrastructure improvement grants, and local tax credits
Accessible by railway/ highway/ waterwayReadiness of infrastructure and utilityClose to demand: (% of total US & Canada)
• HDPE: 55% (4,500 KTA)• MEG: 65% (1,400 KTA)
10

1-STEP ADJACENCIES: US Petrochemical Complex
Feedstock
• Discussed with 9 potential upstream and midstream
suppliers with volume of 2.3-3.4 MTA of ethane
which exceeds required volume of 1.25 MTA
• Expected ethane supply contract tenor of 10-20
years.
• Aim to cap ethane price with ceiling
Partner
Partner Selection Criteria • Trader / Marketing Expertize• Product Offtaker• Local connection & PracticePTTGC is working with 6 selected potential partners
Funding
PTTGC is talking to potential lenders in Thailand and study funding scheme in the US in parallel
Technology
Cracker : Stone & Webster• Stone & Webster has the highest number of
projects and capacity share for the new project in US.
HDPE : INEOS Group Limited (INEOS)• INEOS technology can produce products that
fit to US market and has market share in N.America.
EOEG : Scientific Design (SD)• PTTGC has long experience in SD technology
in Thailand.
As a result of 73 customer visits in 2014, all customers are willing to buy from us.• PE visits covered > 30% of US demand
(42 visits)• EOEG visits covered > 80% of US demand
(31 visits)Product suppliers in NE America
Marketing
HDPE MEG
PTTGC, Shell, BraskemCombined Capacity 2,450 KTA (60% of NE demand)
PTTGC
11

1-STEP ADJACENCIES: Petrochemical Complex in Indonesia
Refinery Upgrading Project Petrochemical Complex Project
Potential Partner
Feedstock from Balongan Refinery
UpdatesPERTAMINA and partner is determining size and configuration of Refinery upgrade/expansion
• Availability of petrochemical feedstock from refinery expansion
• Configuration and product yield of the expansion• Domestic demand of refined product
HDPE
LDPE
EO/EG
PP
BD
MTBE
300 KTA
400 KTA
460 KTA
544 KTA
125 KTA
116 KTA
Pre
limin
ary
Co
nfi
gura
tio
n
Pygas 373 KTA
Naphtha based
cracker
1.5 MTA
Existing Capacity
Expanding Capacity
Feedstock Required
Naphtha : 2.25 MTALPG : 0.6 MTA
Refinery Capacity125 KBD
Balongan Refinery Expansion + Petrochemical Complex• Consider collaboration to integrate Balongan Refinery with
petrochemical complex• PERTAMINA and a partner is looking to upgrade/expand its
Balongan refinery
12
2015 2016
PID by end of 2015
2022
COD
2017
FID by2Q/17

PO / POLYOL Project• Location : Rayong, Thailand• Capacities• PO : 200 KTA• Polyols & System house : 100-150 KTA• CAPEX ~ 1 billion USD• Target COD : 4Q/19
Update:• Finalizing HOA agreement with partner• Feasibility study
2015 2016
Set up JV company
2019
End 2016 Approve for Construction
COD 4Q/19
PO
/Po
lyo
l
TDI
HDI
PO(Propylene Oxide)
System House
FormulationPolyols(Polyether
Polyols)
1-STEP ADJACENCIES PU Chain: PO/Polyols
EO(Ethylene Oxide)
TDI Major Applications
HDI Major Applications
13

1-STEP ADJACENCIES PU Chain: Vencorex
VENCOREX ThailandHDI derivatives plant in Thailand• Capacity: 12 KTA• CAPEX : 40 M.Euro• Target COD : 4Q/15• Construction Status : 71.6%Marketing
• Existing customers of Vencorex France in Asia approx. 8% of Asia Pacific Market• Seek new customers through premarketing by increasing direct sales especially with key accounts • HDI in Asia growth at 6% per annum
VENCOREX France• TDI conversion to world-scale HDI monomer• Capacity: 70 KTA• CAPEX : 17 M.Euro• Target COD : 2Q/16
2015 2016
COD 2Q/16End 1Q/16S/D to tie in
Update:• Ordered long lead item
HD
I De
riva
tive
sH
DI
Mo
no
mer
TDI
Sustaining strong TDI customer base in Europe• Maximize special grade TDI (raffinate)• Application development i.e. TDI for Coating/ Adhesives/ Sealants/ Elastomers market• Target on direct customers while keeping good connection with worldwide tradersContinue R&D for TDI Process Improvement
VENCOREX USA : Exploring the possibility of HDI derivatives expansion in the US
14

Wastewater
Waste water
Electrical,Steam
Biomass
FertilizerElectrical, Steam
Bio Diesel
GlycerinePlantation
Cogeneration
Palm Oil Crushing mill
BioplasticsBiochemicals
BiofuelsBiogas
Utility
Utility and Waste System
Palm OilPalm Kernel
Methyl EsterFatty Alcohol
Plant
Palm Oil
Fatty Alcohols
Palm-BaseB i o h u b C o n c e p t
GREEN: Bio-Hub Concept
15

Cane Juice / Molasses
Waste water
Electrical, Steam
Baggases
FertilizerElectrical, Steam
Bioplastics/Biochemicals
Biopower
Plantation
Cogeneration
Crushing Mill
BioplasticsBiochemicals
BiofuelsUtility
Electrical Steam
Utility & Waste
Biofuels
Sugar-BaseB i o h u b C o n c e p t
GREEN: Bio-Hub Concept
16

17
Agricultural Feedstock
Fermentation(Lactic Acid)
Monomer/Polymer(Lactide/PLA)
Polymer
(PLA)Application
• Thailand Plant : Integration with Cargill’s Lactic Acid Technology will enable
NatureWorks to invest in second fully integrated PLA Plant located in Thailand,
supporting Thai National BIO-HUB Policy
2nd PLA Plant in Thailand
HLA Backward Integration
GREEN: NatureWorks
Local Feedstock
PLA
Value Chain
• US Plant : Lactic Acid contributes 50-70% of PLA cost, moving upstream to
integrate Lactic Acid supply will increase competitive position; driving PLA
business in a sustainable model

18
• Overview• Strategic Actions Progress• Financial Performance• Market Outlook
AGENDA

Changes in Accounting Standards - PACK 5TFRS 10 & TFRS 11 : Material effect to PTTGC
TAS 27 % of share holding De facto Control
TFRS 10
Equity Method Consolidate
PTTGC is under control of PTTand need to be consolidated
TFRS 10 : Consolidated Financial Statements
TAS 31 Joint Venture Joint Venture
TFRS 11
Proportionate Consolidatedor
Equity Method
Equity Method
TFRS 11 : Joint Arrangements
To use equity method for all joint venture entities
Impact of TFRS 10
Effect to PTTGCo All business combination
between the companies under PTT’s control need to realize at cost
Previous Common Control Transactiono 2006 : BPE, PTTPEo 2011 : PTTCH + PTTARo 2013 : GPSC
Effect to PTTGCo Joint Venture : to apply
equity method instead of previously used proportionate consolidation method
Joint Venture Entitieso TEX (50%)o Emery (50%)o ESC (50%)o NatureWorks (50%)
Effect to Statement of Incomeo Reduction in depreciation
expense (of PPA value)
Effect to Statement of Financial Positiono Reduction in total assets
(PPA & Goodwill)
o Reduction in total equity (deficit in equity)
Effect to Statement of Incomeo Reduction in revenue and
expenseo Increment in share of profit
from investmentso No effect to the Company’s
net profit
Effect to Statement of Financial Positiono Reduction in total assets &
liabilitieso Increment in investment in
joint ventures
Impact of TFRS 11
19

20
Surplus crude pressured Dubai price to decline from averageat 74.4 USD/BBL in 4Q/14 to 51.9 USD/BBL in 1Q/15. As aresult, PTTGC reported Stock Loss & NRV totaling 1,133M.THB in 1Q/15.
FX Gain amounting to 526 M.THB, resulting from slightappreciation in THB against USD from 33.11 THB/USD at theend of 4Q/14 to 32.70 THB/USD at the end of 1Q/15
Average and Ending Dubai Crude Price: USD/BBL
Average and Closing FX : THB/USD
105.5 96.6 104.4 106.1 101.5 74.4 51.9
104.8 109.2
94.6
52.9 53.4
2013 2014 1Q/14 2Q/14 3Q/14 4Q/14 1Q/15
Average Price Closing Price
30.73 32.48 32.66 32.45 32.10 32.71 32.65
32.58 32.60 32.52
33.11 32.70
2013 2014 1Q/14 2Q/14 3Q/14 4Q/14 1Q/15
Average FX Closing FX
BUSINESS ENVIRONMENT AND OPERATIONS RECAP
1Q/15 QoQ YoY
CDU Utilization Rate 102% 1% 1%
Jet - Dubai 17.08 -4% 0%
Diesel - Dubai 16.29 2% -8%
Fuel Oil - Dubai -1.86 67% 78%
GRM on CDU ($/bbl) 7.97 27% 44%
BTX Utilization Rate 89% 26% -2%
PX- Condensate 333 -17% -14%
BZ- Condensate 217 -32% -43%
Market P2F ($/Ton) 219 34% 32%
Olefins Utilization Rate 96% -5% 18%
Polyethylene Utilization Rate 107% -3% 8%
MEG Utilization Rate 108% 5% 44%
HDPE Price 1188 -18% -24%
MEG Price 903 -13% -24%
% Adj. EBITDA Margin 19% -5% -5%

1Q/15 INCOME STATEMENT – CONSOLIDATED
***
1Q/14R** 4Q/14R** 1Q/15 YoY QoQ
MB % MB % MB % MB % MB %
Sales Revenue 141,455 100 121,085 100 99,251 100 (42,204) -30% (21,834) -18%
Feedstock Cost (117,581) (83) (95,112) (79) (75,721) (76) (41,860) -36% (19,391) -20%
Product to Feed Margin 23,874 17 25,973 21 23,530 24 (344) -1% (2,443) -9%
1 Variable Cost (7,062) (5) (7,358) (6) (6,809) (7) (253) -4% (549) -7%
2 Fixed Cost (4,075) (3) (4,039) (3) (3,514) (4) (561) -14% (525) -13%
3 Stock Gain/(Loss) & NRV (567) (0) (13,676) (11) (1,133) (1) (566) -100% 12,543 92%
4 Gain/(Loss) Commodity Hedging 184 0 1,229 1 (188) (0) (372) -202% (1,417) -115%
5 Other Income 990 1 1,421 1 926 1 (64) -6% (495) -35%
6 SG&A (2,413) (2) (3,278) (3) (2,339) (2) (74) -3% (939) -29%
EBITDA 10,931 8 272 0 10,473 11 (458) -4% 10,201 3750%
7 Depreciation & Amortization (3,857) (3) (4,040) (3) (3,979) (4) 122 3% (61) -2%
EBIT 7,074 5 (3,768) (3) 6,494 7 (580) -8% 10,262 272%
Finance Cost (1,176) (1) (1,117) (1) (1,076) (1) (100) -9% (41) -4%
8 FX Gain/(Loss) 617 0 (451) (0) 526 1 (91) -15% 977 217%
9 Shares of profit/(loss) from investments 36 0 (312) (0) 237 0 201 558% 549 176%
10 Income Tax Expense (402) (0) 923 1 (499) (1) 97 24% 1,422 154%
Net Profit 6,149 4 (4,725) (4) 5,682 6 (467) -8% 10,407 220%
Profit/(loss) attributable to:
Owners of the Company 6,320 4 (4,780) (4) 5,631 6 (689) -11% 10,411 218%
Non-controlling interests (171) (0) 55 0 51 0 222 130% (4) -7%
Adjusted EBITDA * 11,498 8 13,948 12 11,606 12 108 1% (2,342) -17%
Note: * Adjusted EBITDA refers to EBITDA excluding impact of inventory value (excludes Inventory gain/(loss) and NRV)
** Restated 1Q/2014 and 4Q/2014 Income Statements from the implementation of new accounting standards (Pack 5)
21

OVERVIEW OF BUSINESS UNITS’ PERFORMANCE
49%
21%
22%
3%6%
Sales Revenue
1Q/15 Revenue and Adjusted EBITDA Structure
99,251 MB 11,606 MB
% Adjusted EBITDA Margin
(Unit: MB) 1Q/14R 4Q/14R 1Q/15YoY
% + /(-)QoQ
% + /(-)
Sales Revenue 141,455 121,085 99,251 -30% -18%
EBITDA 10,931 272 10,473 -4% 3750%
EBITDA Margin (%) 8% 0% 11% 3% 10%
Net Profit 6,320 (4,780) 5,631 -11% 218%
EPS (Baht/Share) 1.40 (1.06) 1.25 -11% 218%
Adjusted EBITDA* 11,498 13,948 11,606 1% -17%
Adjusted EBITDA Margin (%) 8% 12% 12% 4% 0%Note: * Adjusted EBITDA refers to EBITDA excluding impact of inventory value (Inventory gain/(loss) and NRV)
22
25%
16%48%
1%7%
3%
Adjusted EBITDA 1Q/14R 4Q/14R 1Q/15
Business Unit :
Refinery 3 6 6
Aromatics 3 1 13
Olefins and Derivative 24 25 19
Green 8 2 6
HVS 3 6 12
Average 8 12 12

241 236 240 256 240
1,380 1,488 1,544
1,1881,373
27% 27%26%
19%
0%
5%
10%
15%
20%
25%
30%
-
200
400
600
800
1,000
1,200
1,400
1,600
1,800
2012 2013 2014 1Q-15 QTD(10-May-15)
Ethane Flow (Ton/Hr)
EBITDA Margin (%)
HDPE Price ($/Ton)
1Q/15 EBITDA Margin 19%
- HDPE price @ 1,188 $/Ton decreased 23% from avg. 2014 price
- Variable cost (mainly consist of utility and chemical cost) per ton decreased 10% from avg. 2014
2Q/15 Expects EBITDA Margin to increase
- HDPE price is expected to be in the higher level than 2012
- Ethane flow is expected to remain the same level as 2012
Olefins and Derivatives
EBITDA Margin increase
26

STRONG FINANCIAL POSITION
Maturity of Financial Debt* as at Mar. 31, 2015
Interest Rate Currencies
63 % Fixed 55 % THB
37 % Float 45 % USD & Others
Loan Type
• Cost of long term debts ~ 4.59% (Include W/H Tax)
• Average loan life after refinancing - 5.11Years
Treasury policyNet IBD to Equity ratio of ≤ 0.7x Net IBD to EBITDA ratio of ≤ 2.4x
THB Bn
* After Refinance
Key Financial Ratios
Statements of Financial Position
As of Dec. 31, 2014 As of Mar. 31, 2015
THB 385 Bn THB 380 Bn
Cash +STInvestment
CA
Non CA
PPE
Liab.
IBD
ShareHolder’sEquity
6.29.9
15.7
10.78.9
12.710.8
34.6
0.7 0.7
2015 2016 2017 2018 2019 2020 2021 2022 2023 2024
PTTGC PPCL Others
1.30 1.40 1.47
1.97 1.59
0.29 0.31 0.30 0.30 0.23
31 Mar.14
30 Jun.14
30 Sep.14
31 Dec.14
31 Mar.15
Net IBD/EBITDA NET IBD/Equity
12.14% 13.09% 12.16%6.86% 6.40%
8.49% 9.01% 8.36% 5.05% 4.91%
31 Mar.14
30 Jun.14
30 Sep.14
31 Dec.14
31 Mar.15
ROE ROA
28

CAPEX TO SUPPORT GROWTH
193 226 251 252
228 242 251
17532
38 24
325
280 262
4736
19
3658
66
6 1
26
39 7
738
614 616
389
263 248 251
545
387365
138
366 1
2013A 2014A 2015 2016 2017 2018 2019
Green
1-step
Core uplift
Phenol
Annual Maintenance
Total
Total Growth Project
Approved CAPEX Plan 2015 -2019*
Unit: USD mn
Uncommitted 5 Years Investment CAPEX
$1 Bn secured from USDBond issued in Sep’12
Green
5%
64%
1-StepAdjacencies
31%
CoreUplift
$ 4.5 Bn
$ 2.5 BnCash Flow
FromOperation
$ 2 BnDebt
Financing
29
*FX = 30 THB/USD

30
• Overview• Strategic Actions Progress• Financial Performance• Market Outlook
AGENDA

2015 Market OutlookCrude price in improve in short term with high volatility
– Crude demand/supply will be more balanced from growing demand during low oil price with slower U.S. crude output, however, record high of crude net long position
– Expect Dubai crude to increase in 2H/15 to 64 $/bbl at the end of the year.
Aromatics margins slightly improve– Paraxylene still in oversupply however, start up of new capacity maybe delayed. Chinese
regulators are more stringent after Dragon Aromatics’ incident.– Benzene demand improved from low crude oil price, however, higher naphtha crackers
operating rate may increase benzene supply from additional pygas volume.
Polyethylene strong prices from firm demand– Polyethylene market is quite balanced with more demand from emerging market
MEG margin recovers from polyester demand growth– MEG market is more balanced from growing demand from polyester. Low inventory level of
MEG in China.
CONCLUSION & MARKET OUTLOOK
31

32
For further information & enquiries, please contact our Investor Relations Team at [email protected]
Thank You
1 Thitipong Jurapornsiridee VP - Corporate Finance & IR [email protected] +662-265-85742 Puvadol Vasudhara IR Manager [email protected] +662-140-87123 Prang Chudasring IR Analyst [email protected] +662-265-83274 Supika Charudhanes IR Analyst [email protected] +662-265-85335 Chutima Jarikasem IR Coordinator [email protected] +662-1408713