![[Global HR Forum 2014] Policies to Tackle Labour Market Duality in Korea : How Do Youth Start-Ups fit into the Big Picture?](https://static.fdocuments.in/doc/165x107/558cda23d8b42ad6118b4574/global-hr-forum-2014-policies-to-tackle-labour-market-duality-in-korea-how-do-youth-start-ups-fit-into-the-big-picture.jpg)
Opportunities to tackle Britain’s labour market … to tackle...Opportunities to tackle...
31
Opportunities to tackle Britain’s labour market challenges through growth in the circular economy
Transcript of Opportunities to tackle Britain’s labour market … to tackle...Opportunities to tackle...

Opportunities to tackle Britain’s labour market challenges through growth in the circular economy

Contents
Introduction 2
1. Economic arguments around job creation 5
2. Current labour market challenges 9
3. Evidence on the nature of job creation and the circular economy 21
4. The future development of circular economy activities and their labour market requirements 32
5. An indicative quantification of the labour market impacts of growth in the circular economy 43
6. Conclusion 51
Annex 53
Endnotes 54
Green Alliance36 Buckingham Palace Road London SW1W 0RE020 7233 7433
[email protected]: greenallianceblog.org.uktwitter: @GreenAllianceUK
The Green Alliance Trust Registered charity no. 1045395 Company limited by guarantee (England and Wales) no. 3037633Registered at the above address
WRAP21 Horse Fair, Banbury Oxon OX16 0AH01295 819900
[email protected] www.wrap.org.ukblog: wrap.org.uk/blogtwitter:@WRAP_UK
WRAP Registered charity no. 1159512 Company limited by guarantee (England and Wales) no. 4125764 Registered at the above address
Opportunities to tackle Britain’s labour market challenges through growth in the circular economy
by Julian Morgan* and Peter Mitchell**
Green Alliance Green Alliance is a charity and independent think tank focused on ambitious leadership for the environment. We have a track record of 35 years, working with the most influential leaders from the NGO, business, and political communities. Our work generates new thinking and dialogue, and has increased political action and support for environmental solutions in the UK.
*Julian Morgan is Green Alliance’s chief economist.
WRAPWRAP’s mission is to accelerate the move to a sustainable resource efficient economy through reinventing how we design, produce and sell products, rethinking how we use and consume products, and redefining what is possible through recycling and reuse.
It works, uniquely and by design, in the space between governments, businesses, communities, innovative thinkers and individuals – forging partnerships and developing ground-breaking initiatives to help the UK use resources more sustainably.
**Peter Mitchell is head of economics at WRAP.
AcknowledgementsWe thank, without implicating them in our conclusions, the following individuals who participated in the scenario workshop: Susanne Baker, EEF; John Barrett, Leeds University; Dustin Benton and Tamsin Cooper, Green Alliance; Will Blyth, Oxford Associates; Dan Coleman, the Department of Business Innovation and Skills; Gev Eduljee, SITA; Josh Fothergill, IEMA; Ray Georgeson, Resource Association; Roxarne Owen, Business in the Community; Julie Hill; Patrick Mahon, WRAP; and Chris Sherrington, Eunomia.
Published by Green AllianceJanuary 2015ISBN: 978-1-909980-38-9
© Green Alliance, 2015
Green Alliance’s work is licensed under a Creative Commons Attribution-Noncommercial-No derivative works 3.0 unported licence. This does not replace copyright but gives certain rights without having to ask Green Alliance for permission.
Under this licence, our work may be shared freely. This provides the freedom to copy, distribute and transmit this work on to others, provided Green Alliance and WRAP are credited as the authors and text is unaltered. This work must not be resold or used for commercial purposes. These conditions can be waived under certain circumstances with the written permission of Green Alliance. For more information about this licence go to http://creativecommons.org/licenses/by-nc-nd/3.0/

2 3
Introduction
Britain faces huge economic challenges in its use of labour and scarce natural resources. Although unemployment is now falling, the risk of being out of work is higher in some regions and for some types of occupations. While Britain has significantly increased its resource efficiency in recent years, supply risks in an increasingly competitive global economy mean that we need to get better at using natural resources.1 The analysis in this study shows that these challenges are linked, as improving our resource efficiency can make a valuable contribution to improving Britain’s labour market situation.
One route to improving resource efficiency is to develop what is known as a ‘circular economy’. This involves keeping products and resources in use for as long as possible through recovery, reuse, repair, remanufacturing and recycling.2 In addition to protecting the environment, this potentially offers substantial economic benefits.3 These include greater economic stability through increased resource security and new business and employment opportunities from an expanding sector. This study focuses on the latter aspect and aims to identify the scope for the growth of the circular economy to offer new jobs.
Britain is already experiencing significant labour market challenges, such as persistent high unemployment in some regions and declining employment in mid-level occupations. The labour market exhibits significant regional and occupational mismatch, meaning that available employment opportunities are often not well aligned, either with where the unemployed live, or with the experience they have from their previous occupations. Labour market mismatches are thought to account for around three percentage points of the unemployment rate and are likely to have played a significant role in the rise in unemployment since the start of the financial crisis.4
Unlike many studies in this area, we have not limited our analysis to a simple quantification of the number of jobs that could be created in an expanded circular economy. Although such calculations are useful to give a sense of the employment needs of a growing sector, they are not informative about the opportunity for improving the national labour market situation. They tend to ignore how the growth will interact with other parts of the economy, ie whether new jobs will be genuinely additional and reduce unemployment, or whether they will simply displace existing ones.
Instead, we place the growth of circular economy employment in the broader context of the British labour market. We have considered the regional and occupational patterns of employment in recycling, reuse and remanufacturing activities and how they may develop in the future. We ask, what is the potential to create jobs in high unemployment regions, or in occupations that correspond with the skills of the unemployed? And, what contribution can a growing circular economy make to the phenomenon of declining mid-level occupations?
To answer these questions, we have looked at British labour market trends and drivers and developed three distinct scenarios for the potential expansion of the circular economy to 2030.
The first scenario involves no new initiatives and a very limited increase in the ‘circularity’ of the economy. The second envisages a continuation on the current trajectory, with significant further increases in recycling and remanufacturing likely. Our third scenario is really transformational, with substantial progress in
recycling and remanufacturing, but also major development of the reuse, servitisation and biorefining sectors.
We discussed these scenarios with a group of experts and sought their qualitative assessment of likely labour market impacts, although we retain responsibility for our conclusions.
To illustrate each scenario we undertook quantitative analysis that suggests that growth in the circular economy can be expected to have lasting beneficial effects on the labour market. This is because, whilst these activities tend to be efficient in their use of natural resources, they can be relatively intensive in their use of labour, compared with the activities they replace. They have the capacity to create dispersed employment that could potentially be undertaken by those currently unemployed, or those losing mid-level skilled positions due to industrial change.
Our calculations are based on assumptions, and are illustrative rather than definitive, but we have erred on the side of caution in deriving them. They suggest that by 2030, on the basis of the current development path, the circular economy could create over 200,000 gross jobs and reduce unemployment by about 54,000. It could also have the potential to offset around seven per cent of the expected decline in skilled employment to the year 2022.
More extensive expansion of circular economy activities could more than double these figures, creating around half a million jobs (gross), reducing unemployment by around 102,000, and potentially offsetting around 18 per cent of the expected loss in skilled employment over the next decade.
The report is organised as follows: in the next section we discuss the economic arguments around job creation in a growing sector. We then evaluate the current state of the British labour market and recent developments, identifying where there is scope for creating net jobs or addressing the decline in mid-level jobs. Next, we assess the extent to which the circular economy is already operating in this manner, by reviewing existing evidence of the jobs created in the sector and the available data. Finally, we consider some forward looking scenarios for the development of the circular economy and the qualitative and quantitative implications for the labour market. For a shorter overview of this work and its conclusions, with supporting infographics, see Employment and the circular economy: job creation in a more resource efficient Britain, January 2015, Green Alliance/WRAP.
Scenario one No new initiatives
Scenario two Current development rate
Scenario three Transformation
Gross jobs growth5 31, 000 205, 000 517, 000
Net job creation6 10, 000 54, 000 102, 000
Unemployment rate fall 0.02% 0.15% 0.28%
% offset of predicted decline in skilled employment over the next decade7
1.3% 6.8% 17.7%
Note: Jobs figures are rounded to the nearest 1,000

4
1Economic arguments around job creation
The parameters of our analysis
For the scope of our analysis, we have assumed that the following activities, excluding energy inputs, comprise the circular economy:8
1 Reuse Finished products are worth much more than the raw materials they are composed of and direct reuse preserves the most value and embodied energy in products. For example, a reused iPhone retains around 48 per cent of its original value, whereas its value as recyclate is just 0.24 per cent of its original value.9
2 Closed loop recycling This involves using waste to make new products without changing the inherent properties of the material being recycled. Examples include bottle to bottle or speciality alloy to speciality alloy recycling. It can also cover recycling where the product changes but the quality of the material is maintained, eg a plastic bottle made of polyethylene terephthalate (PET) to a toy made of the same.
3 Open loop recycling Otherwise known as downcycling, this uses recovered materials to create products that have lower value compared to those produced in closed loop recycling, for example turning glass containers into aggregate.
4 Biorefining For industries creating biowaste, biorefining extracts small quantities of valuable materials (such as proteins or speciality chemicals) or converts waste into energy.
5 Repair and remanufacturing Where a product needs repair or reconditioning before it can be used again, remanufacturing preserves the most value. Analysis suggests remanufacturing saves at least 70 per cent of the materials required to manufacture new goods.10
6 Servitisation This refers to any system which increases the effective use of assets. It can include leasing and moving from providing products to services instead, thereby deferring consumption of new assets. Many examples are B2B (business to business), such as Xerox leasing photocopiers and printers, Interface’s carpet business or Philips ‘pay per Lux’, but there are also B2C (business to customer) or even C2C (customer to customer) examples, such as Airbnb, Streetcar and Campinmygarden.com.11
6 7
Job creation
Against this background, we can consider how the growth of the circular economy might create net jobs in the short and the long term.15
In the short term, if unemployment is above the NAIRU then a growing sector may help speed the adjustment towards the natural rate and create additional jobs, for a period of time. However, it would not permanently raise employment as market forces should eventually have returned unemployment to its natural rate anyway.
A key question is how short is the short term? If the market forces driving the return to the NAIRU are strong, then the short term may indeed be short, perhaps up to one to two years. By contrast, if these equilibrating mechanisms are weak, then it may take many more years before unemployment returns to the NAIRU. Hence, even short term net job creation may offer significant benefits for a substantial period of time.
In the long term, the only way a growing sector can permanently create net jobs is if it can lower the NAIRU. There is a wide literature on the determinants of the NAIRU, with economists emphasising the importance of factors such as collective bargaining, employment regulations, social security and terms of trade.16
Labour market mismatch
‘Structural mismatch’ is a factor that is often cited and occurs if there are differences in the characteristics of the unemployed and the available jobs. There can be a number of dimensions to this, with particular emphasis on geographical mismatch, eg unemployment in the north, vacancies in the south; or skills mismatch, eg high skill vacancies and low skill unemployed.
It is interesting why such mismatches emerge and then persist in the British labour market and there are a range of possible explanations. It is often thought that demand shocks, stemming from changes in industrial composition, technology and international competition have played an important role in reducing employment in some industries, occupations and regions, whilst expanding other types of employment. At the risk of over simplification, the decline of heavy industry has adversely affected factory workers in the north, while the rise of services and finance has benefited white collar workers in the south.
The obvious mechanisms to counter this mismatch: inter-regional migration, retraining, adjustments in regional wages, appear to work too slowly to prevent a prolonged period of imbalance in regional or occupational unemployment. A large range of possible factors have been suggested as causes for such sluggish adjustment: from a dysfunctional housing market, making it harder for people to relocate, to labour market institutions, such as limited regional variation in collectively agreed pay, social security and public sector pay, preventing wages from falling in high unemployment areas.
Some research in this area finds that mismatch has had a significant role in UK unemployment and its increase since the start of the financial crisis. One study finds that around three percentage points of the UK unemployment rate can be down to
In common with many other sectors of the economy, there have been a significant number of studies which report the potential for greater resource efficiency to create employment.12 Most studies report gross job creation in the circular economy, but obtaining an estimate of net job creation is more challenging.
A new sector will inevitably displace some employment in other sectors, either via the product market (with purchasing power shifted away from other products) or via the labour market, with the new sector out competing other sectors for the limited pool of suitably qualified labour. As a consequence net job creation will be lower than gross job creation and may even be non-existent or negative.13
These labour market interactions are typically given the least consideration, yet this aspect raises a number of important issues relating to how the labour market works, and how it fits into the macro-economy, an area of considerable debate among economists. To illustrate this, it is worth taking a small detour into labour market economics, starting with the neoclassical concept of a ‘natural rate of unemployment’.
The natural rate of unemployment
According to economic theory, the natural rate is the lowest level of unemployment which can be sustained over a long period of time. This is not zero (ie literally full employment) as some degree of labour market slack is seen as inevitable for two reasons. The first is that, even in boom times, there is always some ‘frictional unemployment’ to account for people shifting between jobs. The second is a more economic concept, in that low levels of unemployment are linked with upward pressure on wages and thereby, also inflation.
The term ‘natural rate of unemployment’ is not widely used in popular discourse with many commentators preferring the less abrasive term ‘structural unemployment’ or the most widely used notion of a ‘non-accelerating inflation rate of unemployment’, or NAIRU (which we will use from now on).14 Typical estimates of the NAIRU in Britain are around five per cent and this is what UK unemployment had been for much of the decade before the recent financial crisis. The idea is that it would be possible to cut unemployment to about five per cent but, if we tried to reduce unemployment below this level, we would encounter strong inflationary pressure. This would require a tightening of monetary policy (usually higher interest rates) which would cool the economy and return unemployment to the NAIRU.
The notion of a natural rate or a NAIRU is challenged by some, mainly Keynesian, economists who see the economy as potentially being stuck with a permanent deficiency in demand and substantial involuntary unemployment. If this is the case, then there may be considerable scope for a growing sector to contribute to reducing unemployment and creating net jobs.
It is probably fair to say that most mainstream economists, while recognising the potential for cyclical unemployment in the short run, would question how long an economy can remain demand deficient and believe that market forces would ultimately drive unemployment to its NAIRU. This would appear to leave little scope for any growing (or shrinking) sector to have any lasting impacts on overall employment and thereby create ‘net jobs’.

8
2Current labour market challenges
labour market mismatch, while another finds that up to a third of the rise in unemployment since the start of the crisis could be down to this factor. 17,18
If the circular economy could help to address regional or skills mismatches, it could reduce the NAIRU and create lasting net jobs, over and above any short term gains. This may be the case as circular economy activities are often seen as intrinsically localised and may create geographically dispersed employment, and many jobs may require low to intermediate skill levels.
If this is true, which we test later in the report, the growth of the circular economy could (partially) offset past, ongoing or future adverse demand shocks, which have particularly affected some regions or occupations. In essence, housing and labour market rigidities may have prevented the labour market from adjusting, but the growth of the circular economy could cut unemployment by reducing the need for such adjustment in the first place.
The decline in mid-level occupations
A potential ‘emerging mismatch’ relates to the decline in mid-level occupations. The importance of the changing composition of jobs in the UK has been given considerable attention by the Resolution Foundation.19 Its analysis suggests that changes in the nature of work are leading to losses of mid-level jobs, such as those in skilled trades or plant and machinery operatives, and a polarisation of the labour market into low skilled and low paying, and high skilled and high paying jobs such as managerial or professional posts. This effect is often referred to as a ‘hollowing out’ of the labour market. A variety of factors may be at work, including technological developments and competition from developing countries removing mid-level jobs
With this is mind, it is interesting to explore how the development of the circular economy might affect this dynamic, potentially offsetting or accelerating it. Hence, we first consider the extent to which there has been a decline in mid-level occupations in Britain and then examine the likelihood of the circular economy creating employment for this segment of the labour market.
In common with the rest of the economy, the circular economy is likely to supply a range of jobs requiring differing education and training and differing levels of remuneration. The question is whether the circular economy is likely to be any different in the spread of jobs that will be created. For instance, will it offer predominantly unskilled lower paid employment, or will it create better paid jobs requiring greater education and training?

10 11
which is currently 22.1 per cent in Britain. Whilst this will pick up the discouraged workers, it will also include those that are unlikely to work even if there were opportunities. Across Britain around a quarter of the economically inactive indicate that they want a job, implying that this hidden unemployment could add around five percentage points to the unemployment rate. As the table shows, the former industrial regions and London tend to report higher rates of inactivity, with the North East, North West and West Midlands all reporting inactivity rates of around 24 per cent.
Regional labour market slack It is interesting to consider how such a dispersion of regional unemployment rates fits with the concept of the NAIRU discussed in the previous section. One possibility is that, once unemployment falls too low in a significant region of the economy, it could set in train inflationary pressures across the whole economy, even when unemployment remains high in other regions. At this point the Bank of England would be expected to tighten monetary policy leading to lower growth and reduced job creation across the whole country.
It is often thought that London and the South East are the dominant economic regions of the country and the part of the economy likely to overheat first. If these regions have less labour market slack they are more likely to see acceleration in wage growth which feeds into overall inflation. This may trigger higher UK interest rates, choking off employment growth in all regions, including those with higher unemployment. Hence, unemployment in the north might never fall low enough to create upward wage pressure in that region and would remain structurally higher than the rest of the country.
If this ‘dominant region’ approach to the natural rate is correct, then it could be the case that the NAIRU is actually the same across all regions and that the regional ‘excess’ unemployment would be the difference between the current unemployment rate and the national natural rate. For instance, in the case of the north east, the current regional unemployment rate is 9.3 per cent and, for a natural rate of five per cent, this would imply excess unemployment of around 4.3 per cent. At the other extreme, the South East and South West both have unemployment rates of a little under five per cent, implying no excess unemployment.
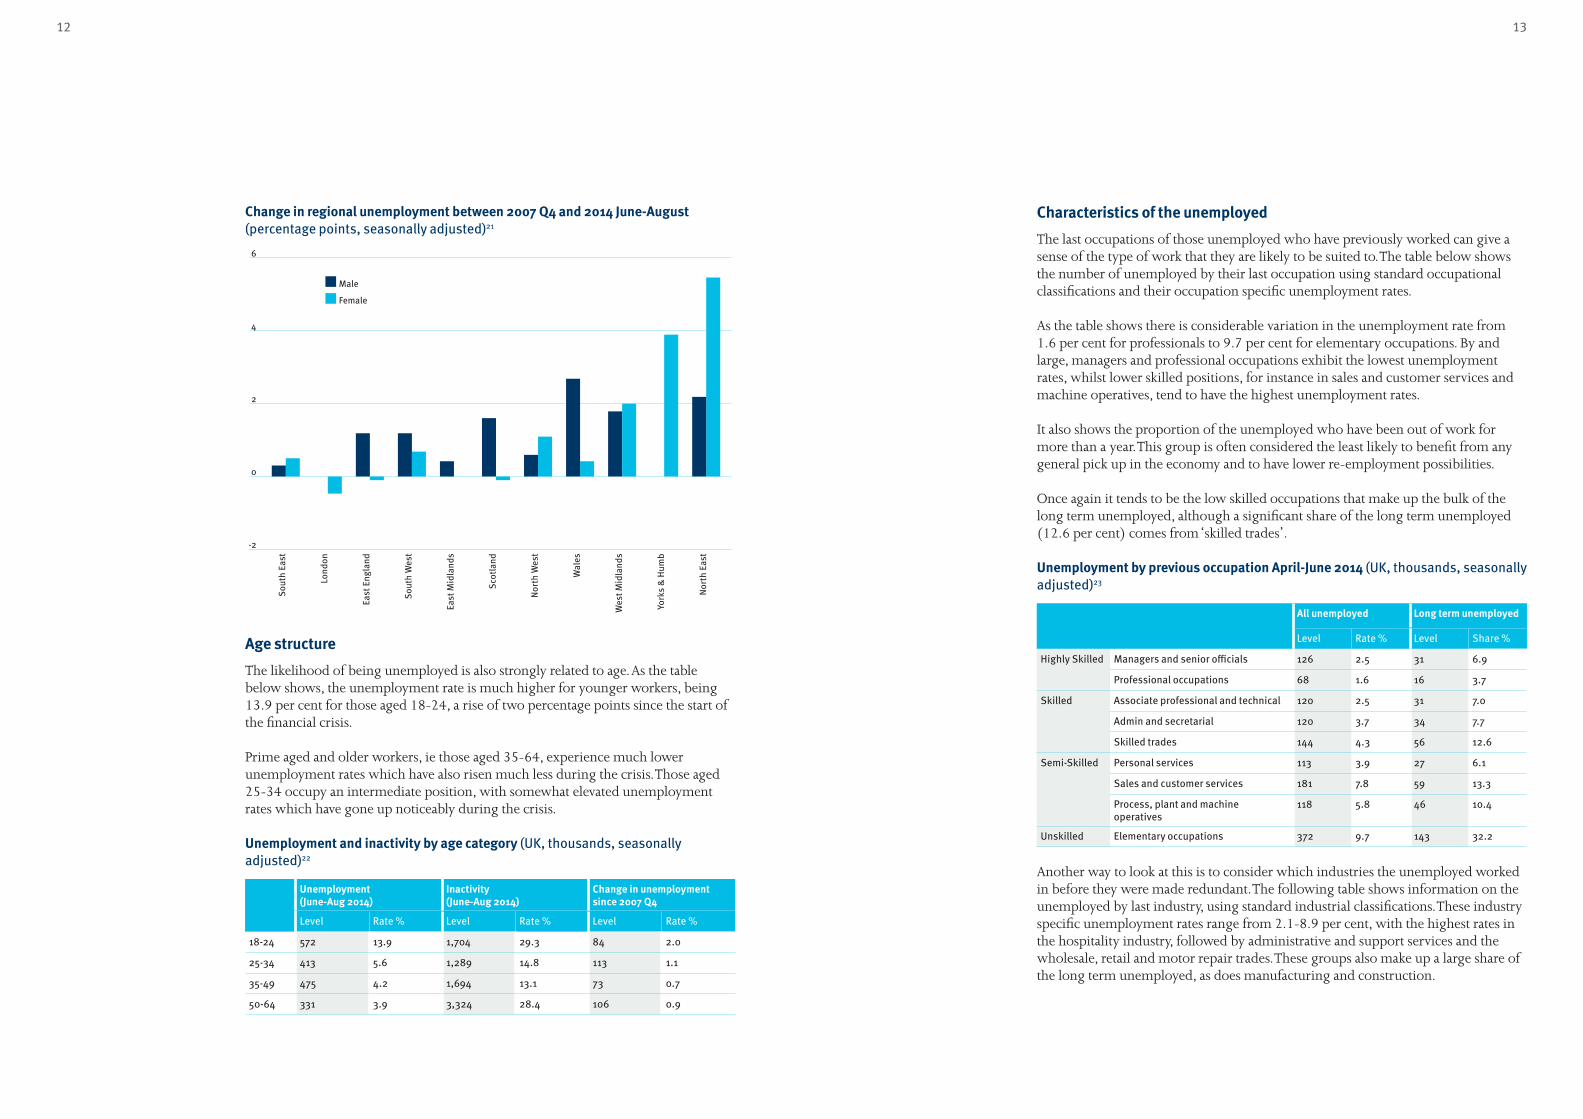
An alternative approach would be to expect that the NAIRU might vary across regions. If this were the case, the change in unemployment, since the last time the national unemployment was around five per cent, might provide the best measure of slack in a region. The implicit assumption here is that if the national unemployment rate is at the NAIRU, then the regional pattern of unemployment rates may also reflect a regional variation in the NAIRU. The last time the national unemployment rate was around five per cent was just before the intensification of the financial crisis in the last quarter of 2007. The following graph shows how much male and female unemployment has changed across the regions over the past seven years. The sharpest rises have been in the North East, Yorkshire and the Humber and the West Midlands.
To shed some light on the scope for net job creation or the ability to address the decline in mid-level jobs, we have reviewed the state of the British labour market along a number of dimensions. These include: the dispersion of labour market outcomes across regions; differing characteristics of the unemployed; which types of industries are hiring and firing; which types of jobs are being created and lost; and how earnings vary across the economy.
A regional dimension
In the summer of 2014 the average unemployment rate was six per cent of the labour force. As the third column of the table below shows, there is substantial variation in the unemployment rate across British regions. Unemployment remains substantially higher in the former industrial heartlands of the North East (9.3 per cent), West Midlands (7.5 per cent), Yorkshire and Humber (seven per cent), and the North West (6.7 per cent). Unemployment is also above the national average in London (6.6 per cent).
Headline estimates for June to August 2014 (thousands, seasonally adjusted)20
Economically active Employment Unemployment Economically inactive
Aged 16+
Aged 16-641
Aged 16+
Aged 16-642
Aged 16+
Aged 16-642
Aged 16-64
Aged 16-641
Level Rate % Level Rate % Level Rate % Level Rate %
North East 1,283 76.2 1,164 69.0 119 9.3 392 23.8
North West 3,503 75.7 3,269 70.6 233 6.7 1,091 24.3
Yorkshire and the Humber
2,694 77.7 2,505 72.1 189 7.0 750 22.3
East Midlands 2,342 78.3 2,214 73.9 128 5.5 628 21.7
West Midlands 2,766 75.6 2,559 69.7 207 7.5 862 24.4
East of England 3,112 80.9 2,959 76.8 152 4.9 706 19.1
London 4,596 77.3 4,295 72.1 301 6.6 1,313 22.7
South East 4,609 80.4 4,393 76.5 215 4.7 1,072 19.6
South West 2,740 80.0 2,613 76.2 127 4.6 656 20.0
England 27,645 78.1 25,971 73.3 1,673 6.1 7,469 21.9
Wales 1,457 73.7 1,363 68.8 94 6.5 503 26.3
Scotland 2,762 78.3 2,611 73.9 151 5.5 739 21.7
Great Britain 31,864 77.9 29,946 73.1 1,918 6.0 8,712 22.1
However, the unemployment rate can only provide limited information on the extent to which there is under-utilised labour available; it only captures people who were not working in a given period, but were available and actively seeking work (following a standard definition from the International Labour Organisation). It will exclude people who have given up looking for work, as they perceive a lack of opportunities (discouraged workers). Therefore, the unemployment rate is very likely to underestimate the degree of labour market slack.
A broader measure of labour market slack, is the proportion of the working age population who are not in employment and are said to be ‘economically inactive’
12 13
Characteristics of the unemployed
The last occupations of those unemployed who have previously worked can give a sense of the type of work that they are likely to be suited to. The table below shows the number of unemployed by their last occupation using standard occupational classifications and their occupation specific unemployment rates.
As the table shows there is considerable variation in the unemployment rate from 1.6 per cent for professionals to 9.7 per cent for elementary occupations. By and large, managers and professional occupations exhibit the lowest unemployment rates, whilst lower skilled positions, for instance in sales and customer services and machine operatives, tend to have the highest unemployment rates.
It also shows the proportion of the unemployed who have been out of work for more than a year. This group is often considered the least likely to benefit from any general pick up in the economy and to have lower re-employment possibilities.
Once again it tends to be the low skilled occupations that make up the bulk of the long term unemployed, although a significant share of the long term unemployed (12.6 per cent) comes from ‘skilled trades’.
Unemployment by previous occupation April-June 2014 (UK, thousands, seasonally adjusted)23
All unemployed Long term unemployed
Level Rate % Level Share %
Highly Skilled Managers and senior officials 126 2.5 31 6.9
Professional occupations 68 1.6 16 3.7
Skilled Associate professional and technical 120 2.5 31 7.0
Admin and secretarial 120 3.7 34 7.7
Skilled trades 144 4.3 56 12.6
Semi-Skilled Personal services 113 3.9 27 6.1
Sales and customer services 181 7.8 59 13.3
Process, plant and machine operatives
118 5.8 46 10.4
Unskilled Elementary occupations 372 9.7 143 32.2
Another way to look at this is to consider which industries the unemployed worked in before they were made redundant. The following table shows information on the unemployed by last industry, using standard industrial classifications. These industry specific unemployment rates range from 2.1-8.9 per cent, with the highest rates in the hospitality industry, followed by administrative and support services and the wholesale, retail and motor repair trades. These groups also make up a large share of the long term unemployed, as does manufacturing and construction.
Change in regional unemployment between 2007 Q4 and 2014 June-August (percentage points, seasonally adjusted)21
-2
0
2
4
6
Sout
h Ea
st
Lond
on
East
Eng
land
Sout
h W
est
East
Mid
land
s
Scot
land
Nor
th W
est
Wal
es
Wes
t Mid
land
s
York
s &
Hum
b
Nor
th E
ast
Male
Female
Age structure
The likelihood of being unemployed is also strongly related to age. As the table below shows, the unemployment rate is much higher for younger workers, being 13.9 per cent for those aged 18-24, a rise of two percentage points since the start of the financial crisis.
Prime aged and older workers, ie those aged 35-64, experience much lower unemployment rates which have also risen much less during the crisis. Those aged 25-34 occupy an intermediate position, with somewhat elevated unemployment rates which have gone up noticeably during the crisis.
Unemployment and inactivity by age category (UK, thousands, seasonally adjusted)22
Unemployment (June-Aug 2014)
Inactivity (June-Aug 2014)
Change in unemployment since 2007 Q4
Level Rate % Level Rate % Level Rate %
18-24 572 13.9 1,704 29.3 84 2.0
25-34 413 5.6 1,289 14.8 113 1.1
35-49 475 4.2 1,694 13.1 73 0.7
50-64 331 3.9 3,324 28.4 106 0.9
14 15
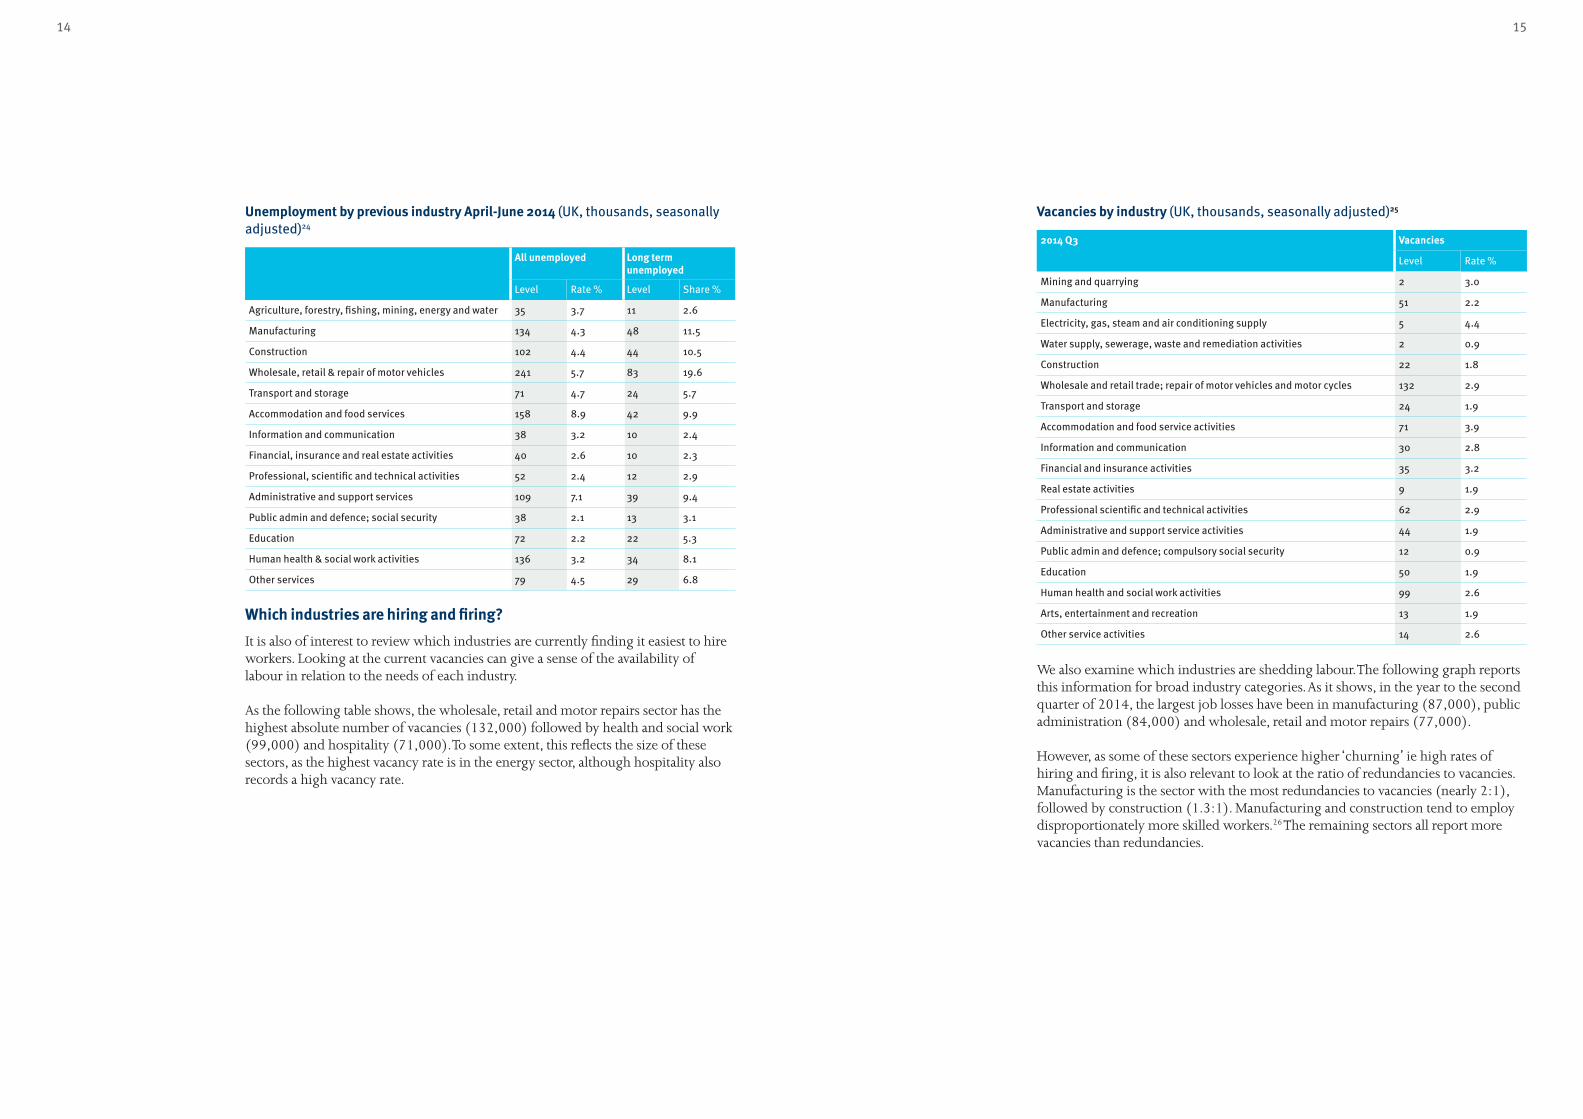
Vacancies by industry (UK, thousands, seasonally adjusted)25
2014 Q3 Vacancies
Level Rate %
Mining and quarrying 2 3.0
Manufacturing 51 2.2
Electricity, gas, steam and air conditioning supply 5 4.4
Water supply, sewerage, waste and remediation activities 2 0.9
Construction 22 1.8
Wholesale and retail trade; repair of motor vehicles and motor cycles 132 2.9
Transport and storage 24 1.9
Accommodation and food service activities 71 3.9
Information and communication 30 2.8
Financial and insurance activities 35 3.2
Real estate activities 9 1.9
Professional scientific and technical activities 62 2.9
Administrative and support service activities 44 1.9
Public admin and defence; compulsory social security 12 0.9
Education 50 1.9
Human health and social work activities 99 2.6
Arts, entertainment and recreation 13 1.9
Other service activities 14 2.6
We also examine which industries are shedding labour. The following graph reports this information for broad industry categories. As it shows, in the year to the second quarter of 2014, the largest job losses have been in manufacturing (87,000), public administration (84,000) and wholesale, retail and motor repairs (77,000).
However, as some of these sectors experience higher ‘churning’ ie high rates of hiring and firing, it is also relevant to look at the ratio of redundancies to vacancies. Manufacturing is the sector with the most redundancies to vacancies (nearly 2:1), followed by construction (1.3:1). Manufacturing and construction tend to employ disproportionately more skilled workers.26 The remaining sectors all report more vacancies than redundancies.
Unemployment by previous industry April-June 2014 (UK, thousands, seasonally adjusted)24
All unemployed Long term unemployed
Level Rate % Level Share %
Agriculture, forestry, fishing, mining, energy and water 35 3.7 11 2.6
Manufacturing 134 4.3 48 11.5
Construction 102 4.4 44 10.5
Wholesale, retail & repair of motor vehicles 241 5.7 83 19.6
Transport and storage 71 4.7 24 5.7
Accommodation and food services 158 8.9 42 9.9
Information and communication 38 3.2 10 2.4
Financial, insurance and real estate activities 40 2.6 10 2.3
Professional, scientific and technical activities 52 2.4 12 2.9
Administrative and support services 109 7.1 39 9.4
Public admin and defence; social security 38 2.1 13 3.1
Education 72 2.2 22 5.3
Human health & social work activities 136 3.2 34 8.1
Other services 79 4.5 29 6.8
Which industries are hiring and firing?
It is also of interest to review which industries are currently finding it easiest to hire workers. Looking at the current vacancies can give a sense of the availability of labour in relation to the needs of each industry.
As the following table shows, the wholesale, retail and motor repairs sector has the highest absolute number of vacancies (132,000) followed by health and social work (99,000) and hospitality (71,000). To some extent, this reflects the size of these sectors, as the highest vacancy rate is in the energy sector, although hospitality also records a high vacancy rate.
16 17
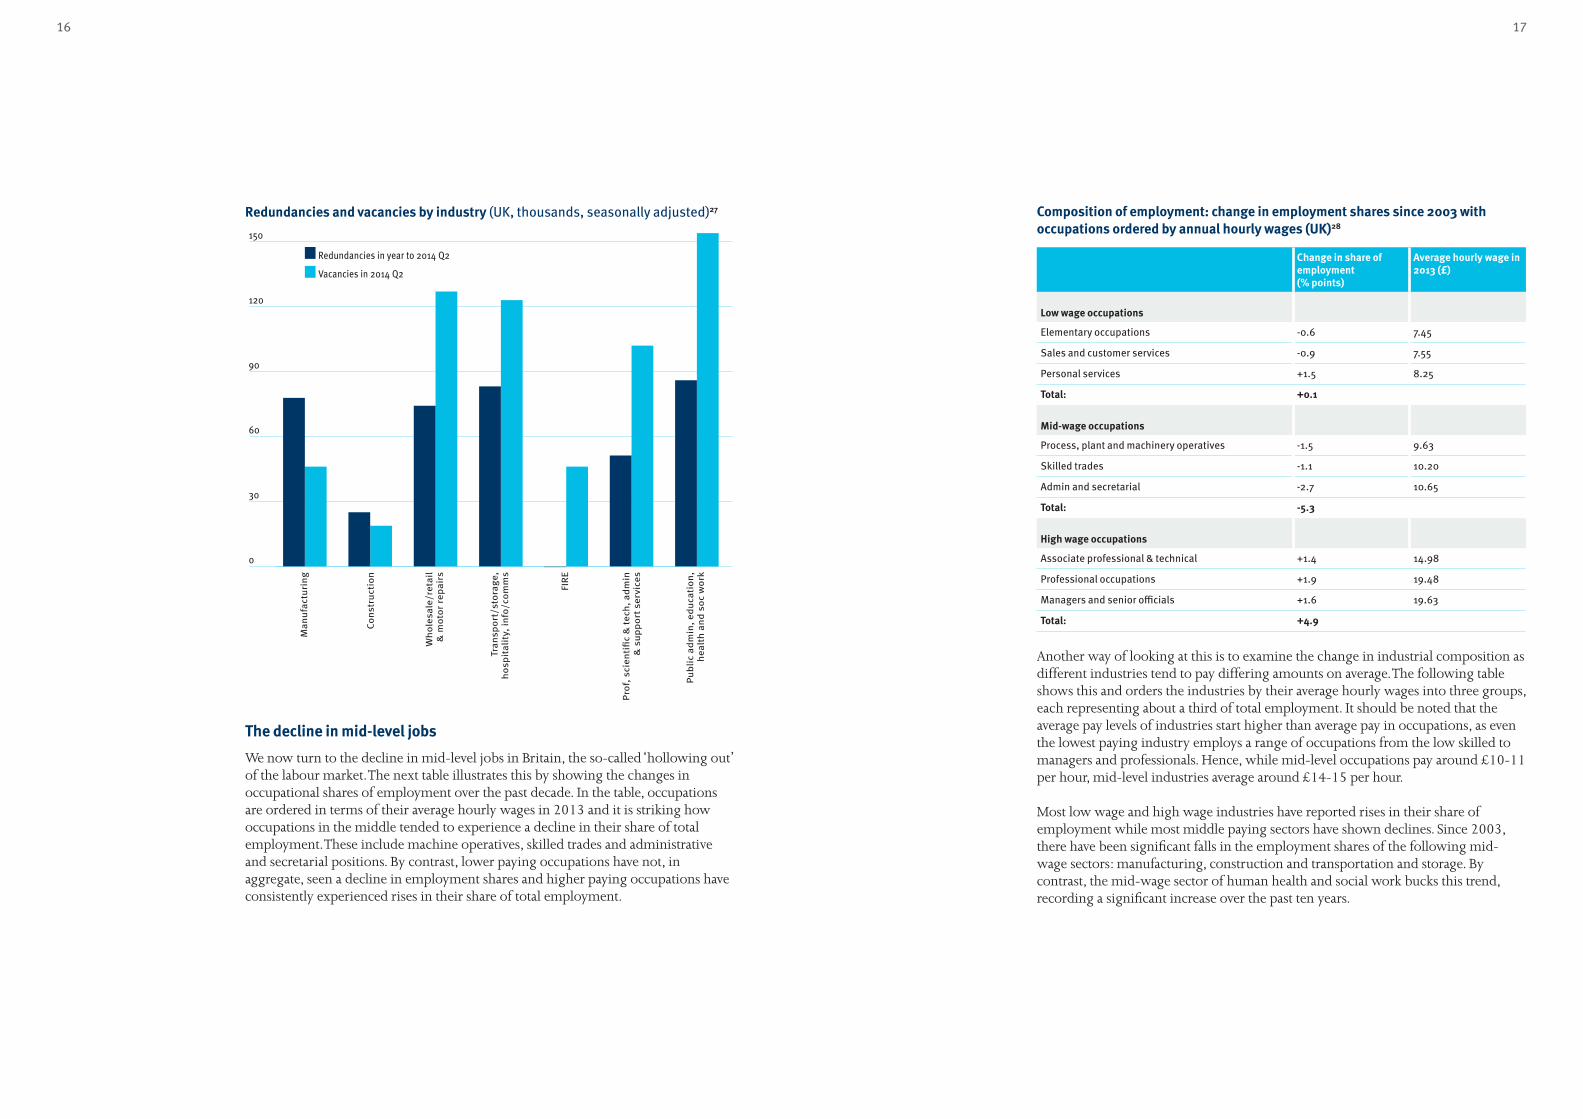
Composition of employment: change in employment shares since 2003 with occupations ordered by annual hourly wages (UK)28
Change in share of employment (% points)
Average hourly wage in 2013 (£)
Low wage occupations
Elementary occupations -0.6 7.45
Sales and customer services -0.9 7.55
Personal services +1.5 8.25
Total: +0.1
Mid-wage occupations
Process, plant and machinery operatives -1.5 9.63
Skilled trades -1.1 10.20
Admin and secretarial -2.7 10.65
Total: -5.3
High wage occupations
Associate professional & technical +1.4 14.98
Professional occupations +1.9 19.48
Managers and senior officials +1.6 19.63
Total: +4.9
Another way of looking at this is to examine the change in industrial composition as different industries tend to pay differing amounts on average. The following table shows this and orders the industries by their average hourly wages into three groups, each representing about a third of total employment. It should be noted that the average pay levels of industries start higher than average pay in occupations, as even the lowest paying industry employs a range of occupations from the low skilled to managers and professionals. Hence, while mid-level occupations pay around £10-11 per hour, mid-level industries average around £14-15 per hour.
Most low wage and high wage industries have reported rises in their share of employment while most middle paying sectors have shown declines. Since 2003, there have been significant falls in the employment shares of the following mid-wage sectors: manufacturing, construction and transportation and storage. By contrast, the mid-wage sector of human health and social work bucks this trend, recording a significant increase over the past ten years.
Redundancies and vacancies by industry (UK, thousands, seasonally adjusted)27
0
30
60
90
120
150
Man
ufac
turi
ng
Cons
truc
tion
Wh
oles
ale/
reta
il &
mot
or r
epai
rs
Tran
spor
t/st
orag
e, h
ospi
talit
y, in
fo/c
omm
s
FIR
E
Prof
, sci
enti
fic
& te
ch, a
dm
in &
sup
port
ser
vice
s
Publ
ic a
dm
in, e
duc
atio
n, h
ealt
h a
nd s
oc w
ork
Redundancies in year to 2014 Q2
Vacancies in 2014 Q2
The decline in mid-level jobs
We now turn to the decline in mid-level jobs in Britain, the so-called ‘hollowing out’ of the labour market. The next table illustrates this by showing the changes in occupational shares of employment over the past decade. In the table, occupations are ordered in terms of their average hourly wages in 2013 and it is striking how occupations in the middle tended to experience a decline in their share of total employment. These include machine operatives, skilled trades and administrative and secretarial positions. By contrast, lower paying occupations have not, in aggregate, seen a decline in employment shares and higher paying occupations have consistently experienced rises in their share of total employment.

18 19
Future labour market trends
The future of the British labour market is the subject of much discussion in the media, covering the roles of technological development, demographics, competition from emerging economies and general societal trends. The UK Commission on Employment and Skills (UKCES) carries out regular assessments of the prospects for the UK labour market to help the government, employers and education and training providers to plan appropriately for the future. In its last regular assessment of the prospects for the next ten years the UKCES indicated that because of the ageing of the population, it expected the working age population (ie those aged 15-64) to increase much more slowly than the total population. However, as labour force participation was expected to rise and unemployment to fall, the increase in workplace employment would be somewhat faster, albeit still well below the general population increase.30
As regards the structure of work, employment in manufacturing and the primary sector and utilities is expected to shrink. This is expected to be more than offset by growth in the construction sector and the service sector in general. As regards occupations, in general the fastest growth was expected for senior managers and professional occupations. Rapid growth was also expected for caring and personal service occupations, reflecting the ageing of the population. Large falls were expected for some mid-level administrative occupations, some skilled trades and semi-skilled occupations such as machine operatives.
In addition to providing a ten year projection, the UKCES have also undertaken scenario analyses of possible future paths for the UK labour market.31 In this work they identified the key trends shaping UK jobs and skills requirements in the coming decades. These trends affected the way the economy and business operate, technology, social factors, the environment and public finances, as shown overleaf.
Composition of employment: change in employment shares since 2003 with industries ordered by average hourly wages (UK)29
Change in share of employment (% points)
Average hourly wage in 2013 (£)
Low wage sectors
Accommodation and food service activities +0.8 8.56
Agriculture, forestry and fishing +0.4 10.34
Administrative and support service activities +0.3 11.69
Wholesale and retail trade; repair of motor vehicles and motorcycles
-1.9 12.00
Other service activities +0.3 13.20
Total -0.2
Mid-wage sectors
Transportation and storage -0.9 14.19
Real estate activities +0.4 14.59
Human health and social work activities +1.9 14.70
Manufacturing -3.0 14.86
Construction -0.6 15.09
Total -2.0
High wage sectors
Public administration and defence; compulsory social security
-0.7 15.99
Education +1.3 16.20
Mining, energy and water supply +0.4 18.53
Professional, scientific and technical activities +0.9 19.75
Information and communication +0.3 20.27
Finance and insurance activities -0.7 24.74
Total 1.4

20
3Evidence on the nature of job creation and the circular economy
Overview of trends shaping UK jobs and skills32
Changed economic perspectives/organisational structures in business
Global economic power shifting to Asia
Local level is characterised by reduction of household income in real terms
New business ecosystems; companies increasingly defined as “ network orchestrators”
Change in work environment
Technological growth and expansion
Digitisation of production opens the path to a new era of industrialisation
Information and communication technology (ICT) development
Converging technologies and cross disciplinary skills
Social factors
Workplaces will become multigenerational with four generations working together
Migration could be the key to alleviate skills shortage
Traditional gender roles changing rapidly and growing diversity in the labour force
Work-life balance
Environment
Natural resources increasingly scarce, increased demand of raw materials, prices more volatile
Public finance
Fiscal pressure from growing social burden, transfer payments and pensions
The UKCES baseline scenario envisages moderate growth up to the middle of the 2020s, as the economy recovers from the financial crisis but is, nevertheless, subject to ongoing volatility. This volatility, along with increased international competition, drives increased flexibility of business and employment.
The middle tier of the labour market is expected to shrink dramatically, while low skilled workers face increased competition. UKCES also developed alternative scenarios which envisaged (a) faster growth driven by high tech industries, but greater inequality, (b) technological development eliminating a lot of white collar jobs and (c) economic stagnation, leading to emigration from Britain.

22 23
Resource flows in the UK economy in 2000 and 201033
0
200
400
600
800
2000 2010
Resources wasted
Resources recycled
Resources extracted or imported
Mill
ion
tonn
es (M
t)
Note: ‘Resources wasted’ covers all materials going to any waste disposal route. Some of the materials flowing into the economy are consumed directly, for example food and drink, or are dissipative outputs to land and air, while others are absorbed into fixed assets and infrastructure and are available for future recovery. Resources extracted or imported include biomass, metals, minerals and products.
Studies on the nature of employment creation in a circular economy
There is a substantial literature on the potential of the circular economy to create employment, but most studies report the total employment needs of the sector, rather than the types of jobs that might be needed.34 There are a few exceptions and the following table summarises some of the key findings of these studies.
The main messages of these studies are that the circular economy can generate a range of job types from low to high skilled occupations; however, there are notable differences between different circular economy activities.
Waste management and recycling tend to offer a disproportionate amount of low and low to intermediate skilled employment: in the area of collection, handling and processing materials for recycling.
Perhaps not surprisingly, remanufacturing, in common with original manufacturing, tends to require more skilled workers. Indeed, supporting the growth of remanufacturing is likely to require significant investment in training to develop the right skills for the workforce.
There is more limited information on geographical dispersion, but evidence to date suggests that circular economy activities tend to offer dispersed employment across the country.
In this section we discuss evidence of existing employment patterns in the circular economy, focusing on its current contribution to addressing mismatch and the hollowing out of mid-level occupations. We report on a brief literature review, looking at studies of the types of jobs created in the circular economy, and provide details of a specific case study for a WRAP Cymru project in Wales. Finally, we examine the evidence from the latest labour market statistics on circular economy activities, to the extent it is possible, using official data.
Recent developments in the circular economy
Before analysing the labour market aspects of the circular economy it is useful to review, in broad terms, the development of such activities over the past decade or so. A key principle within the circular economy approach is improving the efficiency of the way materials and resources are used in economic activity. One way of looking at this is to see what has been happening to trends in the overall amount of resources used in economic activity, compared with the amount of waste and the resources being recovered for recycling back into the economy.
Back in the year 2000, around 570 million tonnes of materials (biomass, metals and minerals, but excluding fossil fuels) were used in economic activity, but 40 per cent or so of this amount ended up as waste, and fewer than 50 million tonnes of these materials were from recovery and recycling, and the amount of imported materials were more than double the amount being recycled (see below). The waste and recycling industry generated sales revenue of more than £6.5 billion from collection, treatment, disposal, recycling and wholesale of recovered materials, and employed around 75,000 people.
Ten years later, while the economy had expanded by 20 per cent (and the population had increased by six per cent), it was using fewer resources, about 540 million tonnes, with around 30 per cent ending up as waste. The amount of material recycled had more than doubled, to around 115 million tonnes, similar to the amount of materials imported. And from these recovered resources, the recycling sector was generating sales turnover of over £19 billion, close to a three fold increase, with industry employment of around 130,000.
So, in the decade to 2010, there was substantial progress in the recycling industry, and employment within it. The economy had become more circular and more resource efficient: it expanded, but used fewer resources, generated less waste and recycled more.

24 25
WRAP Cymru’s ARID ProjectThe ARID (Accelerating Reprocessing Infrastructure Development) project is funded by the European Regional Development Fund (ERDF) through the Welsh government.36 ARID seeks to reduce levels of waste deposited in landfill by developing reprocessing capacity in Wales’ Convergence Region (north west Wales, west Wales and the south Wales valleys). ARID has a target to create 106 jobs in total. By May 2013, WRAP Cymru had allocated ARID funding which would lead to the creation of 69 new jobs in Wales’ Convergence Region, which are the areas of Wales most in need of growth.
The creation of these jobs is ongoing, as projects come to fruition. WRAP Cymru has so far collected evidence in relation to around 60 jobs created to date.37 Monitoring is ongoing, so this figure increases regularly. A breakdown of jobs created to date, by location and salary band, is included below:
Distribution of jobs across Wales in WRAP Cymru’s ARID Project
Area Percentage share of total
Anglesey 1%
Bridgend 36%
Gwynedd 2%
Caerphilly 13%
Merthyr 5%
Neath 29%
Pembrokeshire 2%
Rhondda Cynon Taf 2%
Carmarthenshire 6%
Conwy 3%
Swansea 2%
Distribution of pay for jobs created in WRAP Cymru’s ARID Project
Annual pay Equivalent hourly pay* Percentage share
£14,999 and below <£9.40 29%
£15,000-£24,999 £9.40-£15.66 44%
£25,000 and above >£15.66 27%
*assuming 25 paid holidays per year and an average working day of seven hours plus breaks
This example points to broadly similar findings to the larger studies carried out. A geographical spread of employment, coupled with the creation of primarily low to intermediate types of jobs.
Literature on the nature of employment creation in circular economy activities35
Sector Study Coverage Job Types
Recycling EEA (2011) EU Low skilled work in particular, but also medium and high skilled jobs, ranging from collection, materials handling and processing to manufacturing products.
Recycling ILO (2011) Germany 16 per cent low skilled, 47 per cent skilled, 11 per cent technical, 25 per cent university.
Waste collection ECOTEC (2002) EU Labour required for waste collection and transport, at relatively low wage rates.
Remanufacturing APPSRG (2014) UK Skilled, with substantial training needs.
Waste management
SITA (2012) UK A range of jobs, but particularly significant numbers of mid-level (supervisors/operators) and low level (manual) occupations.
Deposit refund scheme (DRS) for packaging
Eunomia (2011) UK A range of skills would be required, including some higher skilled jobs. Jobs would be geographically spread, with counting centres and logistics and regional jobs in retail and collection.
Remanufacturing Beck (2011) US Relatively high skill and training requirements.

26 27
The following table shows the distribution of the share of employment in the proxy circular economy activities by region. Broadly speaking, there is a correspondence between employment patterns in the circular economy and those of the economy as a whole. In other words, employment in the circular economy is distributed across Britain, broadly in line with the overall distribution of employment.
Distribution of employment by sector and by nation and region, 201340
Waste and recycling
Wholesale of waste and scrap
Retail of second-hand goods in store
Rental and leasing
Repair of electronics and household goods
Repair of machinery equipment
All employment
North East 3% 4% 4% 4% 1% 2% 4%
North West 14% 14% 12% 10% 7% 11% 11%
Yorkshire and the Humber
8% 10% 9% 6% 7% 11% 8%
East Midlands
9% 11% 7% 9% 9% 10% 7%
West Midlands
7% 20% 8% 9% 7% 9% 9%
East of England
10% 7% 10% 12% 16% 14% 9%
London 10% 8% 13% 12% 10% 7% 17%
South East 14% 10% 16% 14% 28% 12% 14%
South West 9% 6% 10% 9% 6% 6% 8%
Wales 7% 3% 4% 5% 2% 6% 5%
Scotland 9% 7% 7% 10% 7% 13% 9%
For the waste and recycling sector, another way to obtain an indicative picture of the spread of employment is through the geographical dispersion of facilities along the supply chain for collection, sorting and processing of recovered materials (see following table).
Waste transfer stations are facilities where materials and waste from individual collection vehicles are combined or ‘bulked up’ before transfer to larger vehicles for onward transport to treatment and recovery facilities. In some systems, recyclable materials are collected and sorted at the kerbside; in others, materials are collected together or combined from households or commercial premises. A materials recovery facility (or MRF) receives such mixed recyclate and then sorts these materials into separate streams (eg paper, card, glass, metals) according to buyer specifications, which may include compaction, sizing and shredding of recovered materials, before baling and preparation for sale. These activities show a somewhat higher concentration in the North East (including Yorkshire and the Humber) and the North West, than was observed in the employment figures.
Data on the labour market aspects of the circular economy
In the following section we review the current labour market needs of the circular economy and recent trends regarding job creation, in terms of location, pay and occupation. Such analysis is inevitably hampered by the fact that, whilst there has been substantial growth in activities such as recycling and reuse, the economy remains fairly linear in nature and economic statistics are still adapting to the growth of these new activities.38
As a consequence it is necessary to build proxy indicators of the number of jobs and their characteristics (regional distribution, pay and occupational structure) for circular economy activities. These can be compiled using the most detailed sector level data (up to five digit) which are then aggregated to align as closely as possible with the scope of the circular economy, as outlined in the introduction on page four.
This approach is set out in very broad terms below, although such mapping is not perfect as, for instance, no direct links can be found for biorefining and the mapping for reuse and servitisation is far from ideal.
Mapping circular economy activities to official data
Circular economy activity Best matches in current ONS data
Reuse Retail of second hand goods in store
Closed and open loop recyclingWaste and recycling
Wholesale of waste and scrap
Servitisation Renting and leasing
Repair and remanufacturingRepair of machinery equipment
Repair electronics and household goods
While it is envisaged that the nature of circular economy activities and their relative employment shares will evolve as the transition to the circular economy accelerates, the levels and trends in employment in businesses currently operating in repair, reuse, recycling and rental and leasing sectors can be thought of as a useful approximation to the circular economy as it currently stands.
We now review the available data for the activities covered in the table above, before seeking to identify what evidence exists on the characteristics of biorefining, not included in the table.
Labour market dimensions: regional employment39
The discussion in the previous section on the scope for net job creation, or addressing disappearing mid-level jobs, highlighted the uneven distribution of labour market slack across the regions. For growth in the circular economy to have the potential to address regional imbalances in unemployment, it needs to generate employment in all areas across the country, not just in areas of low unemployment such as the south east.
Overall employment in the rental and leasing, repair, and waste and recycling sectors is around 460,000 based on our analysis of 2013 data from ONS Business register and employment survey (BRES).

28 29
Labour market dimensions: occupationsIn relation to occupational types there is some detailed information available, but the coverage is not complete and, in some of the sectors, the underlying data are unreliable or simply not available. Hence, the figures should be seen as indicative rather than definitive.
The table below summarises available information on occupational characteristics for employment in the repair, waste and recycling, and the rental and leasing sectors.
Occupational structure by sector, 2014 Q143
Occupation/sector Repair of machinery and equipment
Repair of household products
Waste and recycling
Rental and leasing
All
High wage Managers and senior officials
7% 8% 10% 17% 11%
Professional occupations
13% 7% 3% 3% 22%
Associate, prof and technical
14% 10% 9% 14% 15%
Mid-wage Admin and secretarial 6% 3% 5% 22% 12%
Skilled trades 47% 56% 2% 9% 12%
Process, plant and machine operatives
8% 8% 30% 14% 7%
Low wage Elementary occupations
3% 3% 41% 6% 12%
Sales and customer services
2% 4% - 12% 9%
The tentative points to draw from this distribution are:
• for employment in repair activities, skilled trades are strongly represented in the mid-wage occupations (61-67 per cent) but with comparatively fewer employed in both high wage (25-34 per cent) and low wage occupations (five to seven per cent);
• employment in the waste and recycling sector has a greater share of mid-wage (37 per cent) and the low wage sectors (41 per cent), with comparatively fewer people employed in the high wage occupations (22 per cent), compared to overall employment;
• rental and leasing employment is more evenly spread across occupational categories, although even here 45 per cent is in mid-wage occupations, compared with 18 per cent and 38 per cent in low and high wage jobs respectively.
When compared with the general distribution of skill categories, waste and recycling requires a comparatively high proportion of low skilled employment (41 per cent compared with an average of 21 per cent across all workers). Repair activities are comparatively mid-skilled (61-67 per cent compared with an average
Distribution of waste transfer stations and materials recovery facilities by region41
Waste transfer stations* Materials recovery facilities
England 100% 71%
North East** 19% 14%
North West 16% 9%
East Midlands 11% 10%
West Midlands 12% 2%
East of England 12% 8%
London and South East 19% 20%
South West 12% 7%
Wales - 14%
Scotland - 15%
* England only, ** Includes Yorkshire and the Humber, the figures in the table represent the proportion of all facilities located in a particular region
Labour market dimensions: earningsTo address the issue of the hollowing out of the labour market, the growth in circular economy activities needs to offer the potential for creating employment in jobs that are mid-range in terms of pay.
The table below shows hourly pay rates for the proxy circular economy activities. Average gross hourly pay across these sectors is around £14.50, ranging from £12.60 per hour in employment in rental leasing activities, to £17.70 for those employed in machinery and equipment related repair activities.
Employment and average gross hourly pay, 201342
Sector Average gross hourly pay, £ per hour
All Male Female Full time Part time
Waste collection, treatment, disposal and materials recovery
14.0 13.8 15.3 14.2 9.8
Rental and leasing activities 12.6 12.6 12.2 12.7 10.9
Repair of machinery and equipment 17.7 18.2 13.2 17.9 11.1
Repair of electronic and household goods 13.9 14.6 11.5 14.1 11.2
TOTAL 14.4 14.7 13.1 14.6 10.7
In general, looking across these sectors, pay rates in current jobs in these activities are in the mid-wage sectors and, therefore, it is quite likely that growth in the circular economy has the potential to create employment in mid-range posts.

30 31
Regional distribution of anaerobic digestion and composting facilities47
AD commercial
AD industrial
AD on farm
Composting MBT*
England 75% 82% 82% 83% 100%
North East and Yorkshire and the Humber
6% 24% 7% 16% 20%
North West 6% 15% 9% 8% 20%
East Midlands 4% 3% 2% 7% 10%
West Midlands 15% 9% 18% 8% n/a
East of England 4% 12% 15% 7% 10%
London and South East
19% 12% 15% 20% 25%
South West 21% 9% 16% 17% 15%
Wales 10% 3% 4% 6%
Scotland 13% 12% 4% 11%
Northern Ireland
2% 3% 11%
*coverage is England only
It is estimated that the UK biofuels sector currently employs more than 3,500 people directly across 200 businesses with several thousand indirect jobs in the associated supply chains.48 Total UK employment in the AD sector is estimated at 482 full time equivalents (FTE). In terms of composting and MBT there are an estimated 1,370 FTE posts directly employed in composting and 570 in MBT.
Jobs in the biorefinery sector in general offer a mix of occupations with low to high skill requirements, ranging from plant and crop development, cultivation and harvesting, transport, distribution and storage of feedstock, plant design, deployment, maintenance and repair to development, testing and marketing of innovative products. A wide range of skills and occupation types are also represented from manual operatives, roles in agriculture, logistics to bioscientists and chemical engineers. The AD sector provides jobs associated with a range of occupation, skill and pay types from the design, construction, operation and maintenance of the plants to feedstock purchasing and products sales and marketing positions.49
In broad terms, jobs in circular economy activities tend to be regionally dispersed and there is significant employment in low and mid-wage occupations. Nevertheless, there are some differences between different circular economy activities. Waste management and recycling tend to offer a disproportionate amount of low and low to intermediate skill level employment in the areas of collection, handling and processing materials for recycling. Remanufacturing, in common with original manufacturing, tends to require more skilled workers. Biorefinery requires highly skilled occupation types, but there is also scope for growth in lower skilled jobs in collection, cultivation and harvesting.
of 31 per cent across all workers). The same is also true, albeit to a lesser extent, of rental and leasing (45 per cent mid-skilled).
The evidence on biorefining employment As there is a lack of detailed information on employment in biorefining, we will instead review the best available evidence on the geographical dispersion of biorefining activities in Britain and the types of jobs associated with it.44
There has been substantial growth in refining capacity for biofuels in Britain. In terms of the larger scale production facilities, biofuel capacity has increased to more than 1.5 million litres a year. Initially dominated by biodiesel projects, there are now several very large bioethanol plants, the most recent addition being the Vivergo plant in Hull, Britain’s largest biofuel plant.
Large scale plant tends to be located at or close to sea ports to allow for bulk shipment of either feedstock or product, or in proximity to the businesses they supply, for example automotive fuel or chemicals manufacturers.
However, there are also dozens of smaller businesses across Britain involved in the collection of used cooking oil for the production of biodiesel, in most cases from the hospitality sector and food manufacturers, but also from households through local authority provision of collection points.45
In addition, significant amounts of biowaste are collected and processed through a range of other biological treatment options. Open air windrow composting (OAW) is the biggest, in terms of tonnage handled, biowaste treatment technology: some 5.9 Mt of organic waste is sent to composting facilities, 2.6 Mt to anaerobic digestion (AD) sites and 2.5 Mt to mechanical and biological treatment (MBT).46
The following table illustrates the geographical dispersion of biowaste treatment facilities. The table shows that there is a good geographical of biorefining facilities, with the north east and Yorkshire and Humber rather well represented, when compared with its 11 per cent share of overall employment. In terms of growth, in the AD sector there was a 34 per cent increase in the total number of operational plants between 2012 and 2013, and an increase of 51 per cent in the tonnage of organic material processed, excluding AD plants associated with the drinks industry which use AD to process liquid effluent and discharge the treated effluent to sewer.
33
4The future development of circular economy activities and their labour market requirements
In this section we look forward and consider how the labour market requirements of the circular economy may develop over time. The focus is on specific circular economy activities and how they may develop and interact with the wider labour market. Here, we are looking in general terms, whilst in the next section we develop distinct scenarios for differing paces of development of the circular economy. This analysis draws on the preceding data and evidence review, coupled with the findings of our expert workshop (see the annex on page 53 for the list of participants). The following tables summarise our findings of the likely labour market needs of various circular economy activities, which we then explain in more detail in the remainder of this section.
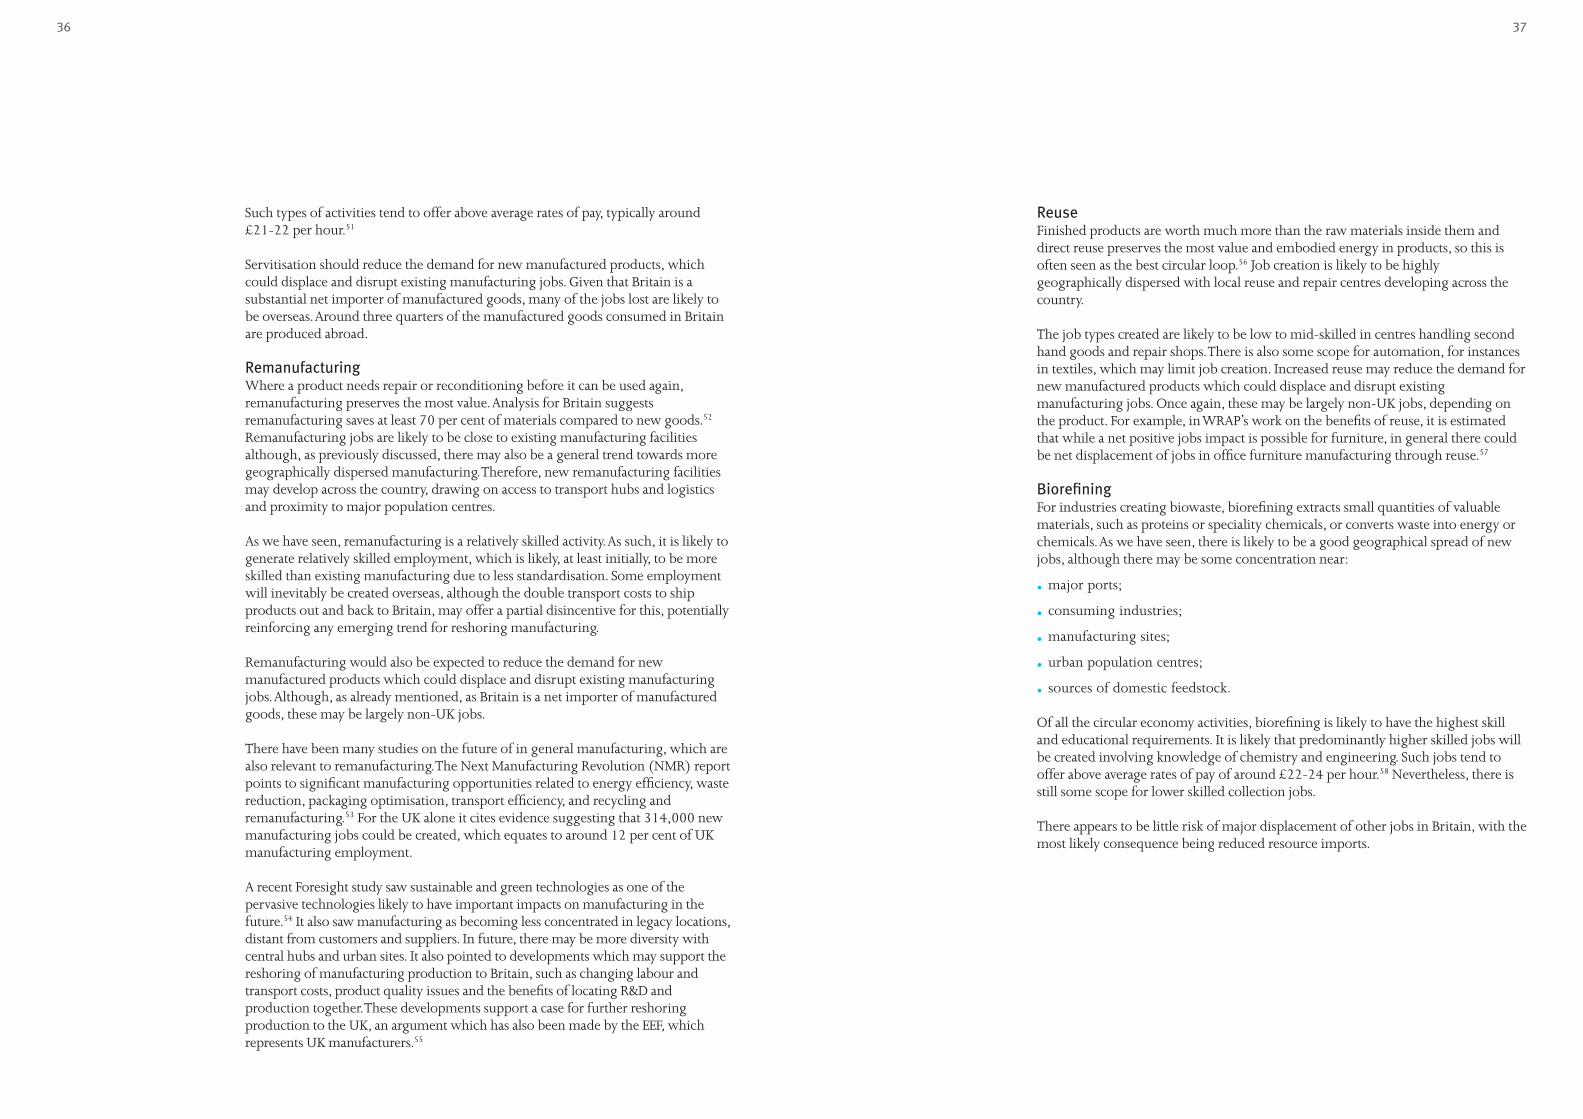
We first look at the extent to which these jobs are likely to be concentrated geographically, the possible nature of this concentration and the risk of displacing other activities. Reuse and open loop recycling tend to be the least geographically concentrated, requiring activity across the country. By contrast, remanufacturing is likely to be somewhat more concentrated, for instance near existing manufacturing facilities.
Most activities imply some displacement of activity it other areas, such as the production of virgin materials or original manufacturing. However, given existing patterns of trade, most of these impacts are likely to be felt by overseas suppliers.
Potential geographical dispersion of jobs by circular economy activity
Activity Job concentration
Areas of concentration Displacement risk
Closed loop recycling *** Near manufacturing sites, logistics and supply chains
Some risk to existing raw materials
Open loop recycling ** Near feedstock and markets, close to major ports
Some risk to existing raw materials
Servitisation *** Head office jobs may be in south east and London; back office and servicing jobs may go abroad
Risk to overseas manufacturing (largely)
Remanufacturing **** Near manufacturing sites, transport hubs, population centres, some overseas plants
Risk to overseas manufacturing (largely)
Reuse * Dispersed throughout the country
Largely affecting overseas manufacturing, although some risk to domestic furniture
Biorefining *** Major ports, consuming industries, manufacturing sites, population centres, sources of domestic feedstock
Little risk of significant displacement
Scale from 1*=low to 5*=high
We have also considered the extent to which circular economy activities are likely to require differing skill levels from the labour force. Our findings are reported in the table below. Reuse and recycling are likely to require significant proportions of low-skilled labour. Remanufacturing, closed loop recycling and biorefining will require more mid-level skilled employment. Biorefining and to a lesser extent servitisation are also thought likely to require some higher end professional and technical skills.

34 35
Potential skill needs by circular economy activity
Activity Low skilled1 Skilled1 Professional1
Closed loop recycling **** **** *
Open loop recycling **** ** *
Servitisation *** *** ***
Remanufacturing ** ***** **
Reuse **** ** *
Biorefining * **** ****
Scale from 1*=low to 5*=high
We now outline the considerations which led to the conclusions in these tables.
Closed loop recycling The notion of closed loop recycling involves maintaining the quality of recycled materials by avoiding mixing them with other waste streams so that they can be used again for the same products or other products which use the same materials. As we have already seen, jobs in recycling tend to be quite geographically dispersed, reflecting the availability of waste streams near to where people live and work. There is no reason to expect this to change in the future, although there may be some tendency for:
•manufacturers and reprocessors to form new partnerships near to existing or new manufacturing sites;
•development close to supply chains, with reverse logistics, and markets will be important;
• regional collection hubs are likely to develop as the industry grows.
As we have already seen, a range of job skills are likely to be required, but there may be a concentration with lower and intermediate skilled occupations. Some low skilled jobs in collection and sorting jobs are likely to be created, With more semi-skilled and skilled jobs emerging in relation to technical sorting systems and logistics.
Such logistics are likely to involve a substantial increase in infrastructure to collect and recover valuable materials and products, and route them back to businesses and consumers. Therefore, growth in employment in collection, haulage, transport, storage and distribution is likely to develop as the circular economy grows. Such activities tend to offer a significant amount of mid-level paid employment, typically around £14-15 per hour.50
Some jobs may be vulnerable to technological change, for instance from increased automation in collection, sorting and processing of materials. Some may also be vulnerable to overseas competition, through the export of unprocessed waste to low labour cost locations.
As regards the potential for displacement of existing jobs, this is most likely to occur in the supply of new materials. Depending on the materials, many of these displaced jobs are likely to be overseas as Britain is not a major supplier of many raw materials.
Open loop recycling Open loop recycling, or downcycling, creates material suitable only for potentially lower value applications. This is inevitable for some materials which degrade over time, like the fibres in paper, which lose strength when recycled. As with closed loop recycling, new jobs are likely to be geographically dispersed across the country as:
• collection hubs can be anywhere in the country;
• there are some benefits in being close to feedstock and markets; closeness to major conurbations is likely to be an advantage;
• access to material flows between Europe and the rest of the world is likely to be important, so this may favour locations near to major ports.
Jobs in collection and sorting are likely to be predominantly low skilled. Such jobs may be vulnerable to being automated in Britain due to high labour costs or, instead, they may be created in lower labour cost locations overseas. This vulnerability may be greater than for closed loop recycling as labour costs are likely to be a more important business consideration for processing low value materials. Displacement of existing jobs is most likely to occur in the supply of new raw materials. As such, materials are predominantly imported and many of the jobs lost are likely to be overseas.
Looking ahead, if the development of the circular economy is successful, then the flow of materials for downcycling may actually be slower than it is currently. If other circular activities, eg closed loop recycling, remanufacture and reuse develop faster, then fewer materials may be available for open loop recycling.
Servitisation of manufacturing Servitisation would cover any system which increases the effective use of assets. It can include leasing and moving from providing products to services, thereby deferring consumption of new assets. Given the need to be near customers, jobs are likely to be created across the economy, but potentially also overseas:
• there may be some national head office jobs which may be concentrated in London and the south east;
• there may also be a need for local delivery of services and proximity to customers;
• some back office and servicing activities may go abroad to low cost locations.
Servitisation appears likely to benefit a broad range of job types, potentially broader than for closed and open loop recycling.
• lower and semi-skilled jobs are likely to be created in customer support and sales;
• servitisation should require some new skilled jobs in engineering and servicing activities;
•professional, IT and leadership roles are also likely to emerge.
Servitisation is likely to require the development of digital marketing platforms, social media, and other sales and marketing channels for these innovative services.
36 37
Such types of activities tend to offer above average rates of pay, typically around £21-22 per hour.51
Servitisation should reduce the demand for new manufactured products, which could displace and disrupt existing manufacturing jobs. Given that Britain is a substantial net importer of manufactured goods, many of the jobs lost are likely to be overseas. Around three quarters of the manufactured goods consumed in Britain are produced abroad.
RemanufacturingWhere a product needs repair or reconditioning before it can be used again, remanufacturing preserves the most value. Analysis for Britain suggests remanufacturing saves at least 70 per cent of materials compared to new goods.52 Remanufacturing jobs are likely to be close to existing manufacturing facilities although, as previously discussed, there may also be a general trend towards more geographically dispersed manufacturing. Therefore, new remanufacturing facilities may develop across the country, drawing on access to transport hubs and logistics and proximity to major population centres.
As we have seen, remanufacturing is a relatively skilled activity. As such, it is likely to generate relatively skilled employment, which is likely, at least initially, to be more skilled than existing manufacturing due to less standardisation. Some employment will inevitably be created overseas, although the double transport costs to ship products out and back to Britain, may offer a partial disincentive for this, potentially reinforcing any emerging trend for reshoring manufacturing.
Remanufacturing would also be expected to reduce the demand for new manufactured products which could displace and disrupt existing manufacturing jobs. Although, as already mentioned, as Britain is a net importer of manufactured goods, these may be largely non-UK jobs.
There have been many studies on the future of in general manufacturing, which are also relevant to remanufacturing. The Next Manufacturing Revolution (NMR) report points to significant manufacturing opportunities related to energy efficiency, waste reduction, packaging optimisation, transport efficiency, and recycling and remanufacturing.53 For the UK alone it cites evidence suggesting that 314,000 new manufacturing jobs could be created, which equates to around 12 per cent of UK manufacturing employment.
A recent Foresight study saw sustainable and green technologies as one of the pervasive technologies likely to have important impacts on manufacturing in the future.54 It also saw manufacturing as becoming less concentrated in legacy locations, distant from customers and suppliers. In future, there may be more diversity with central hubs and urban sites. It also pointed to developments which may support the reshoring of manufacturing production to Britain, such as changing labour and transport costs, product quality issues and the benefits of locating R&D and production together. These developments support a case for further reshoring production to the UK, an argument which has also been made by the EEF, which represents UK manufacturers.55
ReuseFinished products are worth much more than the raw materials inside them and direct reuse preserves the most value and embodied energy in products, so this is often seen as the best circular loop.56 Job creation is likely to be highly geographically dispersed with local reuse and repair centres developing across the country.
The job types created are likely to be low to mid-skilled in centres handling second hand goods and repair shops. There is also some scope for automation, for instances in textiles, which may limit job creation. Increased reuse may reduce the demand for new manufactured products which could displace and disrupt existing manufacturing jobs. Once again, these may be largely non-UK jobs, depending on the product. For example, in WRAP’s work on the benefits of reuse, it is estimated that while a net positive jobs impact is possible for furniture, in general there could be net displacement of jobs in office furniture manufacturing through reuse.57
BiorefiningFor industries creating biowaste, biorefining extracts small quantities of valuable materials, such as proteins or speciality chemicals, or converts waste into energy or chemicals. As we have seen, there is likely to be a good geographical spread of new jobs, although there may be some concentration near:
•major ports;
• consuming industries;
•manufacturing sites;
•urban population centres;
• sources of domestic feedstock.
Of all the circular economy activities, biorefining is likely to have the highest skill and educational requirements. It is likely that predominantly higher skilled jobs will be created involving knowledge of chemistry and engineering. Such jobs tend to offer above average rates of pay of around £22-24 per hour.58 Nevertheless, there is still some scope for lower skilled collection jobs.
There appears to be little risk of major displacement of other jobs in Britain, with the most likely consequence being reduced resource imports.
38 39
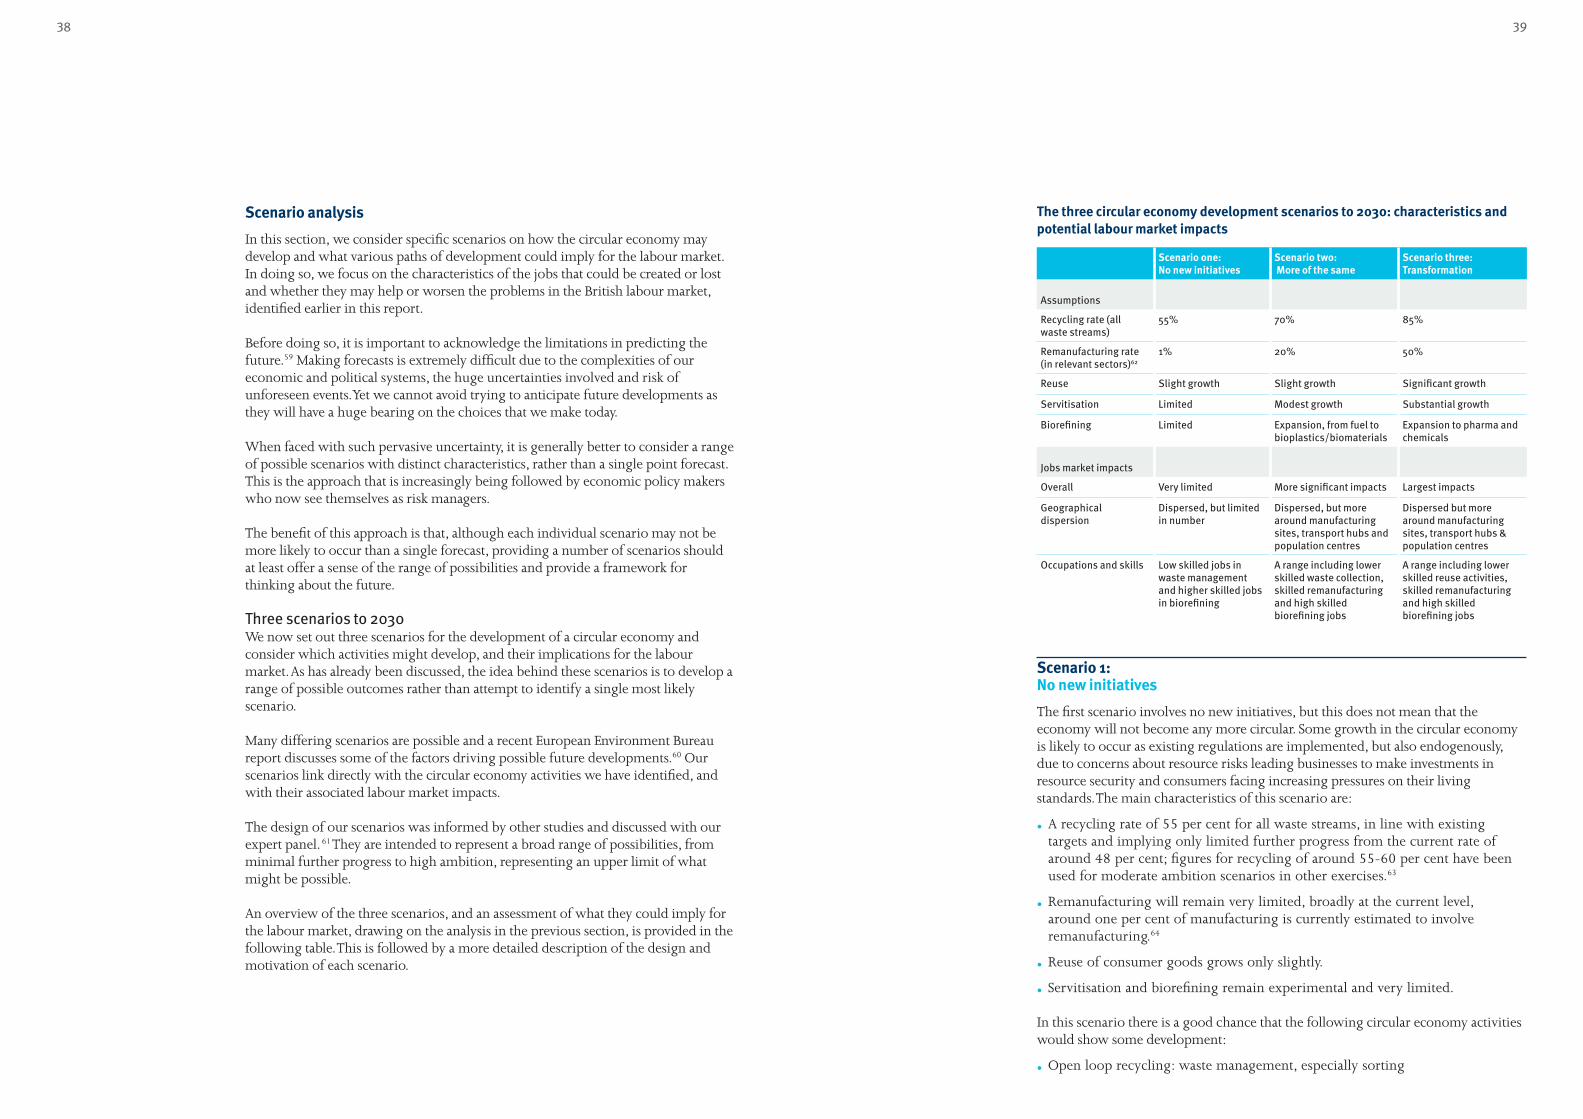
Scenario analysis
In this section, we consider specific scenarios on how the circular economy may develop and what various paths of development could imply for the labour market. In doing so, we focus on the characteristics of the jobs that could be created or lost and whether they may help or worsen the problems in the British labour market, identified earlier in this report.
Before doing so, it is important to acknowledge the limitations in predicting the future.59 Making forecasts is extremely difficult due to the complexities of our economic and political systems, the huge uncertainties involved and risk of unforeseen events. Yet we cannot avoid trying to anticipate future developments as they will have a huge bearing on the choices that we make today.
When faced with such pervasive uncertainty, it is generally better to consider a range of possible scenarios with distinct characteristics, rather than a single point forecast. This is the approach that is increasingly being followed by economic policy makers who now see themselves as risk managers.
The benefit of this approach is that, although each individual scenario may not be more likely to occur than a single forecast, providing a number of scenarios should at least offer a sense of the range of possibilities and provide a framework for thinking about the future.
Three scenarios to 2030We now set out three scenarios for the development of a circular economy and consider which activities might develop, and their implications for the labour market. As has already been discussed, the idea behind these scenarios is to develop a range of possible outcomes rather than attempt to identify a single most likely scenario.
Many differing scenarios are possible and a recent European Environment Bureau report discusses some of the factors driving possible future developments.60 Our scenarios link directly with the circular economy activities we have identified, and with their associated labour market impacts.
The design of our scenarios was informed by other studies and discussed with our expert panel. 61 They are intended to represent a broad range of possibilities, from minimal further progress to high ambition, representing an upper limit of what might be possible.
An overview of the three scenarios, and an assessment of what they could imply for the labour market, drawing on the analysis in the previous section, is provided in the following table. This is followed by a more detailed description of the design and motivation of each scenario.
The three circular economy development scenarios to 2030: characteristics and potential labour market impacts
Scenario one: No new initiatives
Scenario two: More of the same
Scenario three: Transformation
Assumptions
Recycling rate (all waste streams)
55% 70% 85%
Remanufacturing rate (in relevant sectors)62
1% 20% 50%
Reuse Slight growth Slight growth Significant growth
Servitisation Limited Modest growth Substantial growth
Biorefining Limited Expansion, from fuel to bioplastics/biomaterials
Expansion to pharma and chemicals
Jobs market impacts
Overall Very limited More significant impacts Largest impacts
Geographical dispersion
Dispersed, but limited in number
Dispersed, but more around manufacturing sites, transport hubs and population centres
Dispersed but more around manufacturing sites, transport hubs & population centres
Occupations and skills Low skilled jobs in waste management and higher skilled jobs in biorefining
A range including lower skilled waste collection, skilled remanufacturing and high skilled biorefining jobs
A range including lower skilled reuse activities, skilled remanufacturing and high skilled biorefining jobs
Scenario 1: No new initiatives
The first scenario involves no new initiatives, but this does not mean that the economy will not become any more circular. Some growth in the circular economy is likely to occur as existing regulations are implemented, but also endogenously, due to concerns about resource risks leading businesses to make investments in resource security and consumers facing increasing pressures on their living standards. The main characteristics of this scenario are:
•A recycling rate of 55 per cent for all waste streams, in line with existing targets and implying only limited further progress from the current rate of around 48 per cent; figures for recycling of around 55-60 per cent have been used for moderate ambition scenarios in other exercises.63
•Remanufacturing will remain very limited, broadly at the current level, around one per cent of manufacturing is currently estimated to involve remanufacturing.64
•Reuse of consumer goods grows only slightly.
• Servitisation and biorefining remain experimental and very limited.
In this scenario there is a good chance that the following circular economy activities would show some development:
•Open loop recycling: waste management, especially sorting

40 41
•Reuse: online trading platforms for reusable goods
•R&D for biorefining
• Some servitisation of high value manufactures
Given the very limited development of the circular economy in this scenario, the impacts on the labour market would be expected to be slight.
Some jobs will be created and these are likely to be fairly geographically dispersed. It would be expected that some low skilled jobs will be created in waste management and higher skilled jobs in biorefining.
Scenario 2: More of the same
In the second scenario there is significantly more ambition to accompany the commercial pressure toward resource efficiency. The key characteristics of this scenario are:
•A recycling rate of 70 per cent; this also corresponds with a medium level of ambition in other scenario exercises.65
• Significant growth in remanufacturing in those sectors, ie electronics, photocopiers, transport equipment etc, that have the greatest potential for such activity; for these sectors, which collectively account for about 25 per cent of manufacturing employment, a moderate ambition could be a remanufacturing rate of around 20 per cent, implying an overall remanufacturing rate of around five per cent.66
•Reuse grows slightly, with a modest increase in the proportion of textiles, furniture and electrical goods, such as high value mobile phones, being reused.
• Servitisation of manufacturing grows modestly.
•Biorefining expands from fuel to bioplastics and biomaterials.
In this scenario the following activities would seem to offer the best potential for development:
•Closed loop recycling
•More servitisation based around manufacturing, with more servicing
•Remanufacturing for expensive items
•Biorefining
The effects on the labour market are likely to be significantly stronger than in scenario 1, given the more significant growth in circular economy activities. There is likely to be some geographical dispersion of jobs around the country, albeit with some concentration around manufacturing sites, transport hubs including ports and major population centres. These activities are likely to provide a wide spread of job types ranging for lower skilled waste collection, through skilled remanufacturing jobs to high skilled biorefining occupations.
Scenario 3: Transformation
The final scenario is the most extensive, envisaging a maximum conceivable transition to a circular economy. The key characteristics of this scenario are:
•A recycling rate of 85 per cent, but with lower volumes due to high remanufacturing; this is clearly highly ambitious, but not without precedent in some areas; products made of aluminium and steel already have recycling rates above 90 per cent in Belgium and Germany.67 Complex products can also achieve a 90 per cent recycling rate, as all cars in Europe will meet this standard by 2016 under the End of Life Vehicle Directive. Even household type waste can be recycled at this rate, with all of the Midcounties Co-operative stores achieving at least a 90 per cent recycling rate in 2014.68 Nevertheless, this is a stretching target and would probably require product redesign to enable simpler recycling.
•A remanufacturing rate of 50 per cent in those sectors, ie electronics, photocopiers, transport equipment etc, that have the greatest potential for such activity. This requires that the best practice that has already been achieved in some areas is diffused much more widely by 2030.69 This is a challenging target, although as it relates to around a quarter of manufacturing, only around 12-13 per cent of all manufactured goods would need to be remanufactured.
•Reuse grows more substantially with rapid development of online platforms and local retail outlets. Greater reuse of a wider range of products increasingly reduces the need for new sales.
• Servitisation becomes widespread and increases its share of manufacturing revenue. An increasingly important business model involves selling the services of products such as washing machines through leasing arrangements. Companies then have the incentive to develop longer lasting products which they can service and repair and remanufacture at the end of their life.
•Biorefining spreads to high value pharmaceuticals and specialist chemicals. Biorefining of high value pharmaceuticals and food, such as omega 3 oils and vanillin, is an existing industrial activity.

42
5An indicative quantification of the labour market impacts of growth in the circular economy
In this scenario the following circular economy activities would appear to offer the best potential to develop:
•Comprehensive remanufacturing at high value and local repair levels
•Limited recycling jobs and investment
•Biobased pharmaceutical and chemicals jobs
The effects on the labour market are likely to be the strongest in this scenario. In common with scenario two, there is likely to be some geographical dispersion of jobs around the country albeit with some concentration around manufacturing sites, transport hubs, including ports, and major population centres. These activities are likely to provide a good spread of jobs types ranging from lower skilled reuse activities, through skilled remanufacturing jobs to high skilled biorefining occupations.

44 45
It is worth keeping in mind that such effects could substantially increase the job creation in each scenario. For instance, a study by Friends of the Earth found that an increase in the recycling rate to 70 per cent could potentially directly create 40,000 new jobs, which broadly corresponds with our estimate of 38,000 for this recycling rate. However, the study also suggests there is potential for a further 30,000 indirect and induced jobs, giving a total of 70,000.72
Another factor that we have not taken into account is the potential role of possible technological breakthroughs substantially reducing labour input to circular economy activities. The potential for such developments was discussed in the preceding qualitative analysis, but as a risk it has not been quantified.
Regional labour market interactionsOur focus is on how direct employment demands of an emerging circular economy may interact with the rest of the British labour market. To get a sense of whether this growth would involve expanding overall employment or would come through displacement of existing employment, we have put such growth in the context of the extent to which unemployment in a region is higher than that in the region with lowest unemployment.
The following graph shows these figures for each of the British regions. Unemployment deviation is defined by each region’s unemployment rate in excess of the unemployment rate in the lowest unemployment region (south west at 4.6 per cent). The idea being that the lowest unemployment region can provide an indication of what it may be possible to achieve in other regions. This is a conservative estimate of the size of unused labour supply in each region as it ignores the potential contribution from the ‘inactive’ segment of the labour market (eg people of working age who are neither employed or unemployed) and people who are currently working part time but would prefer to work full time if an opportunity arose.
Even with such a narrow definition, the message from the chart is that the job creation accounts for a very small proportion of excess labour supply in the North East, so it is difficult to see this growth putting any generalised pressure on the local labour market. Other regions, including the North West, Yorkshire and the Humber, West Midlands and, perhaps surprisingly, London, also seem to offer substantial scope for the growth of circular economy employment under even the most extensive scenario three. Being at or close to the lowest unemployment rate, it is likely that a significant proportion of the employment growth in the circular economy in the South East and South West will involve displacement of employment in other activities. Although, even in these regions, it is possible that some growth may still be achieved through encouraging currently inactive workers back into the labour market.
The previous section covered qualitative analysis of the potential for the circular economy to address the labour market problems of structural mismatch and disappearing mid-level occupations. We now consider the potential quantitative significance of the three scenarios for the development of the circular economy. This is inevitably fraught with difficulty and requires numerous assumptions to make the calculations, which should, therefore, be seen as illustrative rather than definitive.
The purpose of this exercise is to show how growing the circular economy can be expected to have lasting beneficial effects on the labour market, because of its capacity to create dispersed employment that has the potential to be undertaken by the unemployed, or those losing mid-level skilled positions through industrial change.
Job creationOur calculations start with the current best estimates of the employment patterns of the main circular economy activities, which we reported in section three, adjusted in line with the assumed growth in the circular economy, as specified in each of our three scenarios.70 Where possible, we draw on other evidence of the employment potential of the circular economy. Where appropriate, we also factor in offsetting reductions in employment elsewhere in the economy as a result of growing circular economy activities. For instance, we allow for reductions in employment in the production of virgin materials and original manufacturing as higher resource efficiency reduces the need for new materials or new manufactured products.
According to our calculations the growth of circular economy activities will create a direct need for additional labour demand as follows:
• Scenario one: 31,000 jobs
• Scenario two: 205,000 jobs
• Scenario three: 517,000 jobs
This is after factoring in direct reductions elsewhere in the economy. If we also assume that the proportion of these jobs taken by migrant workers coming to Britain is in line with their share of the overall labour market (9.1 per cent in the first quarter of 2014) then the additional labour demand impacting on the UK labour market will be 28,000, 186,000 and 470,000 for scenarios one, two and three respectively.
These substantial figures stem from the fact that many circular economy activities, eg remanufacturing and recycling, require substantially more labour inputs than their linear economy alternatives, eg landfill or original manufacturing. Also, as the UK is a heavy net importer of both raw materials and manufactured products, the displacement of existing activity and employment is likely to be relatively modest.
It is important to emphasise that we have focused on the direct jobs created by circular economy activities. We have not explicitly allowed for any changes in employment emerging indirectly in the supply chain, or induced through changes in demand.71 In the absence of a detailed and disaggregated macroeconomic model, such effects are difficult to link to the regional or occupational categories that we work with. In other words, we do not know where any indirect or induced jobs would be created and which occupations would benefit.

46 47
create employment at the lower end of the occupational scale for elementary occupations. There is also significant scope for job creation in sales and customer services and administration and secretarial occupations.
Undertaking a calculation of the net job creation, similar to that adopted for the regions would suggest substantial scope for net job creation.
The results would be 12,000, 62,000 and 115,000 net jobs for scenarios one, two and three respectively.74
Deviation of occupational unemployment rate from that of the lowest occupational group and circular economy job creation potential under each scenario
0
50,000
100,000
150,000
200,000
250,000
300,000
350,000
Unemployment deviation
Scenario 1
Scenario 2
Scenario 3
Man
ager
s
Prof
essi
onal
s
Asso
ciat
epr
ofes
sion
al a
nd te
chni
cal
Adm
inis
trat
ion
and
sec
reta
rial
Skill
ed
Pers
onal
serv
ices
Sale
s an
d c
usto
mer
serv
ices
Ope
rativ
es
Elem
enta
ry
pers
ons
The result for skilled workers poses an interesting challenge: although there is some scope for creating new employment opportunities for unemployed skilled workers, the results suggest that the more extensive development of the circular economy under scenario three would imply a need for nearly all the skilled workers who are currently unemployed. It seems unlikely that all these workers would be exactly suitable for the new jobs, so part of the growth would come from displacing skilled workers employed elsewhere in the economy, migrants and lower skilled workers retrained to work in high skilled positions.
However, this ignores the fact that these calculations have so far been static, based on current patterns in the labour market. As was discussed earlier, there is expected to be an ongoing elimination of low and particularly mid-level occupations. The following chart includes the projected occupational changes made by the UKCES for the period 2012-22. As the figure shows, substantial declines in mid-level jobs are anticipated for the categories ‘administrative and secretarial’, ‘skilled’ and ‘operatives’.
These falls in employment are significantly larger than the expansion in employment implied under any of the circular economy scenarios, implying that there could be sufficient mid-level workers to take the new jobs without significant displacement.
Deviation of regional unemployment rate from that of the lowest unemployment region and circular economy job creation potential under each scenario
0
20,000
40,000
60,000
80,000
100,000
Nor
th E
ast
Nor
th W
est
York
shire
and
the
Hum
ber
East
Mid
land
s
Wes
t Mid
land
s
East
of E
ngla
nd
Lond
on
Sout
h Ea
st
Sout
h W
est
Wal
es
Scot
land
pers
ons
Unemployment deviation
Scenario 1
Scenario 2
Scenario 3
To illustrate the potential for net job creation by reducing regional mismatch, we need to make an assumption about the probabilities of new jobs involving displacement of existing jobs. We assume a sliding scale ranging from zero for the first job created in the North East, given the excess unemployment rate of around five per cent, to one in the lowest unemployment region of the South West. In other words, we assume that the first new job created in the North East is a genuine net job, as it is a ‘drop in the ocean’ of high unemployment. By contrast, in the low unemployment region of the South West, it may be much harder to find a suitable worker who is not already in employment, so we assume that the first person hired is a displacement.
As more people are hired for circular economy activities in the North East, the probability of displacement rises on a sliding scale and would reach a point when the North East unemployment rate converges with that of the South West.73
Following this approach, we estimate that scenarios one, two and three would create 8,000, 47,000 and 88,000 net jobs respectively. Once again these are likely to be conservative estimates as they ignore indirect and induced effects and the potential contribution from bringing inactive workers back into the labour market, or through creating full time positions for those who are currently involuntary part time workers.
Occupational labour market interactionsA similar approach can be taken with the occupational dimension to unemployment, which is an alternative approach to the one outlined above (the two are not additive).We looked at the extent to which job creation by occupational type could correspond with the deviation in the unemployment rate for each group, measured with respect to the unemployment rate of professionals. This is shown in the following graph. As the figure shows, there seems to be substantial scope to

48 49
Proportion of projected decline in mid-level occupational employment projected by UKCES that could be offset by growth in the circular economy job creation under each scenario over the next decade
0
5
10
15
20
25
Administration and secretarial Skilled Sales and customer services
Scenario 1
Scenario 2
Scenario 3
%
Below, we summarise the main quantitative estimates on the possible size of these impacts. These calculations are purely for illustrative purposes and are based on conservative assumptions regarding the labour market impacts of a growing circular economy.
Summary
Scenario one Scenario two Scenario three
Gross Jobs growth 31, 000 205, 000 517, 000
Unemployment fall 10, 000 54, 000 102, 000
Unemployment rate fall 0.02% 0.15% 0.28%
% of predicted decline in skilled employment over the next decade that is offset
1.3% 6.8% 17.7%
Note: Jobs figures are rounded to the nearest ‘000.
We have taken an average of the regional and occupational mismatch approaches to summarise the possible size of the impacts of the scenarios. These calculations are purely for illustrative purposes only and are based on conservative assumptions regarding the labour market impacts of a growing circular economy.
Under scenario two, where growth continues on its current trajectory, and where over 200,000 jobs (gross) could be created and unemployment could be cut by about 54,000, the national average unemployment rate would be reduced by around 0.1-0.2 percentage points. More substantial falls in unemployment would be expected for high unemployment regions or for those occupations with higher unemployment rates. This could also have the potential to offset around seven per cent of the expected decline in skilled employment to the year 2022.
More extensive development of the circular economy, as envisaged in our scenario three, could create around half a million additional jobs (gross) and reduce
Projected change in occupational employment and circular economy job creation potential under each scenario75
-550,000
-350,000
-150,000
50,000
250,000
450,000
650,000
850,000
1,050,000
1,250,000UKCES projection 2012-22Scenario 1Scenario 2Scenario 3
pers
ons
Man
ager
s
Prof
essi
onal
s
Asso
ciat
epr
ofes
sion
al a
nd te
chni
cal
Adm
inis
trat
ion
and
sec
reta
rial
Skill
ed
Pers
onal
serv
ices
Sale
s an
d c
usto
mer
serv
ices
Ope
rativ
es
Elem
enta
ry
0
In this way, the growth of the circular economy could make a useful contribution to partially offset the decline of mid-level occupations. The following chart shows the proportion of the projected decline in mid-level occupational employment from 2012-22 that could be offset by job creation in the circular economy under each scenario, the comparison was made possible by assuming that the circular economy grows in a linear manner up to 2030. The proportion is relatively modest for administrative and secretarial occupations, up to seven per cent, but more significant for sales and customer services, up to 22 per cent, and skilled occupations, up to 18 per cent. In addition, 27 per cent of the decline in the lower skilled ‘operatives’ occupations could also be offset by the growth of the circular economy.

50
6Conclusionunemployment by around 102,000, reducing the unemployment rate by close to
0.3 percentage points. Once again, more substantial falls in unemployment would be expected for high unemployment regions or for those occupations with higher unemployment rates. In this scenario, growth in the circular economy could potentially offset around 18 per cent of the expected loss in skilled employment over the next decade.

52 53
Annex
The following individuals participated in the scenario workshop:
Susanne Baker, EEF
John Barrett, Leeds University
Dustin Benton, Green Alliance
Will Blyth, Oxford Associates
Dan Coleman, BIS
Tamsin Cooper, Green Alliance
Gev Eduljee, SITA
Josh Fothergill, IEMA
Ray Georgeson, Resource Association
Roxarne Owen, Business in the Community
Julie Hill
Patrick Mahon, WRAP
Chris Sherrington, Eunomia
The British labour market faces a number of important challenges. It exhibits significant regional and occupational mismatch in employment, meaning that available opportunities are not necessarily well aligned, either with where the unemployed live, or with the skills they acquired in previous occupations. Labour market mismatches are thought to account for around three percentage points of the unemployment rate and are likely to have played a significant role in the rise in unemployment since the start of the financial crisis.76
Our analysis suggests that dealing with structural mismatch will require new employment opportunities in high unemployment regions, such as the north of England, that are suitable for low to intermediate skilled workers, perhaps with previous experience in manufacturing, retail or service industries. In addition, Britain, in common with many other countries, faces a significant challenge with the trend of declining mid-level occupations, through a combination of technological progress and competition from emerging economies.
Growth in the circular economy, whether modest or transformational, can create a wide variety of employment opportunities which directly tackle these challenges in the following ways:
• Regional unemployment disparities may be reduced by a broad geographical spread of employment opportunities in circular economy activities, which will be of particular benefit in higher unemployment regions.
• Occupational mismatch may be reduced by new opportunities across all skill levels.
• More extensive development of the circular economy, involving more remanufacturing, servitisation and repair, could create employment near existing manufacturing sites where unemployment tends to be higher. This may also draw on the large pool of unemployed, former employees of manufacturing industries in these areas.
The circular economy can also contribute to offsetting the decline in mid-level occupations. Sectors which provide mid-level employment, such as remanufacturing and closed loop recycling, offer potential routes to addressing the decline in mid-level occupations. Furthermore, if the circular economy were to be developed extensively, as in our scenario three, there could be a significant need for some types of higher skilled employment.
As our illustrative, quantitative analysis has shown, circular economy activity has important economic implications, with distinctive characteristics, to help address Britain’s labour market issues, both now and in the future. On the current development path, it has the potential to create over 200,000 gross jobs and reduce unemployment by about 54,000 by 2030. It could also offset around seven per cent of the expected decline in skilled employment to the year 2022. But, a more rapid development of circular economy activity could create around half a million jobs (gross) and reduce unemployment by around 102,000. It may also offset up to 18 per cent of the expected loss in skilled employment over the next decade.

54 55
Endnotes
earnings data. This is mainly because high earners are under represented in this survey.
29 Source: ONS, ASHE, and Green Alliance and WRAP calculations. Sectors categorised into three groups of broadly equal size in terms of employment. Data retrieved September 2014 Note: Change between 2003 q2 and 2014 q2.
30 UKCES, March 2014, Working futures, evidence report 83
31 UKCES, February 2014, The future of work: jobs and skills in 2030, evidence report 84
32 Ibid33 Source: ONS and WRAP calculations34 For instance, see EEB, 2014, Advancing resource
efficiency in Europe, European Environment Bureau, Brussels, Scottish Government, 2009, Scotland’s zero waste plan: consultation; annex O- Analysis of potential jobs created by zero waste; or Friends of the Earth, 2010, More jobs less waste: potential for job creation through higher rates of recycling in the UK and EU.
35 EEA, 2011, Earnings, jobs and innovation: the role of recycling in a green economy, EEA Report No 8/2011; ILO, 2011, Skills for green jobs: a global view; Ecotec, 2002, Analysis of the EU eco-industries, their employment and export potential, a report to DG Environment; APPSRG, 2014, Remanufacturing – towards a resource efficient economy, SITA UK , 2012, Driving green growth; Eunomia, 2011, From waste to work: the potential for a deposit refund system to create jobs in the UK; and Beck, 2001, US recycling economic information study, prepared for The National Recycling Coalition by R W Beck, Inc.
36 See www.wrapcymru.org.uk/blog/2013/05/green-growth-agenda-good-wales
37 As of November 201438 One measure of the degree of circularity, the
amount of material and resources recovered and cycled back into the economy (rather than exiting the economy as waste) as a proportion of total material and resources input, shows an increase in the decade to 2010 to 22 per cent from nine per cent largely reflecting the growth of recycling sector over that period. Based on WRAP’s vision for a circular economy by 2020 www.wrap.org.uk/content/wraps-vision-uk-circular-economy-2020.
39 The figures here do not distinguish between private/public jobs, it is likely that both will be similarly distributed across regions as these provide services to local populations.
40 ONS BRES 2013, op cit; and WRAP calculations41 WRAP/EA WRAP calculations42 ONS ASHE 2013; WRAP calculations43 ONS LFS; WRAP calculations44 It is through the process of biorefining that
biological feedstock materials are converted into higher value added products, fuels and fuel additives, and energy. Bio-feedstock is derived from treatment and processing of biodegradable wastes, such as food wastes, from households and commerce and industry, in some cases purpose grown plants and crops are also added.
45 Ecofys, 2014, Overview of UK biofuel producers, Ecofys by order of the Department for Transport
46 WRAP 2013 and 2014. Composting processes produce a marketable product – the compost itself – while anaerobic digestion yields biogas for energy or fuel generation, in addition to digestate, a biofertiliser which can be applied to land and is rich in nutrients such as nitrogen, phosphorus and other elements required for healthy plant growth and fertile soil.
47 WRAP/EA, WRAP calculations48 ECOFYS, 2014, op cit 49 NNFCC, 2012, UK jobs in the bioenergy sectors by
2020, report for DECC April 201250 According to the ONS ASHE, in 2013 average gross
hourly pay was £14 in transport and storage and £15 in office administrative, office support and other business support.
51 According to the ONS ASHE, in 2013 average gross hourly pay was £21 per hour in computer programming, consultancy and related activities and £22 per hour in information service activities.
52 Dr G Lavery, N Pennell, S Brown and Professor S Evans, 2013, The next manufacturing revolution: non-labour resource productivity and its potential for UK manufacturing, Next Manufacturing Revolution
53 NMR, 2013, op cit54 Foresight, 2013, The future of manufacturing: a
new era of opportunity and challenge for the UK, UK Government Office for Science
55 EEF, 2014, Backing Britain: a manufacturing base for the future
56 Papers which look at the economics of reuse include: K James, K Pratt, P Maddox, 2013, Understanding the economic and environmental impacts of re-use proceedings of the ISWA 2013 World Solid Waste Congress 7-9 October 2013, Vienna, Austria; E Kletzer, H Pilz, H Hutterer, (2004) Reparieren im Dienste der Nachhaltigkeit Kosten-Nutzen-Analyse und Untersuchung der Auswirkung auf Ressourcenverbrauch, Energiebedarf und Beschäftigung an Hand von drei Fallbeispielen, Bundesministerium für Land- und Forstwirtschaft, Umwelt und Wasserwirtschaft, Wien; I Rüdenauer, C O Gensch, 2005, Eco-Efficiency analysis of washing machines – Further use versus substitution of washing machines in stock, Öko-Institut, Freiburg, Germany; I Rüdenauer, C O Gensch, D Quack, 2005, Eco-efficiency analysis of washing machines – Further use versus substitution of washing machines in life cycle assessment and determination of optimal life span, Öko-Institut V, Freiburg, Germany; and WRAP, 2011, A methodology for quantifying the environmental and economic impacts of re-use, www.wrap.org.uk/content/environmental-and-economic-benefits-re-use
57 See WRAP; 2011 and James et al, 2013, op cit58 According to the ONS ASHE, in 2013 average gross
hourly pay was £22 per hour for scientific research and development and £24 per hour for research and experimental development on biotechnology.
1 Overviews of these issues are provided by: B Lee, F Preston, J Kooroshy, R Bailey and G Lahn, 2012, Resource futures, Chatham House; and R Dobbs, J Oppenheim, F Thompson, Ml Brinkman and M Zornes, 2012, Resource revolution: meeting the world’s energy, material, food and water needs, McKinsey & Company
2 An early example of the concept of a circular economy originates from Walter R Stahel’s pioneering work on sustainability; see, for example, Walter R Stahel, 1982, ‘The product-life factor’, The Product-Life Institute, Geneva, which describes a closed loop economy, now referred to as a circular economy.
3 2020C, 2014, Sweating our assets: productivity and efficiency across the UK economy, 2020 Conservatives; M Rowney, 2014, The wasteline: redefining ‘waste’ and improving resource management policy, IPPR; D Benton, J Hazell and J Hill, 2013, Resource resilient UK, Green Alliance
4 J Smith, 2012, ‘Unemployment and mismatch in the UK’ from the Bank of England/Institute of Macroeconomics conference on ‘Unemployment, productivity and potential output: the aftermath of the crisis’, October 2012; and C Patterson, A Sahin, G Topa and G L Violante, 2013, Mismatch unemployment in the UK, mimeo Federal Reserve Bank of New York website
5 Estimated increase in labour demand from the growth in the circular economy (total jobs created directly less any jobs lost in displaced activities). No indirect or induced employment is included.
6 Estimated change in the number of people unemployed as a result of the gross job creation, after taking into account labour market interactions. No indirect or induced employment is included. These figures are the average of the net job creation estimates under the regional and occupational mismatch approaches.
7 Projections taken from: UKCES, March 2014, Working futures, evidence report 83
8 Many definitions of the circular economy are possible. See, for instance: communication from the Commission to the European Parliament, the Council, the European Economic and Social Committee and the Committee of the Regions, 2014, Towards a circular economy: a zero waste programme for Europe.
9 D Benton, J Hazell and J Hill, 2013, Resource resilient UK, Green Alliance
10 Dr G Lavery, N Pennell, S Brown and Professor S Evans, 2013, The next manufacturing revolution: non-labour resource productivity and its potential for UK manufacturing, Next Manufacturing Revolution
11 www.wrap.org.uk/content/innovative-business-models-1
12 For instance, see EEB, 2014, Advancing resource efficiency in Europe, European Environment Bureau, Brussels, Scottish Government, 2009, Scotland’s zero waste plan: consultation; annex O- Analysis of potential jobs created by zero waste; or Friends of the Earth, 2010, More jobs less waste: potential for job creation through higher rates of recycling in the UK and EU.
13 An excellent overview of these issues – albeit in the context of renewable energy and energy efficiency – is provided by UKERC, 2014, Low carbon jobs: the evidence for net job creation from policy support for energy efficiency and renewable energy.
14 There is also the notion of the NAWRU – non-accelerating wage rate of unemployment – which reflects that in an open economy, inflation will be driven by many factors not just the tightness of the labour market. Wages may give a better indication as they are the variable that should most directly respond to overheating in the jobs market.
15 Short and long run are typically not defined by economists. Short run can be seen as the initial period which can be characterised by significant disequilibria in labour and product markets resulting from recent economic shocks. The long run is after all the economic adjustments have worked themselves out and the economy has returned to an equilibrium state. How long this takes will depend on the strength of these adjustment mechanisms and would be expected to be faster in a more flexible economy.
16 For instance see R Layard, S Nickell and R Jackman, 1991, Unemployment: macroeconomic performance and the labour market, Oxford University Press
17 J Smith, 2012, ‘Unemployment and mismatch in the UK’, Bank of England/Institute of Macroeconomics conference on ‘Unemployment, productivity and potential output: the aftermath of the crisis’, October 2012
18 C Patterson, A Sahin, G Topa and G L Violante, 2013, Mismatch unemployment in the UK, mimeo Federal Reserve Bank of New York website
19 See, for instance, J Plunkett and J P Pessoa, 2013, A polarising crisis? The changing shape of the UK and US labour markets from 2008 to 2012, Resolution Foundation
20 Source: ONS, Labour force survey, data retrieved October 2014. Rates calculated with respect to the population aged 16-64 (1) and the labour force aged 16-64 (2)
21 Source: Green Alliance calculations using ONS, Labour force survey, data retrieved October 2014
22 Ibid23 Source: ONS, Labour force survey, retrieved
October 201424 Ibid25 Source: ONS, Vacancy survey, retrieved October
201426 UKCES, March 2014, Working futures, evidence
report 83
27 Source: ONS, Labour force survey and vacancy survey, and Green Alliance calculations. FIRE stands for Finance, Insurance and Real Estate. Data retrieved October 2014
28 Source: ONS, Labour force survey; and Green Alliance calculations, data retrieved September 2014. Note: Change between 2003 q2 and 2014 q2. An important caveat with these data is that the ONS indicate that the Labour force survey is known to underestimate gross weekly and hourly

56
59 According to the famous quote, “It is difficult to make predictions, especially about the future” variously attributed to the Danish Physicist Niels Bohr or the American Baseball player Yogi Berra.
60 EEB, 2014, op cit61 Such as EEB, 2014; and Friends of the Earth, 2010,
op cit62 In those sectors most amenable to
remanufacturing – broadly corresponding to SIC divisions 26-30 (representing around a quarter of manufacturing employment) – following NMR, 2013, op cit
63 See EEB, 2014; and Friends of the Earth, 2010, op cit
64 NMR, 2013, op cit65 EEB, 2014, op cit. A recycling rate of 70 per cent
was the assumption in their ‘medium’ scenario and was also used in exercises by Friends of the Earth 2010, op cit.
66 These assumptions were heavily informed by the NMR, 2013, op cit. The sectors most amenable to remanufacturing broadly correspond to SIC divisions 26-30. And the NMR reckon that a remanufacturing rate of 50 per cent is possible for these sectors.
67 www.alueurope.eu/wp-content/uploads/2011/ 07/846_ANNEX_Press-Release-Alu-bevcans-recycling-2009final26July2011.pdf
68 www.biffa.co.uk/assets/files/News/2014/Midcounties-Co-operatives-Achieve-90-Recycling.pdf
69 See NMR, 2013, op cit70 We do not include biorefining in these calculations
due to a lack of suitable figures on employment by occupation and region.
71 Nevertheless, some indirect effects from the supply chain will be picked-up implicitly in our calculations. For instance we calculate the relationship between the recycling rate and employment in waste and recycling, so elements of the supply chain that are in the waste and recycling sectors will be included in such a calculation. The elements of the supply chain which lie outside these sectors will not be.
72 Friends of the Earth, 2010, op cit73 The unemployment rate would only asymptotically
converge on that of the South West as the probability of displacement rises with each new hire in the North East.
74 As a robustness check we tested a scenario that did not assume that a full convergence in the occupational unemployment rates was feasible, on the basis that some differentials are likely to be permanent. Instead we assumed that the overall excess unemployment would be the same as in the regional calculations and scaled down the excess unemployment estimates accordingly. With such an assumption, the net job creation under scenarios one, two and three would be 8,000, 56,000 and 92,000 respectively.
75 Green Alliance calculations; and UKCES, 2014, op cit
76 J Smith, 2013; and C Patterson, et al, 2013, op cit

Green Alliance36 Buckingham Palace Road London SW1W 0RET 020 7233 7433
[email protected]: greenallianceblog.org.uktwitter: @GreenAllianceUKThe Green Alliance Trust Registered charity no. 1045395 Company limited by guarantee (England and Wales) no. 3037633Registered at the above address
WRAP21 Horse Fair, Banbury Oxon OX16 0AHT 01295 819900
[email protected]: wrap.org.uk/blogtwitter: @WRAP_UKWRAP Registered charity no. 1159512 Company limited by guarantee (England and Wales) no. 4125764 Registered at the above address