Opportunities and challenges of fisheries globalisation ... · Seafood processing local sources,...
37
1 Seafood processing local sources, global markets Alda B. Möller, Seafood Industry Consultant, Iceland Opportunities and challenges of fisheries globalisation
Transcript of Opportunities and challenges of fisheries globalisation ... · Seafood processing local sources,...
1
Seafood processing local sources, global markets
Alda B. Möller, Seafood Industry Consultant, Iceland
Opportunities and challenges of fisheries globalisation
2
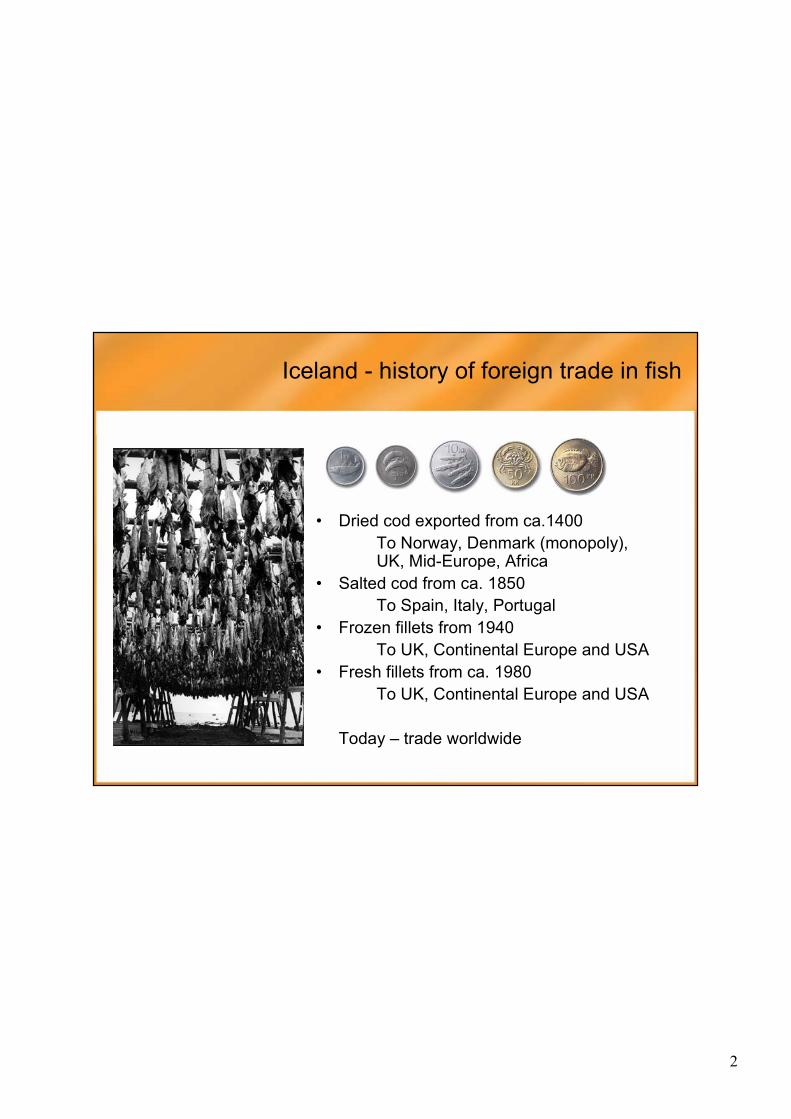
• Dried cod exported from ca.1400To Norway, Denmark (monopoly), UK, Mid-Europe, Africa
• Salted cod from ca. 1850To Spain, Italy, Portugal
• Frozen fillets from 1940To UK, Continental Europe and USA
• Fresh fillets from ca. 1980To UK, Continental Europe and USA
Today – trade worldwide
Iceland - history of foreign trade in fish

3
Iceland - Fisheries in the national economy 2005
• Fisheries create 6.8 % of GDP
• Employ 6.4 % of labour force –10,000 people
• Create 56.7 % of value of export commodities
• Landings were 1.7 million MT
• Exports were 750,000 MT
• Export value ISK 110 billion, equal ~USD 1,750 million
• Population now 310,000

4
Utilization of world fisheries production 1991 - 2004
0
20
40
60
80
100
120
140
1991 1993 1995 1997 1999 2001 2003
Mill
ion
MT
Fresh Frozen Salted/dried Canned Fishmeal Other
Fresh
Frozen
Fishmeal
Salted/driedCanned
Other
Source: FAO Fisheries Stats 2006

5
Fresh and frozen disposition of world fisheries production
26.723.0Frozen - world
54.935.5Fresh - world
12.013.0Frozen – developed countries
2.01.0Fresh – developed countries
14.710.0Frozen – developing countries
52.934.5 Fresh – developing countries
2004 million MT
Live weight
1994 million MT
Live weight
Source: FAO Fisheries Statistics, 2006, Commodities

6
Fresh and frozen disposition of world fisheries production - volume
26.723.0Frozen – world
54.935.5Fresh – world
12.013.0Frozen – developed countries
2.01.0Fresh – developed countries
14.710.0Frozen – developing countries
52.934.5 Fresh – developing countries
2004 million MT
Live weight
1994 million MT
Live weight
Source: FAO Fisheries Statistics, 2006, Commodities
7
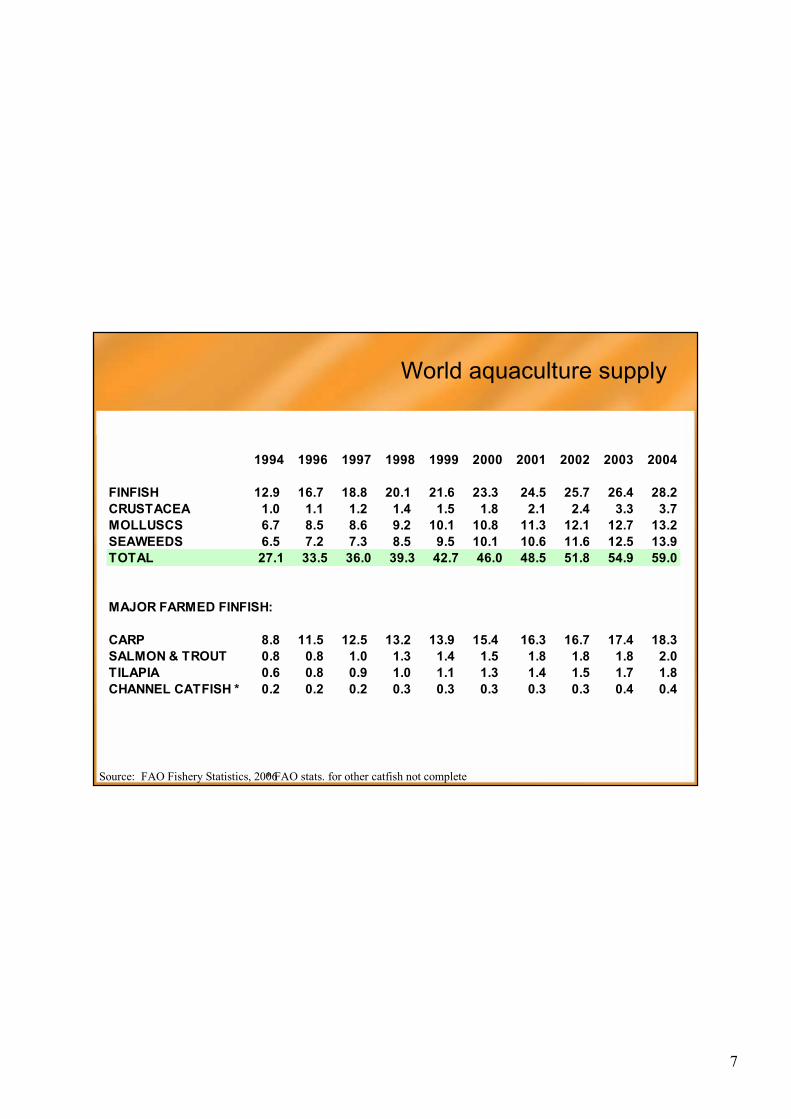
World aquaculture supply
1994 1996 1997 1998 1999 2000 2001 2002 2003 2004
FINFISH 12.9 16.7 18.8 20.1 21.6 23.3 24.5 25.7 26.4 28.2CRUSTACEA 1.0 1.1 1.2 1.4 1.5 1.8 2.1 2.4 3.3 3.7MOLLUSCS 6.7 8.5 8.6 9.2 10.1 10.8 11.3 12.1 12.7 13.2SEAWEEDS 6.5 7.2 7.3 8.5 9.5 10.1 10.6 11.6 12.5 13.9TOTAL 27.1 33.5 36.0 39.3 42.7 46.0 48.5 51.8 54.9 59.0
MAJOR FARMED FINFISH:
CARP 8.8 11.5 12.5 13.2 13.9 15.4 16.3 16.7 17.4 18.3SALMON & TROUT 0.8 0.8 1.0 1.3 1.4 1.5 1.8 1.8 1.8 2.0TILAPIA 0.6 0.8 0.9 1.0 1.1 1.3 1.4 1.5 1.7 1.8CHANNEL CATFISH * 0.2 0.2 0.2 0.3 0.3 0.3 0.3 0.3 0.4 0.4
* FAO stats. for other catfish not completeSource: FAO Fishery Statistics, 2006

8
Trade in world fisheries production
30.233.2Production – developed countries22.719.2Exports – developed countries
30.128.1Exports – developing countries110.379.7Production – developing countries
38%42%Proportion for export52.847.4Exports - world
140.5112.9Production – world
2004 million MT
Live weight
1994 million MT
Live weight
Source: FAO Fisheries Statistics, 2006, Commodities
9
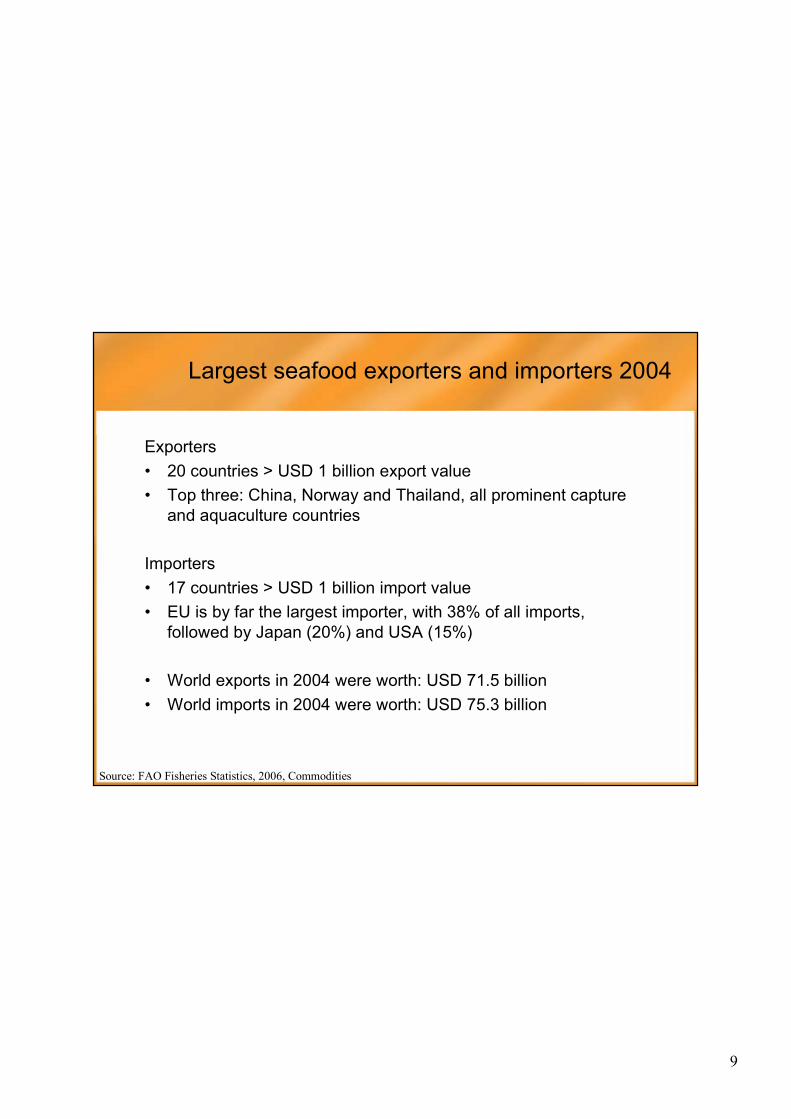
Largest seafood exporters and importers 2004
Exporters • 20 countries > USD 1 billion export value• Top three: China, Norway and Thailand, all prominent capture
and aquaculture countries
Importers• 17 countries > USD 1 billion import value• EU is by far the largest importer, with 38% of all imports,
followed by Japan (20%) and USA (15%)
• World exports in 2004 were worth: USD 71.5 billion• World imports in 2004 were worth: USD 75.3 billion
Source: FAO Fisheries Statistics, 2006, Commodities

10
Fisheries supply for top three importers2001-2003 average
7.6
9.3
11.1
Supply
1.5
0.4
6.4
-Exports
2913.75.4USA
1274.35.4Japan
38010.57.0EU (15)
PopulationMillion people
+Imports
Production
Volume in million MT
Based on: FAO Fisheries Statistics, 2006, Commodities –rounded figures. Non-food uses included

11
EU self sufficiency for fisheries products 1997-2006
0102030405060708090
100
1997 1998 1999 2000 2001 2002 2003 2004* 2005* 2006*
% s
elf s
uffic
ienc
y
Source: AIPCE report 2006, EU 15 1995-2003, EU 25 2004-2006 - *estimates
EU catches vs imports – products for human consumption40% self sufficiency

12
EU imports and own landings of groundfishpollock, cod, haddock, saithe, redfish, hake, hoki, plaice
0
500
1,000
1,500
2,000
2,500
3,000
3,500
4,000
1998 1999 2000 2001 2002 2003 2004* 2005*
'000
MT
Imports
EU landings
Source: AIPCE report 2006, EU 15 1995-2003, EU 25 2004-2006 - *estimates
13
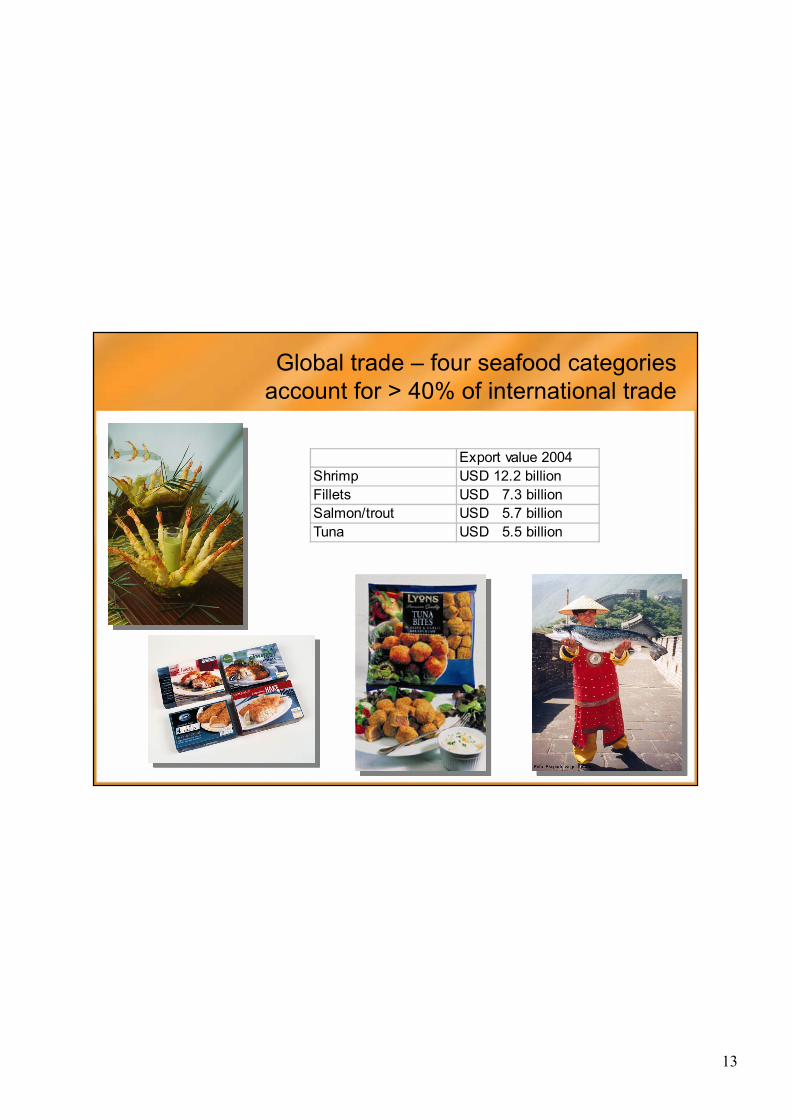
Global trade – four seafood categoriesaccount for > 40% of international trade
Export value 2004Shrimp USD 12.2 billionFillets USD 7.3 billionSalmon/trout USD 5.7 billionTuna USD 5.5 billion

14
Shrimp processing and trade
• 2004 global trade shrimp USD 12.2 billion– frozen USD 8.5 billion– canned USD 2.8 billion– other USD 0.8 billion
• Largest producers: Vietnam, Thailand, India - third of global volume• Largest importers US and Japan ~ 60% of traded volume• Shrimp is top category in US consumption
• Farmed supply dominates global trade• Whiteleg shrimp and black tiger most important traded species

15
Global production of farmed shrimp/prawn - saltwater
559 566 537 480 503 548 633 676 593 666 721
121 142 140 172 194 186 145280 431
10571386
0
500
1,000
1,500
2,000
2,500
3,000
1994 1995 1996 1997 1998 1999 2000 2001 2002 2003 2004
thou
sand
mt
Black tiger shrimp White shrimp Other species
Source: FAO Fisheries Statistics, 2006, Aquaculture

16
Farmed production of white shrimp
0200400600800
1,0001,2001,4001,600
1994 1995 1996 1997 1998 1999 2000 2001 2002 2003 2004
thou
sand
s M
T
China Thailand Brazil Equador Others
Source: FAO Fisheries Statistics, 2006, Aquaculture
17
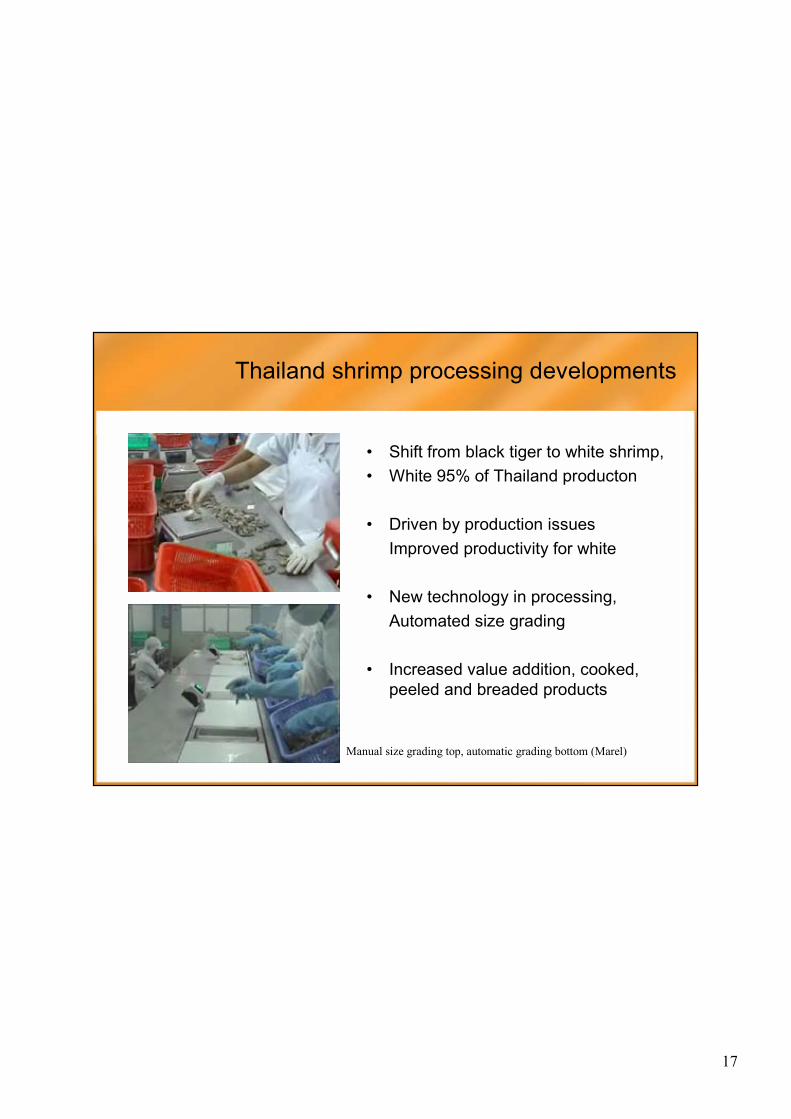
• Shift from black tiger to white shrimp, • White 95% of Thailand producton
• Driven by production issuesImproved productivity for white
• New technology in processing,Automated size grading
• Increased value addition, cooked, peeled and breaded products
Thailand shrimp processing developments
Manual size grading top, automatic grading bottom (Marel)
18
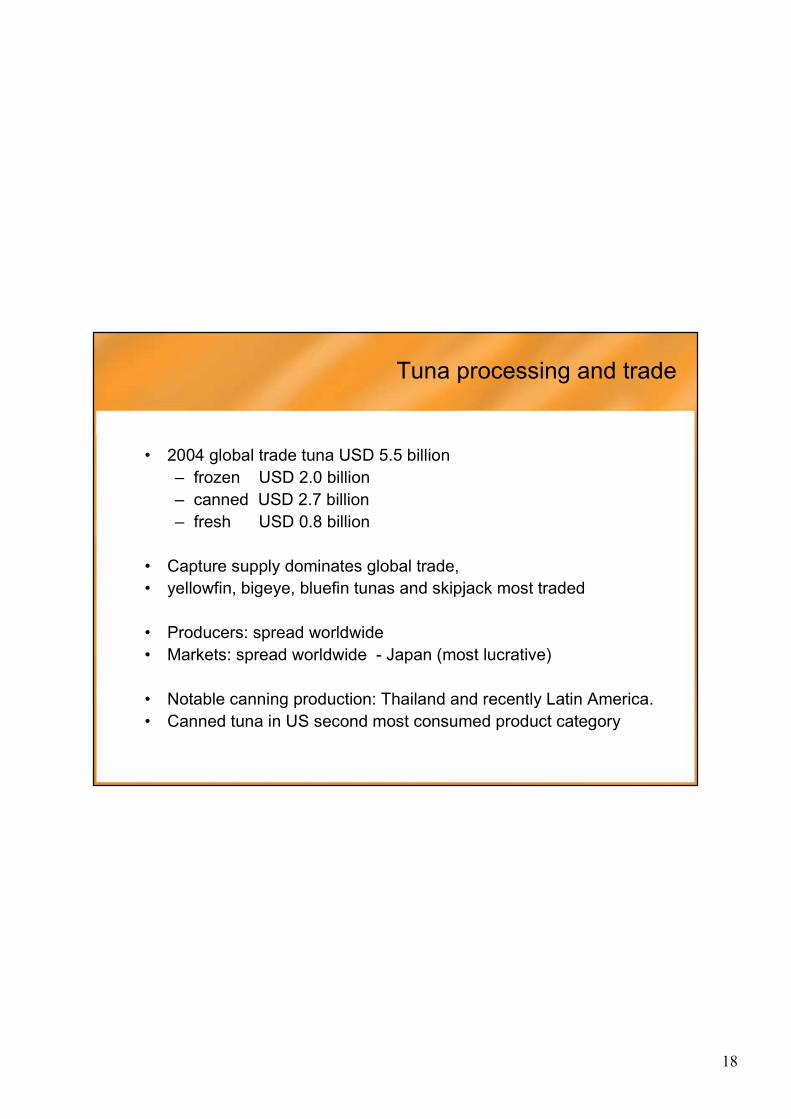
Tuna processing and trade
• 2004 global trade tuna USD 5.5 billion– frozen USD 2.0 billion– canned USD 2.7 billion– fresh USD 0.8 billion
• Capture supply dominates global trade, • yellowfin, bigeye, bluefin tunas and skipjack most traded
• Producers: spread worldwide• Markets: spread worldwide - Japan (most lucrative)
• Notable canning production: Thailand and recently Latin America.• Canned tuna in US second most consumed product category

19
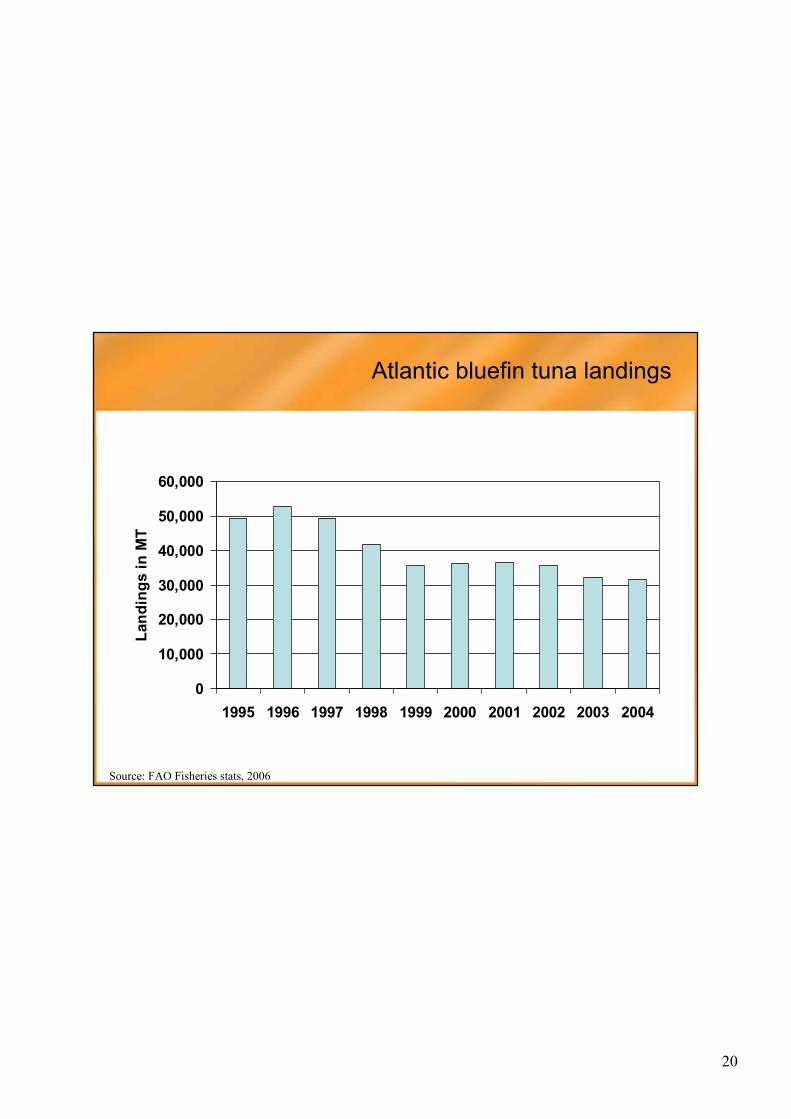
• Atlantic bluefin under great fishing pressure, landings decreasing
• Farming of bluefin tuna increasing, involves capture of small fish and on-growing to market size
• Producers: Spain, Croatia, Turkey • Freshly slaughtered full-size brought to
Japanese motherships for freezing in nitrogen.
• Production in 2004 was 6,500 MT, increasing rapidly
• 80% of Atlantic bluefin imports to Japan are reported to be farmed
Bluefin tuna processing developments
Harvesting farmed Atlantic bluefin tuna
Kali Tuna – Croatia, 2007
20
Atlantic bluefin tuna landings
0
10,000
20,000
30,000
40,000
50,000
60,000
1995 1996 1997 1998 1999 2000 2001 2002 2003 2004
Land
ings
in M
T
Source: FAO Fisheries stats, 2006
21
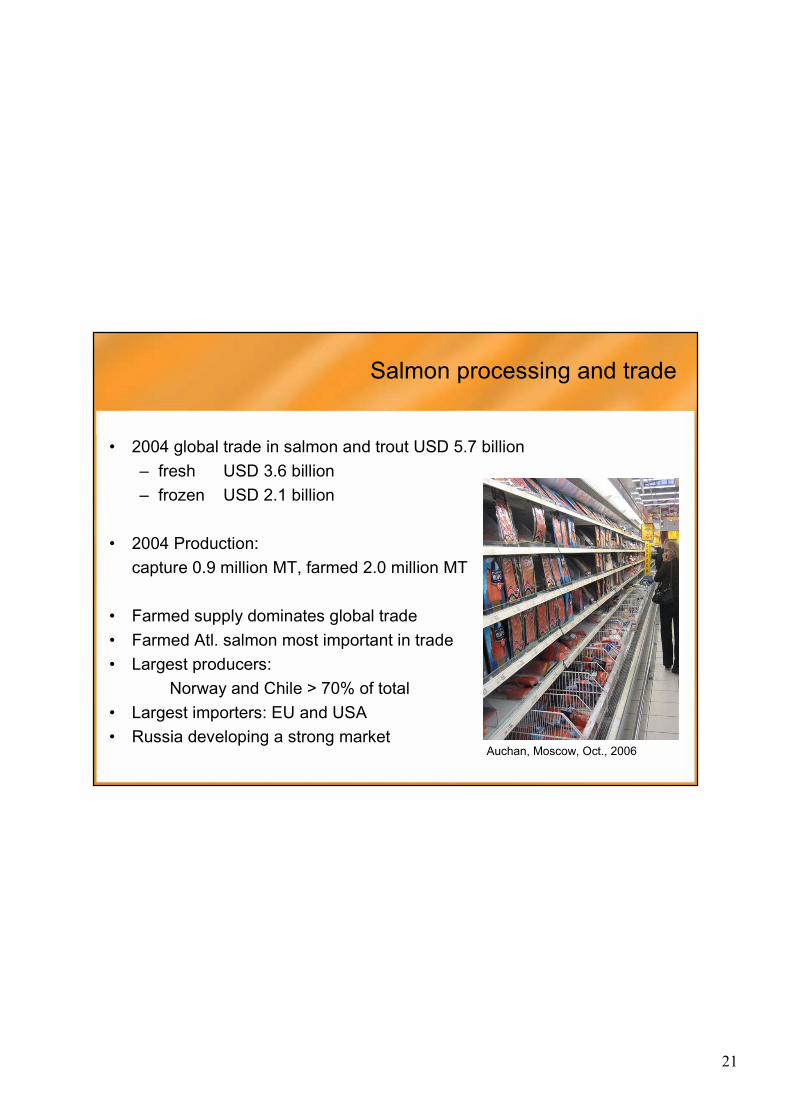
Salmon processing and trade
• 2004 global trade in salmon and trout USD 5.7 billion– fresh USD 3.6 billion– frozen USD 2.1 billion
• 2004 Production: capture 0.9 million MT, farmed 2.0 million MT
• Farmed supply dominates global trade• Farmed Atl. salmon most important in trade• Largest producers:
Norway and Chile > 70% of total• Largest importers: EU and USA • Russia developing a strong market
Auchan, Moscow, Oct., 2006
22
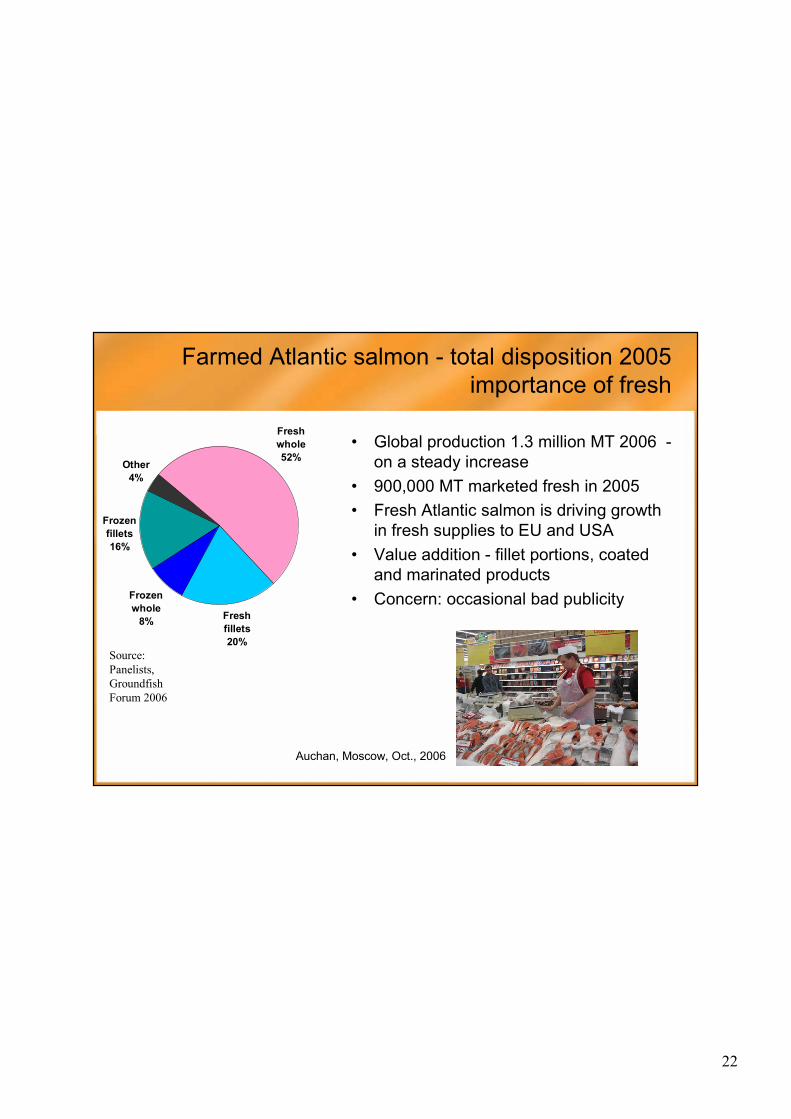
Farmed Atlantic salmon - total disposition 2005importance of fresh
• Global production 1.3 million MT 2006 -on a steady increase
• 900,000 MT marketed fresh in 2005• Fresh Atlantic salmon is driving growth
in fresh supplies to EU and USA• Value addition - fillet portions, coated
and marinated products• Concern: occasional bad publicity
Fresh whole52%
Fresh fillets20%
Frozen whole
8%
Frozen fillets16%
Other4%
Auchan, Moscow, Oct., 2006
Source: Panelists, Groundfish Forum 2006
23
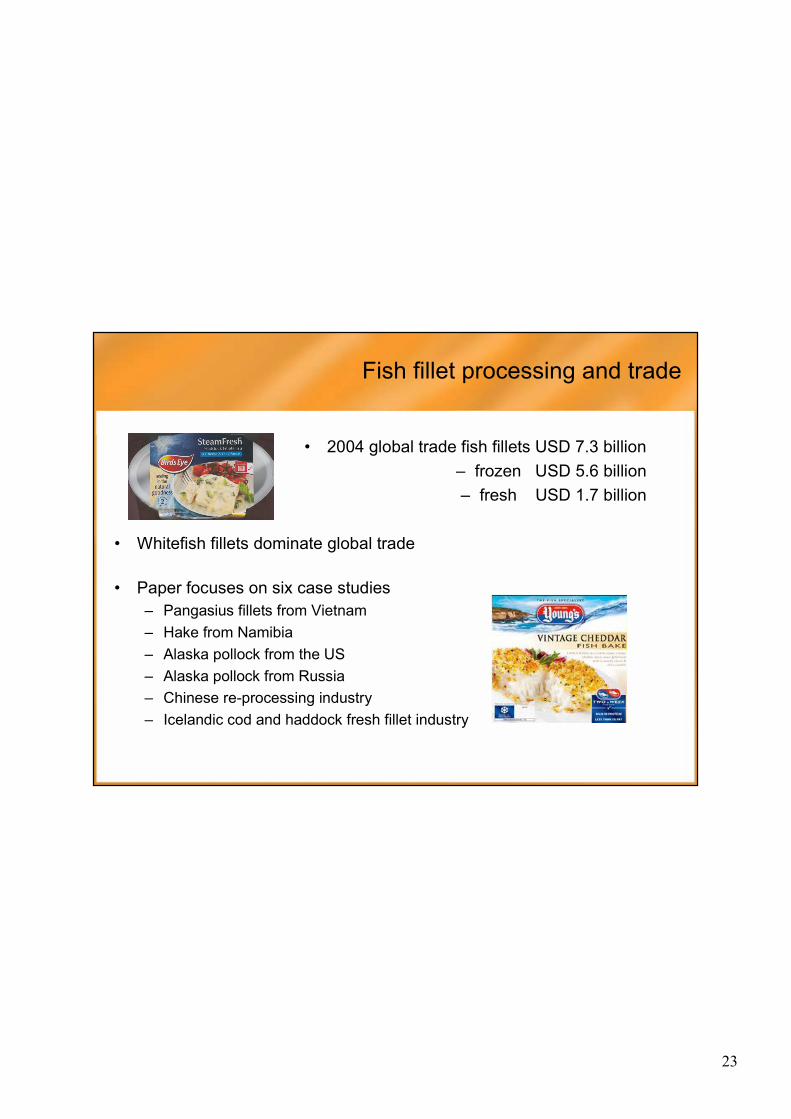
Fish fillet processing and trade
• 2004 global trade fish fillets USD 7.3 billion– frozen USD 5.6 billion– fresh USD 1.7 billion
• Whitefish fillets dominate global trade
• Paper focuses on six case studies– Pangasius fillets from Vietnam– Hake from Namibia– Alaska pollock from the US– Alaska pollock from Russia– Chinese re-processing industry– Icelandic cod and haddock fresh fillet industry
24
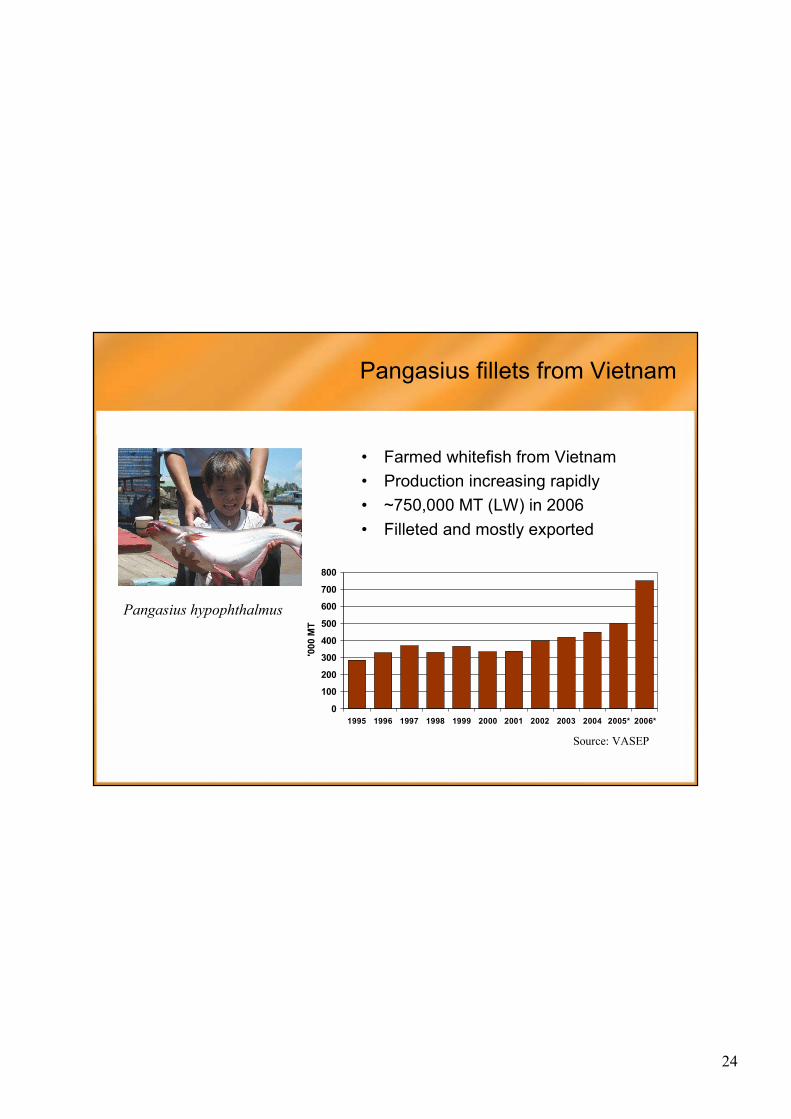
Pangasius fillets from Vietnam
• Farmed whitefish from Vietnam• Production increasing rapidly• ~750,000 MT (LW) in 2006• Filleted and mostly exported
Pangasius hypophthalmus
0
100
200
300
400
500
600
700
800
1995 1996 1997 1998 1999 2000 2001 2002 2003 2004 2005* 2006*
'000
MT
Source: VASEP
25
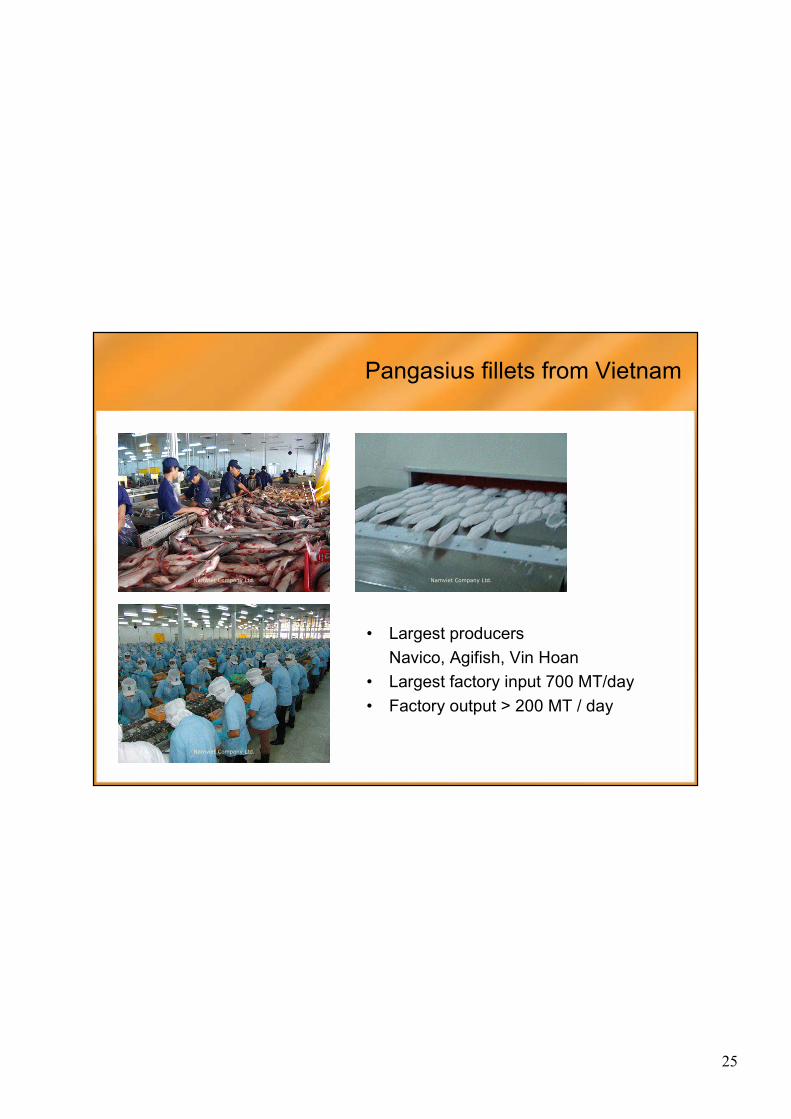
Pangasius fillets from Vietnam
Namviet Company Ltd.
Namviet Company Ltd.
Namviet Company Ltd.
• Largest producers Navico, Agifish, Vin Hoan
• Largest factory input 700 MT/day • Factory output > 200 MT / day
26
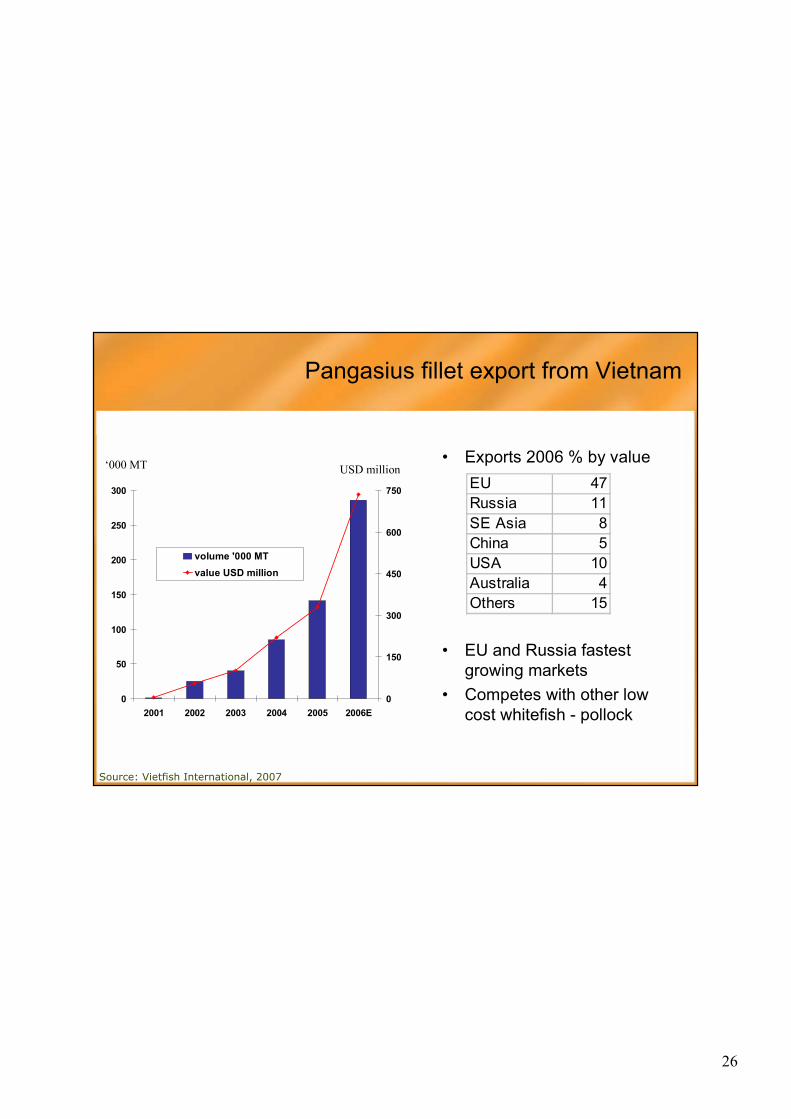
• Exports 2006 % by value
• EU and Russia fastest growing markets
• Competes with other low cost whitefish - pollock
0
50
100
150
200
250
300
2001 2002 2003 2004 2005 2006E0
150
300
450
600
750
volume '000 MTvalue USD million
Source: Vietfish International, 2007
EU 47Russia 11SE Asia 8China 5USA 10Australia 4Others 15
Pangasius fillet export from Vietnam
‘000 MT USD million

27
Drivers and challenges for Vietnamese pangasius
• Drivers:Abundance and moderate price, adequate quality
• Challenges for producers– Anti-dumping taxes in the US – Cost inflation– Possible shortage of labour– Food safety issues– Integration and consolidation
Namviet Company Ltd.
28
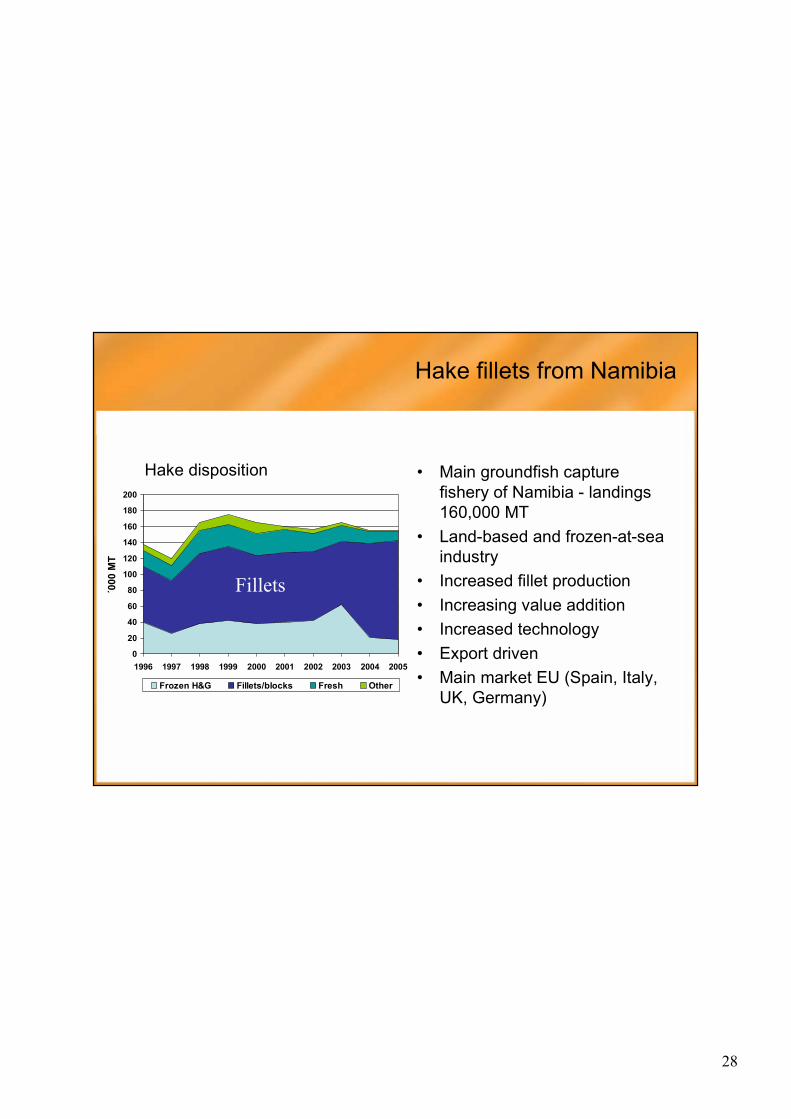
Hake fillets from Namibia
• Main groundfish capture fishery of Namibia - landings 160,000 MT
• Land-based and frozen-at-sea industry
• Increased fillet production • Increasing value addition• Increased technology• Export driven• Main market EU (Spain, Italy,
UK, Germany)
0
20
40
60
80
100
120
140
160
180
200
1996 1997 1998 1999 2000 2001 2002 2003 2004 2005
´000
MT
Frozen H&G Fillets/blocks Fresh Other
Fillets
Hake disposition
29
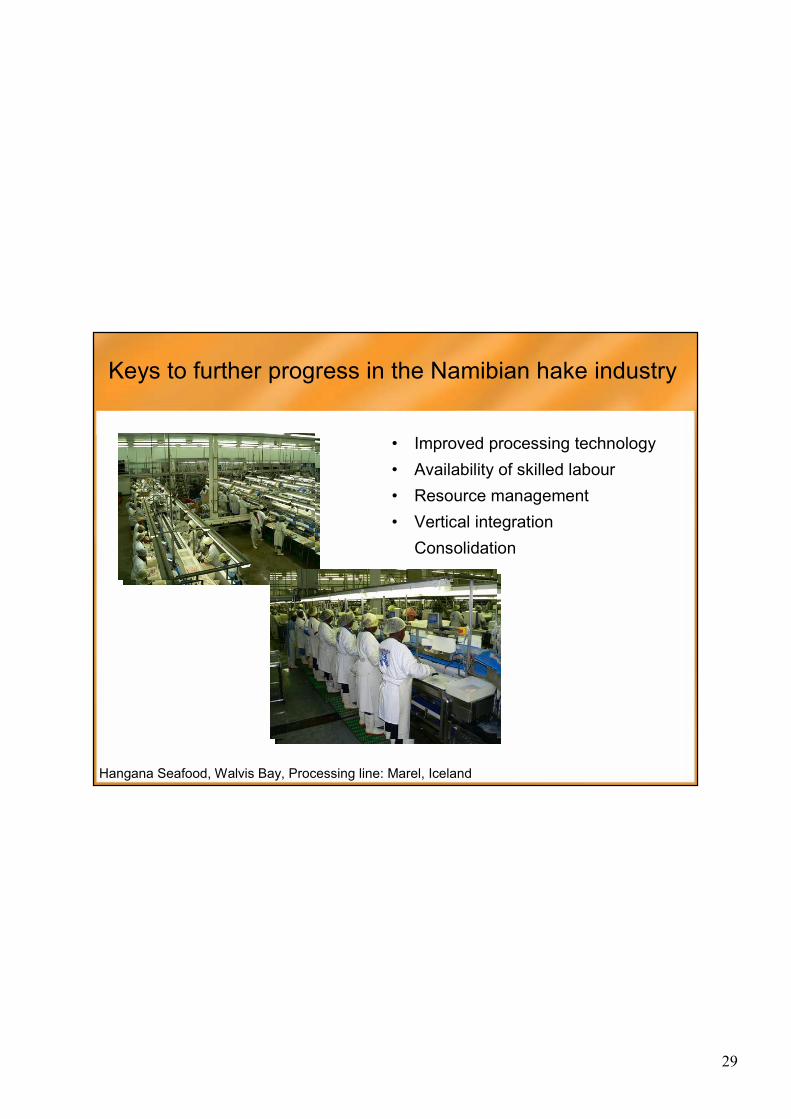
Keys to further progress in the Namibian hake industry
• Improved processing technology• Availability of skilled labour• Resource management • Vertical integration
Consolidation
Hangana Seafood, Walvis Bay, Processing line: Marel, Iceland
30
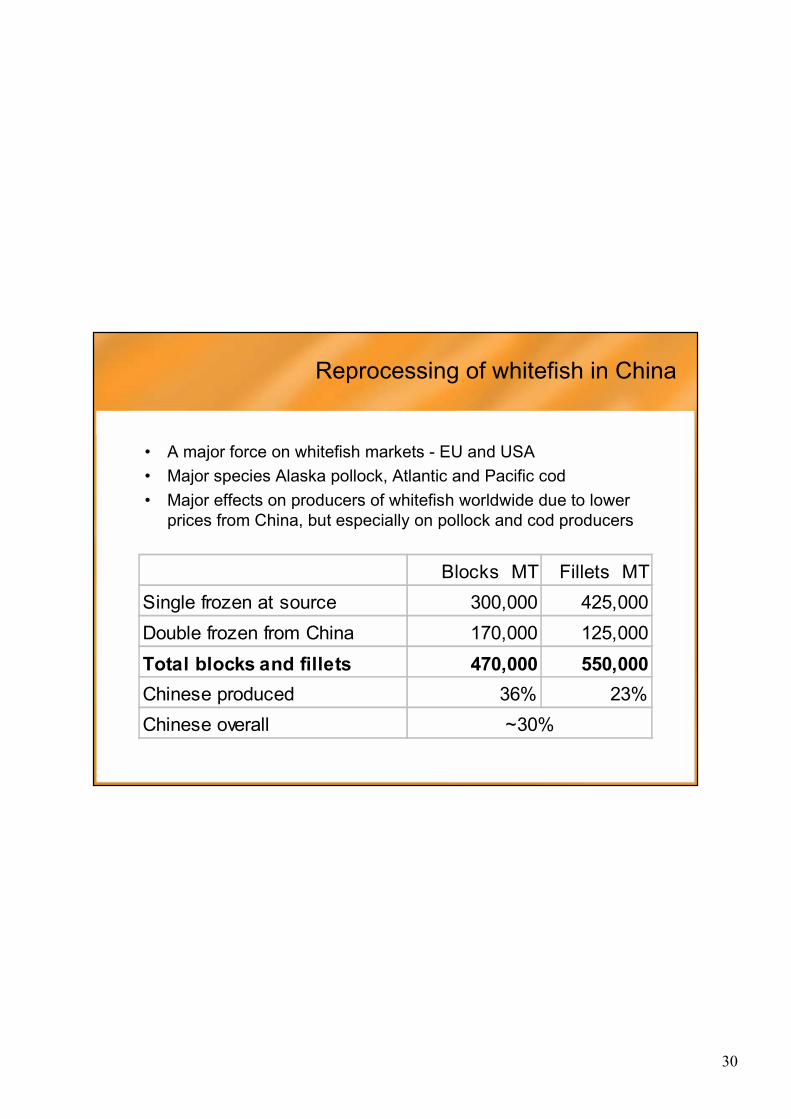
• A major force on whitefish markets - EU and USA• Major species Alaska pollock, Atlantic and Pacific cod• Major effects on producers of whitefish worldwide due to lower
prices from China, but especially on pollock and cod producers
Blocks MT Fillets MTSingle frozen at source 300,000 425,000Double frozen from China 170,000 125,000Total blocks and fillets 470,000 550,000Chinese produced 36% 23%Chinese overall ~30%
Reprocessing of whitefish in China
31
0
20
40
60
80
100
120
140
160
1997 1998 1999 2000 2001 2002 2003 2004 2005 2006
'000
MT
prod
uct w
eigh
t
EU USA
EU
US
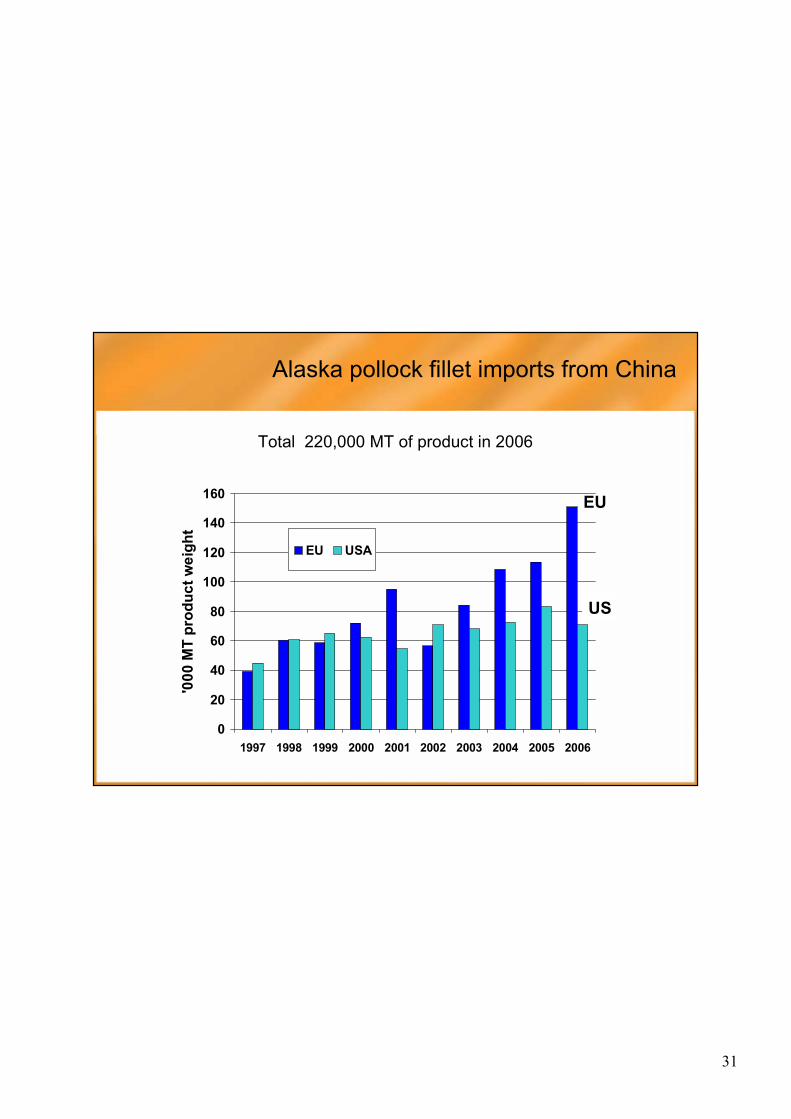
Alaska pollock fillet imports from China
Total 220,000 MT of product in 2006

32
0
10
20
30
40
50
60
1997 1998 1999 2000 2001 2002 2003 2004 2005 2006
'000
MT
prod
uct w
eigh
t
EU USA
EU
US
Cod fillet imports from China
Total 90,000 MT of product in 2006

33
• Drivers:Value addition in processing, increased number of species Abundance and moderate price, adequate quality
• Challenges for producers in China· Strength of the RMB · Increased overhead and labour costs· Labour shortage· Quality issues
Drivers and challenges for fillets from China
It is “glorious to get rich”Deng Xiaoping, 1980
34
02468
101214161820
1997 1998 1999 2000 2001 2002 2003 2004 2005 2006
'000
MT
prod
uct w
eigh
t
0
50
100
150
200
250
300
350
'000
MT
tota
l lan
ding
s
Fresh products Total catch
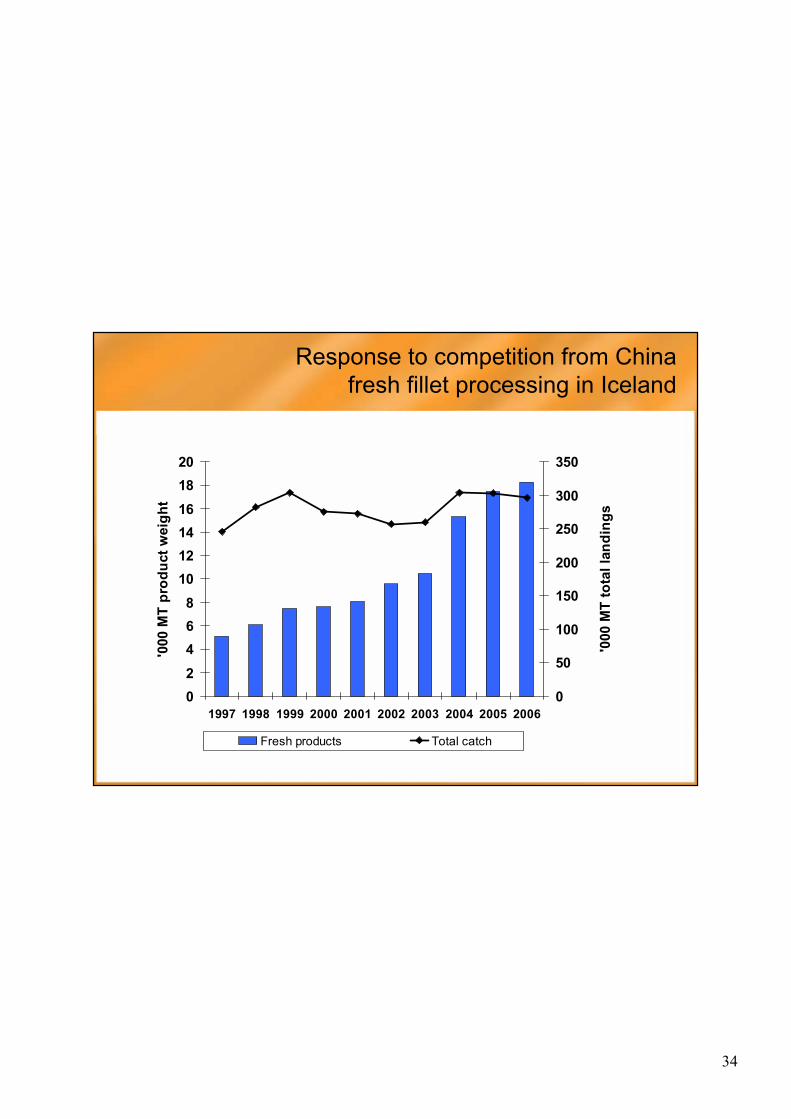
Response to competition from China fresh fillet processing in Iceland
35
0
200
400
600
800
1000
1200
1400
1992 1994 1996 1998 2000 2002 2004 2006
Mill
ion
GB
P
Frozen seafood
Chilled seafood
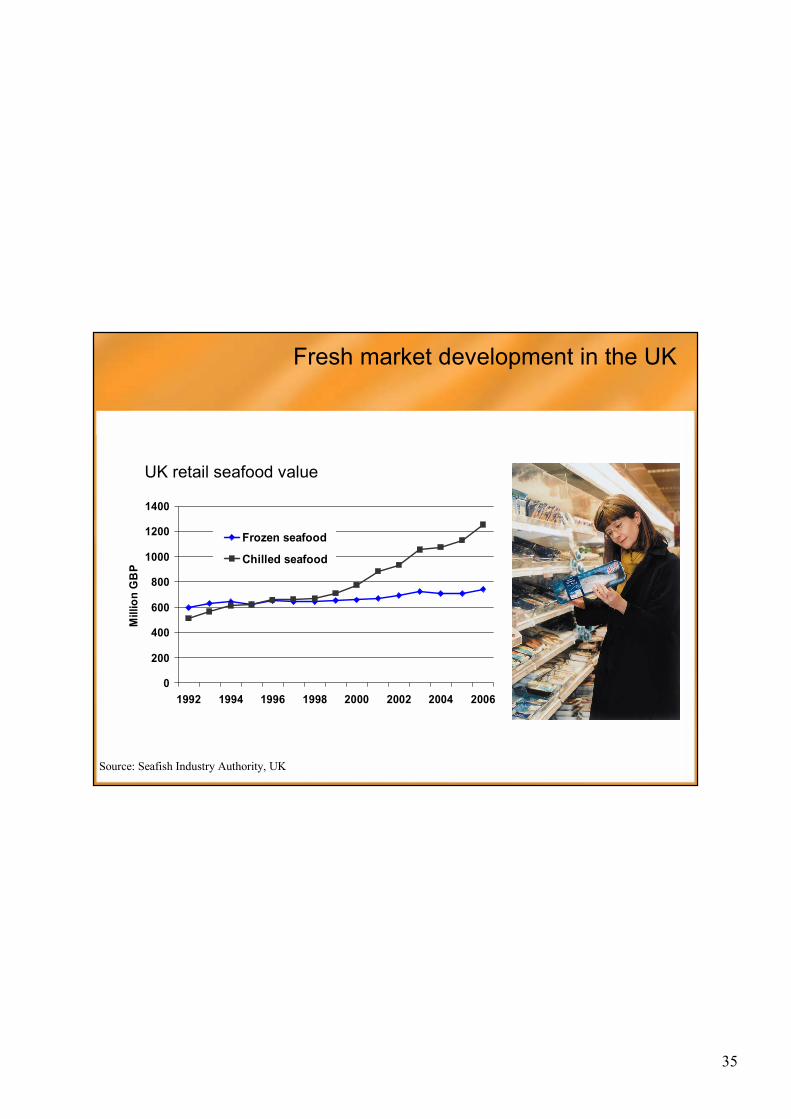
Fresh market development in the UK
Source: Seafish Industry Authority, UK
UK retail seafood value

36
Recognised drivers and seafood preferences
Universal drivers– Demographic and lifestyle trends– Consumer sophistication and knowledge
⇒ Seafood preferencesSimple preparationsStreet foodsFresh, healthy and functional,Diversification of flavoursEthical behaviour in food choices

37
Thank you
Opportunities and challenges of fisheries globalisation