![Water Utilization Monitoring and Supplementary Sourcing ....pdf · DASH7, was proposed to expand the market for low power wireless technologies [1]. The wireless technology, DASH7](https://static.fdocuments.in/doc/165x107/5b2635147f8b9a4f3f8b4f38/water-utilization-monitoring-and-supplementary-sourcing-pdf-dash7-was.jpg)
OPPORTUNITIES AND BOUNDARIES OF TRANSPORT … · 4.8. DASH7 ... This work paper on “Opportunities...
63
Prepared by T Bridge S.p.A., Via Garibaldi 7, 16129 Genova, Italia With the contribution of: Francesco Edoardo Misso Filippo Eros Pani Simone Porru Cino Repetto Umberto Sansone The opportunities of networked telematics (“Internet of things”) for an improval of public transport’s quality and its boundaries Working Paper Version 3 31-12-2017 OPPORTUNITIES AND BOUNDARIES OF TRANSPORT NETWORK TELEMATICS DELIVERABLE D.T1.3.2
Transcript of OPPORTUNITIES AND BOUNDARIES OF TRANSPORT … · 4.8. DASH7 ... This work paper on “Opportunities...

Prepared by T Bridge S.p.A., Via Garibaldi 7, 16129 Genova, Italia
With the contribution of:
Francesco Edoardo Misso Filippo Eros Pani Simone Porru Cino Repetto Umberto Sansone
The opportunities of networked telematics (“Internet of
things”) for an improval of public transport’s quality and its
boundaries
Working Paper Version 3
31-12-2017
OPPORTUNITIES AND BOUNDARIES OF TRANSPORT NETWORK TELEMATICS
DELIVERABLE D.T1.3.2
Page 2
Table of Contents
1. SCOPE AND STRUCTURE OF THE DOCUMENT ......................................................................... 3
2. INTRODUCTION OF INTERNET OF THINGS ............................................................................ 5
3. RESEARCH METHODOLOGY .......................................................................................... 8
4. IOT TECHNOLOGIES ................................................................................................. 9
4.1. IOT LAYERS ...................................................................................................... 9
4.2. RADIO FREQUENCY IDENTIFICATION (RFID) ..................................................................... 10
4.3. NFC ............................................................................................................ 11
4.4. BLUETOOTH ..................................................................................................... 11
4.4.1. BEACONS ..................................................................................................... 11
4.5. SENSOR NETWORKS .............................................................................................. 12
4.6. LOW RATE WIRELESS PERSONAL AREA NETWORK (LWPAN) .................................................... 12
4.6.1. ZIGBEE ....................................................................................................... 12
4.6.2. 6LOWPAN ................................................................................................... 12
4.7. WIRELESS SENSOR NETWORKS (WSN) ........................................................................... 13
4.8. DASH7 ......................................................................................................... 14
4.9. 3G AND LONG TERM EVOLUTION (LTE) ......................................................................... 14
4.10. IOT ANALYTICS ................................................................................................ 14
4.10.1. MACHINE LEARNING ......................................................................................... 15
5. IOT APPLICATIONS ................................................................................................. 16
6. IOT AND TRANSPORTATION ........................................................................................ 19
6.1. MOBILITY PATTERNS ............................................................................................. 21
6.2. TRAFFIC DATA AND COOPERATIVE SYSTEMS ..................................................................... 21
6.3. SMART TRANSPORT INFRASTRUCTURE ........................................................................... 22
6.4. INTELLIGENT SPEED ADAPTATION ................................................................................ 24
7. IOT APPLICATIONS ON MOBILITY ................................................................................... 26
7.1. PROJECT SHEETS ................................................................................................ 26
COMPASS4D ..................................................................................................... 27
MOBiNET ......................................................................................................... 31
TEAM ............................................................................................................. 34
Array of Things ................................................................................................. 35
oneTRANSPORT™ ............................................................................................... 40
Informed Rural Passenger .................................................................................... 42
Social Journeys ................................................................................................. 43
On-the-go / Rural Mobility 2.0 .............................................................................. 44
8. OPPORTUNITIES.................................................................................................... 45
8.1. PLANNING ....................................................................................................... 45
8.1.1. EXAMPLES OF OPPORTUNITIES ................................................................................. 45
8.2. OPERATIONS .................................................................................................... 49
8.2.1. EXAMPLES OF OPPORTUNITIES ................................................................................. 49
8.3. CONSIDERATIONS FOR SMART CITIES AND SMART LANDS .......................................................... 50
9. CHALLENGES ....................................................................................................... 53
10. UE REGULATORY FRAMEWORK ................................................................................... 56
REFERENCES .......................................................................................................... 60

Page 3
1. Scope and structure of the document
This work paper on “Opportunities and boundaries of transport network telematics”
(deliverable D.T1.3.2) aims at analysing the opportunities of networked telematics (“Internet of
things” IoT) for the improvement of public transport’s quality and at pointing out the
boundaries of these systems applied in the field of public transport in rural areas.
The document has been developed under INTERREG Central Europe project “RUMOBIL” and is
one of the deliverables of the Activity 3 “Elaboration of RUMOBIL Strategy”. It serves as an
input to the definition of the strategy that will be adopted for the development of sustainable
public transport in the rural areas specifically involved.
Within Activity 3, other two work papers give useful recommendations for the project scope,
such as “Macro-economic effects of public transport for rural regions”, which concerns the
effects of public transport in rural areas, including the impacts on commuting, the availability
of skilled labour, companies’ location decision and resulting economic impacts, and “New
demand patterns for public transport due to demographic change”, focused on how
demographic changes (aging population especially in addressed rural areas) lead to new
patterns in the demand of public transport services is analysed.
In more general terms, the three reports could be transferred as well to other external
European contexts in order to tackle rural mobility issues.
Being the RUMOBIL approach aimed at the promotion of sustainable mobility (“smart mobility”)
in rural and peripheral areas, the project activities are addressed to the definition of a
Strategy, through the deliverable T1.2.2 “RUMOBIL Strategy Outline” which allows other
regions’ transport actors to clarify their expectations.
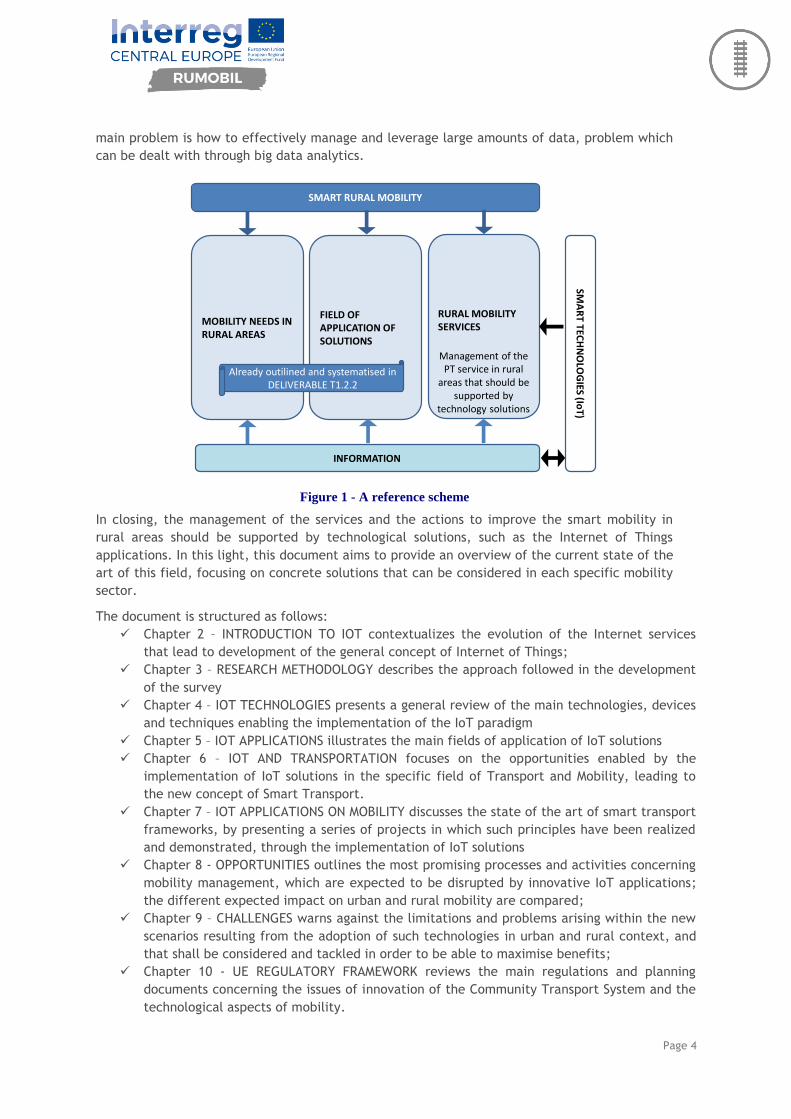
As schematised in the figure 1 below, the Strategy Outline includes the mobility needs in rural
and peripheral areas, collected and analysed starting from information and studies, technical
visits, best practices analysis, etc., and the solutions that could be applied in order to resolve
or reduce the critical points. The solutions, in particular, were underlined by each project
partner in order to address the problems analysed and the mobility needs to be satisfied. They
can be classified in five main groups, such as:
transport network integration and coordination, in terms of service planning (e.g.
harmonised timetable, intermodal nodes) and stakeholders’ involvement;
tariff system, promoting a unified approach for each urban context;
new specific services for rural areas, focusing on DRT-demand responsive transport
services;
infomobility, enhancing the information flow for users, also using apps and web based
tools;
social cohesion, also developing collateral projects, for example by aiming at the promotion
of rural areas in the fields of social and cultural heritage.
Several different solutions have been highlighted, starting from new on-demand bus services
and promotion campaigns to novel user facilitation services and more performing infomobility
systems.
To be managed and improved, this actions and solutions need to get and process information.
Therefore, data and information have to be collected, analysed and grouped for the subsequent
steps. Thanks to the smart technologies related to the Internet of Things, information collection
and analysis are easier and more effective, because these operational steps are accomplished
directly by the “things” and devices included in the information flow network. In this light, the
Page 4
main problem is how to effectively manage and leverage large amounts of data, problem which
can be dealt with through big data analytics.
MOBILITY NEEDS IN RURAL AREAS
SMART RURAL MOBILITY
FIELD OF APPLICATION OF SOLUTIONS
RURAL MOBILITY SERVICES
SMA
RT TEC
HN
OLO
GIES (Io
T)
INFORMATION
Already outilined and systematised in DELIVERABLE T1.2.2
Management of the PT service in rural
areas that should be supported by
technology solutions
Figure 1 - A reference scheme
In closing, the management of the services and the actions to improve the smart mobility in
rural areas should be supported by technological solutions, such as the Internet of Things
applications. In this light, this document aims to provide an overview of the current state of the
art of this field, focusing on concrete solutions that can be considered in each specific mobility
sector.
The document is structured as follows:
Chapter 2 – INTRODUCTION TO IOT contextualizes the evolution of the Internet services
that lead to development of the general concept of Internet of Things;
Chapter 3 – RESEARCH METHODOLOGY describes the approach followed in the development
of the survey
Chapter 4 – IOT TECHNOLOGIES presents a general review of the main technologies, devices
and techniques enabling the implementation of the IoT paradigm
Chapter 5 – IOT APPLICATIONS illustrates the main fields of application of IoT solutions
Chapter 6 – IOT AND TRANSPORTATION focuses on the opportunities enabled by the
implementation of IoT solutions in the specific field of Transport and Mobility, leading to
the new concept of Smart Transport.
Chapter 7 – IOT APPLICATIONS ON MOBILITY discusses the state of the art of smart transport
frameworks, by presenting a series of projects in which such principles have been realized
and demonstrated, through the implementation of IoT solutions
Chapter 8 - OPPORTUNITIES outlines the most promising processes and activities concerning
mobility management, which are expected to be disrupted by innovative IoT applications;
the different expected impact on urban and rural mobility are compared;
Chapter 9 – CHALLENGES warns against the limitations and problems arising within the new
scenarios resulting from the adoption of such technologies in urban and rural context, and
that shall be considered and tackled in order to be able to maximise benefits;
Chapter 10 - UE REGULATORY FRAMEWORK reviews the main regulations and planning
documents concerning the issues of innovation of the Community Transport System and the
technological aspects of mobility.

Page 5
2. Introduction of Internet of Things
Starting as a static repository of interlinked hypertext documents, over the past decades, the
Internet gradually changed into a dynamic universe of networked humans, machines and
applications. As shown in Figure 2, the internet went through different phases [1]:
The Internet of content. The definition of the HTTP protocol and the creation of the World
Wide Web (WWW) marked the creation of the the “real” internet, that is, the Internet we all
use today. In this phase, the Internet was static and used for publishing and sharing content.
The Internet of services. During this phase, XML, web services, user-generated content,
productivity and collaboration tools, together with the advent of the e-commerce, brought the
Internet far from the static pages of the early websites and eventually led to the Web 2.0.
The Internet of people. The wide adoption of mobile devices with broadband access and the
increasing popularity of social network apps brought about the current phase of the Internet
evolution, which we are leaving in favour of the Internet of things.
The Internet of things. The increasing use of Machine-to-machine (M2M) communications and
big data analytics is bringing about another revolution in the way we are using the Internet. In
this phase, objects are becoming part of information systems and end-user applications,
effectively creating a ubiquitous and unlimited universe where machines and humans interact
to make our society safer, greener and healthier. Based on the 2014 and 2015 editions of
Gartner’s Hype Cycle for Emerging Technologies, the Internet of Things is at the top of the
cycle and will reach full maturity in 5 to 10 years.
The next wave in the era of computing will be outside the realm of the traditional desktop. In
the Internet of Things (IoT) paradigm, many of the objects that surround us will be on the
network in one form or another. Radio Frequency IDentification (RFID) and sensor network
technologies will rise to meet this new challenge, in which information and communication
systems are invisibly embedded in the environment around us. This results in the generation of
enormous amounts of data which have to be stored, processed and presented in a seamless,
efficient, and easily interpretable form. This model will consist of services that are
commodities and delivered in a manner similar to traditional commodities [2]. Cloud computing
can provide the virtual infrastructure for such utility computing which integrates monitoring
Figure 2 - The evolution of the Internet [1]

Page 6
devices, storage devices, analytics tools, visualization platforms and client delivery. The cost
based model that Cloud computing offers will enable end-to-end service provisioning for
businesses and users to access applications on demand from anywhere.
Smart connectivity with existing networks and context-aware computation using network
resources is an indispensable part of IoT. With the growing presence of WiFi and 4G-LTE
wireless Internet access, the evolution towards ubiquitous information and communication
networks is already evident. However, for the Internet of Things vision to successfully emerge,
the computing paradigm will need to go beyond traditional mobile computing scenarios that use
smartphones and portables, and evolve into connecting everyday existing objects and
embedding intelligence into our environment. For technology to disappear from the
consciousness of the user, the Internet of Things demands: (1) a shared understanding of the
situation of its users and their appliances, (2) software architectures and pervasive
communication networks to process and convey the contextual information to where it is
relevant, and (3) the analytics tools in the Internet of Things that aim for autonomous and
smart behavior. With these three fundamental grounds in place, smart connectivity and
context-aware computation can be accomplished [3].
The term Internet of Things was first coined by Kevin Ashton in 1999 in the context of supply
chain management [4]. However, in the past decade, the definition has been more inclusive
covering wide range of applications like healthcare, utilities, transport, etc. [5]. Although the
definition of ‘Things’ has changed as technology evolved, the main goal of making a computer
sense information without the aid of human intervention remains the same. A radical evolution
of the current Internet into a Network of interconnected objects that not only harvests
information from the environment (sensing) and interacts with the physical world (actuation/
command/control), but also uses existing Internet standards to provide services for information
transfer, analytics, applications, and communications.
Fueled by the prevalence of devices enabled by open wireless technology such as Bluetooth,
radio frequency identification (RFID), Wi-Fi, and telephonic data services as well as embedded
sensor and actuator nodes, IoT has stepped out of its infancy and is on the verge of
transforming the current static Internet into a fully integrated Future Internet [6].
The Internet revolution led to the interconnection between people at an unprecedented scale
and pace. The next revolution will be the interconnection between objects to create a smart
environment. Only in 2011 did the number of interconnected devices on the planet overtake the
actual number of people. Currently there are 9 billion interconnected devices and it is expected
to reach 24 billion devices by 2020. According to the GSMA (www.gsma.com), this amounts to
$1.3 trillion revenue opportunities for mobile network operators alone spanning vertical
segments such as health, automotive, utilities and consumer electronics.
The advancements and convergence of micro-electro-mechanical systems (MEMS) technology,
wireless communications, and digital electronics has resulted in the development of miniature
devices having the ability to sense, compute, and communicate wirelessly in short distances.
These miniature devices called nodes interconnect to form a wireless sensor networks (WSN)
and find wide ranging applications in environmental monitoring, infrastructure monitoring,
traffic monitoring, retail, etc. [7]. This has the ability to provide a ubiquitous sensing capability
which is critical in realizing the overall vision of ubicomp as outlined by Weiser [8]. For the
realization of a complete IoT vision, efficient, secure, scalable and market oriented computing
and storage resourcing is essential.
Page 7
Cloud computing [9] is the most recent paradigm to emerge which promises reliable services
delivered through next generation data centers that are based on virtualized storage
technologies. This platform acts as a receiver of data from the ubiquitous sensors; as a
computer to analyze and interpret the data; as well as providing the user with easy to
understand web based visualization. The ubiquitous sensing and processing works in the
background, hidden from the user. This novel integrated Sensor-Actuator-Internet framework
shall form the core technology around which a smart environment will be shaped: information
generated will be shared across diverse platforms and applications, to develop a common
operating picture (COP) of an environment, where control of certain unrestricted ‘Things’ is
made possible.
As identified by Atzori et al. [10], Internet of Things can be realized in three paradigms-
internet-oriented (middleware), things oriented (sensors) and semantic-oriented (knowledge).
Although this type of delineation is required due to the interdisciplinary nature of the subject,
the usefulness of IoT can be unleashed only in an application domain where the three paradigms
intersect. The RFID group defines the Internet of Things as the worldwide network of
interconnected objects uniquely addressable based on standard communication protocols.
According to Cluster of European research projects on the Internet of Things [11], ‘Things’ are
active participants in business, information and social processes where they are enabled to
interact and communicate among themselves and with the environment by exchanging data and
information sensed about the environment, while reacting autonomously to the real/physical
world events and influencing it by running processes that trigger actions and create services
with or without direct human intervention. According to Forrester [12], a smart environment
uses information and communications technologies to make the critical infrastructure
components and services of a city’s administration, education, healthcare, public safety, real
estate, transportation and utilities more aware, interactive and efficient.
The definition of the Internet of Things for smart environments is the interconnection of sensing
and actuating devices providing the ability to share information across platforms through a
unified framework, developing a common operating picture for enabling innovative
applications. This is achieved by seamless ubiquitous sensing, data analytics and information
representation with Cloud computing as the unifying framework.
Page 8
3. Research methodology
In order to achieve the aim of analysing the opportunities of the Internet of Things for the
improvement of public transport’s quality and of defining innovative applications in the field of
public transport in rural areas, we employed a research methodology which includes:
publication research:
o Google Scholar
o Companies’ reports (e.g. Verizon IoT report)
ongoing and closed IoT projects research:
o projects related publications
o projects websites
The study’s purpose is to report information about the IoT state of the art, focusing on
innovative applications of the IoT technologies on transportation and, in particular, on
peripheral areas. State-of-the-art tools and solutions reported in this document are intended to
support the implementation of pilot actions and the RUMOBIL strategy, as well as provide the
information to predict how demand for public transport will develop in coming years.
Page 9
4. IoT Technologies
Different technologies have been applied to address the specific features of each IoT
application. The required technologies cover a wide range and layer from the physical level to
the data and application layers.
The IoT archetype is in the power of smart and self-configuring devices which are well linked
together by global grid infrastructures. IoT can be typically defined as a real object, largely
dispersed, with low storage and processing capabilities, which aims at enhancing reliability,
performance and security of a smart environment as well as its infrastructure. In this chapter,
we present an overview of the IoT technology stack [13].
4.1. IoT layers
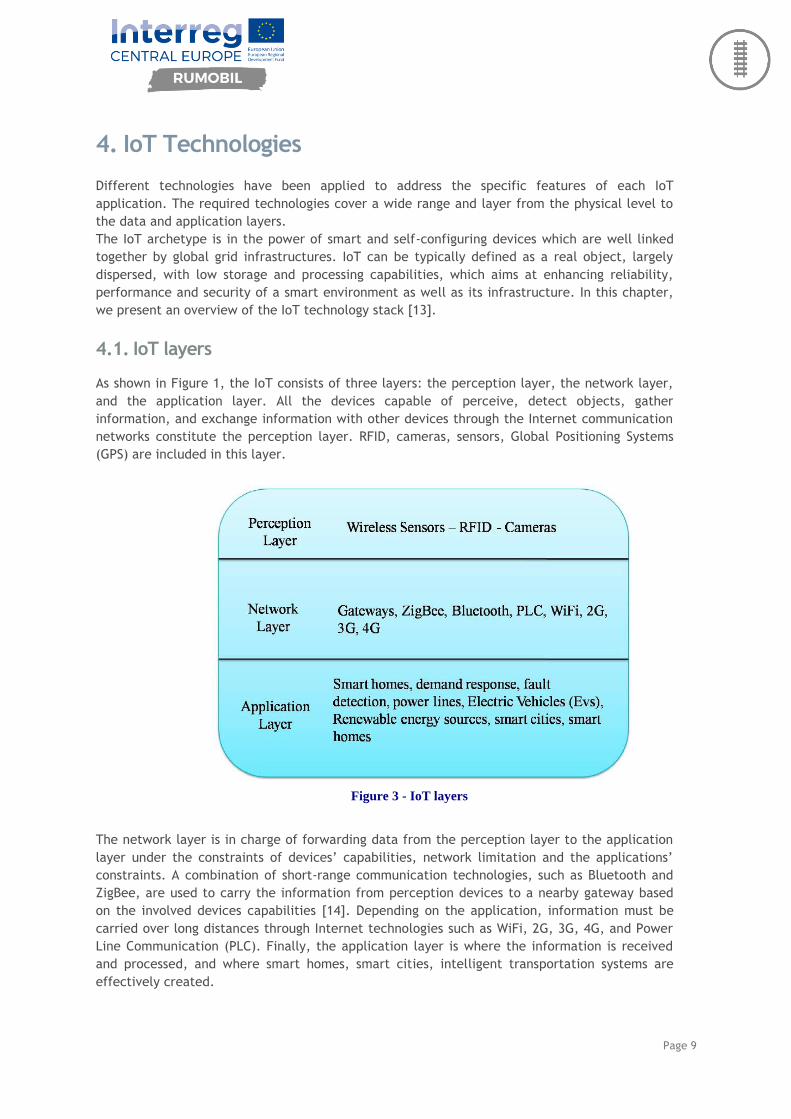
As shown in Figure 1, the IoT consists of three layers: the perception layer, the network layer,
and the application layer. All the devices capable of perceive, detect objects, gather
information, and exchange information with other devices through the Internet communication
networks constitute the perception layer. RFID, cameras, sensors, Global Positioning Systems
(GPS) are included in this layer.
The network layer is in charge of forwarding data from the perception layer to the application
layer under the constraints of devices’ capabilities, network limitation and the applications’
constraints. A combination of short-range communication technologies, such as Bluetooth and
ZigBee, are used to carry the information from perception devices to a nearby gateway based
on the involved devices capabilities [14]. Depending on the application, information must be
carried over long distances through Internet technologies such as WiFi, 2G, 3G, 4G, and Power
Line Communication (PLC). Finally, the application layer is where the information is received
and processed, and where smart homes, smart cities, intelligent transportation systems are
effectively created.
Figure 3 - IoT layers

Page 10
Figure 4 - A bird’s eye on IoT Technologies (from www.postscapes.com)
4.2. Radio Frequency Identification (RFID)
RFID is a short range communication technology used for tracking and identifying objects
wirelessly. With RFID, an RFID tag communicates with an RFID reader via radio-frequency
electromagnetic fields. The readers usually send collected data to a computer system running
RFID software or RFID middleware [15]. The most commonly used RFID data form in the IoT
context is the Electronic Product Code, or EPC. An EPC is a universally unique identifier for an
object. These unique identifiers ensure that objects tracked with RFID tags have individual
identities in the IoT.
RFID is a technology which have proven to be extremely useful in tracking objects. It was not
designed specifically for the IoT. The technology is widely used in logistics and supply chain
management, aviation, food safety, retailing, public utilities and others. Organizations such as
Wal-Mart, the U.S. Department of Defense have mandated the use of RFID. Nevertheless, RFID
tracking capabilities are considered to be a precursor to the Internet of Things and RFID
benefits can be extended by remotely access the data RFID provide through the Internet [16].
Relevant technical details and examples:
Frequency: 120–150 kHz (LF), 13.56 MHz (HF), 433 MHz (UHF), 865-868 MHz (Europe)
902-928 MHz (North America) UHF, 2450-5800 MHz (microwave), 3.1–10 GHz
(microwave)
Range: 10cm to 200m
Examples: Road tolls, Building Access, Inventory
Page 11
4.3. NFC
A newer technology that builds on the RFID standard is Near Field Communication (NFC). NFC is
a short-range communication standard which comprises a set of wireless technologies, where
devices can radio communicate with one another when they are within a maximum distance of
10 cm from each other. A Unique Identification (UID) is associated with and contained by each
NFC tag.
To make NFC communication possible an initiator and a target are always needed. Usually, the
initiator powers a passive target with a RF field, allowing for NFC tags to take very simple form
factors (e.g., tags, stickers, key fobs, cards) as they do not require batteries. As an example,
NFC are often used in smart posters, which are able to transmit data to the user’s smartphone
through the NFC tag.
However, also NFC peer-to-peer communication is possible. When brought together,
smartphones can usually use NFC technology to communicate, due to its wide adoption among
these handheld devices.
Relevant technical details and examples:
Frequency: 13.56 MHz
Range: < 0.2 m
Rate: from 106kbit/s to 424 kbit/s
Examples: Smart Wallets/Cards/Posters, Action Tags, Access Control
4.4. Bluetooth
Bluetooth is a short-range wireless communication technology standard which use short-
wavelength radio transmissions in the ISM band from 2400 to 2480 MHz. Bluetooth is employed
by fixed and mobile devices and create highly secure personal area networks (PANs).
Relevant technical details and examples:
Frequency: 2.4GHz
Range: 1-100m
Examples: Hands-free headsets, key dongles, fitness trackers, beacons
4.4.1. Beacons
Beacons are small wireless devices that continuously transmit a radio signal to communicate
their position and ID. Usually, the signal is picked up by smartphones using Bluetooth Low
Energy (BLE) technology. The smartphone reads the beacon’s identification number (ID),
calculates the distance to the beacon and, based on this data, triggers an action in a beacon
compatible mobile app.
Beacons, in contrast with RFID, only require devices to have BLE capabilities, thus including
most smartphones. Instead, RFID need specialized hardware to work, such as tags, readers,
reader control and application software, which makes RFID a less easily accessible technology
than beacons.

Page 12
4.5. Sensor networks
Sensors are devices that monitor characteristics of the environment or other objects such as
temperature, humidity, movement, and quantity. A wireless sensor network (WSN) is
constituted by a set of sensors that are used together and interact, and can also contain
gateways. Gateways forward data collected from the sensors to a server. A sensor is
distinguished from an actuator as the former gathers information about the state of an
environment or object, whereas an actuator perform actions which affect the environment or
object (e.g., an actuator could generate radio waves, light, sound, smells). Such capabilities
allow for IoT objects to communicate with people. Actuators are used in combination with
sensors to build sensor-actuator networks. In a sensor-actuator network, an actuator may be
used to generate an alarm to alert people to the presence of a toxic gas, action which would be
triggered by a sensor detecting the presence of carbon monoxide in a closed space. In this way,
sensors and actuators work together to give objects the capability to be aware of their
environment and, at the same time, interact with people.
4.6. Low Rate Wireless Personal Area Network (LWPAN)
Among short-range radio technologies — which cover larged distances, up to 10-15 km - LWPAN
features very low energy consumption which allow for batteries to last up to 10 years [17].
According to the IEEE 802.15.4 standard, it provides low cost and low-rate communication for
sensor networks. In addition to the 6LoWPAN and ZigBee [18] upper layers protocols, LWPAN
technology has also the lowest two layers of protocols including physical and medium access
level.
4.6.1. ZigBee
ZigBee is a low-power, low-cost wireless communication technology used by sensor nodes [19].
Based on the IEEE 802.15.4 standard, ZigBee allows the creation of wireless personal area
networks (WPAN) for use in home automation, medical device collection and other low-power,
low-bandwidth applications, including wireless light switches, electrical meters, and traffic
management systems. ZigBee is suitable for limited ranges, coverage of a city’s region and
supporting billions of devices. Moreover, a mechanism for the transmission of IPv6 packets is
specified. ZigBee applications usually require additional equipment such as a coordinator, a
router and ZigBee end-devices.
4.6.2. 6LoWPAN
6LoWPAN standard is specified as a compression format for IPv6 communication. IPv4, the pred
ecessor of IPv6 and leading addressing technology supported by Internet hosts, has been
replaced by IPv6 due to the exhaustion of the IPv4 address blocks and the inability to separately
address billions of nodes which is a characteristic of IoT networks. IPv6 solves the shortage of
IPv4 nodes by providing 128-bit addresses for IoT networks. However, it causes another issue,
that is, compatibility with constrained nodes, which can be overcome by using 6LoWPAN
standard [20].
Page 13
4.7. Wireless Sensor Networks (WSN)
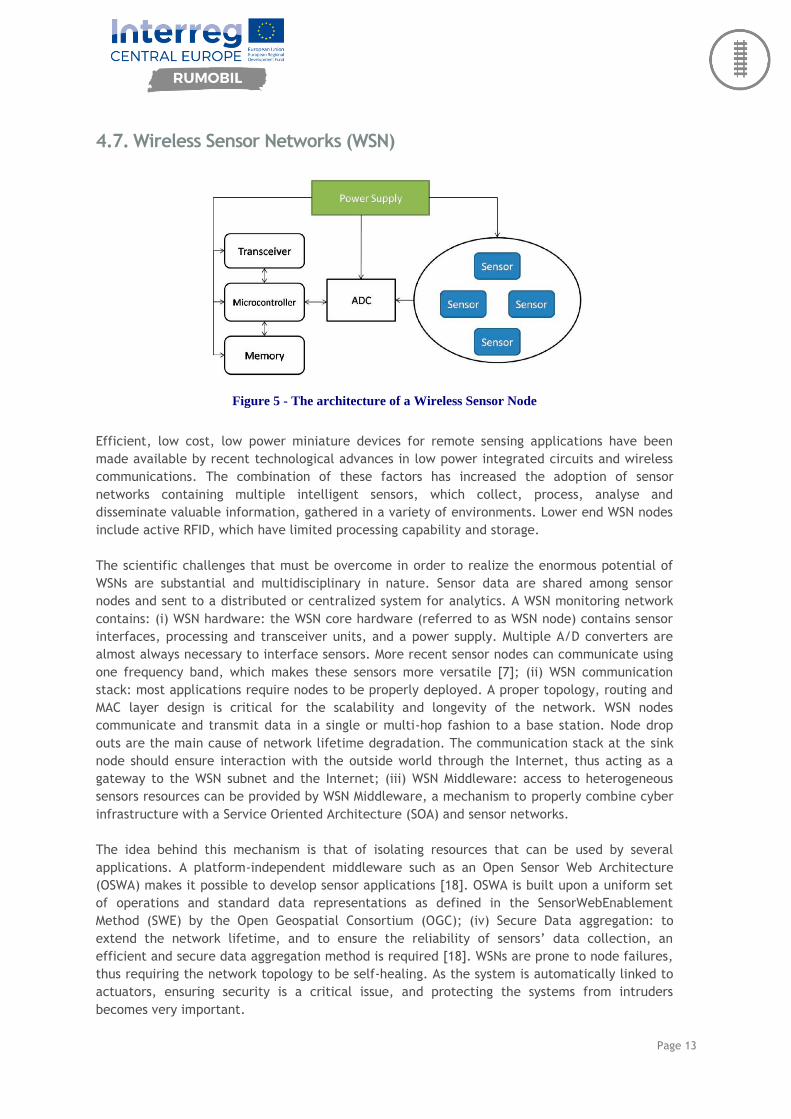
Figure 5 - The architecture of a Wireless Sensor Node
Efficient, low cost, low power miniature devices for remote sensing applications have been
made available by recent technological advances in low power integrated circuits and wireless
communications. The combination of these factors has increased the adoption of sensor
networks containing multiple intelligent sensors, which collect, process, analyse and
disseminate valuable information, gathered in a variety of environments. Lower end WSN nodes
include active RFID, which have limited processing capability and storage.
The scientific challenges that must be overcome in order to realize the enormous potential of
WSNs are substantial and multidisciplinary in nature. Sensor data are shared among sensor
nodes and sent to a distributed or centralized system for analytics. A WSN monitoring network
contains: (i) WSN hardware: the WSN core hardware (referred to as WSN node) contains sensor
interfaces, processing and transceiver units, and a power supply. Multiple A/D converters are
almost always necessary to interface sensors. More recent sensor nodes can communicate using
one frequency band, which makes these sensors more versatile [7]; (ii) WSN communication
stack: most applications require nodes to be properly deployed. A proper topology, routing and
MAC layer design is critical for the scalability and longevity of the network. WSN nodes
communicate and transmit data in a single or multi-hop fashion to a base station. Node drop
outs are the main cause of network lifetime degradation. The communication stack at the sink
node should ensure interaction with the outside world through the Internet, thus acting as a
gateway to the WSN subnet and the Internet; (iii) WSN Middleware: access to heterogeneous
sensors resources can be provided by WSN Middleware, a mechanism to properly combine cyber
infrastructure with a Service Oriented Architecture (SOA) and sensor networks.
The idea behind this mechanism is that of isolating resources that can be used by several
applications. A platform-independent middleware such as an Open Sensor Web Architecture
(OSWA) makes it possible to develop sensor applications [18]. OSWA is built upon a uniform set
of operations and standard data representations as defined in the SensorWebEnablement
Method (SWE) by the Open Geospatial Consortium (OGC); (iv) Secure Data aggregation: to
extend the network lifetime, and to ensure the reliability of sensors’ data collection, an
efficient and secure data aggregation method is required [18]. WSNs are prone to node failures,
thus requiring the network topology to be self-healing. As the system is automatically linked to
actuators, ensuring security is a critical issue, and protecting the systems from intruders
becomes very important.
Page 14
4.8. DASH7
Long distance and low power sensing applications (e.g., building automation, logistics) can
benefit from the use of DASH7, a promising standard for WSNs. The DASH7 protocol is appealing
for HANs, as it is designed for kilometer-distance range applications and operates at 433 MHz,
thus ensuring better penetration through walls than 2.4 GHz. DASH7 can be effectively
employed in military applications (especially substation construction), hazardous material
monitoring, manufacturing, warehouse optimizations, smart meter development, and others
[21].
4.9. 3G and Long Term Evolution (LTE)
3G and LTE are standards for wireless communication for mobile phones and data terminals. As
far as development and expansion of wireless communication infrastructures are concerned,
LTE and 3G are available everywhere, even in third world countries. Designed for broadband
connectivity, these technologies are not the most appropriate for short range uses; their field
of applications includes WANs, which require longer distance ranges. Among the issues that
affect their implementation are the high data cost sustained by service providers, and inability
to use them to allow for communication among billion devices.
4.10. IoT Analytics
Storage, ownership and expiry of the data are becoming critical issues. As the internet
consumes up to 5% of the total energy generated today and it is bound to increase for years to
come, centralized data centers that run on harvested energy will have to ensure energy
efficiency as well as reliability. Smart monitoring and actuation requires the data to be stored
and used intelligently. Advanced artificial intelligence algorithms which could be centralized or
distributed according to current needs will be developed, as well as novel fusion algorithms
which will make sense of the collected data. Automated decision making will be enabled by
state-of-the-art, non-linear, temporal machine learning methods based on evolutionary
algorithms, genetic algorithms, neural networks, and other artificial intelligence techniques. All
these systems will have to feature interoperability and integration capabilities, as well as
ensure adaptive communications.
More importantly, a centralized infrastructure - the IoT middleware - is required to support
storage and provide analytics. Finally, cloud based storage solutions are becoming increasingly
popular and, in the years ahead, Cloud based analytics and visualization platforms are foreseen.
IoT analytics can be descriptive, predictive, and prescriptive analytics, which can be
distinguished as follows:
Descriptive analytics. Focus on the past via data aggregation and mining (answers:
“What has happened?”).
Predictive analytics. Focus on the future through the use of forecasting techniques and
statistics (answers: “What could happen?”).
Prescriptive analytics. Focus on advices and prescriptions, by employing optimization
and simulation algorithms to advise on outcomes and machine automation (answers:
“What should be done?”).
Distinguishing predictive analytics from prescriptive analytics is not straightforward. Predictive
analytics may be seen as closed-loop, but, in fact, they require human intervention to

Page 15
determine which is the most suitable solution to a problem: people and also machines can be
alerted, but predictive analytics can not figure out which is the ideal remedy by themselves. On
the other hand, prescriptive analytics can weigh all the different possible actions, and
eventually invoke actions, thus removing the barrier between insight and action. Prescriptive
analytics need to be supported by a knowledge base and automation.
4.10.1. Machine Learning
IoT generates large amounts of data which, by 2020, will be produced at the edge or the area
where the endpoints operate [22]. Storage, ownership and expiry of the data become critical
issues. The ever-increasing power consumption of the Internet makes of centralized data
centers effective solutions for ensuring high efficiency and reliability. Artificial intelligence
algorithms must be developed with the possibility of deploying them through a centralized or
distributed manner in mind.
Huge amounts of data can be managed through machine learning, which is a process that
harnesses computing power to deal with the volume and velocity of incoming information flows.
Machine learning provides ways to build and test several data models based on the incoming
data, also changing the models as new data comes in. The data models can be also
differentiated to allow for selecting the most suitable one according to specific criteria.
Automated decision making, inherent in prescriptive analytics, require state-of-the-art non-
linear, temporal machine learning methods based on evolutionary algorithms, genetic
algorithms, neural networks, and other artificial intelligence techniques. These systems feature
interoperability, integration and adaptive communications.

Page 16
5. IoT applications
The emerging Internet of Things will impact several application domains. Aspects such as
network availability, coverage, scale, heterogeneity, repeatability, user involvement and
impact can serve as a base to distinguish and classify IoT applications [3]. Applications can be
categorized into four application domains: (1) Personal and Home; (2) Enterprise; (3) Utilities;
and (4) Mobile.
In Figure [6] a schematic of the interconnection of objects is depicted, where the scale of the
impact of the generated data determines the application domains. Users can be from
individuals to organizations at the national level, and addressed issues are widely varied.
Personal and Home IoT are represented at the scale of an individual or home, Enterprise IoT at
the scale of a community, Utility IoT at a national or regional scale and Mobile IoT, which has a
variable scale depending on the nature of the application domain and the required
connectivity, is spread across several domains.
Applications and the use of data are subject to huge crossover between domains, such as that
observable for, the Personal and Home IoT, which produces household electricity usage data
and makes it available to the electricity provider which, in turn, can optimize supply and
demand in the Utility IoT domain. Different service providers can rely on the internet for
seamless data sharing, thus creating multiple business opportunities. In the following
paragraphs, we provide a few typical applications in each domain.
Figure 6 - IoT applications

Page 17
Personal and home. In personal and home applications only the network’s owners can use the
information collected by the sensors. WiFi is the most commonly used backbone technology,
thus ensuring higher bandwidth for transferring data and higher sampling rates for applications
which rely on audio information.
Personal body area networks can be used to realize the ubiquitous healthcare vision. Indeed,
physiological parameters can nowadays be measured by sensors using technologies such as
Bluetooth, capable of seamlessly communicate with portable devices (e.g., smartphones).
Ubiquitous healthcare can thus rely on IoT, which configures itself as an optimal platform
where body area sensors collect information which can then be uploaded to servers [10]. So far,
there are several applications available for Apple iOS, Google Android and Windows Phone
operating systems that measure various parameters. However, general physicians still can not
leverage centralized applications. An extension of the personal body area network is creating a
Home monitoring systems can extend personal body area network to allow for elderly care,
enabling the doctor to monitor patients in their homes thereby reducing hospitalization costs
through early intervention and treatment [23, 24]. Household energy management could also
benefit from IoT, through ensuring users deeper control over home equipment such as air
conditioners, refrigerators, washing machines.
Enterprise. For classifying purposes, a ‘Network of Things’ within a work environment is here
defined as an enterprise based application. In this domain, only the owners of such networks
can use the collected data, which can be released selectively. An example of an application
within this domain is environmental monitoring where the number of occupants is tracked and
the utilities within the building are managed (e.g., HVAC, lighting). Aspects such as security,
automation, climate control always require sensors to be deployed, and the relative
management systems will eventually be replaced by a wireless system. This will allow for
changes to be made whenever necessary.
Utilities. This application domain uses information from the networks to optimize services
rather than to provide data to be directly consumed by the user. Utility companies are already
using these data to manage resources with the aim of optimizing cost-profit ratio. Very
extensive networks are needed for efficient resource management and monitoring critical
utilities, networks which are usually deployed by large organizations on a regional and national
scale). The information from the networks in this application domain is usually for service
optimization rather than consumer consumption. It is already being used by utility companies
(smart meter by electricity supply companies) for resource management in order to optimize
cost vs. profit. These are made up of very extensive networks (usually laid out by large
organization on a regional and national scale) for monitoring critical utilities and efficient
resource management. The backbone network can vary between Cellular, WiFi and satellite
communication.
Smart grid and smart metering is another potential IoT application [25], whose optimal energy
consumption management can be achieved by continuously monitoring every electricity point
within a house and using this information as a feedback to modify electricity consumption
patterns.
Mobile. The nature of data and the required backbone implementation set smart transportation
and smart logistics aside from other IoT application domains. Noise pollution is mainly due to
urban traffic, which is also a major cause of air pollution and greenhouse emissions. In most
cities, economic and social activities are significantly affected by traffic congestion and its
associated costs. Just-in-time operations, as welle as others supply chain efficiencies and
productivity, are severely impacted by traffic congestion causing delivery schedule failures and

Page 18
freight delays. Freight movement can benefit from dynamic traffic information, which allows
for improved scheduling and better planning. IoT will enhance online monitoring of travel times
by means of large scale WSNs, origin-destination (O-D) route choice behavior, queue lengths,
and air pollutants and noise emissions. Existing sensor networks of inductive loop vehicle
detectors employed at the intersections of existing traffic control systems will likely be
replaced by IoT systems. Such systems will also underpin the development of scenario-based
models for the planning and design of mitigation and alleviation plans, and lead to improved
urban traffic control algorithms, including multi-objective control systems. Valid and relevant
traffic conditions can be presented to travelers combined with information gathered from the
urban traffic control system [26].
The current IoT penetration in a number of digital products such as mobile phones is testified
by the wide adoption of Bluetooth-enabled (BT) devices, such as car hands-free sets and
navigation systems. BT sensors can read the unique Media Access Identification (MAC-ID)
number emitted by BT devices within the coverage area. The movement of devices can be
detected by placing BT Readers at different locations. Other data sources such as bus GPS, or
traffic signals, can complement data collected by BT devices to collect information concerning
vehicle travel time on motorways and arterial streets, dynamic (time dependent) O-D matrices
on the network, identification of critical intersections, and accurate and reliable real time
transport network state information [27]. Such usages carry with them many privacy concerns.
Digital forgetting where privacy is a concern is an emerging domain of research in IoT [28].
Efficient logistics management is another important application in mobile IoT domain [27]. In
particular, monitoring transported items and transportation planning efficiency are aspect
relevant to this kind of applications. Items are mainly monitored locally, for instance, within a
truck replicating enterprise domain, whereas transport planning relies upon large-scale IoT
networks.
In Table 1 application domains and their most relevant features are reported.
Table 1 - Smart environment application domains

Page 19
6. IoT and transportation
Smart Mobility is deeply connected to sustainable mobility, and thus leads to improving quality
of life. Nowadays, huge amounts of real-time data can be processed and used to optimize the
urban infrastructure, thereby making public transport services more efficient from both the
final user’s and the service provider’s perspective. Location-based data analysis allows for
identifying the most useful services for citizens at a certain time. For instance, citizens could
easily navigate the most efficient routes and modes of travel.
In the report for the Sustainable Mobility Project 2.0 (SMP2.0) within the World Business Council
for Sustainable Development [29], the authors described 22 indicators for parameters and
methodologies to be used by cities to identify their sustainable mobility performance. Several
of the identified indicators are also relevant to smart urban mobility (e.g., congestion and
delays, mobility space usage, commuting travel time, access to mobility services, comfort and
pleasure, traffic safety, occupancy rate and intermodal connectivity). Smart urban mobility also
tries to find synergies between a range of technologies such as vehicle manufacturing, transport
information systems, communications technologies and logistics.
Compared to other cities in the world, European ones boast better public transport services and
are usually more committed to promote sustainability and low-carbon solutions. Among the
european cities that have shown the most innovative actions in recent years are Copenhagen,
Amsterdam, Vienna, Barcelona, Paris, Stockholm, London, Hamburg, Berlin, and Helsinki.
However, there is still room for improvement at a European level aiming at a decrease of
pollution and carbon dioxide emissions. Plans to restrict traffic and parking in downtown areas
have already started in several European cities with interruption of the production of industrial
plants, or via speed limitations to reduce the current high levels of carbon dioxide output. For
instance, in the city of Amsterdam, citizens are being provided with technologies that ensure a
better quality life in the city through the Amsterdam Smart City Project (Amsterdam smart city
project, https://amsterdamsmartcity.com). The project will provide free Wi-Fi and a new
optical fiber network. Additionally, emissions are being reduced via “smart grid” technologies
for transportation, which guide trucks to available unloading areas, and control traffic lights
and bridges, providing residents with personalized travel advice.
IoT sensors have been greatly enhanced over the last few years. Ubiquitous information access
via the Internet has received considerable attention from citizens. Population is growing at a
faster pace due to the high concentration of resources and facilities within the urban areas,
which attracts more and more people from rural areas to cities. In addition, the current 54% of
world’s population that lives in urban areas is expected to increase to 66% by 2050.
The following figures correlate smart transport applications and the corresponding data on
which they rely.

Page 20
Wfqwfqwfqwwfq
Figure 8 - Framework of Smart Transportation (from: http://www.huawei.com)
In [30] an overview of different aspects and factors which define “Smart Mobility” is provided.
Efficient and effective services have been provided to citizens through multiple projects and
initiatives started in recent years. Nevertheless, among other benefits, especially
environmental ones can still be provided. Knowledge sharing and communication are fostered
Figure 7 - The evolution of User Transport Applications and related User Transport Data
Assets (from: http://www.interdigital.com)
Page 21
by applied technologies, which can be also leveraged to gather feedback from citizens, and
ease data acquisition for the purpose of studying mobility patterns. A fundamental goal is to
reduce greenhouse gas emissions and traffic congestion, result which can be achieved through
environmentally friendly, efficient, safer, and multimodal data-reliant road transport services.
To this purpose, road infrastructure can be equipped with sensors capable of recognizing and
monitoring a wide range of transport-related activities. In addition to affecting the driving
experience, autonomous driving will impact mobility via regulatory, social and economic
changes, and will also lead to modify urban planning. Cities will be highly affected by Realistic
Vehicular Ad Hoc Networks (VANETs) and the related technologies (e.g., those employed in
autonomous car applications). Roads will be safer, considering that 90 percent of road
accidents are caused by human error (according to the International Organization for Road
Accident Prevention). In fact, fully autonomous vehicles will require no driver intervention in
the control of the vehicle.
6.1. Mobility patterns
Driving behaviour can be studied through monitoring mobility patterns. A deeper knowledge on
driving behaviour can improve traffic management by allowing for traffic congestion reduction
and an increase in road safety. In fact, mobility patterns provide crucial information about the
big picture of people’s habits and routes. Personal multimodal mobility services greatly benefit
from mobility pattern information, as this allow for technological applications to suggest travel
routes and create new habits.
The monitoring process can be facilitated through the collection of crowd-sourcing data from
mobile devices and the processing capabilities provided by cloud-based architecture, thus
allowing for travel pattern changes based, for instance, on new routing recommendations. This
approach gives users the possibility to use additional services. As an example, users could
benefit from shorter traveling time or fuel savings obtained through simply following alternative
route paths recommendations and/or feedback on their current driving patterns. Leveraging
gamification approaches can also lead to changes in mobility habits, by, for instance, awarding
with discounts on certain services commuting users who avoid rush hours or use public
transportation. Driver behaviour can be also improved by assigning scores which educate drivers
in avoiding unsafe actions. Moreover, a vehicle occupancy rate can be approximately calculated
by using smartphone technology, and then used as a parameter for smart mobility.
Replacement of private vehicle use with public transportation use is enabled by leveraging
urban mobile data to develop intelligent mobility concepts. This, in turn, causes traffic
reduction and consequently efficient flow of the remaining vehicles, eventually lowering total
carbon emissions. An optimal balance between transit use and personal vehicles would provide
faster commutes and benefit the environment. To achieve this goal, urban mobility is being
improved via real-time route planning. Weather, accidents, maintenance works, and public
events all affect both public transportation and private vehicle use, thus requiring clear and
accurate real-time information to support commuters in making decisions regarding the use of
personal vehicles or public transportation services, and which mode of transportation to use to
better fit their needs.
6.2. Traffic Data and Cooperative Systems
Mobile devices or cars can be used to acquire urban traffic data available on road
infrastructure. For example, in [31] the authors deployed Bluetooth scanners along the
Page 22
freeway/arterial network in the road proximity to study and characterize urban traffic
conditions. Information on travel time thus collected allowed for manage, control, and optimize
traffic effectively, and provided the basis for enhancing existing routing algorithms. Logistics-
related costs and environmental impact are positively affected by such IoT applications.
Road safety is certainly improved through the use of cooperative systems capable of
broadcasting traffic data to enable exchange of information. Urban environments serve this
purpose by providing the test bed conditions required by realistic experiments which use
massive amounts of valuable data. Leveraging urban environment allows for evaluating a wide
range of protocols, but also the interaction with in-vehicle systems and services. For example,
within the design and development of the See-Through System [32, 33] potential connectivity
issues and data transmission delays were tested by performing experiments under real
conditions using the 802.11p standard wireless communication protocol.
Further cooperative approaches can improve drivers’ visual awareness (e.g., of safe distances)
through the implementation of safety and decision-making processes at an individual level.
Furthermore, information relevant to the determination of appropriate safety distance can be
garnered through the stereoscopic capturing and processing of images capabilities of rear
cameras.
6.3. Smart Transport Infrastructure
City transport infrastructure, as well as vehicles and the user interaction with them, are being
transformed by digital technologies. Intelligent transportation systems (ITS) is the collective
term which comprises all smart infrastructure technologies, technologies which are being
embedded in traffic lights, car parks, roads, bridges, and toll-booths to make them capable of
communicating with one another and with vehicles. The benefits granted by these innovations
are manifold: the resulting transport infrastructure system will sport less congestion, higher
safety, and will be predictively maintained.
As roads share space with people and vehicles, a variety of transport-related activities could be
recognized and monitored through sensors integrated into road infrastructure, in the same
manner that IoT and IoS (Internet of Space) leverage applied sensor technology.
The European Commission’s action plan for the deployment of intelligent transport systems -
the “ITS action plan” - aims at reducing the environmental impact of road transport and its
interfaces with other transport modes. The definition of European standards (e.g., for data
exchange) serve as a necessary means to this end. Moreover, the EU promotes intermodal
transportation to reduce congestion and greenhouse gas emissions, make roads safer and
decrease energy consumption.
Over 80% of the world’s greenhouse gas (GHG) emissions are due to emissions generated by
urban-related production and consumption. Pollution severity in some cities force their citizens
to restrain from engaging in outdoor activities and using vehicles. Nowadays, finding an energy
supply which directly involve mobility systems has become a priority. Modifications in modes of
transportations, travel rout and the integration of real-time information can result in optimal
average car speed and improved traffic flow.
Highly networked transport systems could be designed to work more like an ecosystem than a
mechanism, thus relying more on local rules than on top-down control. This would better

Page 23
leverage an environment with rich feedback between vehicles and the infrastructure on which
they rely, taking full advantage of intelligent assets in applying circular economy principles and
contributing to find even more innovative and comprehensive smart city solutions.
A circular economy is similar to an ecosystem in that it is not subject to a pervasive controlling
influence and heavily relies on feedback. The flows of information generated may be exploited
to make a transport system more circular. Traffic lights, in particular, could serve as an
example. As Helbing and Laemmer show, digital sensing and communication technologies can be
integrated into a set of traffic lights to allow car to control the lights rather than the opposite,
thus reducing average delay times by up to 40%. This results from traffic being a complex
adaptive system, which can be effectively managed by making each set of lights behave in
accordance with some simple ‘bottom-up’ rules (e.g., recognising ‘platoons’ of incoming cars
and prioritizing their passage), and by letting the system autonomously reach a dynamic
equilibrium.
Even state of the art mechanisms which control light sequences in a ‘top-down’ fashion still rely
on average rather than actual traffic patterns (this happens even when rush hours are taken
into account). Consequently, they cannot but be outperformed by the simple rule approach.
This is because the sheer complexity of the system as a whole is simply for real-time
optimization: even a supercomputer could not manage to perform all the necessary
computations. Moreover, shock cannot be tackled as effectively as with the simple rule
approach.
Also two-wheeled vehicles could benefit from this strategy. For instance, Copenhagen is
installing 380 smart traffic signals capable of prioritizing the progress of cyclists through traffic,
thus speeding up their commutes (in Copenhagen, 50% of all residents commute by bike).
Platoons of bikes approaching an intersection can be detected by sensors and be allowed
through by turning the lights to green, process which can be replicated along specific routes,
eventually creating an uninterrupted journey, using the data from cameras to fine-tune the
lights timings by estimating the cyclists’ speed. It is expected that travel times will be reduced
by 10% and the number of commuters will increase.
The increasing flow of information could eventually make even smart traffic signals altogether
obsolete in the future, even if they outperform pre-programmed ones. In fact, modelling by the
MIT Sensable Lab has shown that a slot-based system could merge information sent by self-
driving cars equipped with a variety of sensors, effectively creating autonomous intersections
which would be superior to traffic lights of any sort. Streams of vehicles would be accurately
directed, and the number of cars safely using an intersection over a given period could be
possibly doubled.
Bottom up rules and data flows could also be used to increase safety. Traffic lights could be
equipped with collision avoidance systems to allow them to recognize an imminent crash
between two vehicles on the basis of their trajectories, and consequently warn drivers or even
activate the vehicle’s brakes.
Even speed limits can benefit from the application of bottom up rules. As we will see in the
next sections, Intelligent Speed Adaptation could correlate information a digital speed limit
map with a vehicle’s position over time to help a driver keep the limit (e.g., by using traffic
signals to warn the driver), or to directly adjust the vehicle’s speed (e.g., by automatically
slowing down a self-driving car). For example, France has developed an ISA system capable of

Page 24
using traffic signals to automatically slow down fast-moving vehicles in extreme weather
conditions.
6.4. Intelligent Speed Adaptation
Excessive speed can not only be the cause of accidents, but also defines the level of impact;
thus, it can be considered as a contributory factor in road accidents.
Any system that did not allow the vehicle to exceed the safe or legally enforced speed is
referred to as an Intelligent Speed Adaptation (ISA). Their support aims at helping the driver
maintaining a legal and safe speed along the driving time. Essentially, ISA systems automatically
slow down vehicles and/or alert the driver involved in a speeding situation.
ISA intervention can be varied [34]:
• network-related information such as areas requiring lower speeds, network
conditions (e.g., related to weather, traffic density, incidents) could be incorporated
into speed limit information to extend its informative content;
• as to the level of intervention, ISA can be advisory (the driver only receives alerts
on limits and violations), voluntary (the system can control the vehicle but its activation
is up to the driver), or mandatory (the driver has no control over the ISA interventions)
Recently, interest on ISA has increased among the scientific community. Moreover, many
different European countries have taken actions to increase road safety.
In [35] a variety of speed management strategies and their effects have been systematically
identified; among those reported in the study, speed cameras, engineering schemes, ISA, speed
limits and zones, vehicle-activated signals and integrated strategies were the most common.
Several speed management strategies were reported to have positive effects. The strategies’
selection process mainly relies on the road characteristics, the driver’s attitude about the
strategy, economic and technological capabilities of the country and, as a crucial factor,
political support.
In [36] the authors presents a process to determine the speed limit values by matching a vehicle
real road-network position with a map and a database. A predictive model of movement is
combined with an In-of-Order Kalman filter in order to, respectively, limit instants without
informations and corrects the GPS measurements taking into account variable sampling times.
The model also includes an online map-matching algorithm based on several weighting
parameters.
The paper [37] reports research involving three cost-benefit analyses performed on different ITS
schemes (Active Traffic Management, Intelligent Speed Adaptation and the Automated Highway
System) on M42, one of the UK's busiest highways. The environmental scope of the assets
involved is widened to consider the possibility of new technology linked by ICT and located
within multiple spatial regions. Data centre energy emissions, the embedded emissions of the
road-side infrastructure, vehicle tailpipe emissions, additional hardware required by the
vehicles (if applicable) and safety, and all aspects of sustainability were the aspects which the
study focused on.
Bad driving behavior is at the root of over speeding violations. Nowadays, traffic rules are
frequently violated. The development of a new system capable of effectively detecting speed
violations on the road, and supporting the driver to observe traffic rules has been the subject of
the article [38]. In the proposed system, the drivers is warned while driving by keeping the
speed below the speed limit prescribed by a specific area and an alerting, recording and
Page 25
reporting system for over speeding vehicles is integrated into it. The system uses the ZigBee
technology, previously described in section 4.6.1. The main benefit which comes with using this
system is that in the case of speeding vehicles not being controlled by the driver, the system
takes control of the vehicle automatically thus avoiding potential crashes.
GreenDrive is another project which is focused on ISA [39]. Developed by the University of
Illinois, GreenDrive can help drivers save fuel by judiciously advising on driving speed to match
the signal phase and timing (SPAT) of upcoming signalized traffic intersections. In the absence
of such advice, the default driver behavior is usually to accelerate to (near) the maximum
legally allowable speed, traffic conditions permitting. This behavior is suboptimal if the traffic
light ahead will turn red just before the vehicle arrives at the intersection. GreenDrive uses
collected real-time vehicle mobility data to predict exact signal timing a few tens of seconds
ahead, which allows it to offer advice on speed that saves fuel by avoiding unnecessary
acceleration that leads to arriving too soon and stopping at red lights. GreenDrive differs from
previous work in three respects. First and most importantly, a more challenging scenario is
tackled, where some phases (such as left-turn arrows) are added or skipped dynamically, in
accordance with real-time traffic demand. Second, the approach used can accommodate a low
system penetration rate and low vehicle density. Third, GreenDrive treats user-specified travel
time requirements as soft deadlines and chooses appropriate speed adaptation strategies
according to the user time budget. Using SUMO traffic simulator with real and large-scale road
network, it is shown that GreenDrive learns phase durations with an average error below 2s,
and reduces fuel consumption by up to 23.9%. Real-world experiments confirm 31.2% fuel saving
and the ability to meet end-to-end travel time requirements.

Page 26
7. IoT applications on mobility
7.1. Project Sheets
In this section we present a set of relevant projects concerning IoT applications on mobility. For
each project, we provide a project sheet with the following information: Project Name, Official
Website, Led by, Start date, End date, Context, Budget, Funding, Contacts, Pilot sites, Main Goal,
Objectives, Key Technologies, Motivations, Relevant Outcomes.

COMPASS4D
Project Name: COMPASS4D
Official Website: http://www.compass4d.eu/
Led by: ERTICO (Giacomo Somma, [email protected])
Start date: January 2013
End date: December 2015
Context: Cooperative Intelligent Transport Systems (C-ITS)
Budget: €9.996.000
Contacts: [email protected]
Pilot sites: Newcastle, Copenhagen, Helmond, Verona, Bordeaux, Vigo, Thessaloniki
Figure 9 - Pilot sites
Description: Compass4D focused on three services which will increase drivers' safety and
comfort by reducing the number and severity of road accidents, as well as by optimising the
vehicle speed at intersections and by possibly avoiding queues and traffic jams. The three
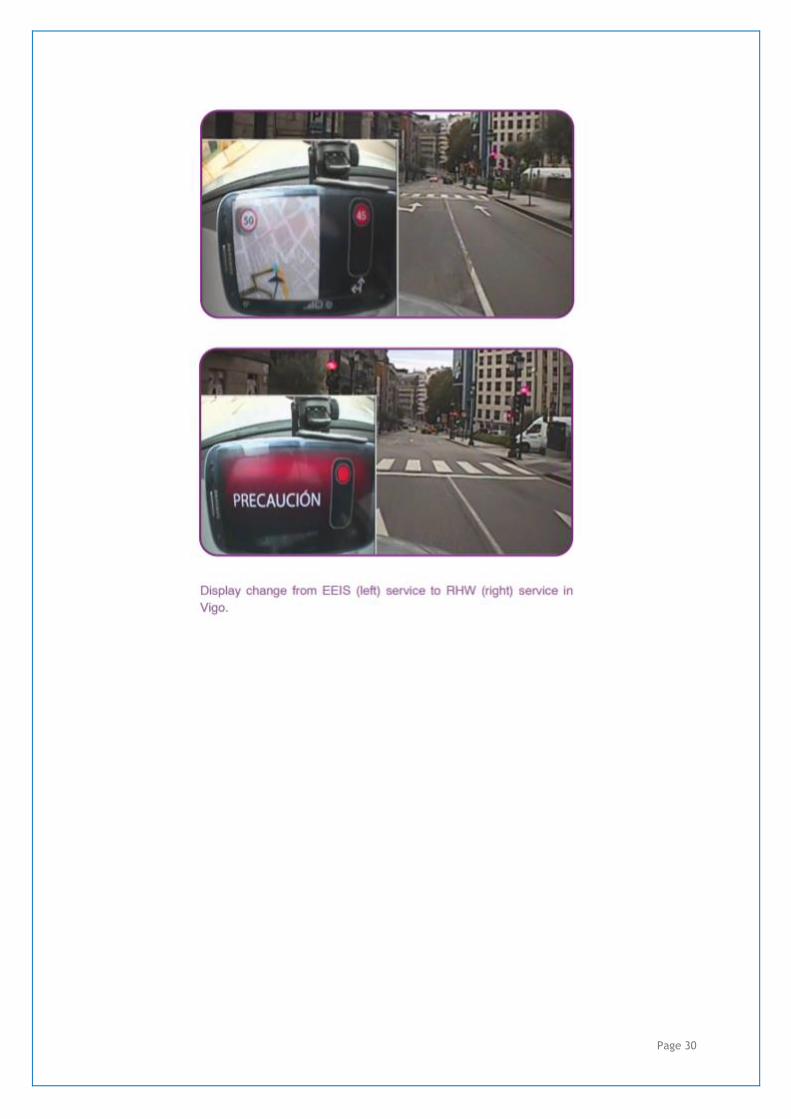
services are: the Energy Efficient Intersection (EEI), the Road Hazard Warning (RHW) and the
Red Light Violation Warning (RLVW). Compass4D services have also a positive impact on the
local environment by enabling the reduction of CO2 emissions and fuel consumption for
equipped vehicles.
Page 28
As the focus of Compass4D is on actual deployment, these services have been implemented
through a combination of established technologies and available pre-commercial equipment.
Dedicated short-range communication (ITS-G5) and cellular networks (3G/LTE) have been used,
following ETSI TC ITS standards. In addition, Compass4D has identified solutions to deployment
barriers and elaborated business models to make the services self-sustainable for a wide
commercialisation. This work includes cooperation with standardisation organisations and global
partners to achieve interoperability and harmonisation of services.
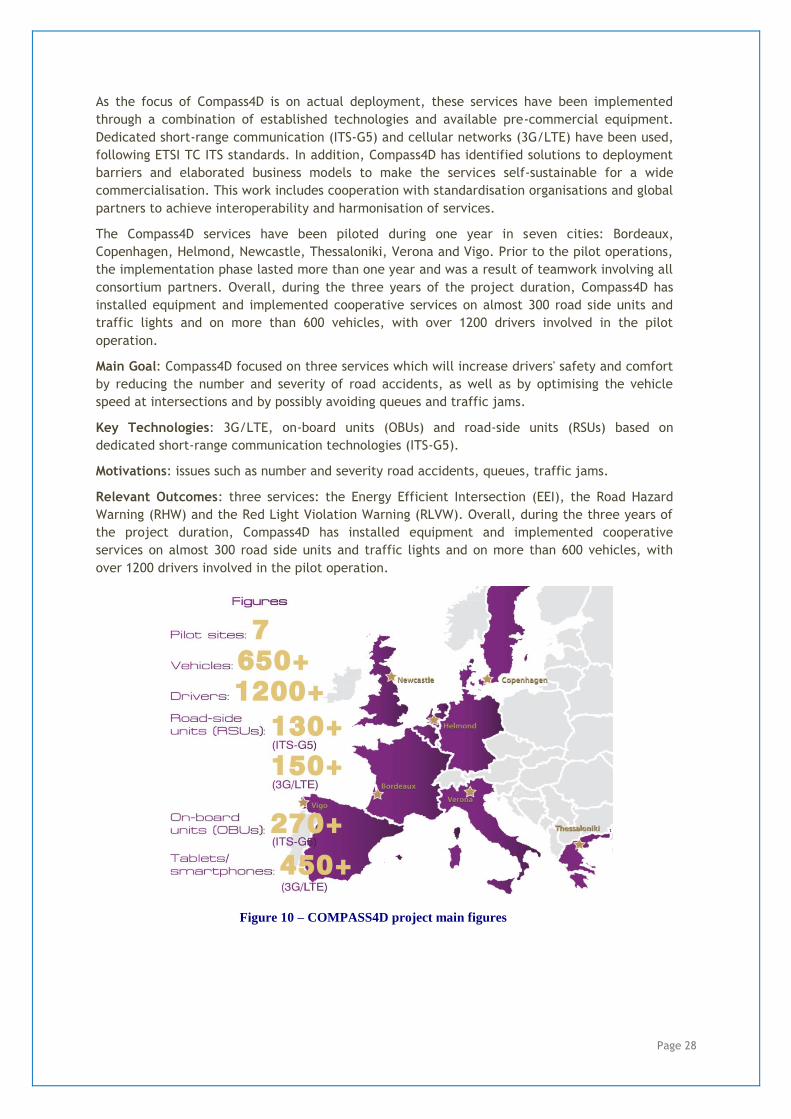
The Compass4D services have been piloted during one year in seven cities: Bordeaux,
Copenhagen, Helmond, Newcastle, Thessaloniki, Verona and Vigo. Prior to the pilot operations,
the implementation phase lasted more than one year and was a result of teamwork involving all
consortium partners. Overall, during the three years of the project duration, Compass4D has
installed equipment and implemented cooperative services on almost 300 road side units and
traffic lights and on more than 600 vehicles, with over 1200 drivers involved in the pilot
operation.
Main Goal: Compass4D focused on three services which will increase drivers' safety and comfort
by reducing the number and severity of road accidents, as well as by optimising the vehicle
speed at intersections and by possibly avoiding queues and traffic jams.
Key Technologies: 3G/LTE, on-board units (OBUs) and road-side units (RSUs) based on
dedicated short-range communication technologies (ITS-G5).
Motivations: issues such as number and severity road accidents, queues, traffic jams.
Relevant Outcomes: three services: the Energy Efficient Intersection (EEI), the Road Hazard
Warning (RHW) and the Red Light Violation Warning (RLVW). Overall, during the three years of
the project duration, Compass4D has installed equipment and implemented cooperative
services on almost 300 road side units and traffic lights and on more than 600 vehicles, with
over 1200 drivers involved in the pilot operation.
Figure 10 – COMPASS4D project main figures

Page 29
Page 30
Page 31
MOBiNET
Project Name: Europe-Wide Platform for Connected Mobility Services (MOBiNET)
Official Website: http://mobinet.eu/
Led by: Rasmus Lindholm, ERTICO ITS Europe. The consortium includes 33 partners, among
them: CRF (Centro Ricerche Fiat), Volvo, Transport for London, Allianz, Xerox, Tim (see full list
at http://mobinet.eu/?q=content/consortium)
Start date: 1 November 2012
End date: June 2017
Context: e-market place of mobility services
Budget: €15.6 million
Funding: €11 million (EU)
Contacts: [email protected]
Pilot sites: Aalborg, Helmond, Helsinki, London, Torino, Trikala, Trondheim, Vigo
Main goal: MOBiNET envisages a new “Internet of Mobility” where transport users meet
providers of next-generation mobility services. MOBiNET will open the door to harmonised
services, seamless connectivity, instant access to transport data, single subscription and billing
for travellers and a one-stop shop for mobility services.
Description: MOBiNET is a European e-marketplace of mobility services for business and end
users. At the core of MOBiNET is a platform providing components and tools that enable
interactions between users and suppliers of mobility services.
The MOBiNET e-marketplace allows content and service providers to exchange transport and
mobility services for new or third-party service development.
MOBiNET provides:
A comprehensive Europe-wide directory of mobility and transport-related data and services
An e-marketplace as an e-commerce network linking content providers, service providers
and end users
Traveller assistance tools for service roaming and virtual ticketing
Third-party service composition to discover and add content and services to existing
products
An “App Directory” and smart Communication Manager for end-user devices
A Service Development Kit to enable easy creation of new user services

Page 32
Figure 11 - MOBiNET e-marketplace
Motivations: The project addresses the current frustration that widespread deployment of ITS
services is hindered by the complexity of the real world of mobility information and
infrastructure, which e.g. prevents seamless coverage of services across borders throughout
Europe.
Relevant Outcomes: The MOBiNET concept includes five key areas of innovation:
Federated directory of all European online services for transport and mobility;
Identity authentication and management scheme for single sign-on by any user for
multiple services;
Unified accounting & billing framework, allowing roaming by users & payment clearing
between providers;
Secure operating environment for in-vehicle and portable devices, offering (for users) a
dedicated app-directory and (for service providers) access to all subscribing users;
B2B community & marketplace for automatic negotiation of service agreements when
adding extra service components and data sources to existing service offerings.
Key technologies: 3G/LTE.

Page 33
Figure 12 - The platform

Page 34
TEAM
Project Name: TEAM
Official Website: http://www.collaborative-team.eu/
Led by: Fraunhofer-Institut FOKUS. The consortium counts 28 partners, ranging from car
manufacturers to telecommunication providers, research institutes, road infrastructure
operators, traffic managers and more.
Start date: November 2012
End date: October 2016
Context: collaboration between travellers, drivers, and road infrastructure operators
Budget: €17.1 million
Funding: €11.1 million (EU)
Contacts: [email protected]
Pilot sites: within the EU (Trikala among them)
Main Goal: The vision is to use mobile devices such as smartphones to significantly improve
transportation safety and efficiency, implementing environmental aspects. This includes
contribution towards the objective of reducing fatalities in the EU, not only addressing drivers
but all road users – including passengers and pedestrians. In this way, drivers, travellers and
infrastructure are meant to act as a team, adapting to each other and to the situation, creating
optimised mobility conditions.
Description: The European Union supports this collective research with a co-funding. TEAM
stands for Tomorrow’s Elastic Adaptive Mobility. TEAM turns static into elastic mobility by
joining drivers, travellers and infrastructure operators together into one collaborative network.
Thereby TEAM explicitly takes into account the needs and constraints of all participants and the
network itself. The success of the project will be demonstrated and validated via innovative
applications for end-users and a Europe-wide mobility experiment to illustrate the systems’
benefits in a pan-European setting.
Key Technologies: 4G LTE, cloud, IEEE 802.11p (for V2X communication in the licensed ITS
band of 5.9 GHz).
Motivations: lack of collaboration between travellers, drivers, and the road infrastructure
operators.
Relevant Outcomes: 11 applications, which can be seen at http://www.collaborative-
team.eu/overview/apps

Page 35
Array of Things
Project name: Array of Things
Official Website: https://arrayofthings.github.io.
Led by: Argonne National Laboratory
Start date: 2013
End date: not defined
Figure 13 - Project timeline
Context: urban sensing.
Budget: $6 million
Funding: $6 million ($2 million from Argonne National Laboratory, $4 million grant funding from
the National Science Foundation, the University of Chicago, and other sources)
Contacts: [email protected], @arrayofthings (Twitter), Facebook.
Pilot sites: Most in USA and EU

Page 36
Key technologies: 3G/LTE, open data (all data are available on the hub for open datasets
plenar.io (http://docs.plenar.io).
Figure 14 - Current AoT Node Architecture
Main Goal: AoT will provide real-time, location-based data about the city’s environment,
infrastructure and activity to researchers and the public. This initiative has the potential to
allow researchers, policymakers, developers and residents to work together and take specific
actions that will make Chicago and other cities healthier, more efficient and more livable. The
data will help make Chicago a truly “smart city,” allowing the City to operate more efficiently
and realize cost savings by anticipating and proactively addressing challenges such as urban
flooding and traffic safety.
Because the data will be published openly and without charge, it will also support the
development of innovative applications, such as a mobile application that allows a resident to
track their exposure to certain air contaminants, or to navigate through the city based on
avoiding urban heat islands, poor air quality, or excessive noise and congestion.
Description: The Array of Things (AoT) is an urban sensing project, a network of interactive,
modular sensor boxes that will be installed around Chicago to collect real-time data on the
city’s environment, infrastructure, and activity for research and public use. AoT will essentially
serve as a “fitness tracker” for the city, measuring factors that impact livability in Chicago such
as climate, air quality and noise.
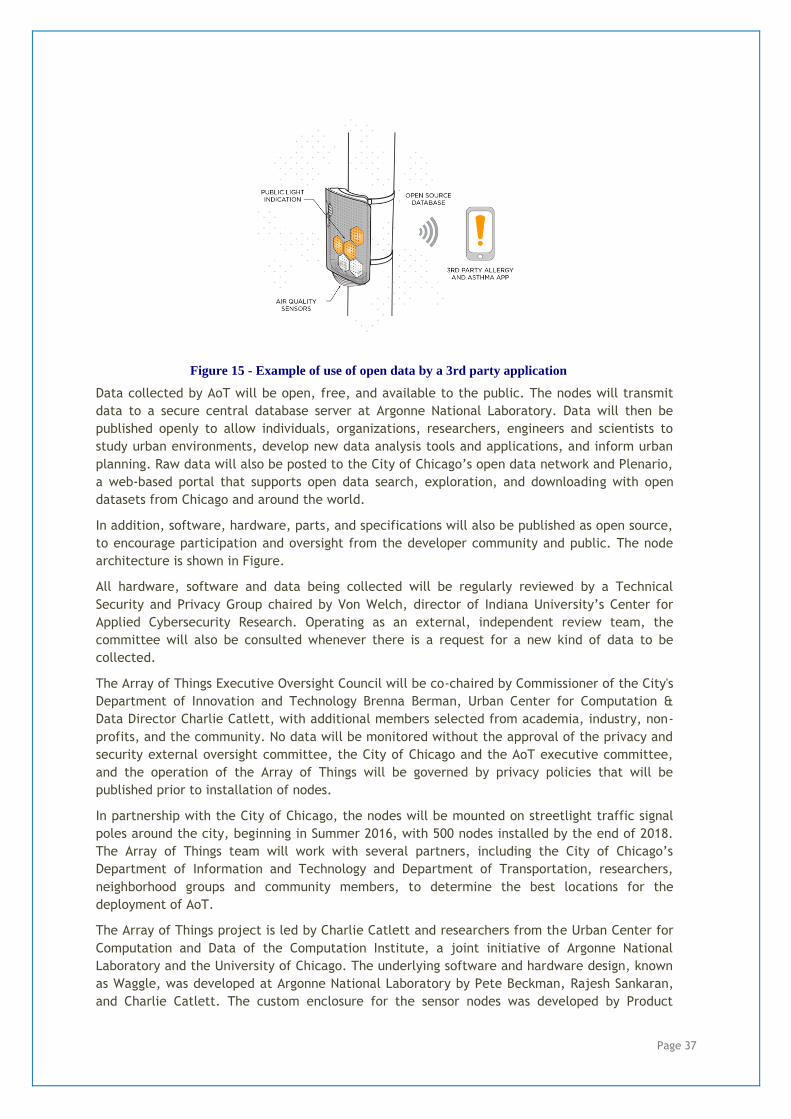
Page 37
Figure 15 - Example of use of open data by a 3rd party application
Data collected by AoT will be open, free, and available to the public. The nodes will transmit
data to a secure central database server at Argonne National Laboratory. Data will then be
published openly to allow individuals, organizations, researchers, engineers and scientists to
study urban environments, develop new data analysis tools and applications, and inform urban
planning. Raw data will also be posted to the City of Chicago’s open data network and Plenario,
a web-based portal that supports open data search, exploration, and downloading with open
datasets from Chicago and around the world.
In addition, software, hardware, parts, and specifications will also be published as open source,
to encourage participation and oversight from the developer community and public. The node
architecture is shown in Figure.
All hardware, software and data being collected will be regularly reviewed by a Technical
Security and Privacy Group chaired by Von Welch, director of Indiana University’s Center for
Applied Cybersecurity Research. Operating as an external, independent review team, the
committee will also be consulted whenever there is a request for a new kind of data to be
collected.
The Array of Things Executive Oversight Council will be co-chaired by Commissioner of the City's
Department of Innovation and Technology Brenna Berman, Urban Center for Computation &
Data Director Charlie Catlett, with additional members selected from academia, industry, non-
profits, and the community. No data will be monitored without the approval of the privacy and
security external oversight committee, the City of Chicago and the AoT executive committee,
and the operation of the Array of Things will be governed by privacy policies that will be
published prior to installation of nodes.
In partnership with the City of Chicago, the nodes will be mounted on streetlight traffic signal
poles around the city, beginning in Summer 2016, with 500 nodes installed by the end of 2018.
The Array of Things team will work with several partners, including the City of Chicago’s
Department of Information and Technology and Department of Transportation, researchers,
neighborhood groups and community members, to determine the best locations for the
deployment of AoT.
The Array of Things project is led by Charlie Catlett and researchers from the Urban Center for
Computation and Data of the Computation Institute, a joint initiative of Argonne National
Laboratory and the University of Chicago. The underlying software and hardware design, known
as Waggle, was developed at Argonne National Laboratory by Pete Beckman, Rajesh Sankaran,
and Charlie Catlett. The custom enclosure for the sensor nodes was developed by Product
Page 38
Development Technologies, based on early designs from Douglas Pancoast and Satya Mark Basu
of the School of the Art Institute of Chicago. The project is executed in partnership with the
City of Chicago.
The Array of Things project also involves partnerships with scientists at academic institutions
including Northern Illinois University, University of Illinois at Chicago, University of Illinois at
Urbana-Champaign, DePaul University, Illinois Institute of Technology, Purdue University,
University of Notre Dame, Arizona State University, the Santa Fe Institute, University College
London, Clemson University, and the Institute for Advanced Architecture of Catalonia. AT&T is
the project’s communications partner, providing all AoT connectivity for Chicago. Technical
advice and support comes from a growing number of industry partners including Cisco,
Microsoft, Schneider Electric, Intel, Motorola Solutions, and Zebra Technologies.
Array of Things is funded by the National Science Foundation, the Chicago Innovation Fund, and
Argonne National Laboratory.
Motivations: The AoT project tries to answer the following questions: What if a light pole told
you to watch out for an icy patch of sidewalk ahead? What if an app told you the most
populated route for a late-night walk to the El station by yourself? What if you could get
weather and air quality information block-by-block, instead of city-by-city?
Relevant Outcomes: Potential applications of data collected by the Array of Things include:
Sensors monitoring air quality, sound and vibration (to detect heavy vehicle traffic), and
temperature can be used to suggest the healthiest and unhealthiest walking times and
routes through the city, or to study the relationship between diseases and the urban
environment.
Real-time detection of urban flooding can improve city services and infrastructure to
prevent property damage and illness.
Measurements of micro-climate in different areas of the city, so that residents can get up-
to-date, high-resolution "block-by-block" weather and climate information.
Observe which areas of the city are heavily populated by pedestrians at different times of
day to suggest safe and efficient routes for walking late at night or for timing traffic lights
during peak traffic hours to improve pedestrian safety and reduce congestion-related
pollution.
Array of Things data and technology will also be available for educational purposes,
engaging local students and training them on important job skills( see Lane of Things).
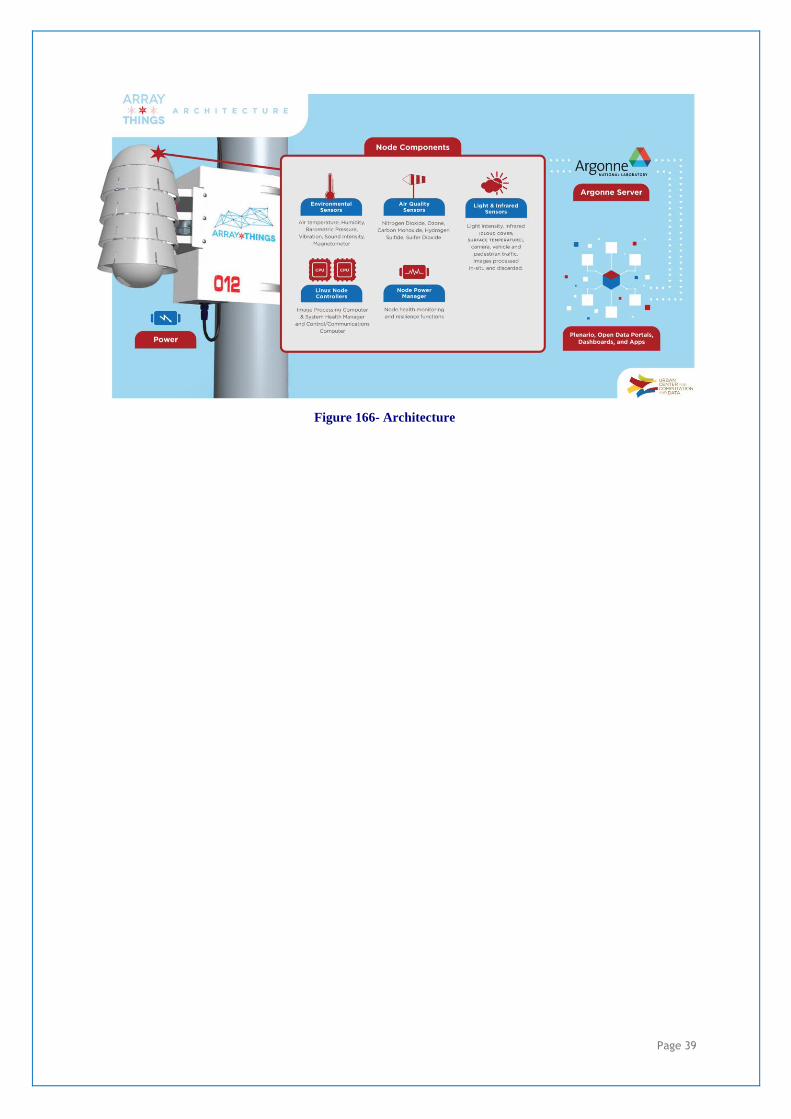
Page 39
Figure 166- Architecture

Page 40
oneTRANSPORT™
Project name: oneTRANSPORT™
Official Website: http://www.interdigital.com/solution/onetransport
Led by: InterDigital Europe. The consortium includes 11 partners: Arup, InterDigital Europe,
Buckinghamshire County Council,Clearview Traffic Group, Hertfordshire County Council,
Highways England, Imperial College London, Northamptonshire County Council, Oxfordshire
County Council, Traak Systems and World Sensing.
Start date: 2014
End date: 2026
Figure 17 - Project timeline
Context: smart city and transportation
Budget: £3.5 million
Funding: Part of the £3.5 million funded by Innovate UK
Pilot sites: UK
Main Goal: Enable data publishers, data subscribers, service and application providers. Operate
a commercial marketplace (technology, agreements, user guides). Integrate data sources and
provide training and access. Log transactions, reconcile data consumption, billing and
payments.
Description: The Innovate UK-sponsored oneTRANSPORT™ in-field trial, supported by a growing
ecosystem, is reaching its conclusion in November 2017. The oneTRANSPORT Data Marketplace
is being prepared by InterDigital to operate as an open commercial service.
The oneTRANSPORT Data Marketplace is an open, standards-based environment that both public
and private sector organizations are using to publish their data, where it can be discovered,
consumed and used in any kind of application or service.
Data owners can “publish once, distribute to many”. Organizations can: consume city and
transport-related data that was previously inaccessible or too siloed; distribute and gain access
to both static and real-time data via an open, cloud-based platform; discover and consume any
data via a single interface with terms that support the open use of data; as the platform does
not require exclusivity or copyright to published data, the organizations can use and distribute
their data through the means they prefer.

Page 41
The oneTRANSPORT Data Marketplace enables integrated operations and efficient use of
infrastructure. New services can be enabled that facilitate the movement of people and goods
and improve quality of life. The Marketplace supports connections with public and private data
systems and is especially suitable for data from sensor networks and the Internet of Things.
Securely stores published data and makes it available through open APIs that conform to the
global oneM2MTM international standard. Facilitates collection of access fees for data
publishers while also enabling free data distributions where applicable.
Key Technologies: open data (static and real-time), cloud, IoT devices (e.g. sensor networks).
Motivations: city budgets are under pressure in absolute terms and in relation to budgetary
ring-fences around education, health and welfare services. The financial squeeze led many of
the early smart city projects to tackle quick-win, point solutions with a clear, near-term return
on investment.
City managers are beginning to see that their initial focus on quick-win, standalone solutions is
costly to maintain and difficult to integrate into a unified smart city operating framework. The
strategic challenge is to recognize that each city will manage a growing number of connected
assets and data sources. The start-up challenge is to experiment by bringing together a few
data streams into a common environment to enable data sharing and application mashups for
different use cases. Technology can overwhelm the start-up process and lead to inaction or
investment in just a sub-set of the overall portfolio necessary to sustain multiple smart city
services.
One approach to overcome the technology challenge is to work within a multi-party eco-
system. Here, different specialists contribute their relevant expertise within the framework of
a common goal and model of cooperation. Such an approach combines the best of the public
and private sectors.
Relevant Outcomes: Data Marketplace Platform.
Figure 18 - The Data Marketplace Platform

Page 42
Informed Rural Passenger
Project name: Informed Rural Passenger
Official Website: http://www.dotrural.ac.uk/irp/
Led by: University of Aberdeen
Context: rural transport environment
Area/Region: UK
Main Goal: create a transport information ecosystem within which it is possible to explore
issues such as data provenance, reliability of passenger-sourced information, and travel
behaviour change.
Description: Informed Rural Passenger aims to review the state-of-the-art in journey planning
and passenger information systems including public and other shared transport modes; establish
user information requirements for the journey planning process in rural contexts; design
semantic models to underpin the rural passenger information ecosystem, including capturing
provenance; develop a prototype cloud-based platform for a rural passenger information
ecosystem, associated knowledge layers and scalable query/reasoning capabilities; create
prototype services that utilise the knowledge and information components of the ecosystem to
support real-time information and community content construction; apply user-centred
approaches to develop novel user-interface modalities for communicating travel information via
mobile and desktop clients; develop a component that assess the quality of information utilising
the ecosystem knowledge and information components; evaluate the system in a trial area,
including measurement of changes in travel behaviour in response to customised travel
information.
Key Technologies: 3G/LTE, linked open data, cloud platform.
Motivations: in rural areas, a possible underlying lack of potential solutions to develop travel
information services often cause journey planning scenarios to not be included due to missing or
inaccurate data.
Relevant Outcomes: Software: GetThere app (not available anymore); Intelligent Information
Infrastructure / Ecosystem.
Page 43
Social Journeys
Project name: Social Journeys
Official Website: http://www.dotrural.ac.uk/socialjourneys/
Led by: University of Aberdeen
Context: rural transport environment
Area/Region: UK
Main Goal: Exploring how social media updates can be combined with existing (open) datasets
to further enhance real-time passenger information.
Description: Social Journeys aims to understand how social media is currently used for real
time passenger information by identifying potential user groups in the passenger landscape;
apply user-led design methods to inform novel approaches for the use of social media; create
and evaluate bespoke travel information solutions via design workshops suited to the particular
needs of users; incorporate social media data into the broader public transport ecosystem;
understand the quality and trust issues associated with social media data; Investigate methods
to deal with inconsistencies between different data sources – whether these arise from errors,
malicious behaviours, etc.; deliver services that rural travellers will want to use, and that
operators/local authorities will want to host.
Key Technologies: 3G/LTE, linked open data.
Motivations: There has been a rapid growth in the use of social media in public transport in
recent years. Public transport service providers currently communicate with customers via
social networks such as Twitter. This benefits transport operators as they can gain insight into
customer attitudes and behaviours. It also enables passengers to be alerted to delays and
disruption at an early stage through the existing channels they use.
Relevant Outcomes: nothing relevant.

Page 44
On-the-go / Rural Mobility 2.0
Project name: RAMSES-Platform, on-the-go-rural mobility 2.0
Official Website: http://www.ruralmobility.eu/
Led by: Berlin University of Technology, Dept. Work and Technology , Marchstrasse 23 (MAR 1-
1), D-10587 Berlin
Context: rural transportation services
Area/Region: German state of Baden-Württemberg
Key Technologies: 3G/LTE.
Main Goal: Empowering rural mobility by linking public transportation services, alternative
mobility providers and rural communities together on one platform.
Description: The RAMSES on-the-go platform provides not only an intermodal trip planner and
ticketing for users of rural transportation services but also specifically aims at empowering
small-scale providers of mobility services in rural areas, e.g. voluntary community transport
providers. A low cost, integrated solution supports them in organizing, operating and marketing
their services. From the point of view of the advantage to the society, the platform provides
access to a wider range of mobility options, better integration, and consequently less
dependence on cars and lower environmental impact.
Motivations: Public transportation in rural areas needs to cope with structural difficulties of
low population densities, high car ownership and an aging rural society. But rural areas are also
characterized by vibrant community life, strong voluntary engagement and collaboration. Local
voluntary organizations in many European countries, including Germany, have started to
operate community transport services to their villages. The number and types of services is
growing steadily. RAMSES is taking these rural mobility services to the next level. Community-
driven transportation and other alternative mobility options like bottom-up car sharing rely
mostly on face-to-face contact, personal acquaintance and trust; it is largely paper-based, as
restricted budgets do not allow implementing IT infrastructure. Building on this first generation
of the sharing economy, RAMSES offers an easy-to-use IT application that allows providers to
make the most of the local commitment.
Relevant Outcomes: The digital platform “on-the-go”, which comprises on-demand, peer-to-
peer, scheduled and non-scheduled services.
In rural areas, mobility providers often lack digital tools to manage and promote their services.
on-the-go offers support via an IT-based mobility platform with smartphone interface.
Components of the platform are:
Routing assistant
Multimodal trip planner
Driver shift planning
Vehicle and fleet management
Accounting
Monitoring
Communications

Page 45
8. Opportunities
The evolution fostered by IoT applications will make different types of data collection easier,
more accurate, and in real-time. Moreover, new types of remote control and automation will be
devised. These developments bring about new opportunities for nearly all aspects of public
transport, including [40]:
Planning: opportunities of interest to strategic transport planners.
Operations: opportunities of interest to operators.
In the following sections, we will focus on these two types of opportunities, enabling new smart
mobility paradigmas, and we will consider the different impacts of their application in urban vs.
rural contexts.
8.1. Planning
Effective resource planning must ensure resources are best employed to provide the best
possible services to the travelers and to minimize the transport-related negative effects (e.g.,
CO2 emissions, noise). This is a major challenge in public transport, as it requires to tackle
possibly complex issues such as devising bus and train routes (or lines), determining frequencies
and timetables of the vehicles travelling along the routes, and localization of stops. Other
issues concern decisions on implementing new technologies, such as ITS services in public
transport. The lack of information feedback from transport operations is among the main
reasons why planning is not an easy task. In fact, transport planners are not always provided
with all the information they need, which, for instance, do not allow them to optimize
transport resources planning in the best possible way in case data on individual trips is not
sufficient. Collecting huge amounts of data, ranging from travel behavior to infrastructure
usage, is possible by increasing the use of IoT-based services in transport operations. This
represents a unique opportunity for transport planners to achieve optimal public transport
resources utilization (e.g., vehicles and infrastructure use).
One of the most common strategies to provide transport planning decision-making support is
transport modeling and simulation. This approach can, for instance, provide tools to predict the
effects of infrastructure investments and new transport policies. A simulation model could
require different types of data, ranging from socio-demographic information to the transport
network data. In addition, transport system modeling and simulation gives the opportunity to
access data automatically collected (e.g., by IoT devices) and to use open web services like
Google Maps to perform computations that traditionally are performed by the simulation model.
8.1.1. Examples of opportunities
IoT systems, smartphones, and crowdsourcing systems give transport planners the opportunity
to gain access to more accurate data, and/or new types of data. Among the tasks which could
benefit from the use of the data thus collected, is the optimal bus routes and timetables
planning, which could be more effectively carried out than it is usually possible today.
Collection of traveler data. Movement patterns of smartphone owners can be easily extracted
with applications, and leveraged to identify, among other things, the chosen transport mode
(e.g., car, bus, bike, walking) [47]. Other types of data that may be similarly obtained are the
Page 46
transport services used by individual travelers, and the time when they start or stop using
services. Such data may be employed to increase sustainability, by enabling for improved
transport resources utilization. An example of such possible improvements lies in supporting the
identification of more efficient routes, which should eventually result in reduced emissions
from public transport vehicles (i.e. direct emissions reduction). Benefits to other sustainability
issues are possible, according to the aspects of interest in the route design process, such as
accessibility, coverage, and travel time. Improved routes provide also the possibility of reducing
indirect emissions. Nevertheless, this is expected to how many travelers who traditionally
choose the private vehicle alternative are attracted by improved public transport routes,
enabled through the use of travel data, and how often they decide to opt for the public
transport alternative on the basis of such improvements.
Collection of vehicle data. IoT brings about benefits even on from the vehicle data collection
perspective. IoT makes it possible to automatically retrieve detailed travel data on aspects such
as the time when passengers enter and leave vehicles, occupancy rates (e.g., through sensors
which detect the available seats), and robustness (frequent delays). Planning of the resources
used in public transport might be improved to the benefit of travel planners by leveraging
realistic and high quality data of the abovementioned types. through Through collecting
information about the current use of vehicles, improvements in resource utilization and direct
emissions reduction can be achieved (e.g., by using mini-buses at times where few travelers are
expected). Public transport might, however, become less attractive if vehicle data is used to
favour the deployment of excessively small buses. Nevertheless, designing more attractive
services could lead to even higher indirect emissions reduction, for instance, by deploying extra
buses when the buses are typically crowded.
Collection of traffic data. Measuring congestion levels via crowdsourcing and road-side cameras
is an example of online traffic monitoring [48]. This strategy might provide input which can be
employed to reduce the direct emissions and public transport travel times, for instance, by
providing a means to avoid congested roads through the generation of improved routes. Public
transport could also be made more attractive by using traffic data to design ad-hoc services
along routes which are usually subject to heavy congestion issues (e.g. introducing bus lanes)
thereby indirectly causing a reduction in indirect emissions. Moreover, traffic data can be
potentially employed to the benefit of personal security, thus contributing to the safety
sustainability aspect. For instance, it can provide support to decisions towards building safer
bus stops along dangerous roads (e.g., due to high congestion or high driving speeds).
Collection of air quality data. Air pollution monitoring provide information that might be used
to identify the need for more environmentally friendly transport services, for example, using
public transport vehicles that produce less emissions. It may also support decisions regarding
the introduction of public transport services that travelers might prefer over private car
transport in areas with bad air quality.
Collection of transfer point data. Timetables optimization can be supported by retrieving
detailed information about transfer points between services, so as to make travelers utilize
routes involving multiple public transport services in a better way than they currently do.
Among others, relevant transfer point data can be data about people's movements collected by
different types of sensors.
Better-connected transport services may reduce the overall travel time, thus leading to better
economical sustainability from the travelers’ perspective. Improved timetables can also allow
for transfer point data to be used to support sustainability by reducing the emissions from non-
public transport, due to the fact that public transport services would become more attractive.
Page 47
Transfer points might be used to the advantage of elderly and weak traveler groups, by
adapting transfer points to their needs, thereby improving accessibility.
Use online services for modeling. An opportunity to develop analysis and problem solving
models using data in an innovative way is represented by the use of online services to access
the data collected by IoT devices and smartphones (such as crowdsourcing systems), and
different types of processed data [49]. For instance, online services might be used by transport
simulation models for analysis of public transport in order to access, e.g., weather data and
current travel times, collected by different types of IoT sensors. Travel planner systems are a
most relevant type of online service. They are mainly smartphone applications, are becoming
increasingly popular, and it can be reasonably assumed that the travelers’ decisions are
changing on the basis of the suggestions provided by such systems. The use of travel planners
might hence be leveraged to estimate people's travel behavior to increase the accuracy of the
travel behavior modeling in simulation systems. Online services has the potential to affect all
the sustainability aspects previously discussed, and thus support transport planning, even if
indirectly, through leveraging the output from a variety of different models.
Real-time delay information. The traveler is able to make informed decisions on which
transport service to select during a disturbance on the basis of information about the context,
and delayed or cancelled transport services. Support to such decisions can be personalized
through the use of information about the current location of the traveler (e.g., the bus they are
on). Thereby, alternative travel routes can be suggested to the traveler. Hence, the real-time
delay information supports the travel time sustainability aspect by helping the travelers to
reach their destinations with minimum delay during disturbance. Eventually, improved real-
time delay information might also support the reduction of indirect emissions by offering
transport services that are more predictable, and therefore more attractive. Moreover,
travelers with specific needs (e.g., elderly or disabled) can receive customized real-time
information about transport alternatives with high accessibility. IoT technology can also provide
information on delays (e.g., by devices capable of detecting bus stopping at the bus stop).
Co-traveler information. The IoT beacon technology could be used to provide information
about which passengers are travelling on the same vehicle. Together with information about the
passengers’ destinations, such information can be leveraged to connect people, thus allowing
for taxis sharing services during disturbances, or to reach the final destination in case using a
bus or train is not a viable option. IoT-enabled improvements to co-traveler information is
expected to also lead to improved sustainability, as it would improve resource utilization and
indirectly reduce travel time. It is here assumed that taxis sharing services bring about indirect
savings in terms of resources and emissions reduction in the transport system. Indirect
emissions are also expected to decrease with the increase in attractiveness of the transport
services, enabled by providing the users with easier ways to connect with one another.
Furthermore, also this type of service might be valuable in case of disturbances.
Real-time vehicle information. Real-time information about the status and characteristics of
the public transport vehicles can support the decision-making process about which public
transport service to choose. First, travelers can use information about the number of passengers
on a vehicle to identify overcrowded vehicles [50], thus giving them the possibility to making an
informed decision on whether to travel by bicycle or wait for an overcrowded bus. Second,
people with special needs (e.g., elderly, disabled) can be informed about relevant transport
alternatives with real-time information about the characteristics and status of specific vehicles.
Through the use of IoT, this type of information can be directed to passengers on board and/or
to people waiting for a vehicle. The use of such information could serve several purposes:

Page 48
informing a traveler if wheelchairs or baby strollers can be accommodated with ease on a bus,
or whether bicycles are allowed on a specific train waiting on a track. Accessibility is, clearly,
significantly affected by this type of information, which also makes the use of public transport
more attractive. In addition, travelers could choose not to take a vehicle which does not have
enough available room, and, hence, to reach their final destinations faster than without this
information.
Delay compensation. Proving their presence on a delayed vehicle would allow travelers to
more easily obtain price compensation for delays. IoT could make this possible by providing
data about the context. It is expected that delay compensation will eventually contribute
reducing indirect emissions, as getting a compensation could lead to opt for public transport
despite the possible delays, whose associated risk is often high.
Interchange guidance. Providing context-aware information during interchanges could serve as
a guidance to the traveler, allowing them, for instance, to reach the correct train platform or
ticket office, and to help calculating the time required to reach it. Personal disability
constraints might also be considered (e.g., need for wheelchair). Consequently, accessibility
aspect of sustainability could be significantly affected by interchange guidance information;
also, the interchange guidance might also result, even if indirectly, in travel time reduction in
case the times for (planned) interchange are reduced as a consequence.
Ticket-buying support. Travelers may interact with ticketing and payment systems, which can
be supported by IoT technology. IoT can be employed for ticket-buying support to provide
positioning information to make ticket purchasing easier. In addition, ticket validity could be
automatically extended in the event of disturbances. Obviously, ease-of-use and efficiency of
ticketing systems contribute to the overall attractiveness of the public transport system.
Furthermore, purchasing time could be reduced, thus leading to decreased travel times when
correctly implemented; it would also may make it easier for travelers with special needs (e.g.,
children, intellectually disabled) to use public transport.
Support during travel. Travelers may benefit from support during travel, which would ensure
that they are acting as planned. For instance, IoT-enabled support during travel might provide
confirmation that the boarded vehicle is the correct one for the purpose of reaching the
traveler’s destination, or tell if the traveler’s ticket is still valid, or give information about
when to get off the vehicle. The public transport system could become more attractive and
potentially also more accessible to larger groups of people (by appealing to, for instance,
disabled people) through the use of such support. Moreover, travel times may indirectly be
reduced by ensuring the traveler get off at the correct location along the route.
Enriched travel experience. Public transport can be made more attractive also by providing
different types of data capable to enrich the travelling experience, such as, but not limited to
contextual information about the current surroundings or the destination, or vehicle data that
help travelers to keep track of the environmental impact caused by their travel (possibly
comparing the impact to that caused by alternative modes of transport, e.g. private car).

Page 49
8.2. Operations
Operations is a term that refers to public transport resource management. In particular, actions
and decisions which are not taken into account in transport planning will constitute the main
subject of this section. Consequently, the focus will be solely on the real-time aspects of
operations. The data collected and generated by IoT systems not only bring about new
opportunities, but can support the process of decision-making regarding resource use and
services improvement. Usually, public transport services are timetabled. This makes of real-
time information provided by IoT systems a useful means to handle disturbances, that is,
deviations from the original plan. The main objective in such cases is to re-plan so as to restore
the original conditions of the transport system according to the original plan (e.g., by getting
stranded travelers to their destinations [41]. Regarding this topic, a more detailed overview of
the existing literature can be found on [42].
Re-planning decisions can benefit from real-time data by enabling the planners to rely on more
data and/or more accurate data. Taken actions are more easily communicated to both travelers
and operators. Nevertheless, re-planning does not always have positive effects on
sustainability, but better results can be obtained by accessing accurate, up-to-date
information. In fact, public transport may be the cause of an increase in total emissions if, for
instance, only few passengers are on-board.
8.2.1. Examples of opportunities
Improved management of operations. Knowledge on vehicles and travelers, as well as the
vehicles that travellers will use and the route which they will select (e.g., through ticketing
data, or sensor data, or information directly obtained from the traveler) can lead to
improvements in operations management. Improved management can result especially useful in
case of unplanned situations. As an example, the number of replacement vehicles (e.g. buses,
taxis) could be more accurately decided in case of a train departure cancellation the
occurrence of which requires to find alternative vehicles. Re-allocation or re-scheduling of
other vehicles might also require an improved decision-making process. Having access to high
quality information could lead to better decisions on decisions concerning whether a bus or
train should wait for another delayed vehicle. For example, having even partial information on
the number of passengers which will get on the waiting bus or train or knowing the expected
waiting time could be fundamental.
Demand Responsive Transport (DRT). A vehicle in a DRT is shared among passengers who
decide where it stops to pick up or drop off users [43]. The original goal behind DRT was to help
disabled or elderly people, but nowadays can be regarded as a viable means to increase access
and flexibility in public transport for the whole community. Bus routes acquire dynamicity and
flexibility as they can be decided by the passengers. The only bus stops to be visited could be
only those where the travelers want to exit and those where people are actually waiting. This
would ensure more sustainability due to improved coverage and higher accessibility. The public
transport alternatives enabled by DRT could, in the long run, lead to a reduction in indirect
emissions, this being be the consequence of a more attractive and adaptive service capable of
acquiring more users. Emissions could be potentially reduced by appropriately implementing the
service in such a manner as to allow buses to take shortcuts, hence avoiding stops without
awaiting users, or to employ smaller and fuel-efficient buses when demand is expected to be
low. The implementation could also consider advising passengers to reach the closest bus stops
to minimize their waiting time or to catch a fast transport service.

Page 50
Maintenance-wear. More accurate decisions can be made by using status data provided by
sensors. This would allow for fast recognition of immediate maintenance needs, hereby leading
to less scheduling for maintenance and repair stops, and possibly even less maintenance time in
total. Resources could be better exploited, adding to increased sustainability. Even if
indirectly, also other aspects of sustainability such as safety and travel time, might be
supported. Improved vehicles’ maintenance might result in higher safety (e.g., less frequent
brakes failure, no more worn out tires), which could also benefit from the avoidance of
dangerous passengers evacuations (e.g., at congested roads). Fewer unscheduled stops are
expected to lead to the avoidance of unnecessary waiting time. Better maintenance on vehicles
might result in an additional reduction in waiting time for other vehicles sharing the same
infrastructure, due to the fact that ill-maintained vehicles would not cause any damage to the
infrastructure.
Maintenance-damage. Related to maintenance due to wear and tear, IoT could also be used to
collect information about damage on the vehicles and the infrastructure used in public
transport. Travelers, for instance, could submit reports on malfunctions contextualized by using
data collected from the vehicles (e.g., broken seats or broken seat belts). This could increase
the traveler’s satisfaction in case that the response is immediate. Crowdsourcing enabling
operators (in addition to other travelers) to take quick actions could be a potential application,
as reported in [44]. Sustainability could benefit from this types of systems, as they will bring
about reduced indirect emissions and make public transport services more attractive; also, this
would ensure increased safety by swiftly identifying and repairing safety critical equipment.
Self-driving vehicles. IoT enables the development of self-driving vehicles, which significantly
affect transport systems [45]. Transport overall cost and safety will be reduced by replacing
human drivers. It will be possible to effectively prioritize improved driving patterns (e.g., eco-
driving), hence leading to reduced emissions. Self-driving cars can be easily time-shared, which
is another interesting opportunity. This is due to the fact that the re-allocation to the next user
does not involve other human drivers. For example, a self-driving car can be rent for the
weekends by one user and it may also be employed by public transport (e.g., as taxi) during the
weekdays, hereby not requiring the user to care about the reallocation every week. To
conclude, sustainability can be achieved also by benefiting from the use of self-driving cars, as
they allow for reduced emissions and improved resource utilization; in addition, improvements
in terms of safety can also be obtained, depending on the implementation.
Transport related services. IoT not only benefits traditional public transport operators through
enabling innovative services and better decision making, but might also create opportunities for
transport-related services. For instance, for taxi companies and bike renters, reduced travel
time can result from providing information which supports the efficient re-allocation of
available taxis and bikes. Public transport can be made more attractive through bike rental
which might, for instance, enable travelers to move from one bus stop to another, and
terminals using rented bikes. Services might also be created that help travelers to find non-
occupied taxis and bikes. For instance, Munich developed a successful project on replacement
taxis [46]. As a whole, the improvements previously discussed may directly reduce travel time
and make public services more attractive, thereby leading to higher sustainability through
fewer indirect emissions.
8.3. Considerations for smart cities and smart lands
Innovation opportunities enabled by IoT technologies are often associated with a urban context, e.g. with the concept of smartcity. However, the final scope of this paper is to show if and how the

Page 51
quality of rural transport systems can be improved through the implementation of such emerging technologies: the fundamental question is:
“Does only a urban environment provide suitable conditions for the successful application of
IoT technologies, or can we imagine a smart mobility system for a smartland too?” We find here a new concept, that is emerging in the most recent discussions on territorial development, in particular in Italy: the concept of smartland, defined as “a smart, sustainable, inclusive territory, where widespread and shared policies can improve the attractiveness and competitiveness of the territory, with a particular attention to social cohesion, spreading awareness, creative growth, accessibility and freedom of movement, usability and quality of the environment, quality of life for all citizens“ (freely translated from [52] - Original statement:“un
territorio sostenibile, intelligente, inclusivo», nel quale politiche diffuse e condivise sono in grado di aumentare la competitività e attrattività del territorio con una attenzione particolare alla coesione sociale, alla diffusione della conoscenza, alla crescita creativa, all’accessibilità e alla libertà di movimento, alla
fruibilità dell’ambiente […] e alla qualità del paesaggio e della vita dei cittadini”). We have tried to answer the above question by comparing the possible implementation of the different IoT solutions presented in this chapter, in the two different settings. The result of this evaluation was that the identified opportunities can have very positive impacts both in smartcities and in smartlands: as a fact, even if we consider the different levels of population scattering, technological infrastructures, social maturity, economic opportunities, almost all solutions can be implemented in rural territories as well as in urban contexts. The following analytical charts confirm such evaluation.
Figure 19 – Suitability of the IoT Applications for Planners in Smartcities and Smartlands

Page 52
Figure 20 – Suitability of the IoT Applications for Travelers in Smartcities and Smartlands
Figure 21 – Suitability of the IoT Applications for Operators in Smartcities and Smartlands

Page 53
9. Challenges
In this section, challenges relevant to the IoT within public transport will be discussed,
especially in relation to the following categories: business models, privacy and integrity issues,
security, interoperability, scalability, usability, data collection, and deployment. In some cases
the identified challenges could be, at least partially, overcome with useful technologies. Some
examples of such technologies are given below. Nevertheless, there is not a single solution
capable of completely eliminating any of the identified challenges in all possible situations.
More specifically, the application of existing technologies to the reported challenges could be
hindered by the involved actors’ insufficient knowledge. The relevant previous work should be
reviewed if the challenges listed below have to be addressed, especially in the area of ITS. In
particular, a variety of different general ITS architectures, face different challenges and
technological developments. Being the architectures on a relatively high abstraction level, they
are technology-independent specifications on components and communications which, in turn,
implies that some of the interoperability challenges discussed below may be tackled by one
specific ITS architecture. A single “standard” ITS architecture does not exist; depending on
their needs, different countries and regions have developed their own customized ITS
architecture. To develop global solutions, this lack of a single standard ITS architecture must be
handled.
Business Models. IoT can be fully leveraged only if, in addition to the public transport operator,
also a variety of other different actors are involved, such as telecommunication operators,
sensor data providers, data storage providers, end-user service providers, public authorities,
and the travelers themselves. To develop and maintain the necessary infrastructure, large
investments may be needed, appropriate management and storage for the collected data must
be ensured, along with the necessary services and data APIs, etc. As is to be expected, the
involved actors have to sustain significant costs to build and maintain IoT systems; such costs
have to be covered for in a reasonable way, in particular because efficient IoT systems can be
developed and deployed only by employing certain types of actors. Devising effective business
models represents a major challenge, as they regulate the distribution of the revenues to cover
for the costs of the involved actors. Not only business models regulate how revenues and costs
are distributed, but they also provide services to the end users, companies and other
organizations. In fact, companies provide the necessary services only if business opportunities
are properly identified, but are also out of the scope of the transport operators and public
authorities; companies need to get a return on their investments. It must be noted that the
closer to the customer/user one is in the information chain, the easier it is to get paid.
Open data sources and platforms for public transport services do exist (cf. www.trafiklab.se).
Nevertheless, generating returns on investments in commercial data collection represents a
major challenge. Business models concerning large amounts of data, i.e., “big data”, have been
thoroughly discussed by Bulger et al.. Public transport operations are typically subject to strict
regulations and procurement of governmental agencies, which sometimes leads to transport
operators be forced to supply data. Continuity and quality are, however, a major issue, and
initiatives of other pure commercial and third party actors usually require business models.
Privacy and Integrity Issues. While privacy is concerned with not sharing data about
organizations and individuals, integrity is about protecting against unauthorized modification of
data. Not sharing information about the travels of individuals is often among the objectives of
privacy in the public transport context. Such information include the movement of individual
travelers, which can be tracked by mobile phone operators or by using RFID tags in travel cards

Page 54
(Origin-Destination matrices can be generated with these data). The activities of people and
items are today constantly monitored and recorded through a variety of sensors. Moreover, end
users themselves submit information about their activities. Ensuring privacy and integrity of
monitored individuals is thus a major challenge. Travelers’ trust can be obtained by ensuring
that no personal information is used or distributed without explicit consent. Among the most
relevant challenges are: securing stored and communicated data against unauthorized access
(both regarding disclosure and altering of the collected data), for instance, by using
cryptography and access control in different ways; anonymization of the collected data
preserving the ability to to trace the activities of individuals (that may be necessary to make
strong analyses possible, e.g., to enhance the public transport system).
Security. Many types of potential malicious actors (e.g., cyber-terrorists, hackers) may attack
the information systems of public transport, for various reasons. In addition to such actors, also
competitors could be a threat. For instance, public transport service providers which have
business interests in sub-optimal operations could also attack the system. The state-of-the-art
of security, and also privacy in IoT systems is covered by Sicari et al. [52], whose work could
help understand how it is possible to tackle malicious actors.
Interoperability. In machine-to-machine contexts, such as IoT, interoperability is a matter of
major concern, considering that sensors and other types of devices to a large extent
communicate without the involvement of humans. Interoperability refers to the ability of
systems to work together. The IoT is characterized by a plethora of heterogeneous connected
devices which work together and are provided by different vendors which use different
technologies, hence qualifying interoperability issues as some of the main challenges for a well-
functioning, connected IoT infrastructure. Interoperability-related challenges include
development and usage of standardized protocols and interfaces for communication and service
provision, such as standard web service protocols, middleware development, and others.
Scalability. Scalability, in IoT, is the ability of a system to function with an increasing number
of users, sensors, and devices which continuously collect and process large amounts data. As
previously mentioned, “big data” refers to the efficient management and use of this data. In
fact, when the amount of data is small storing and processing tasks are not always a complex;
however, when the amount of data grows at a seriously fast pace, as happens with the roll-out
of IoT, there are some major challenges deriving from storing and processing needs which are
related to the scalability, including storing all the collected data so as to preserve privacy and
integrity, and analyzing and processing all the collected data to convert them into meaningful
information, which can then be of use for a variety of actors (e.g., travelers and transport
operators). Sometimes, data can not be stored as the amount of collected data is simply too
much for it to be stored. Even if the data can be stored, there are cases in which privacy and
integrity issues might prohibit the storage of sensitive data. Another challenge is real-time
analysis of the data. Moreover, the huge amount of collected data (that maybe might not even
be possibly stored) makes it extremely complex to properly aggregate data to make it usable
for future analysis (e.g., for research purposes). Statistical distributions, for instance, can be a
meaningful way to store data. Also, more efficient algorithms and models are needed to analyse
the collected data and to solve problems (e.g., using simulation and mathematical
optimization). Efficient heuristics are also needed that can be used to solve optimization
problems (often in real time), due to the high complexity of many such problems.
Usability. Usability, in the IoT context, and especially when evaluated from the perspective of
public transport sustainability, measures how easy it is for the involved actors to leverage the
provided information and services (such as data collection and generation, e.g., via
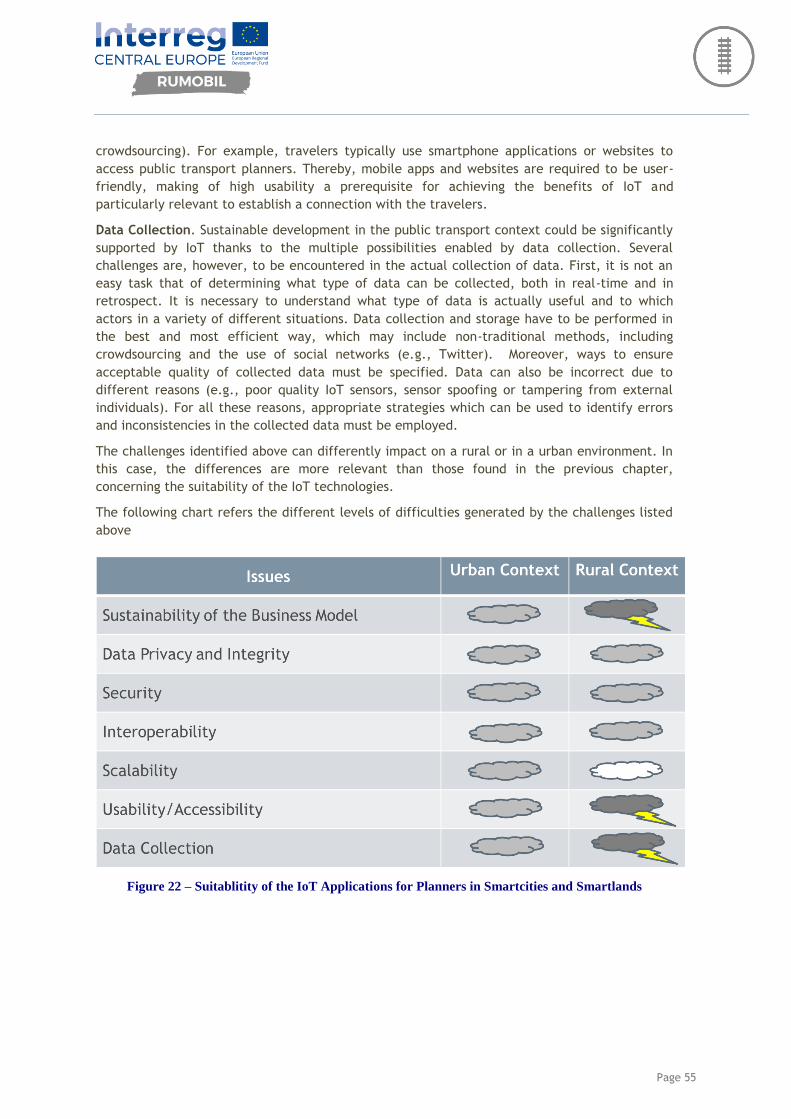
Page 55
crowdsourcing). For example, travelers typically use smartphone applications or websites to
access public transport planners. Thereby, mobile apps and websites are required to be user-
friendly, making of high usability a prerequisite for achieving the benefits of IoT and
particularly relevant to establish a connection with the travelers.
Data Collection. Sustainable development in the public transport context could be significantly
supported by IoT thanks to the multiple possibilities enabled by data collection. Several
challenges are, however, to be encountered in the actual collection of data. First, it is not an
easy task that of determining what type of data can be collected, both in real-time and in
retrospect. It is necessary to understand what type of data is actually useful and to which
actors in a variety of different situations. Data collection and storage have to be performed in
the best and most efficient way, which may include non-traditional methods, including
crowdsourcing and the use of social networks (e.g., Twitter). Moreover, ways to ensure
acceptable quality of collected data must be specified. Data can also be incorrect due to
different reasons (e.g., poor quality IoT sensors, sensor spoofing or tampering from external
individuals). For all these reasons, appropriate strategies which can be used to identify errors
and inconsistencies in the collected data must be employed.
The challenges identified above can differently impact on a rural or in a urban environment. In
this case, the differences are more relevant than those found in the previous chapter,
concerning the suitability of the IoT technologies.
The following chart refers the different levels of difficulties generated by the challenges listed
above
Figure 22 – Suitablitity of the IoT Applications for Planners in Smartcities and Smartlands

Page 56
10. UE Regulatory Framework
The European Commission is working to improve citizens' quality of life and strengthen the
economy by promoting sustainable urban mobility and increasing use of clean and energy
efficient vehicles. New political challenges have emerged in recent years. climate change,
energy policy, air quality legislation and the difficulties of tackling congestion are just some
examples. The objective now is the enhancement of sustainable mobility while at the same
time the reduction of congestion, accidents and pollution in European cities.
Exchanging data between different actors in the transport system means supply and demand
can be matched in real time, leading to a more efficient use of resources, be it a shared car, a
container or a rail network. Digital technologies help to reduce human error, by far the greatest
source of accidents in transport. They can also create a truly multimodal transport system
integrating all modes of transport into one mobility service, allowing people and cargo to travel
smoothly from door to door.
The Treaty of the Functioning of the European Union (TFEU)1 is especially encouraging the
sustainable mobility for specific target groups, such as workers (art. 202) by increasing their
geographical and occupational mobility thanks to the European Social Fund (art.162), students
and teachers, young people and their instructors (art.165) or researchers (art.180). Mobility on
European soil has been implemented through the European Transport Policy, adopting rules for
transport of both passengers and freight. This policy aims at “completing the internal market,
ensuring sustainable development [and] extending transport networks throughout Europe”
(articles 90 and 100 of the Treaty on the Functioning of the EU). Since 2001, the EU has
encouraged more sustainable transport and multimodality.
In several European documents and guidelines the need for a technological evolution to
optimize the transport system is pointed out2, from the point of view of environmental
sustainability, leading the European Commission to update legislation and standards on the
involvement of many actors (Member States, regions, private subjects, etc.) in the European
context and starting from the White Paper (2011) and its updating (2016).
COM (2011) 144: WHITE PAPER, Roadmap to a Single European Transport Area – Towards a
competitive and resource efficient transport system.
Link: http://eur-lex.europa.eu/legal-content/EN/TXT/PDF/?uri=CELEX:52011DC0144&from=EN
This strategic document presents the ideas of the European Commission on the future of the
European Union's transport system (EU) and defines a political agenda until year 2020. An
efficient transport system, is an indispensable requirement to maintain the prosperity of the
EU: there is a need for less traffic congestion, a reduction in emissions, an increase in
employment and increased growth. Within the document, the guidelines are outlined in 10
points, pointing the application of new technologies, communication between the user and the
1 The Treaty on the Functioning of the European Union (2007) is one of two primary Treaties of the European Union, alongside the Treaty on European Union (TEU). Originating as the Treaty of Rome, the TFEU forms the detailed basis of EU law, by setting out the scope of the EU's authority to legislate and the principles of law in those areas where EU law operates. 2 From: “Policy guidelines for sustainable mobility in rural and mountain areas”, Move on Green project, http://www.euromontana.org/wp-content/uploads/2014/06/Policy_Guidelines_Final_with_layout.pdf

Page 57
vehicle and/or the vehicles and infrastructures, reducing emissions of pollutants and a
"network" logic among the various modes of transport.
This White Paper, in particular, aims at the creation of framework conditions to promote the
development and use of intelligent systems, which can be implemented through interoperable
and multimodal scheduling, real-time passenger/travel information, online reservation systems
and smart ticketing, traffic management for improved use of infrastructure and vehicles, as
well as, promotion of awareness of the availability of alternatives to individual conventional
transport (drive less, walk and cycle, car sharing, park & drive, intelligent ticketing etc.).
SWD3 (2016) 226: The implementation of the 2011 White Paper on Transport "Roadmap to a
Single European Transport Area – towards a competitive and resource-efficient transport
system".
Link:
https://ec.europa.eu/transport/sites/transport/files/themes/strategies/doc/2011_white_pape
r/swd%282016%29226.pdf
This report looks at progress in the implementation of the initiatives under the ten-year
programme of the 2011 Transport White Paper by the stock taking of the activities undertaken
so far. One of the document annexes deepens the theme regarding the trends and
developments of relevance for transport in the collaborative economy. Specifically it is about
applying IT technologies for sustainable urban mobility (car sharing).
COM (2016) 766: A European strategy on Cooperative Intelligent Transport Systems, a
milestone towards cooperative, connected and automated mobility.
Link: https://ec.europa.eu/transport/sites/transport/files/com20160766_en.pdf
This document is the result of an intensive work with experts from both public and private
sectors with the aim of identifying the issues and solutions for the application of the
Cooperative Intelligent Transport System C-ITS platform in Europe in the transport sector. The
Cooperative Intelligent Transport System represents an approach that, through the use of ITS,
allows interaction between vehicles and between vehicles and infrastructure. The document
explains the issues that should be tackled at EU level to ensure coordinated of C-ITS services by
2019. Specific actions to address each issue are proposed, including the enabling conditions at
European, Member State, public authority and industry level.
COM (2016) 356: A European Agenda for the Collaborative Economy.
Link:
https://ec.europa.eu/docsroom/documents/16881/attachments/2/translations/en/renditions/
The document represents the first official position paper on Sharing Economy, issued by the
Commission in the form of Communication. The Commission recognises the highly innovative
potential of the collaborative platforms, because they enable new business models and create
new opportunities for consumers and entrepreneurs. Also the transport market has already seen
3 Staff Working Document
Page 58
the raising of new services and initiatives inspired by the principles of this new paradigm. The
Commission hopes that Europe is open to embracing these new opportunities to modernise the
economy, even if the actual criticalities concerning fair competition, working conditions,
adequate and sustainable consumer and social protection shall be solved by the Member States.
SWD (2016) 110: Digitizing European Industry Reaping the full benefits of a Digital Single
Market.
Link: http://eur-lex.europa.eu/legal-content/EN/TXT/PDF/?uri=CELEX:52016SC0110&from=EN
This Staff Working Document (SWD), which is built on a series of studies organized over the past
4 years, is part of the DSM (Digital Single Market) technologies and public services
modernization package. It accompanies the Communication "Digitizing European Industry –
Reaping the full benefits of a Digital Single Market" (in short Digitization Communication). In
this domain, the concept of IoT is in depth described with its definition and specification of
architecture and, in conclusion, there is the description of the application fields in which to
adopt the IoT “logic” (e.g., Personal Wellness and Wearables, Smart Manufacturing, Smart
cities, Smart energy, Automated Driving/Smart Mobility).
EU (2014): Connecting Europe’s citizens and businesses.
Link: https://europa.eu/european-union/file/1232/download_en?token=xCql9RmY
This publication is a part of a document set that explains what the EU does in different policy
areas, why the EU is involved and what the results are. This paper provides an overview of the
evolution of the transport system policy within the European context. The European goal, as
defined in the White Paper, is to reduce emissions and to incorporate the "network" logic in
transport systems. The paper analyses how the policy has evolved in order to meet this need,
from the point of view of infrastructure, but above all from the point of view of technological
innovation applied to the transport world.
EU (2016): Towards a Strategic Transport Research and Innovation Agenda (STRIA)
Link: http://ec.europa.eu/programmes/horizon2020/en/news/towards-strategic-transport-
research-innovation-agenda-stria
The document is a report regarding the transport stakeholders’ involvement in which a strategic
program for research and innovation in transport (STRIA) has been defined. Some issues have
been addressed in the context of transforming and decarbonising the EU transport system such
as: Electrification, Alternative, Fuel, Vehicle Design and Manufacturing, Connected and
Automated Transport, Transport Infrastructure, Network and Traffic Management Systems,
Intelligent Transport and urban mobility services).
Page 59
Move on Green project4
Move on Green, project co-financed by the European Regional Development Fund and by the
Interreg IV C programme, aimed to maintain the environmental and economic health of rural
areas and to ensure the access of both inhabitants and potential visitors to key services such as
employment, education and healthcare.
To do so, Move on Green had the objective to improve the design and effectiveness of regional
policies on sustainable transport in rural and mountain areas.
To achieve these goals, during 3 years, 13 partners from 10 EU countries have collected
examples of innovative ground-level initiatives and prepared a Good Practice guide on
innovative transport solutions to help decision makers to get inspiration and improve their
transport patterns. Partners have then derived from this practical experience these Policy
Guidelines on Sustainable Transport in rural areas to foster policy-learning for European and
regional policy-makers.
Finally, each regional partner has prepared an Implementation plan to concretely adapt its
policy towards more sustainable mobility schemes and transfer new sustainable transport
practices at regional and local levels.
At the end of the project, several Good Practices were successful transferred within the
partners’ regions and transport policies have sometimes even been changed.
The project demonstrated these Policy Guidelines can be of great help for all policy-maker to
encourage them to adapt their transport policy to the specific characteristics of rural and
mountain areas, to be inspired by Move on Green good practices and transferred them into their
own areas to improve sustainable mobility.
Conclusions
Starting from 2011 there has been a development from a regulatory perspective to achieving
the efficiency of the transport service. The concept of environmental sustainability of transport
services is realized through the technological innovation of vehicles and infrastructures.
As of January 2014, the EU has a new transport infrastructure policy that will connect the
continent from east to west, north to south. This policy aims to close the gaps between national
transport networks, remove bottlenecks that still hamper the smooth functioning of the single
market and overcome technical barriers such as incompatible standards for rail traffic.
In order to concretise the development plans, the policy will also benefit from the Commission's
3-year investment plan, funded through the Connecting Europe Facility, with a budget of €26bn
up to 2020 and designed to unlock public and private investment of at least €315bn by 20175.
4 From: “Policy guidelines for sustainable mobility in rural and mountain areas”, Move on Green project, http://www.euromontana.org/wp-content/uploads/2014/06/Policy_Guidelines_Final_with_layout.pdf
5 Source: https://europa.eu/european-union/topics/transport_en
Page 60
References
[1] Nokia, An Internet of Things blueprint for a smarter world, Strategic White Paper, 2016.
https://resources.alcatel-lucent.com/asset/190140
[2] Behmann F., Wu K., Collaborative Internet of Things (C-IoT): for Future Smart Connected
Life and Business, Wiley, 2015.
[3] Gubbia J., Buyyab R., Marusic S., Palaniswami M., Internet of Things (IoT): A vision,
architectural elements, and future directions. In: Future Generation Computer Systems, 2013,
Vol. 29, pp. 1645–1660.
[4] Ashton K., That ‘‘Internet of Things’’ thing, RFiD Journal (2009).
[5] Sundmaeker H., Guillemin P., Friess P., Woelfflé S., Vision and challenges for realising the
Internet of Things. In: Cluster of European Research Projects on the Internet of Things—CERP
IoT, 2010.
[6] Buckley J. (Ed.), The Internet of Things: From RFID to the Next-Generation Pervasive
Networked Systems, Auerbach Publications, New York, 2006.
[7] Akyildiz I. F., Su W., Sankarasubramaniam Y., Cayirci E., Wireless sensor networks: a survey,
Computer Networks, 2002, Vol. 38, pp. 393–422.
[8] Weiser M., Gold R., The origins of ubiquitous computing research at PARC in the late 1980s,
IBM Systems Journal, 1999.
[9] Caceres R., Friday A., Ubicomp systems at 20: progress, opportunities, and challenges, IEEE
Pervasive Computing, 2012, Vol. 11, pp. 14–21.
[10] Atzori L., Iera A., Morabito G., The Internet of Things: a survey. In: Computer Networks,
2010, Vol. 54, pp. 2787–2805.
[11] Sundmaeker H., Guillemin P., Friess P., Woelfflé S., Vision and challenges for realising the
Internet of Things. In: Cluster of European Research Projects on the Internet of Things-CERP
IoT, 2010.
[12] Belissent J., Getting clever about smart cities: new opportunities require new business
models, Forrester Research, 2010.
[13] Talari S., Shafie-khah M., Siano P., Loia V., Tommasetti A., Catalão J. P. S., A Review of
Smart Cities Based on the Internet of Things Concept. In: Energies, MDPI, 2017.
[14] Jaradat M., Jarrah M., Bousselham A., Jararweh Y., Al-Ayyoub M., The Internet of Energy:
Smart Sensor Networks and Big Data Management for Smart Grid. In: Procedia Computer
Science, 2015, Vol. 56, pp. 592–597.
[15] Whitmore A., Agarwal A., Da Xu L., The Internet of Things—A survey of topics and trends.
In: Information Systems Frontiers, 2015, Vol. 17, Issue 2, pp. 261–274.

Page 61
[16] Ngai E. W. T., Moon K. K. L., Riggins F. J., Yi C. Y., RFID research: an academic literature
review (1995–2005) and future research directions. In: International Journal of Production
Economics, 2008, Vol. 112, Issue 2, pp. 510–520.
[17] Zhu C.; Leung V. C. M.; Shu L.; Ngai E. C. H., Green Internet of Things for Smart World. In:
IEEE Access 2015, Vol. 3, pp. 2151–2162.
[18] Rawat P., Singh K. D., Chaouchi H., Bonnin J. M., Wireless sensor networks: A survey on
recent
developments and potential synergies. In: J. Supercomput. 2014, Vol. 68, pp. 1–48.
[19] Hancke G., Silva B., Hancke G. Jr., The Role of Advanced Sensing in Smart Cities. In:
Sensors 2012, Vol. 13, pp. 393–425.
[20] Zanella A., Bui N., Castellani A., Vangelista L., Zorzi M., Internet of Things for Smart
Cities. In: IEEE Internet Things J., 2014, Vol. 1, pp. 22–32.
[21] Medagliani P., Leguay J., Duda A., Rousseau F., Duquennoy S., Raza S., Ferrari G., Gonizzi
P., Cirani S., Veltri L., Monton M., Domingo M., Dohler M., Villajosana I., Dupont O., Internet of
Things Applications-From Research and Innovation to Market Deployment. In: Bringing IP to Low-
Power Smart Objects: The Smart Parking Case in the CALIPSO Project; The River Publisher,
Series in Communication: Delft, The Netherlands, 2014, pp. 287–313.
[22] Pike J., The Internet Of Things And Machine Learning, Moor Insights and Strategy, 2016.
https://www.forbes.com/sites/moorinsights/2016/03/16/the-internet-of-things-and-machine-
learning/#5b7022123fb1
[23] Haiyan L., Song C., Dalei W., Stergiou N., Ka-Chun S., A remote markerless human gait
tracking for e-healthcare based on content-aware wireless multimedia communications, IEEE
Wireless Communications, 2010, Vol. 17, pp. 44–50.
[24] Nussbaum G., People with disabilities: assistive homes and environments, in: Computers
Helping People with Special Needs, 2006.
[25] Yun M., Yuxin B., Research on the architecture and key technology of Internet of Things
(IoT) applied on smart grid. In: Advances in Energy Engineering, ICAEE, 2010, pp. 69–72.
[26] Kumar P., Ranganath S., Huang W., Sengupta K., Framework for real-time behavior
interpretation from traffic video. In: IEEE Transactions on Intelligent Transportation Systems,
2005, Vol. 6, pp. 43–53.
[27] Lin H., Zito R., Taylor M., A review of travel-time prediction in transport and logistics. In:
Proceedings of the Eastern Asia Society for Transportation Studies, 2005, Vol. 5, pp. 1433-1448.
[28] Mayer-Schönberger V., Failing to forget the ‘‘Drunken Pirate’’. In: Delete: the Virtue of
Forgetting in the Digital Age (New in Paper), first ed., Princeton University Press, 2011, pp. 3-
15.
[29] Methodology and indicator calculation method for sustainable urban mobility. World
Business Council for Sustainable Development. Project 2.0 (SMP2.0), WBCSD, 2015.

Page 62
[30] Olaverri-Monreal C., Autonomous Vehicles and Smart Mobility Related Technologies. In:
Infocommunications Journal, 2016, Vol 8, pp. 17-24.
[31] Filgueiras J., Rossetti R. J., Kokkinogenis Z., Ferreira M., Olaverri-Monreal C., Paiva M.,
Tavares J. M. R., Gabriel J., Sensing bluetooth mobility data: potentials and applications. In:
Computer-based Modelling and Optimization in Transportation. Springer, 2014, pp. 419-431.
[32] Olaverri-Monreal C., Gomes P., Fernandes R., Vieira F., Ferreira M., The See-Through
System: A VANET-enabled assistant for overtaking maneuvers. In: Intelligent Vehicles
Symposium (IV). IEEE, 2010, pp. 123–128.
[33] Gomes P., Olaverri-Monreal C., Ferreira M., Making vehicles transparent through v2v video
streaming. In: IEEE Transactions on Intelligent Transportation Systems, 2012, Vol. 13, Issue 2,
pp. 930–938.
[34] Carsten O., Fowkes M., Lai F., Chorlton K., Jamson S., Tate F., Simpkin B., ISA - UK, Final
Report, 2008.
http://webarchive.nationalarchives.gov.uk/20101007153833/http:/www.dft.gov.uk/pgr/roads/
vehicles/intelligentspeedadaptation/fullreport.pdf
[35] Sadeghi-Bazargani H., Saadati M., Speed Management Strategies - A Systematic Review. In:
Bulletin of Emergency and Trauma, 2016, Vol. 4, Issue 3, pp. 126-133.
[36] Van-Bao T., Verge M., Nazih M., Guichon D., Salim S., Development of a Dynamic
Intelligent Speed Adaptation. In: Procedia - Social and Behavioral Sciences, 2012, Vol. 48, pp.
2111-2120.
[37] Kolosz B., Grant-Mulle, Extending cost–benefit analysis for the sustainability impact of
inter-urban Intelligent Transport Systems. In: Environmental Impact Assessment, Elsevier, 2015,
Review 50 (2015), pp. 167-177.
[38] Sarowar S. S., Shende S. M., Overspeed Vehicular Monitoring and Control by using ZigBee.
In: International Journal of Current Engineering and Technology, 2015, Vol. 5, Issue 4, pp. 2349-
2352.
[39] Zhao Y., Li S., Hu S., Su L., Yao S., Shao H., Wang X., Abdelzaher T., GreenDrive: A
smartphone-based intelligent speed adaptation system with real-time traffic signal prediction.
In: 8th ACM/IEEE International Conference on Cyber-Physical Systems, ICCPS 2017, Pittsburgh,
United States, pp. 229.238.
[40] Davidsson P., Hajinasab B., Holmgren J., Jevinger Å, Persson J. A., The Fourth Wave of
Digitalization and Public Transport: Opportunities and Challenges. In: Sustainability, MDPI,
2016, Vol. 8, Issue 12.
[41] Darmanin T., Lim C., Gan H., Public Railway Disruption Recovery Planning: A new recovery
strategy for metro train Melbourne. In: Proceedings of the 11th Asia Pacific Industrial
Engineering and Management Systems Conference, Melaka, Malaysia, 2010.
[42] Jespersen-Groth J., Potthoff D., Clausen J, Huisman D., Kroon L., Maróti G., Nielsen M.N.,
Disruption Management in Passenger Railway Transportation. In Robust and Online Large-Scale

Page 63
Optimization, LNCS; Ahuja, R., Möhring, R., Zaroliagis, C., Eds.; Springer International
Publishing: Berlin, Germany, 2009, Vol. 5868, pp. 399-421.
[43] Ronald N., Thompson R., Haasz J, Winter S., Determining the Viability of a Demand-
Responsive Transport System under Varying Demand Scenarios. In: Proceedings of the 6th ACM
SIGSPATIAL International Workshop on Computational Transportation Science, Orlando, FL, USA,
5–8 November 2013.
[44] Lau S. L., Ismail S. S., Towards a real-time public transport data framework using crowd-
sourced passenger contributed data. In: Proceedings of the 82nd IEEE Vehicular Technology
Conference, Boston, MA, USA, 6–9 September 2015.
[45] Brownell C., Kornhauser A. A, Driverless Alternative—Fleet Size and Cost Requirements for
a Statewide Autonomous Taxi Network in New Jersey. In: Journal of the Transportation
Research Board, 2014, Vol.2416, pp. 73–81.
[46] Zeng A. Z., Durach C. F., Fang Y., Collaboration decisions on disruption recovery service in
urban public tram systems. In: Journal of the Transportation Research Board, 2012, Vol. 48, pp.
578–590.
[47] Xia H., Qiao Y., Jian J., Chang Y, Using smart phone sensors to detect transportation
modes. In: Sensors, 2014, Vol. 14, pp. 20843–20865.
[48] Artikis A., Weidlich M., Schnitzler F., Boutsis I., Liebig T., Piatkowski N., Gal A., Mannor S.,
Kinane D., Gunopulos D., Heterogeneous Stream Processing and Crowdsourcing for Urban Traffic
Management. In: Proceedings of the 17th International Conference on Extending Database
Technology, Athens, Greece, 24–28 March 2014.
[49] Hajinasab B., Davidsson P., Holmgren J., Persson J. A., On the use of on-line services in
transport simulation. In: Proceedings of the International Symposium of Transport Simulation,
Jeju, Korea, 29 August–2 September 2016.
[50] Farkas K., Nagy A. Z., Tomás T., Szabó R., Participatory sensing based real-time public
transport information service. In: Proceedings of the 2014 IEEE International Conference on
Pervasive Computing and Communications Demonstrations, Budapest, Hungary, 24–28 March
2014.
[51] Sicari S., Rizzardi A., Grieco L. A., Coen-Porisini A., Security, Privacy and Trust in Internet
of Things: The road ahead. Computer Networks, 2015, Vol. 76, pp. 146–164.
[52] Bonomi A., Masiero R., Dalla smart city alla smart land. Marsilio, 2015.