
Opnet Tutorial
53
Simulating Computer Networks Simulating Computer Networks with with Opnet Opnet A Simple Tutorial
-
Upload
sumit-dubey -
Category
Documents
-
view
187 -
download
8
Transcript of Opnet Tutorial
Simulating Computer Networks Simulating Computer Networks with with OpnetOpnet
A Simple Tutorial

ObjectivesObjectives
1) This tutorial focuses on the use of Opnet’sProject Editor
2) The Project Editor will allow you to quickly create, simulate, and analyze the performance of a computer network
3) By the end of this tutorial, you should be able to 1) Build a network quickly2) Collect statistics about the network’s performance3) Analyze these statistics
ObjectivesObjectives
1) In this tutorial1) We will build a small network2) Choose statistics to collect3) Run a simulation4) Analyze the results
Projects and ScenariosProjects and Scenarios
When creating a new network model, you must first create a new project and scenario.
Project: A project is a group of related scenarios that each explore a different aspect of the network design. Projects can contain multiple scenarios. Once you have created a new project, you can use the Startup Wizard to set up a new scenario

Creating a ProjectCreating a Project
! From the File menu, choose New! Select Project and click OK! Name the project <Sample_your initials>
and the scenario first_floor. (Include your initials in the project name to distinguish it from other students.) Click OK
! Click Next in the Startup Wizard
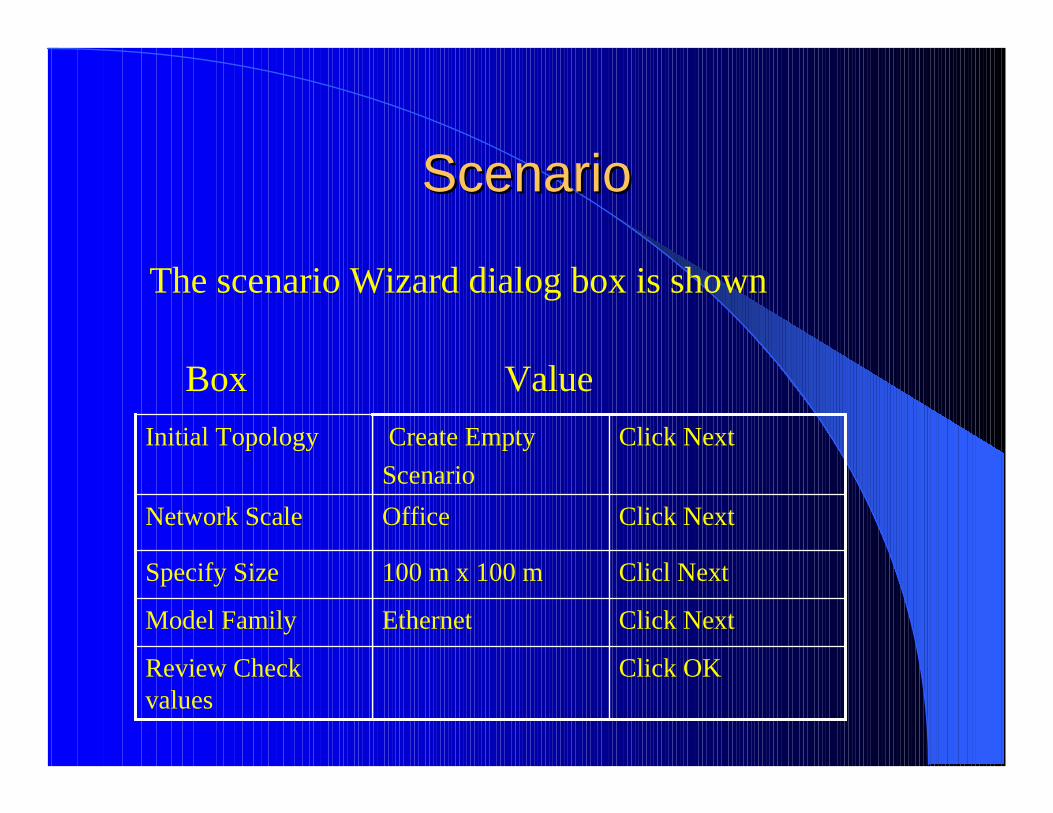
ScenarioScenario
The scenario Wizard dialog box is shown
Box Value
Click OKReview Check values
Click NextEthernet Model Family
Clicl Next100 m x 100 mSpecify Size
Click NextOfficeNetwork Scale
Click NextCreate EmptyScenario
Initial Topology
Creating Network TopologiesCreating Network Topologies
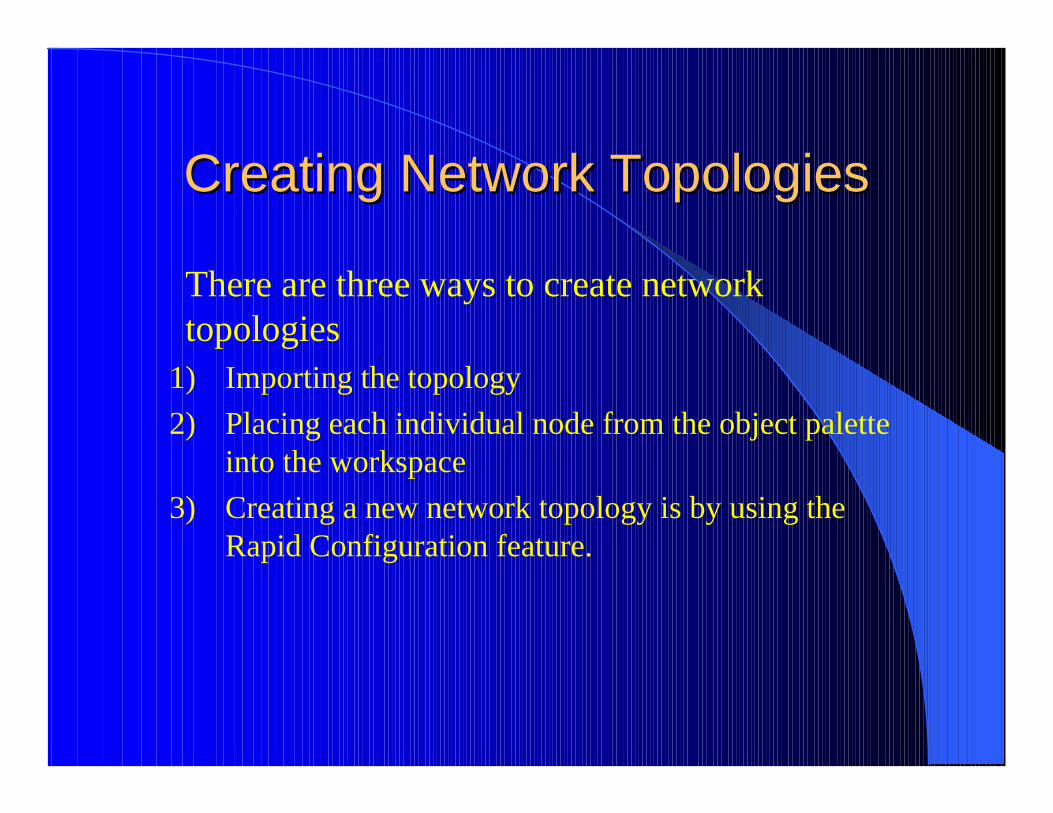
There are three ways to create network topologies
1) Importing the topology 2) Placing each individual node from the object palette
into the workspace3) Creating a new network topology is by using the
Rapid Configuration feature.

Creating Network Topologies Creating Network Topologies Rapid Configuration FeatureRapid Configuration Feature
Rapid Configuration allows you to select a network topology, the types of nodes within the network, and the links connecting the nodes.
To create the first floor network using Rapid Configuration:
Creating Network Topologies Creating Network Topologies Rapid Configuration FeatureRapid Configuration Feature
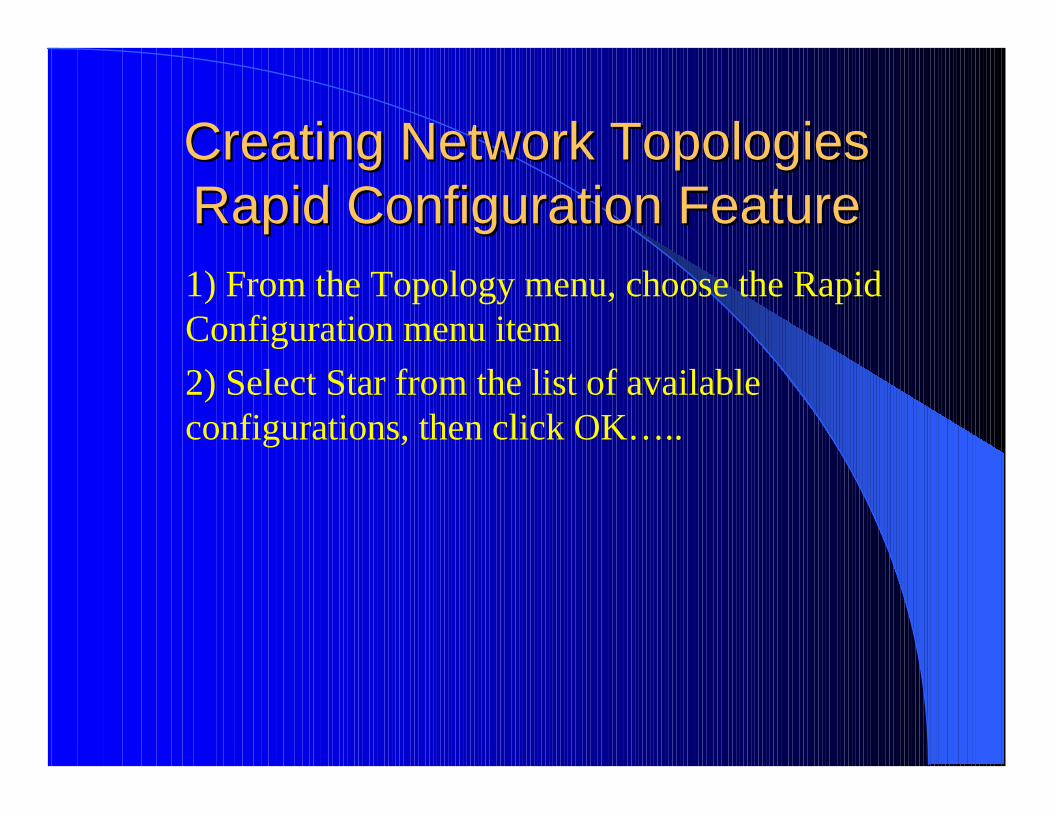
1) From the Topology menu, choose the Rapid Configuration menu item2) Select Star from the list of available configurations, then click OK…..

Creating Network Topologies Creating Network Topologies Rapid Configuration FeatureRapid Configuration Feature
Now that the network topology has been selected, you must specify the nodes and links to use to construct the network. Models follow this naming scheme:
20 Click OKRadiusX = 25, Y = 25Center 5Number
10BaseTLink Model
ethernet_wkstnPeriphery Node Model
ethernet_16_hubCenter Node Model
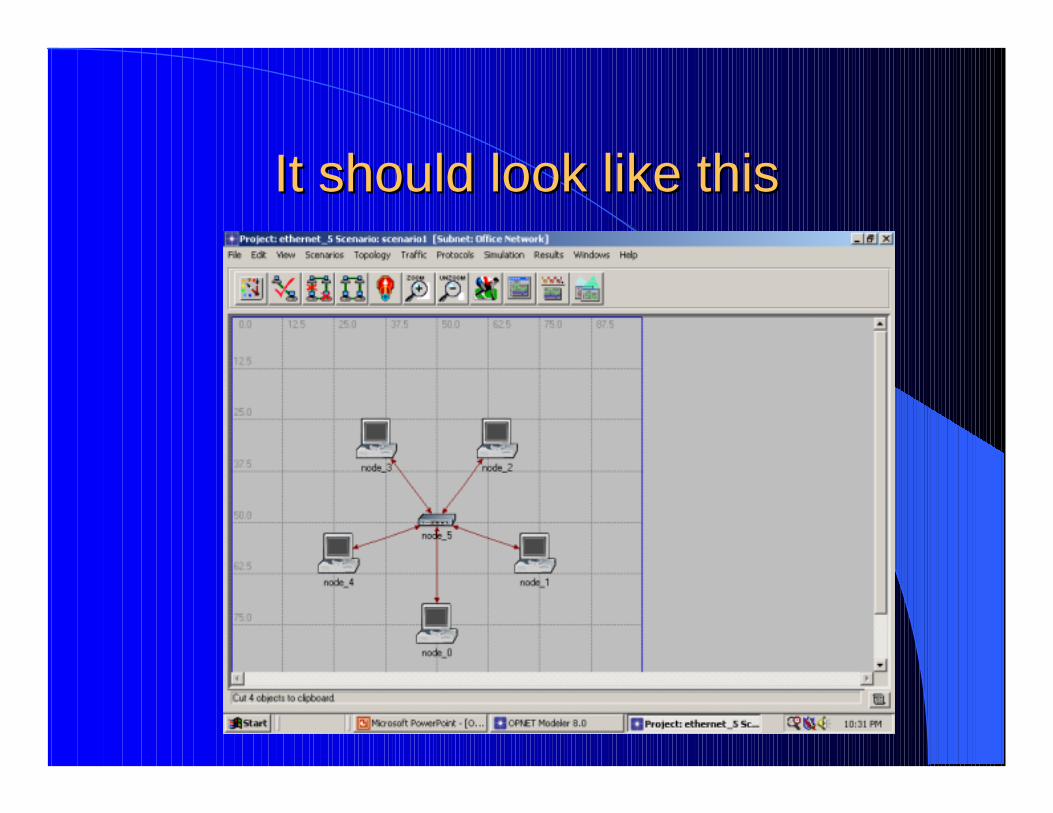
It should look like thisIt should look like this

Adding ComponentsAdding Components
Now that the general network topology has been constructed, you need to add a server. You can now use the second method of creating network objects, that is, dragging them from the object palette into the workspace.
Adding ComponentsAdding Components
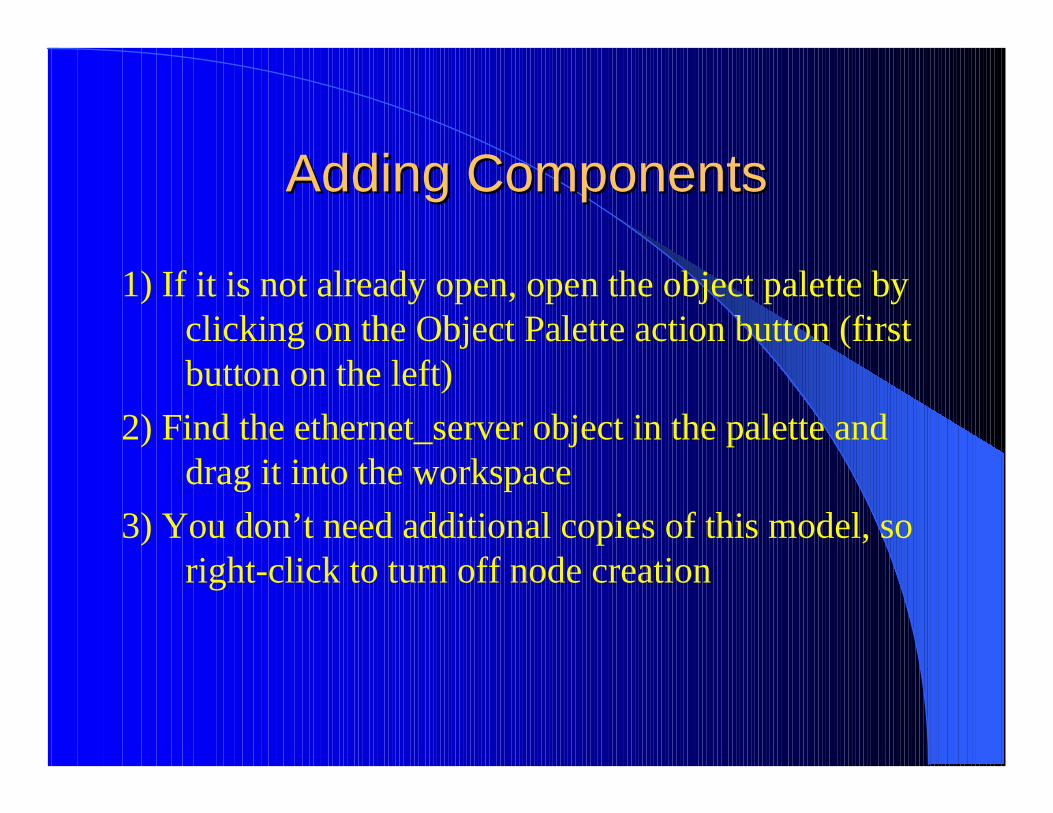
1) If it is not already open, open the object palette by clicking on the Object Palette action button (first button on the left)
2) Find the ethernet_server object in the palette and drag it into the workspace
3) You don’t need additional copies of this model, so right-click to turn off node creation
Adding ComponentsAdding Components
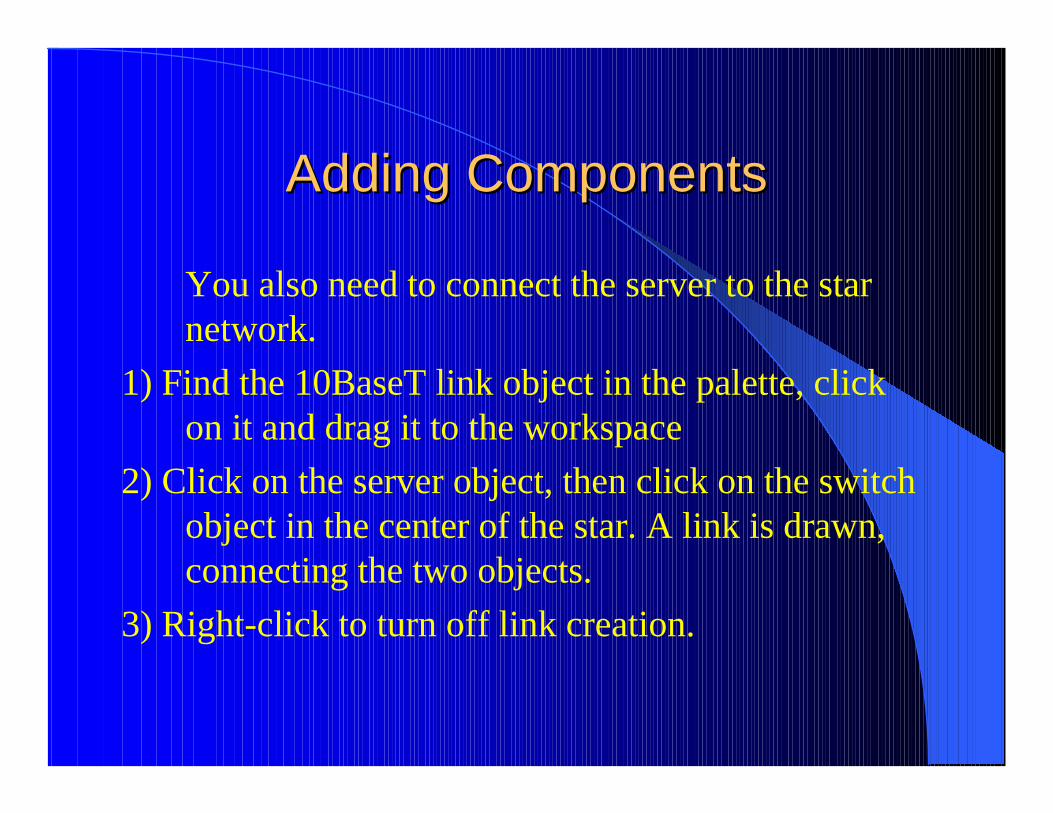
You also need to connect the server to the star network.
1) Find the 10BaseT link object in the palette, click on it and drag it to the workspace
2) Click on the server object, then click on the switch object in the center of the star. A link is drawn, connecting the two objects.
3) Right-click to turn off link creation.
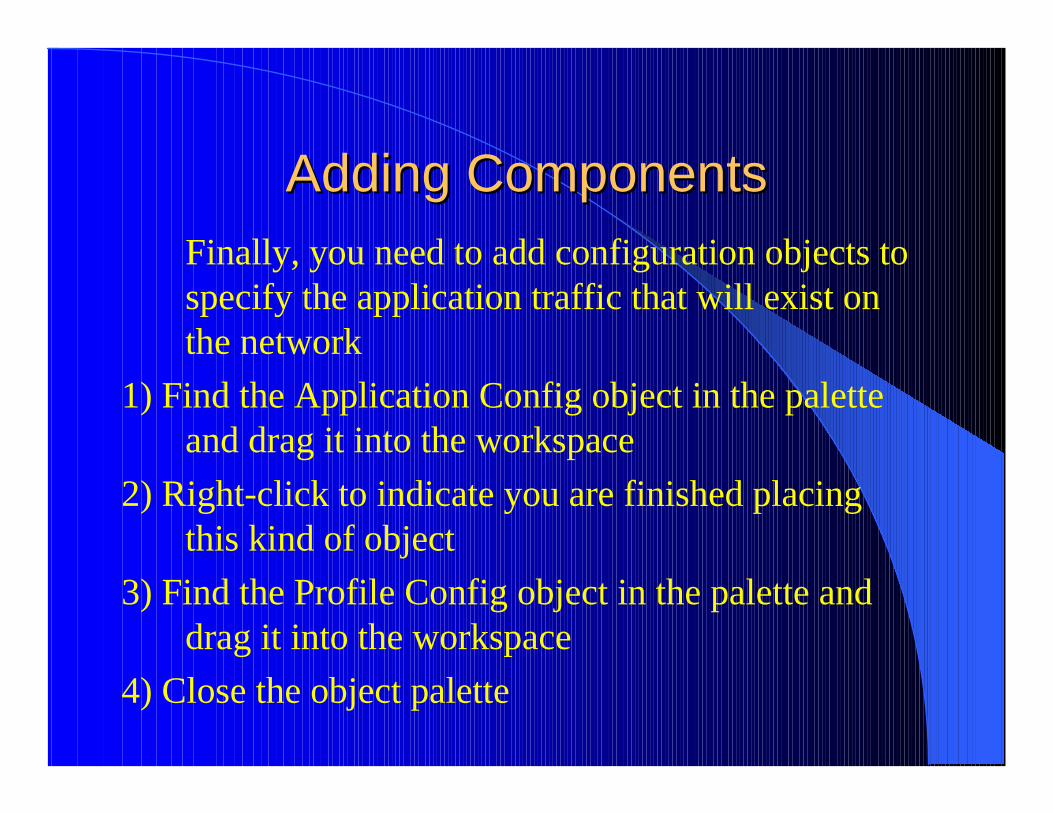
Adding ComponentsAdding ComponentsFinally, you need to add configuration objects to specify the application traffic that will exist on the network
1) Find the Application Config object in the palette and drag it into the workspace
2) Right-click to indicate you are finished placing this kind of object
3) Find the Profile Config object in the palette and drag it into the workspace
4) Close the object palette
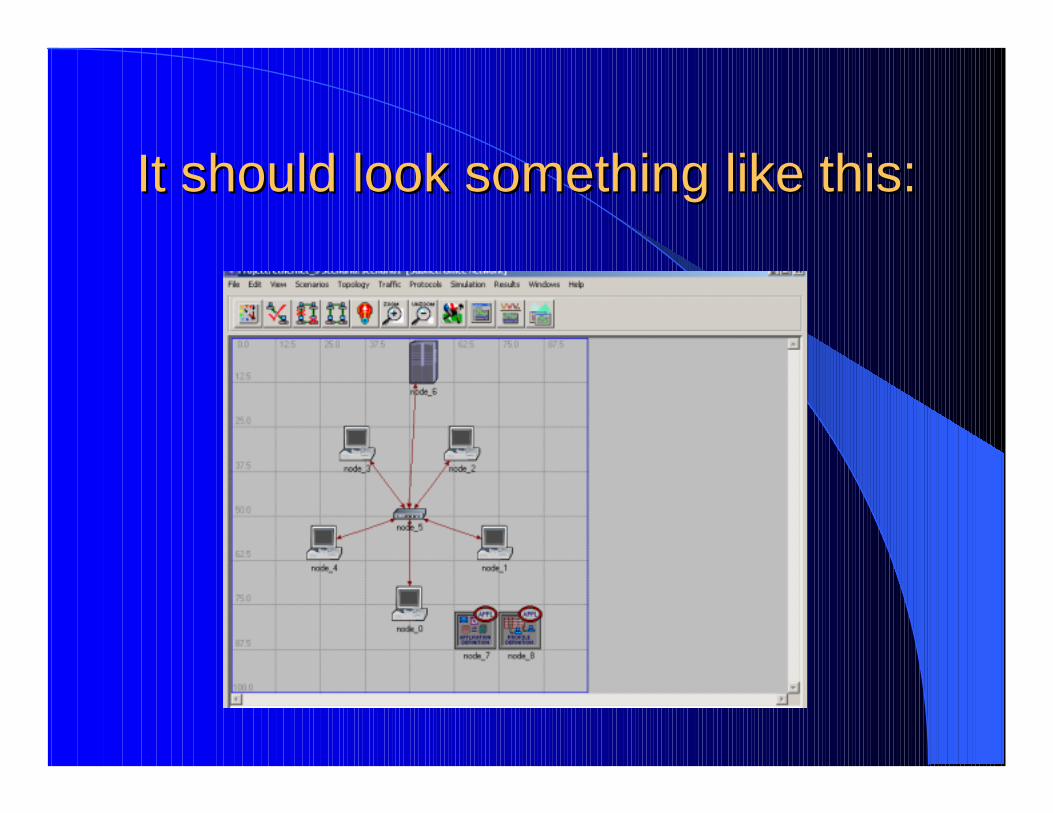
It should look something like this:It should look something like this:

Editing Attributes Editing Attributes
1) You can change the properties of objects such as hubs, switches, work station, etc. by editing the attributes
2) Right click on the object you want to edit3) Choose Edit attributes
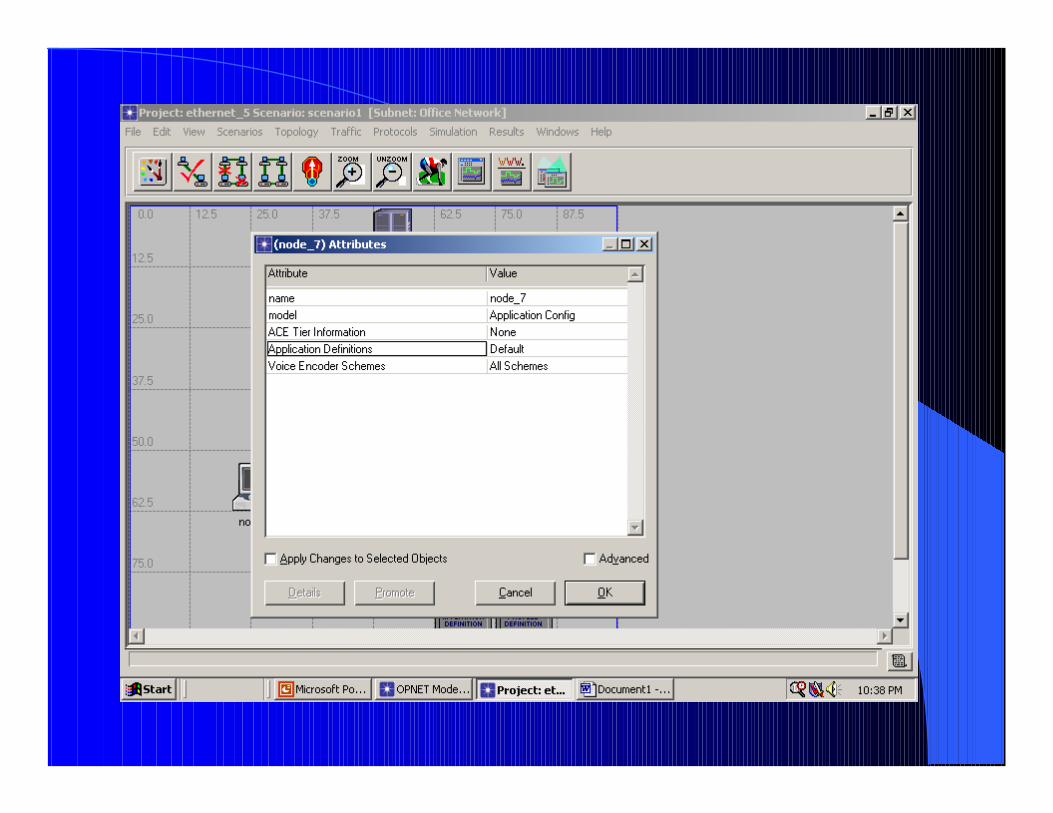
Adding Traffic to the NetworkAdding Traffic to the Network
In order to add traffic in the network edit the following objects:
1) Application Definition2) Set the application definition attribute to
Default
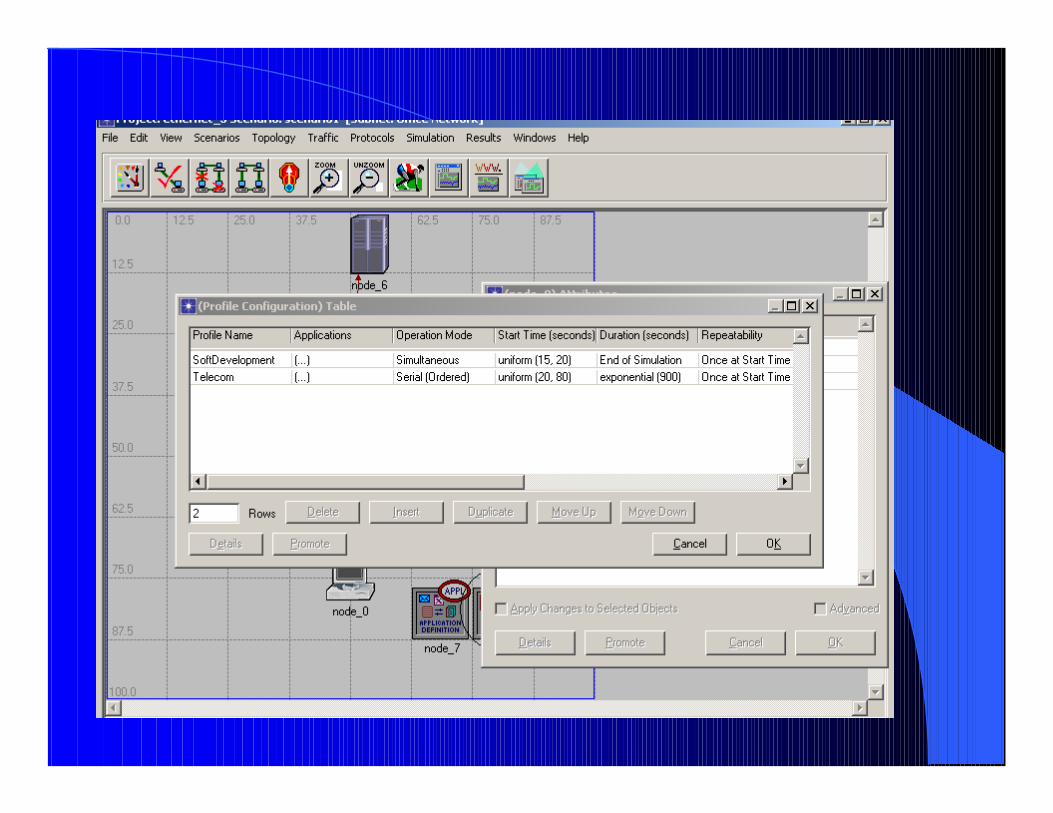
Adding TrafficAdding Traffic
1) Edit the Profile Configuration2) Edit the Profile Configuration in the new
window3) Put number 2 in rows4) Set the values as shown in the following
slide
StatisticStatisticss
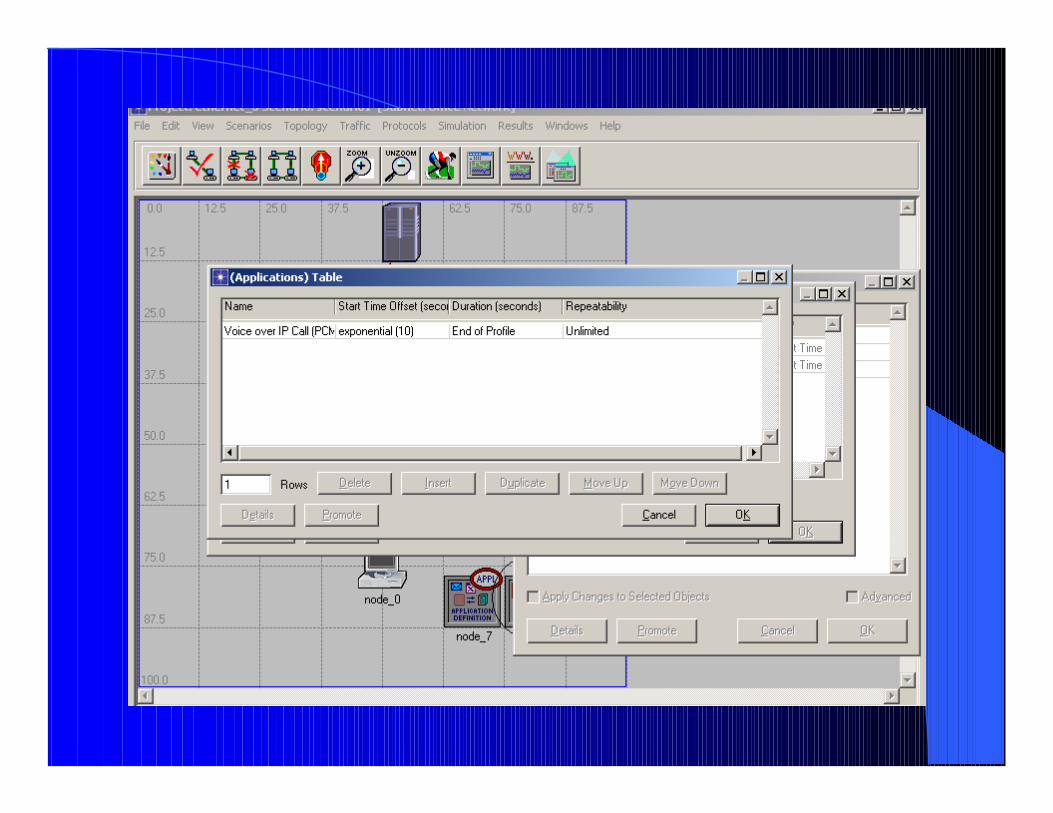
Profile Configuration Cont…Profile Configuration Cont…
1) Click on applications for each Profile name, and choose edit
2) Enter the values for Software Development as shown in the following slide

StatisticStatisticss
Profile Configuration Cont..Profile Configuration Cont..
Now do the same for profile telecom

Adding TrafficAdding Traffic
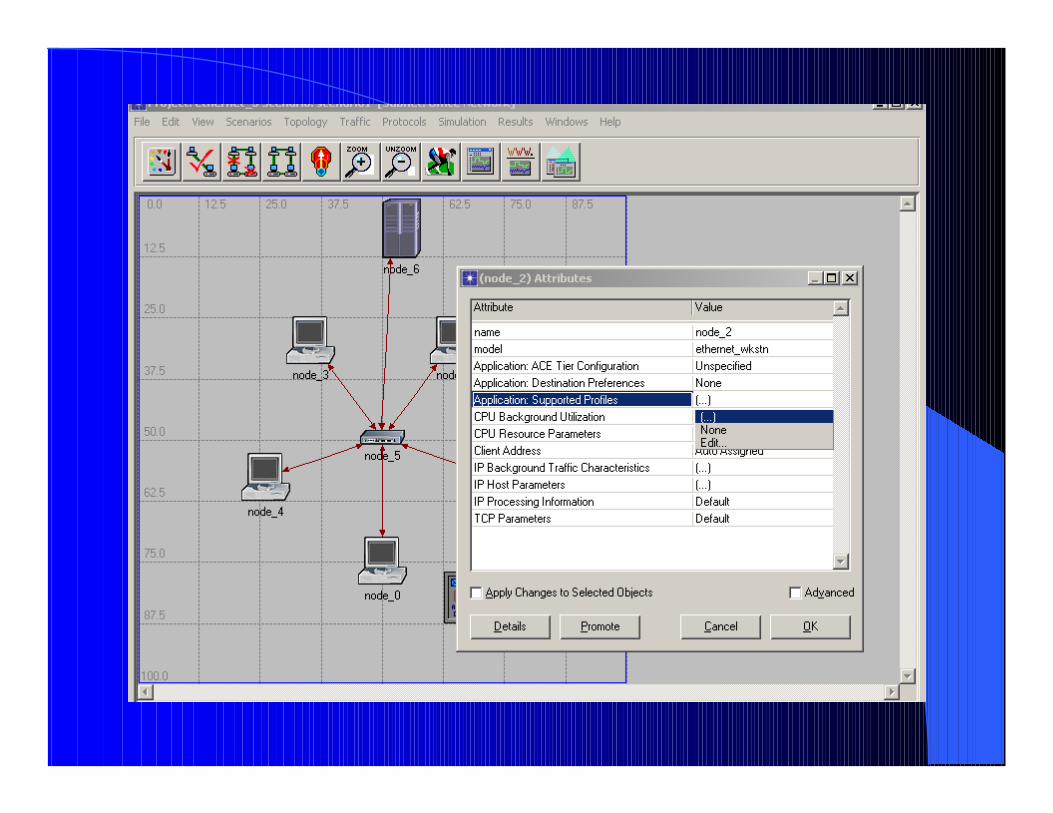
1) Now that you are done with Application and Profile, next you need to add traffic in each work station
1) Select node_12) Edit attribute3) Do this for all the workstations
2) It should look like the picture in the next page
Adding TrafficAdding Traffic
Then enter 2 for the number of row. It should be on the the bottom left side. Then click on each Profile name and choose Software Development for row 1 and Telecom row row 2. It should look similar to the next page. Hit ok for everything.

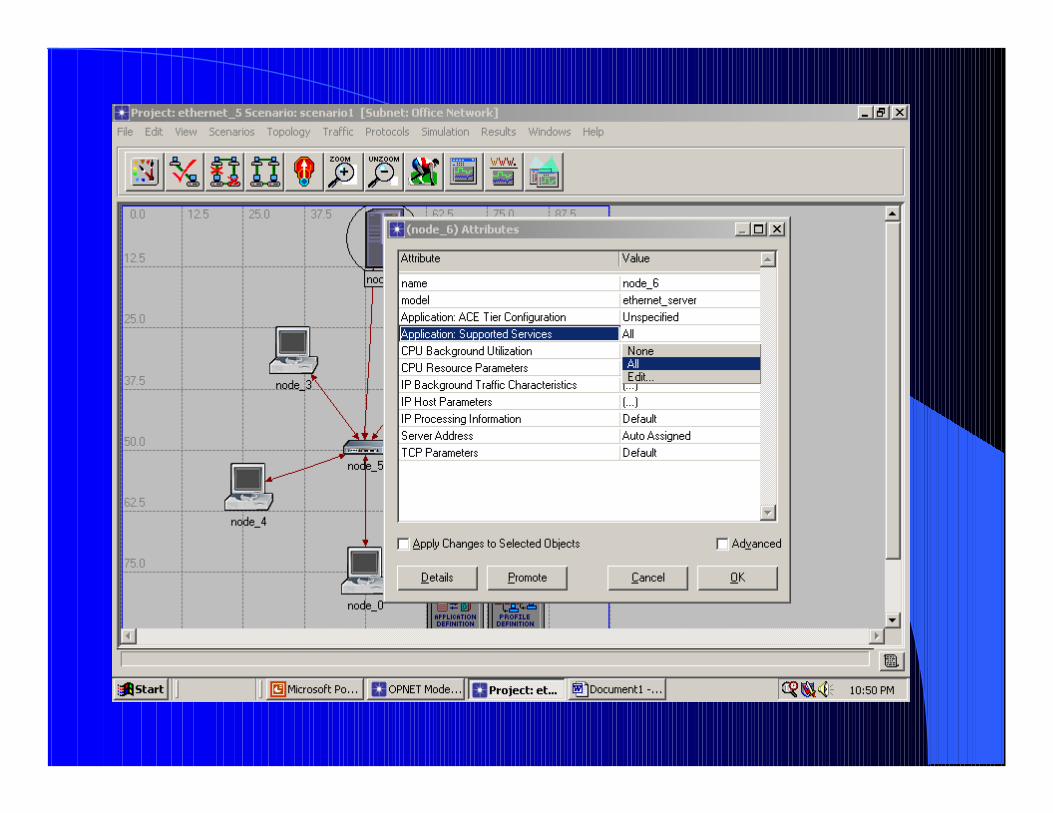
Connect the ServerConnect the Server
You also need to make it connected with the server also. Right click on the server then choose edit attributes. On the the attribute field look for Application: Supported Service and click “ALL”for the value field. It should look like this

StatisticsStatistics
1) Now that you added the traffic, you are ready to collect some statistics
2) There are two ways to collect statistics1) You can collect statistics from individual
nodes in your network (object statistics) 2) From the entire network as a whole (global
statistics)
Server StatisticsServer Statistics
1) To collect statistics related to the server’s load:
1) Right-click on the server node and select Choose Individual Statistics from the server’s Object pop-up menu
2) Click the plus sign next to Ethernet in the Choose Results dialog box.

Server StatisticsServer Statistics
1) Click the check box next to Load (bits/sec) to turn collection on for that statistic
2) Click OK to dismiss the dialog box

Network StatisticsNetwork Statistics
1) To collect statistics related to the Ethernet Hub:
1) Right-click on the hub node and select Choose Individual Statistics from the hub’s Object pop-up menu
2) Click the plus sign next to Node Statistic in the Choose Results dialog box
3) Then click the plus sign next to Ethernet in the Choose Results dialog box
Network StatisticsNetwork Statistics
1) Click the check box next to Collision count and Utilization
2) Click OK to dismiss the dialog box
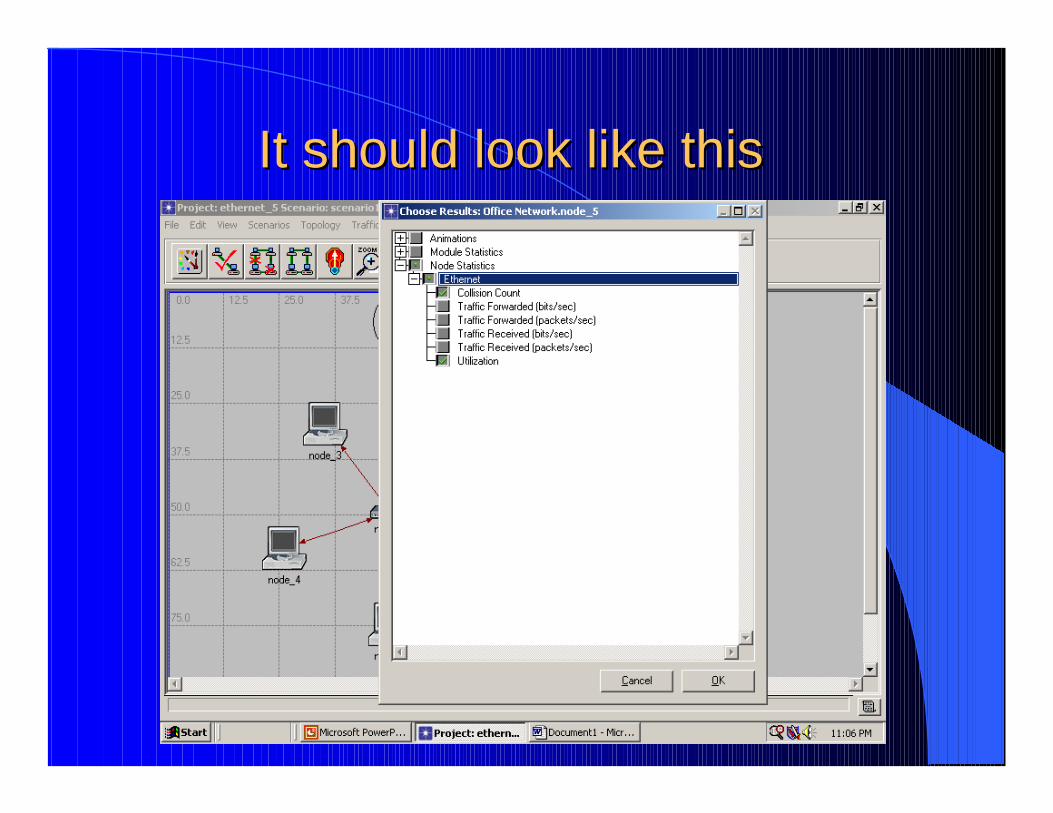
It should look like thisIt should look like this

Global StatisticsGlobal Statistics
1) Global statistics can be used to gather information about the network as a whole. For example, you can find out the delay for the entire network by collecting the global Delay statistic:
1) Right-click in the project workspace and select Choose Individual Statistics from the Workspace pop-up menu
2) Click the plus sign next to Global Statistics in the Choose Results dialog box

Global StatisticsGlobal Statistics
3) Click the plus sign next to Ethernet4) Check the box next to Delay (sec) to turn on collection5) Click OK to dismiss the Choose Results dialog box
Hit Save to save the projectNote: If you can’t save your project, go to Edit/Preferences,
find the model_dirs row and click on the Value field. In the new pop-up window, make sure the first directory of the list is a place where the tool can save your project (You can create a new directory on C:\your_name and put that directory as the first entry in the list)

It should look like thisIt should look like this
Run the SimulationRun the Simulation
Now that you have specified the network, traffic, statistics to collect and saved the project, you are ready to run your simulation. To run a simulation:
1) From the Simulation menu, choose Configure Simulation. Note: You can also open the Configure Simulation dialog box by clicking on the Configure Simulation action button.
2) Type 10 min in the Duration
Run the SimulationRun the Simulation
3) Click the Run button to begin the simulation. While the simulation runs, a window appears showing the simulation’s progress. The simulation takes 1 minute to run on a 200MHz Pentium. Your time will vary depending on your computer. After 1,000,000 events, the Simulation Sequence dialog box shows an estimated time to completion and a progress bar
4) When the simulation is finished, click the Close button in the Simulation Sequence dialog box

Simulation ResultsSimulation Results
Once your simulation has finished executing, you will want to see the information collected for each statistic
You can view results graphically in the Project Editor by selecting View Results from the Workspace pop-up menu.
View ResultsView Results
To view the server Ethernet load for the simulation:1) Right-click on the server node choose View Results from
the server’s Object pop-up menu. The node’s View Results dialog box opens.
2) Click on the arrow next to Ethernet under Office network.3) Click on the box next to Load (bits/sec) to indicate that you
want to view that result.4) Click the Show button in the View Results dialog box. The
graph of the server load appears in the Project Editor
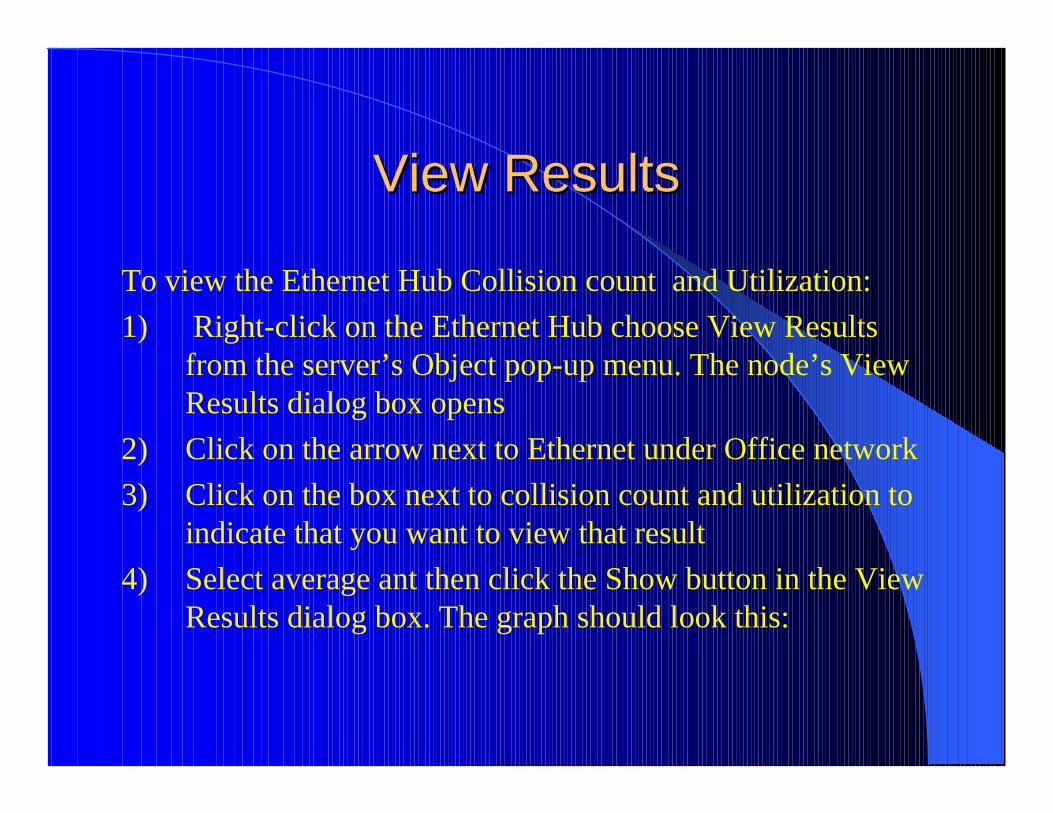
View ResultsView Results
To view the Ethernet Hub Collision count and Utilization:1) Right-click on the Ethernet Hub choose View Results
from the server’s Object pop-up menu. The node’s View Results dialog box opens
2) Click on the arrow next to Ethernet under Office network3) Click on the box next to collision count and utilization to
indicate that you want to view that result4) Select average ant then click the Show button in the View
Results dialog box. The graph should look this:

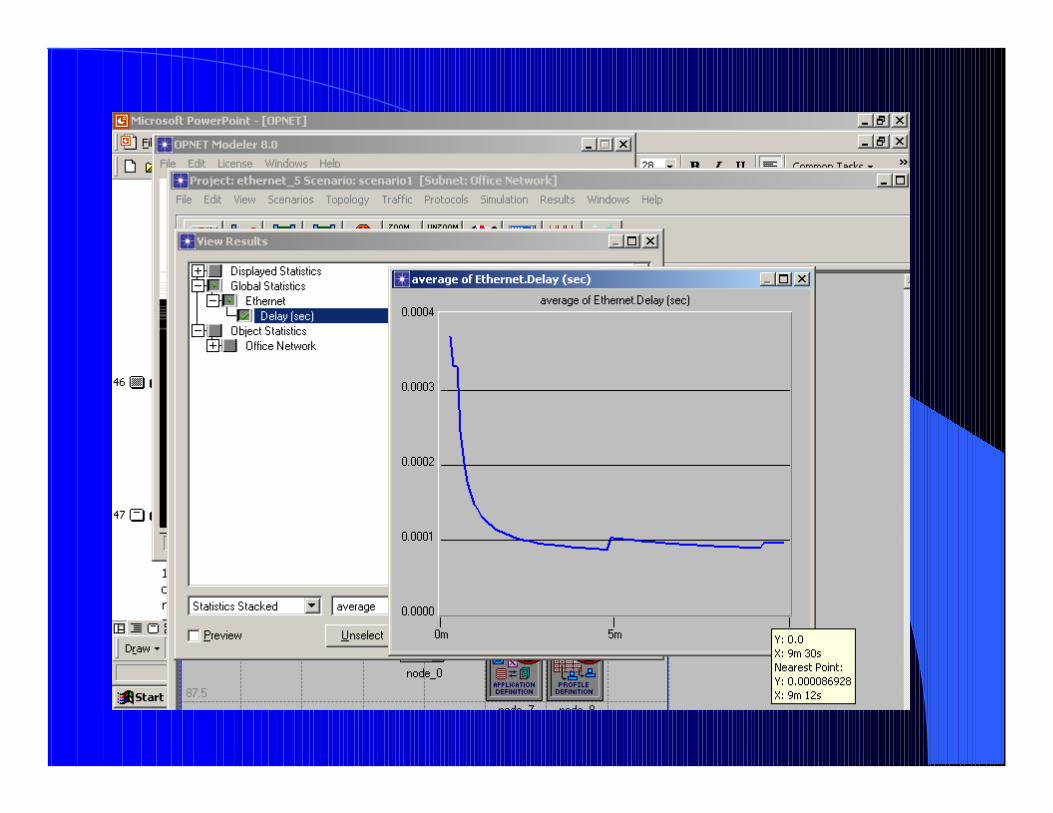
View ResultsView Results
When you are finished viewing the Ethernet Hub graph, close this dialog box and the View Results dialog box. You also should look at the Global Ethernet Delay on the network. To view this statistic:
1) Right-click in the workspace, then select View Results from the pop-up menu
2) Check the box next to Global Statistics, Ethernet, Delay, select average then click the Show button to view the average delay of the packets on the Ethernet network as a whole
AnimationAnimation
View animation:To view animation, click on Simulation and select Record Animation For Subnet. You have to do this before you run the program

AnimationAnimation
AnimationAnimation
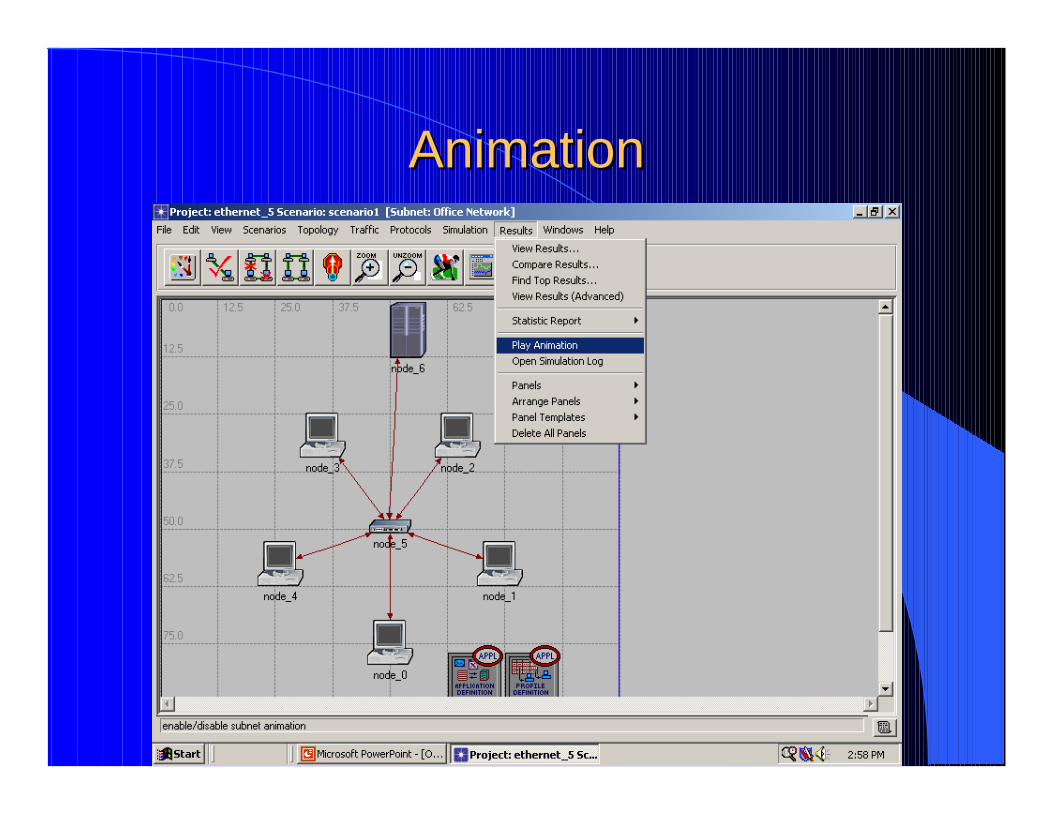
Then run the simulation. After the simulation finishes, click on Result and choose Play Animation.
AnimationAnimation

DebuggingDebugging
1) A good debugging tool is the Simulation Log. You can check for warnings and errors
2) Click on Result3) Then Click on Open Simulation Log


![Simulating Computer Networks with Opnet - Faculty …fcsiba.wikispaces.com/file/view/HW8-opnet-tutorial[1].pdfObjectives 1) This tutorial focuses on the use of Opnet’s Project Editor](https://static.fdocuments.in/doc/165x107/5af144b27f8b9aa9168ede9f/simulating-computer-networks-with-opnet-faculty-1pdfobjectives-1-this-tutorial.jpg)