Opioid Overdose and North Carolina’s Public Health … · Public Health and Prevention Strategies...
30
Opioid Overdose and North Carolina’s Public Health and Prevention Strategies October 20, 2016 Scott K. Proescholdbell, MPH
Transcript of Opioid Overdose and North Carolina’s Public Health … · Public Health and Prevention Strategies...

Opioid Overdose and North Carolina’s Public Health and Prevention Strategies
October 20, 2016
Scott K. Proescholdbell, MPH

2
*Per 100,00, age-adjusted to the 2000 U.S. Standard Populationα - Transition from ICD-8 to ICD-9β – Transition from ICD-9 to ICD-10
National Vital Statistics System, http://wonder.cdc.gov, multiple cause datasetSource: Death files, 1968-2014, CDC WONDERAnalysis by Injury Epidemiology and Surveillance Unit
Death Rates* for Three Selected Causes of Injury, North Carolina, 1968-2014
0.0
5.0
10.0
15.0
20.0
25.0
30.0
35.0
40.0
1968 1970 1972 1974 1976 1978 1980 1982 1984 1986 1988 1990 1992 1994 1996 1998 2000 2002 2004 2006 2008 2010 2012 2014
Death
s p
er
100,0
00 p
op
ula
tio
n
Year
Motor Vehicle Traffic (Unintentional)
Drug Poisoning (All Intents)
Firearm (All Intents)
α
1989 – Pain added as 5th Vital Sign

3
Source: N.C. State Center for Health Statistics, Vital Statistics-Deaths, 1999-2015 (*2015 PROVISIONAL) Analysis by Injury Epidemiology and Surveillance UnitMedication or drug overdose: X40-X44, X60-X64, Y10-Y14, X85
Medication or Drug Overdose Deaths by IntentNorth Carolina Residents, 1999-2015*
1483
1255
189
390
200
400
600
800
1,000
1,200
1,400
1,600
1999 2000 2001 2002 2003 2004 2005 2006 2007 2008 2009 2010 2011 2012 2013 2014 2015
Num
ber
of death
s
All intents
Unintentional
Self-inflicted
Undetermined
Assault
350% increase in deaths since 1999
1,000+ Deaths per year
20,000+ Emergency Dept. visits per year

4
Source: N.C. State Center for Health Statistics, Vital Statistics-Deaths, 1999-2015*2015 Provisional Data (August 2016)Analysis by Injury Epidemiology and Surveillance Unit
Substances Contributing to Medication or Drug Overdose DeathsNorth Carolina Residents, 1999-2015*
738
291
363
0
100
200
300
400
500
600
700
800
900
Num
ber
of death
s
Prescription Opioid
Cocaine
Heroin
884% increase in Heroin
deaths since 2010
Don’t forget
about cocaine

5
Heroin DeathsNorth Carolina Residents, 2008-2015
Source: N.C. State Center for Health Statistics, Vital Statistics-Deaths, 2008- 2015Analysis by Injury Epidemiology and Surveillance Unit
6172
37
76
147
179
246
364
0
50
100
150
200
250
300
350
400
2008 2009 2010 2011 2012 2013 2014 2015
Num
be
r o
f d
ea
ths 565% increase from
2010 to 2014
884% increase from
2010 to 2015

6
Unintentional/Undetermined Prescription Opioid Overdose Deaths Rates & Outpatient Prescriptions Dispensed for Opioids Rates
North Carolina Residents, 2011-2015
7
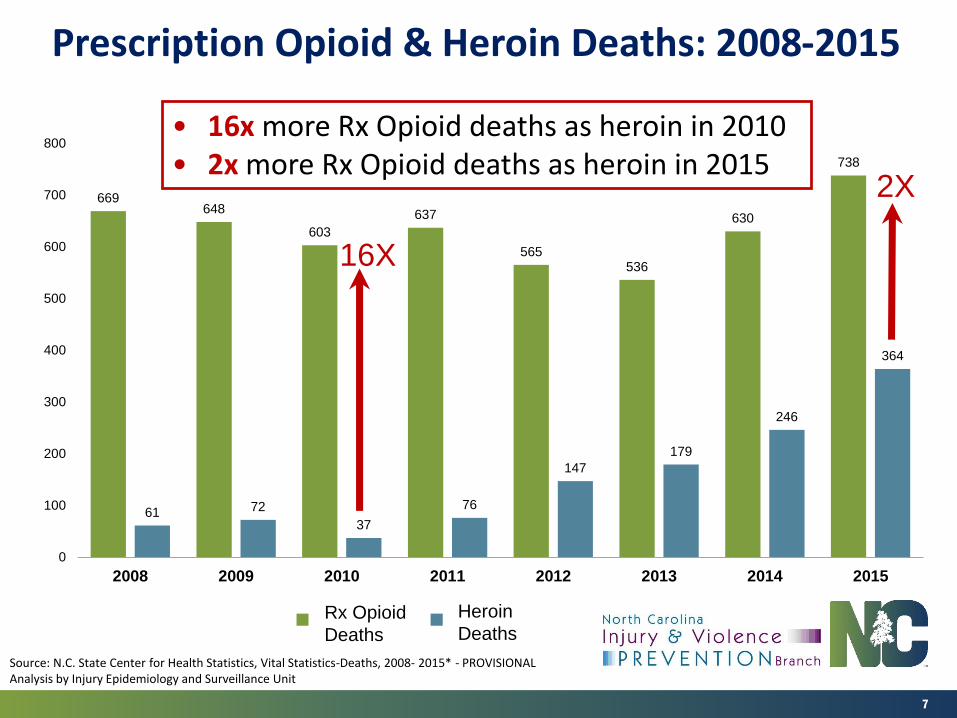
Prescription Opioid & Heroin Deaths: 2008-2015
Source: N.C. State Center for Health Statistics, Vital Statistics-Deaths, 2008- 2015* - PROVISIONALAnalysis by Injury Epidemiology and Surveillance Unit
• 16x more Rx Opioid deaths as heroin in 2010• 2x more Rx Opioid deaths as heroin in 2015
669648
603
637
565536
630
738
61 72
37
76
147
179
246
364
0
100
200
300
400
500
600
700
800
2008 2009 2010 2011 2012 2013 2014 2015
Series1 Series2Rx Opioid
Deaths
Heroin
Deaths
16X
2X

8
Drug Type Trends from 1999-2015 by drug type
Source: N.C. State Center for Health Statistics, Vital Statistics-Deaths, 2008- 2015Unintentional medication/drug (X40-X44) with specific T-codes by drug typeAny Mention. Groups are not mutually exclusive. People are in multiple groups.Analysis by Injury Epidemiology and Surveillance Unit
0
50
100
150
200
250
300
350
400
450
500
Heroin Cocaine Methadone Other Opioids Other Synthetic Narcotics
1999 2000 2001 2002 2003 2004 2005 2006 2007 2008 2009 2010 2011 2012 2013 2014 2015
• 5 Drug Types over 17 years-ANY MENTION

9
Drug Type Trends from 1999-2015 by drug type
Source: N.C. State Center for Health Statistics, Vital Statistics-Deaths, 2008- 2015Unintentional medication/drug (X40-X44) with specific T-codes by drug typeAny Mention. Groups are not mutually exclusive. People are in multiple groups.Analysis by Injury Epidemiology and Surveillance Unit
0
50
100
150
200
250
300
350
400
450
500
Heroin Cocaine Methadone Other Opioids Other Synthetic Narcotics
1999 2000 2001 2002 2003 2004 2005 2006 2007 2008 2009 2010 2011 2012 2013 2014 2015
HEROIN COCAINE METHADONE
OTHER
OPIOIDS SYNTHETIC
NARCOTICS

10
Drug Type Trends from 1999-2015 by year
Source: N.C. State Center for Health Statistics, Vital Statistics-Deaths, 2008- 2015Unintentional medication/drug (X40-X44) with specific T-codes by drug typeAny Mention. Groups are not mutually exclusive. People are in multiple groups.Analysis by Injury Epidemiology and Surveillance Unit
0
50
100
150
200
250
300
350
400
450
500
1999 2000 2001 2002 2003 2004 2005 2006 2007 2008 2009 2010 2011 2012 2013 2014 2015
Heroin Cocaine Methadone Other Opioids Other Synthetic Narcotics
Since 2005 or so, the overall levels are stable but types of drugs differ. Overall increasing.

11
Drug Type Trends by select years
0
50
100
150
200
250
300
350
400
450
500
1999 2005 2010 2015
Heroin Cocaine Methadone Other Opioids Other Synthetic Narcotics
Source: N.C. State Center for Health Statistics, Vital Statistics-Deaths, 2008- 2015Unintentional medication/drug (X40-X44) with specific T-codes by drug typeAny Mention. Groups are not mutually exclusive. People are in multiple groups.Analysis by Injury Epidemiology and Surveillance Unit
Looking at 4 distinct years you can see the significant changes over the past ~15 years

12
Percent Non-Medical Use of Pain Relievers During Past Year among Adolescents and Young Adults
North Carolina, 2004-2014
7.577.92
7.26.68
7.02 7.1 6.896.28
5.66 5.434.86
10.5710.92
12.23 12.4111.84
12.41
10.58
8.96
10.2410.76
8.87
2004 2005 2006 2007 2008 2009 2010 2011 2012 2013 2014
PE
RC
EN
T
Age 12-17 Age 18-25
Source: National Survey on Drug Use and Health (NSDUH), SAMHSAAnalysis: Injury Epidemiology and Surveillance Unit

13
Self-reported Lifetime Use of Drugs among High School Students
North Carolina HS Students, 2013 & 2015
17.2
2.1
8.3
4.9
17.9
3.5
8.1
3.5
0
2
4
6
8
10
12
14
16
18
20
Prescription drugs Steroids Sniff glue Cocaine/Crack
Pe
rce
nt o
f S
tud
en
ts
Series1 Series22013 2015
Source: NC Youth Risk Behavioral Survey (YRBS), 2013-2015Analysis: Injury Epidemiology and Surveillance Unit
for Nonmedical Purposes

14
Self-reported Lifetime Use of Prescription Drugs Without Prescription by Grade
14.3
22.523.9 23.6
18.9
20.2
19
24.8
13.1 13.6
23.1
19.8
14.1
18.8
20.419.1
0
5
10
15
20
25
30
9th 10th 11th 12th
Pe
rce
nt o
f S
tud
en
ts
2009 2011 2013 2015
Source: NC Youth Risk Behavioral Survey (YRBS), 2009-2015Analysis: Injury Epidemiology and Surveillance Unit

15
Source: N.C. State Center for Health Statistics, Hospital Discharge Data, 2004-2014Analysis: Injury Epidemiology and Surveillance Unit
Rate of Hospitalizations Associated with Drug Withdrawal in NewbornsNorth Carolina Residents, 2004-2014
830% increase from 2004 to 2014
*2014 data structure changed to include up to 95 diagnosis codes. It is unclear the overall impact of this change.
16
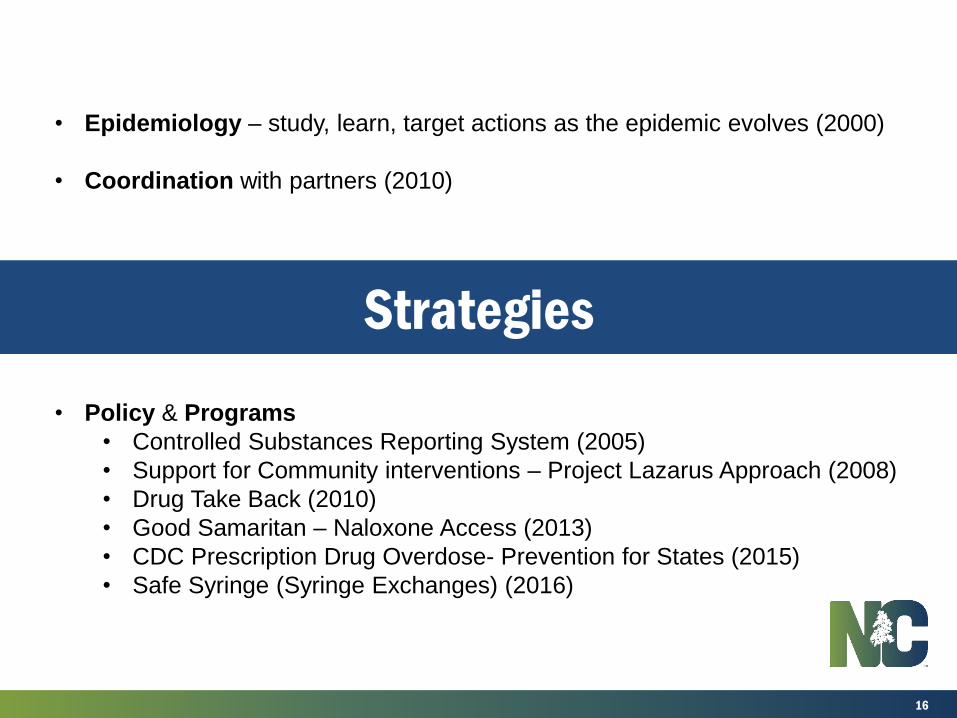
Strategies
• Policy & Programs
• Controlled Substances Reporting System (2005)
• Support for Community interventions – Project Lazarus Approach (2008)
• Drug Take Back (2010)
• Good Samaritan – Naloxone Access (2013)
• CDC Prescription Drug Overdose- Prevention for States (2015)
• Safe Syringe (Syringe Exchanges) (2016)
• Epidemiology – study, learn, target actions as the epidemic evolves (2000)
• Coordination with partners (2010)
17
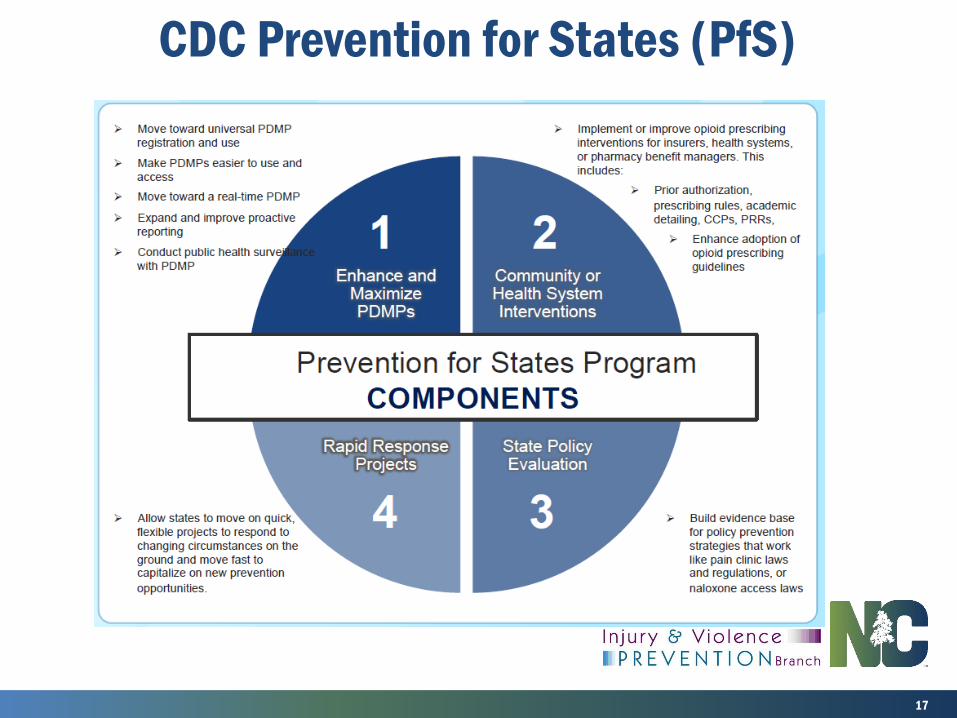
CDC Prevention for States (PfS)

Drug Take Back in North CarolinaSince 2010
• Collected 53 million pills at 1,600 events• 150+ Permanent Take-Back Locations
NC Medical Journal Article Jan 2016http://www.ncmedicaljournal.com/content/77/1/59.full
http://www.ncdoi.com/osfm/safekids/Operation%20Medicine%20Drop.aspx?sec=omd
Largest Drug Take Back Program in the Country, National Model

Since August 1, 2013• 36,159 overdose rescue kits distributed
4,639 confirmed overdose reversals
2013 - North Carolina’s Good Samaritan/Naloxone Access Law
Reached a Tipping Point in 2015:
More overdose reversals than overdose deaths.
http://www.nchrc.org/programs-and-services

20
Number of Opioid Overdose Reversals with Naloxone Reported by
the North Carolina Harm Reduction Coalition by County 8/1/2013 - 9/30/2016 (4,639 total reversals reported)
16 reversals in an unknown location in North Carolina and 64 reversals using NCHRC kits in other states reported to NCHRC.
Source: North Carolina Harm Reduction Coalition, October 2016Analysis: Injury Epidemiology and Surveillance Unit
4,639 total reversals reported

21
Source: North Carolina Harm Reduction Coalition, October 2016Analysis: Injury Epidemiology and Surveillance Unit
Counties with Law Enforcement Carrying NaloxoneAs of September 30, 2016 (57 Counties, 127 Agencies)
Update – 127 Agenciesmore added every month

22
Source: North Carolina Harm Reduction Coalition, October 2016Analysis: Injury Epidemiology and Surveillance Unit
Number of Opioid Overdose Reversals with Naloxone Reported by
NC Law Enforcement by Date1/1/2015 - 9/30/2016 (238 total reversals reported)
238 reversals reported
23
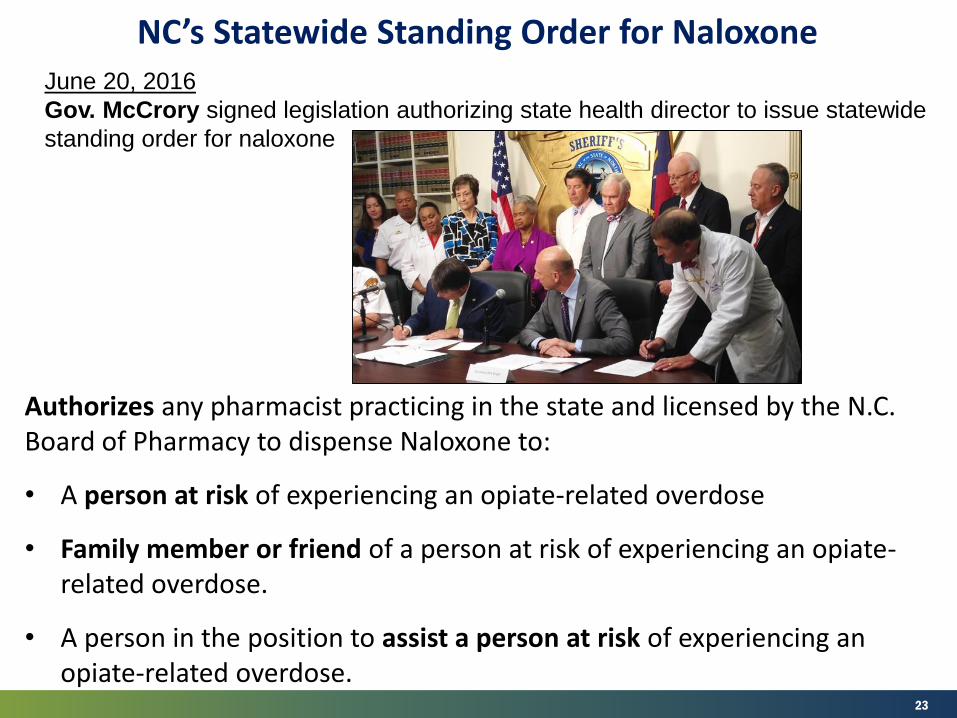
Authorizes any pharmacist practicing in the state and licensed by the N.C. Board of Pharmacy to dispense Naloxone to:
• A person at risk of experiencing an opiate-related overdose
• Family member or friend of a person at risk of experiencing an opiate-related overdose.
• A person in the position to assist a person at risk of experiencing an opiate-related overdose.
NC’s Statewide Standing Order for Naloxone June 20, 2016
Gov. McCrory signed legislation authorizing state health director to issue statewide
standing order for naloxone
24
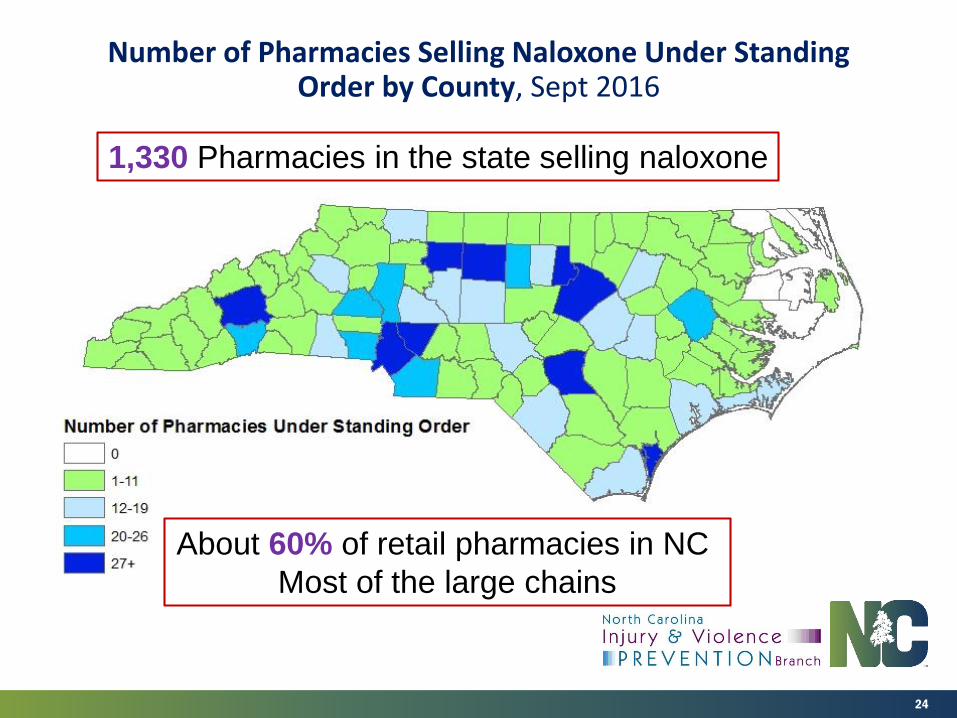
Number of Pharmacies Selling Naloxone Under Standing Order by County, Sept 2016
1,330 Pharmacies in the state selling naloxone
About 60% of retail pharmacies in NC
Most of the large chains

25
www.NaloxoneSaves.Org
A resource site for Naloxone in NC

• July 11, 2016 - Legalized in NC
• Any governmental or nongovernmental organization “that promotes scientifically proven ways of mitigating health risks associated with drug use and other high risk behaviors” can start a SEP
• Legal Protections“No employee, volunteer or participant of the syringe exchange can be charged with possession of syringes or other injection supplies, or with residual amounts of controlled substances in them, obtained from or returned to a syringe exchange”
26
NC Syringe Exchange Programs (SEP)
27
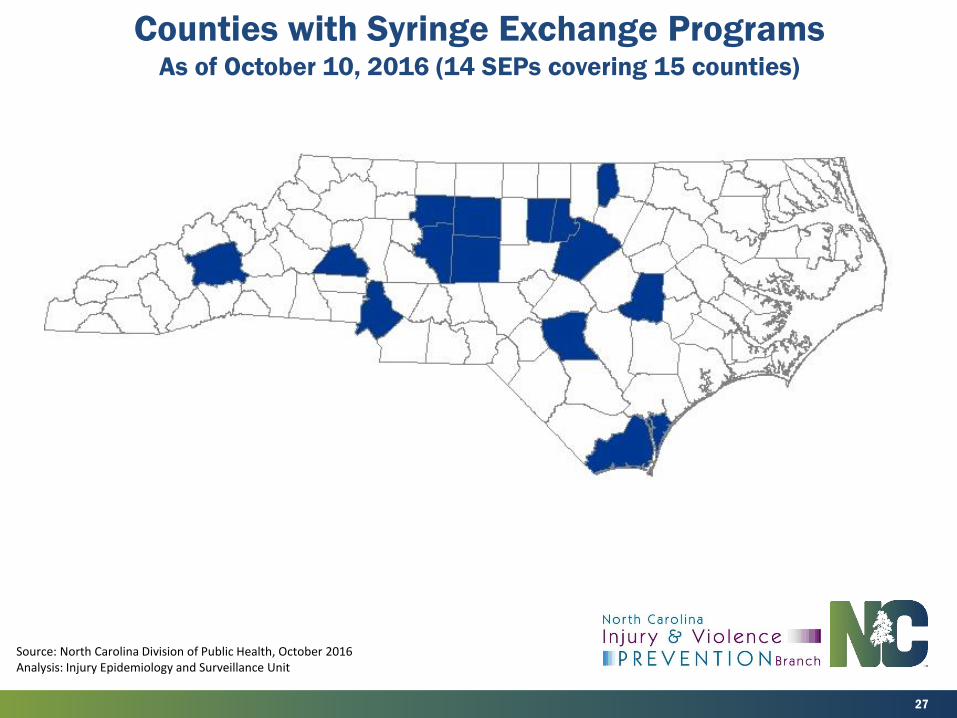
Source: North Carolina Division of Public Health, October 2016Analysis: Injury Epidemiology and Surveillance Unit
Counties with Syringe Exchange ProgramsAs of October 10, 2016 (14 SEPs covering 15 counties)

28
September 21, 2016
Syringe Exchange
Programs in operation
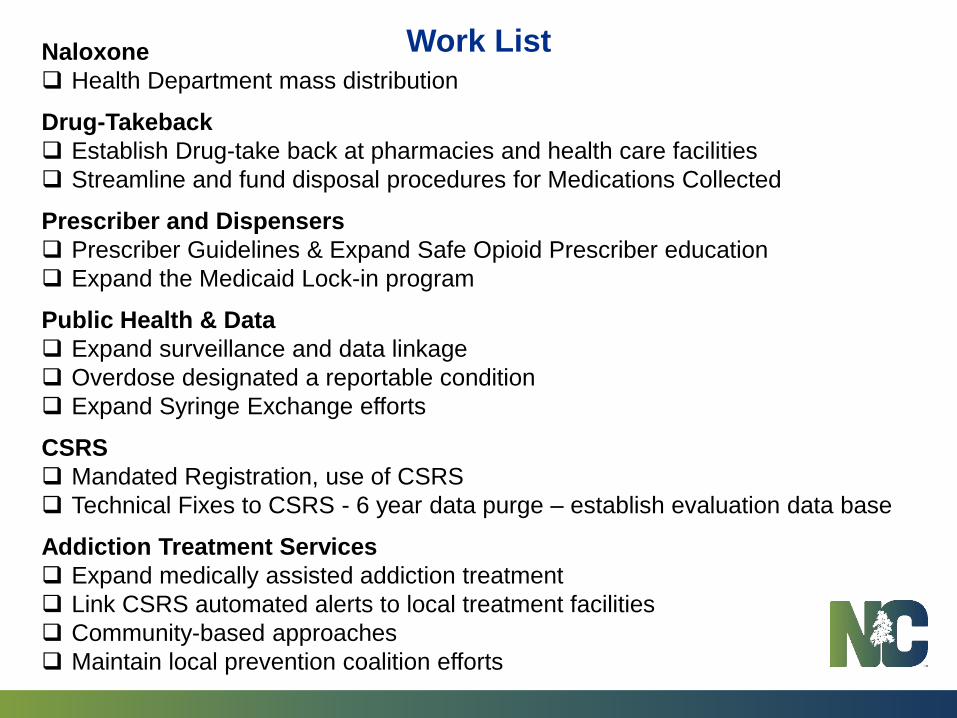
Work List Naloxone
Health Department mass distribution
Drug-Takeback
Establish Drug-take back at pharmacies and health care facilities
Streamline and fund disposal procedures for Medications Collected
Prescriber and Dispensers
Prescriber Guidelines & Expand Safe Opioid Prescriber education
Expand the Medicaid Lock-in program
Public Health & Data
Expand surveillance and data linkage
Overdose designated a reportable condition
Expand Syringe Exchange efforts
CSRS
Mandated Registration, use of CSRS
Technical Fixes to CSRS - 6 year data purge – establish evaluation data base
Addiction Treatment Services
Expand medically assisted addiction treatment
Link CSRS automated alerts to local treatment facilities
Community-based approaches
Maintain local prevention coalition efforts

30
Scott Proescholdbell, MPHInjury and Violence Prevention Branch
NC Division of Public Health
www.injuryfreenc.ncdhhs.gov
¿Preguntas?