OPG Creating a BPM Roadmap, release 3 - Oracle · 1–8 Capabilities Heat Map ... Creating a BPM...
44
Oracle® Practitioner Guide Creating a BPM Roadmap Release 3.0 E17113-03 September 2010
Transcript of OPG Creating a BPM Roadmap, release 3 - Oracle · 1–8 Capabilities Heat Map ... Creating a BPM...

Oracle® Practitioner GuideCreating a BPM Roadmap
Release 3.0
E17113-03
September 2010

Creating a BPM Roadmap, Release 3.0
E17113-03
Copyright © 2010, Oracle and/or its affiliates. All rights reserved.
Primary Author: Mark Wilkins
Contributing Author: Cliff Booth, Bob Hensle, Dave Chappelle, Jeff McDaniels, Steve Bennett
Contributor:
Warranty Disclaimer
THIS DOCUMENT AND ALL INFORMATION PROVIDED HEREIN (THE "INFORMATION") IS PROVIDED ON AN "AS IS" BASIS AND FOR GENERAL INFORMATION PURPOSES ONLY. ORACLE EXPRESSLY DISCLAIMS ALL WARRANTIES OF ANY KIND, WHETHER EXPRESS OR IMPLIED, INCLUDING, BUT NOT LIMITED TO, THE IMPLIED WARRANTIES OF MERCHANTABILITY, FITNESS FOR A PARTICULAR PURPOSE AND NON-INFRINGEMENT. ORACLE MAKES NO WARRANTY THAT THE INFORMATION IS ERROR-FREE, ACCURATE OR RELIABLE. ORACLE RESERVES THE RIGHT TO MAKE CHANGES OR UPDATES AT ANY TIME WITHOUT NOTICE.
As individual requirements are dependent upon a number of factors and may vary significantly, you should perform your own tests and evaluations when making technology infrastructure decisions. This document is not part of your license agreement nor can it be incorporated into any contractual agreement with Oracle Corporation or its affiliates. If you find any errors, please report them to us in writing.
Third Party Content, Products, and Services Disclaimer
This document may provide information on content, products, and services from third parties. Oracle is not responsible for and expressly disclaim all warranties of any kind with respect to third-party content, products, and services. Oracle will not be responsible for any loss, costs, or damages incurred due to your access to or use of third-party content, products, or services.
Limitation of Liability
IN NO EVENT SHALL ORACLE BE LIABLE FOR ANY DIRECT, INDIRECT, INCIDENTAL, SPECIAL OR CONSEQUENTIAL DAMAGES, OR DAMAGES FOR LOSS OF PROFITS, REVENUE, DATA OR USE, INCURRED BY YOU OR ANY THIRD PARTY, WHETHER IN AN ACTION IN CONTRACT OR TORT, ARISING FROM YOUR ACCESS TO, OR USE OF, THIS DOCUMENT OR THE INFORMATION.
Oracle is a registered trademark of Oracle Corporation and/or its affiliates. Other names may be trademarks of their respective owners.

iii
Contents
Send Us Your Comments ........................................................................................................................ ix
Preface ................................................................................................................................................................. xi
Purpose ......................................................................................................................................................... xiAudience....................................................................................................................................................... xiHow to Use This Document....................................................................................................................... xiDocument Structure ................................................................................................................................... xiiRelated Documents .................................................................................................................................... xiiAcknowledgements .................................................................................................................................. xiiiConventions ............................................................................................................................................... xiii
1 Creating a BPM Roadmap
1.1 BPM Roadmap Defined ............................................................................................................. 1-11.2 Roadmap Creation Process........................................................................................................ 1-31.2.1 Current State Assessment................................................................................................... 1-41.2.1.1 Overview ....................................................................................................................... 1-41.2.1.2 Details............................................................................................................................. 1-51.2.1.3 Output ............................................................................................................................ 1-71.2.2 Future Vision Definition ..................................................................................................... 1-71.2.2.1 Overview ....................................................................................................................... 1-71.2.2.2 Details............................................................................................................................. 1-71.2.2.3 Output ......................................................................................................................... 1-101.2.3 Gap Analysis ..................................................................................................................... 1-101.2.3.1 Overview .................................................................................................................... 1-101.2.3.2 Details.......................................................................................................................... 1-111.2.3.3 Output ......................................................................................................................... 1-151.2.4 Activity Selection and Scheduling ................................................................................. 1-151.2.4.1 Overview .................................................................................................................... 1-161.2.4.2 Details.......................................................................................................................... 1-161.2.4.3 Output ......................................................................................................................... 1-211.3 Closing Comments................................................................................................................... 1-21
A BPM Maturity Model
A.1 Capabilities ................................................................................................................................. A-1A.2 Domains ...................................................................................................................................... A-2

iv
A.3 Maturity....................................................................................................................................... A-3A.4 Adoption ..................................................................................................................................... A-3
B Business Process Selection Framework
B.1 Value Alignment ........................................................................................................................ B-1B.2 Parameters................................................................................................................................... B-2B.3 Weighting.................................................................................................................................... B-2B.4 Process Candidates .................................................................................................................... B-3B.5 Process Candidate Analysis ..................................................................................................... B-3

v

vi
List of Figures
1–1 BPM Roadmap Fundamental Relationships........................................................................... 1-21–2 Roadmap Creation Process........................................................................................................ 1-31–3 Current State Assessment Process............................................................................................ 1-41–4 Example BPM Vision Summary............................................................................................. 1-101–5 Gap Analysis Process .............................................................................................................. 1-111–6 Vision versus Current Maturity............................................................................................. 1-111–7 Capabilities Scatter Plot .......................................................................................................... 1-131–8 Capabilities Heat Map............................................................................................................. 1-141–9 Roadmap Scheduling Process ................................................................................................ 1-161–10 Increasing Maturity Over Time ............................................................................................. 1-171–11 Process Candidate Analysis ................................................................................................... 1-181–12 Roadmap Phase 1 Schedule.................................................................................................... 1-201–13 BPM Roadmap Subsequent Phases ....................................................................................... 1-21A–1 Business Process Analysis Capability ..................................................................................... A-1A–2 BPM Capability Domains ......................................................................................................... A-2B–1 Value Alignment Worksheet.................................................................................................... B-1B–2 Parameters Worksheet .............................................................................................................. B-2B–3 Weighting Worksheet................................................................................................................ B-3B–4 Process Candidate Worksheet.................................................................................................. B-3

vii
List of Tables
1–1 Typical Interview Participants .................................................................................................. 1-51–2 Typical Relevant Documents ................................................................................................... 1-61–3 BPM Goal Statements ................................................................................................................ 1-71–4 BPM Initiative Scope ................................................................................................................. 1-81–5 Example BPM Benefits .............................................................................................................. 1-81–6 Example BPM Guiding Principles........................................................................................... 1-91–7 Remediation per Domain....................................................................................................... 1-15

viii

ix
Send Us Your Comments
Creating a BPM Roadmap, Release 3.0
E17113-03
Oracle welcomes your comments and suggestions on the quality and usefulness of this publication. Your input is an important part of the information used for revision.
■ Did you find any errors?
■ Is the information clearly presented?
■ Do you need more information? If so, where?
■ Are the examples correct? Do you need more examples?
■ What features did you like most about this document?
If you find any errors or have any other suggestions for improvement, please indicate the title and part number of the documentation and the chapter, section, and page number (if available). You can send comments to us at [email protected].

x

xi
Preface
A BPM Roadmap provides the guidance to successfully adopt a business process oriented approach to building IT solutions to support the business. A well constructed BPM Roadmap will define projects that incrementally deliver BPM and provide business value at each step while minimizing the risks associated with BPM adoption. To build such a roadmap requires a solid understanding of the current situation with respect to BPM, a clear vision of what the BPM initiative needs to accomplish to be successful, and a structured approach to defining the iterations that comprise the path to successful BPM adoption.
PurposeEvery business is performing business process already, so this document is not about creating new business processes or even changing existing ones. The purpose of a BPM Roadmap is to establish the plan to develop an environment for automated management of business process. This BPM environment may indeed be used to refine, change (re-engineer), and even create new business processes, but the roadmap is simply a plan to provide a sustainable environment to enable these actions. In particular the BPM Roadmap must identify the risks and benefits of introducing BPM and lay the foundation to support a lifecycle of continuous business process improvement.
The purpose of this document is to describe a repeatable process for constructing a BPM Roadmap. The process described follows the standard four steps used in the IT industry to create roadmaps i.e. establish the current state, define the future vision, analyze the gap, and define the phases and schedule for the roadmap. It is the particulars within each phase of the overall process that provide the uniqueness and value of the approach described in this document.
AudienceThis document is intended for Program Managers and Enterprise Architects that want to understand how to build a fact-based BPM Roadmap. Some level of understanding of BPM is required since this document does not provide any BPM background or primer material.
How to Use This DocumentThis document is intended to be read from start to finish. However, the first two sections in Chapter 1 can be read standalone if the goal is only to get a high level understanding of the roadmap creation process.

xii
Document StructureThis document is organized according to the chronological sequence of activities associated with the construction of a roadmap. It describes the BPM Roadmap building process from start to finish. Specifically,
■ Chapter 1 describes the process for creating a BPM Roadmap.
■ Appendix A describes the BPM Maturity Model that is used to evaluate the current state and identify capabilities that are lacking or lagging.
■ Appendix B describes Business Process Selection Framework that is used to evaluate and select business processes for inclusion in the roadmap.
Related DocumentsIT Strategies from Oracle (ITSO) is a series of documentation and supporting collateral designed to enable organizations to develop an architecture-centric approach to enterprise-class IT initiatives. ITSO presents successful technology strategies and solution designs by defining universally adopted architecture concepts, principles, guidelines, standards, and patterns.
ITSO is made up of three primary elements:
■ Oracle Reference Architecture (ORA) defines a detailed and consistent architecture for developing and integrating solutions based on Oracle technologies. The reference architecture offers architecture principles and guidance based on recommendations from technical experts across Oracle. It covers a broad spectrum of concerns pertaining to technology architecture, including middleware, database, hardware, processes, and services.
■ Enterprise Technology Strategies (ETS) offer valuable guidance on the adoption of horizontal technologies for the enterprise. They explain how to successfully execute on a strategy by addressing concerns pertaining to architecture, technology, engineering, strategy, and governance. An organization can use this material to measure their maturity, develop their strategy, and achieve greater levels of adoption and success. In addition, each ETS extends the Oracle Reference Architecture by adding the unique capabilities and components provided by that particular technology. It offers a horizontal technology-based perspective of ORA.
■ Enterprise Solution Designs (ESD) are industry specific solution perspectives based on ORA. They define the high level business processes and functions, and

xiii
the software capabilities in an underlying technology infrastructure that are required to build enterprise-wide industry solutions. ESDs also map the relevant application and technology products against solutions to illustrate how capabilities in Oracle’s complete integrated stack can best meet the business, technical, and quality of service requirements within a particular industry.
This document is one of the series of documents that comprise the BPM Enterprise Technology Strategy. The BPM ETS includes reference architecture documents (ORA BPM Foundation and ORA BPM Infrastructure) as well as “how to” documents such as this guide to creating a BPM Roadmap.
Please consult the ITSO web site for a complete listing of ORA documents as well as other materials in the ITSO series.
Of particular relevance to this document are the following documents which provide additional information for the BPM Roadmap creation process:
■ BPM Maturity Model Capabilities - This spreadsheet contains the specific capabilities that are measured as part of the current state analysis. For each capability a description is provided for each level of maturity and adoption.
■ BPM Maturity Model Capabilities Scoring - This spreadsheet is used to score each capability on both maturity and adoption. The spreadsheet contains various graphical depictions of the scores.
■ Business Process Selection Framework - This spreadsheet is used to score business processes against realization benefits and realization inhibitors. The result of this evaluation is a Decision Basis Score for each business processes which can be used to select processes for process management automation.
AcknowledgementsThis document is based on a variety of materials that have been created by many different individuals and groups. Thanks to all who contributed. The purpose of this document is to catalogue the materials and describe the process for using the materials together to create a BPM Roadmap.
ConventionsThe following typeface conventions are used in this document:
“SOA Service” - In order to distinguish the “service” of Service-Oriented Architecture from the wide variety of “services” within the industry, the term “SOA Service” (although somewhat redundant) will be used throughout this document to make an explicitly distinction for services that were created as part of an SOA initiative; thus distinguishing SOA Services from other types of services such as Web Services, Java Messaging Service, telephone service, etc.
Convention Meaning
boldface text Boldface type in text indicates a term defined in the text, the ORA Master Glossary, or in both locations.
italic text Italics type in text indicates the name of a document or external reference.
underline text Underline text indicates a hypertext link.

xiv

1
Creating a BPM Roadmap 1-1
1Creating a BPM Roadmap
Unlike the SOA Roadmap planning approach that starts by assessing in-flight software engineering projects for their suitability to be included in the broader SOA program, BPM projects are instantiated by the need to automate a business process (or processes). The justification for a BPM project relies solely on the justification for process automation itself and is therefore, much simpler than that of a SOA project. A BPM project, referred to throughout this document, is merely a container for activities associated with business process management automation and the typical artifacts that accompany the engineering approach.
This chapter opens with a definition of what a BPM Roadmap is, followed by an overview of the complete roadmap creation process. Details for each phase in the roadmap creation process are provided in subsequent sections.
1.1 BPM Roadmap DefinedA BPM Roadmap provides guidance to the BPM initiative allowing multiple projects to progress in parallel yet remain coordinated and ultimately resulting in a common end goal that provides value greater than the sum of the individual projects. The BPM Roadmap consists of two fundamental parts:
■ Program-level efforts
■ A portfolio of projects that build specific business process solutions
The relationship for these three fundamental parts is illustrated in Figure 1–1.

BPM Roadmap Defined
1-2 Creating a BPM Roadmap
Figure 1–1 BPM Roadmap Fundamental Relationships
The program-level efforts create the assets that are leveraged across all the individual projects. Examples include the BPM Reference Architecture, governance policies and processes, standards, metrics, training and mentoring, business process engineering method, etc. The program level efforts provide and enforce the necessary consistency required to succeed at BPM adoption. A delicate balance needs to be struck between too little control and too much control. With too little control BPM adoption will be haphazard at best.
For most companies it is advantageous to separate the business process infrastructure deployment and configuration into a separate project from the business solution projects. This allows the infrastructure project to focus on creating a sound business process infrastructure that meets the needs of multiple business solution projects. There will likely be an infrastructure project for each phase of the BPM Roadmap to incrementally deploy the process infrastructure.
As we have stated already the business process to be managed by the BPM system typically already exists (creation of an entirely new process is an unusual case), so the activities, both human and system, already exist in some form. The challenge for a BPM project is how to integrate these activities. In many cases application functions (and human workflows within them) will be found in vertical applications, information in data silos with human tasks tying them together. In an ideal scenario a repository of SOA Services will be available for rapid and flexible integration. In cases of other integration strategies (e.g. EAI) more effort will be needed to identify and integrate application functions. Human worklists can be managed with portal interfaces and potentially integrated directly with the applications.
The initial procedure for placing a business process under the control of a BPM system however, should not involve significant development of new functions or system replacement of human tasks. Instead the effort should focus on identifying the human and system functions that make up the steps of the business process and assessing their integration needs. This assessment of integration effort should performed at the

Roadmap Creation Process
Creating a BPM Roadmap 1-3
earliest possible stage of planning in order to (1) support the assessment of the process suitability for automation and (2) avoid scope creep when engineers are left to make integration decisions later in the engineering process.
Generally, the most effective planning horizon for a BPM Roadmap is 2-3 years. This could be longer or shorter depending on the planning cycles for each organization. The initial phases (e.g. first six months) of the roadmap will contain much greater detail than the later phases. This is appropriate and by design. The BPM journey is a journey of discovery, incremental improvement, and regular course corrections. The BPM Roadmap should be regularly reviewed and updated. The business never stays static, so do not expect the BPM Roadmap to remain static either.
1.2 Roadmap Creation ProcessAs depicted in Figure 1–2, there are four main phases in the roadmap creation process: Current State Assessment, Future Vision Definition, Gap Analysis, and Activity Selection & Scheduling.
Figure 1–2 Roadmap Creation Process
The current state is measured based on the Oracle BPM Maturity Model. Using this approach to assess the current state of the BPM initiative provides a consistent measurement scale while keeping the effort focused on capabilities important to BPM success and avoiding the scope creep that frequently undermines current state evaluation efforts.
The Future Vision Definition phase is used to establish the high-level goal and reason for the BPM program. While a fully fleshed out future vision is needed eventually, the initial roadmap creation only requires the high-level vision since the development of the detailed vision can itself be part of the BPM Roadmap. Of course, if the current state of the BPM initiative includes a more detailed future vision, that vision can be leveraged when creating the roadmap.
The Gap Analysis phase evaluates the gap between the current state and the future vision for each of the capabilities. Generally the capabilities exhibiting the largest gap are given highest priority during the roadmap creation phase. However, part of the gap analysis also includes evaluating the relative importance for each of the capabilities for this particular organization. Size, organizational structure, existing

Roadmap Creation Process
1-4 Creating a BPM Roadmap
assets, funding priorities, even politics can significantly impact the relative importance of capabilities.
The final phase is the Activity Selection & Scheduling phase. This phase uses the output from the Gap Analysis phase to create a logical ordering of work to be done. Emphasis is placed on the program-level efforts for the initial phases to establish the assets and processes used across projects. Candidate business processes are evaluated for BPM applicability and are then prioritized based on that evaluation. The project portfolio is derived from the needs of the business processes selected for automation.
1.2.1 Current State AssessmentAttempting to capture a full, detailed description of the current state of an IT environment of a large company can lead to analysis paralysis. To avoid this problem, the method described here uses a focused scope and a pragmatic, time-boxed approach. The underlying goal is not to fully capture an IT environment current state; rather it is to evaluate the current state relative to the capabilities that are required to successfully adopt BPM.
1.2.1.1 OverviewThe current state assessment is based on the Oracle BPM Maturity Model. (See Appendix A for a description of the BPM Maturity Model.) The BPM Maturity Model includes sixty capabilities that capture the best practices that Oracle has collected over many years working with a wide variety of companies. These capabilities provide the detail necessary to accurately measure and guide the progress of a BPM initiative. Focusing the current state assessment on these specific capabilities ensures a focused scope for the assessment.
Further, the current state assessment should be tightly time-boxed to ensure timely completion of this phase. The size and complexity of an organization determines the actual amount of time that must be allocated to the assessment. Nominally, two weeks is the amount of time is required.
An overview of the current state assessment process is shown below:
Figure 1–3 Current State Assessment Process

Roadmap Creation Process
Creating a BPM Roadmap 1-5
1.2.1.2 DetailsThis section details the steps defined in the previous section.
1.2.1.2.1 Define Scope
Before beginning the actual assessment, it is vital that the scope of the assessment is determined and that all involved parties agree to the defined scope. For example, the scope could be limited to a single division or line-of-business within a larger enterprise. Or the scope could be limited to a single geographic location. The scope defines both the scope of the assessment and, ultimately, the scope of the roadmap.
1.2.1.2.2 Identify Interview Participants
Once the scope has been determined, the participants in the assessment can be identified. The participants are chosen to ensure that all capabilities within the BPM Maturity Model can be accurately scored. The following table describes the typical areas of interest and interview participants:
1.2.1.2.3 Determine Interview Schedule
Once the interview participants have been identified, the next step is to create a schedule for when each participant will be interviewed. The goal is to limit the length of the assessment phase by creating a compacted schedule. It may be necessary to delay the start of the assessment to get times on the participants' schedules that fit into
Table 1–1 Typical Interview Participants
Area of Interest Typical Participant
Business Objectives VP of Business Unit(s)
LOB IT
IT Objectives CIO
VP of Application Development
VP of IT Infrastructure
Enterprise Architecture VP of Enterprise Architecture
Enterprise Architect(s)
Business Specialists / Architects
Program Management PMO Manager
Project Manager(s)
Development Process Application Architect(s)
Business Analyst(s)
Business Process Engineer(s)
Methodologist
Build Manager
CM Manger
QA Manager
Operations Director of Operations
Administrator(s)
Security Chief Security Architect

Roadmap Creation Process
1-6 Creating a BPM Roadmap
a two week (or so) period. Time before or between interviews can be productive time spent reviewing documentation (i.e. the next step).
1.2.1.2.4 Gather and Review Relevant Documents
Before beginning the interview process, the assessment team should gather and review all the existing documents that describe various aspects of the current IT environment and BPM initiative. This allows the assessment team to ask more focused questions in the interviews and also provides the opportunity to ask questions about the written material for clarification or to resolve conflicting information. The following table gives some examples of the types of documents that should be gathered and reviewed:
1.2.1.2.5 Perform Interviews
Before each interview the assessment team should review the BPM Maturity Model to identify capabilities that are particularly relevant for the person being interviewed. It is NOT recommended that the assessment team simply ask a question for each of the capabilities. Rather the interview team should ask open ended questions that allow the interviewee to describe how things are currently done and to identify any problems that currently exists. Remember, the interviewees are the experts on what goes on within the organization being evaluated, so encourage them to explain the current situation.
1.2.1.2.6 Assign Capability Scores
Once the interviews have been completed and the documents have been reviewed, each of the capabilities in the BPM Maturity Matrix should be scored for both maturity and adoption. These scores provide the raw data that can then be analyzed in the gap analysis phase of the roadmap creation process.
The BPM Maturity Model includes a description for each level of maturity and each level of adoption for each capability. When scoring a capability, the scores selected should be the scores where the descriptions of maturity level and adoption level most accurately match the current situation based on the information collected in interviews and from the documents reviewed. Although there is always some level of subjectivity when measuring capability, the goal is to provide an objective measure. This allows future measurements to be performed by a different assessment team, yet still provide results that can be used to accurately measure progress.
Table 1–2 Typical Relevant Documents
Typical Documents to Review
Balanced Score Card, Strategy Map (or similar business strategy/goals document)
Enterprise Architecture Document(s)
Project Management Handbook(s)
Business Process Model(s)
Application Functional Breakdown
Application Portfolio
Integration Architecture Document(s)
Operational Process and Procedures Document(s)
Corporate Security Policies
Organizational Structure Document (org chart)
BPM Program Document(s)

Roadmap Creation Process
Creating a BPM Roadmap 1-7
Frequently when the assessment results are presented there are questions and even disagreements about the score that was assigned. Therefore, it is also important that in addition to the score, the assessment team also record the rational for assigning the maturity and adoption scores. This rational could include quotes from interviews or specific sections from the documents that were reviewed.
1.2.1.3 OutputThe output of the current state assessment is the maturity and adoption score for each of the capabilities in the BPM Maturity Matrix. Additionally, the assessment team will have an understanding of the current state and should have collected known issues and problems that were identified and discussed during the interview process.
1.2.2 Future Vision DefinitionFor the BPM Roadmap creation process, the future vision definition phase focuses solely on the high level goals and principles that will be used to guide the entire BPM initiative. This phase does not attempt to create a detailed future state vision. While a more detailed future vision is required to achieve successful BPM adoption, it is not something that must be created prior to creating the initial BPM Roadmap. The initial phases of the BPM Roadmap may focus on creating the detailed BPM future vision.
1.2.2.1 OverviewThe BPM vision definition answers the following questions:
1. What is goal of the BPM initiative?
2. What is the organizational scope of the BPM initiative?
3. What are the benefits that BPM is expected to deliver to the organization?
4. What are the guiding principles for the BPM initiative?
These questions must be answered by the executive(s) leading the BPM initiative. This is accomplished in a facilitated workshop. Nominally the workshop should take about two hours, but may take longer if there is no pre-existing understanding of BPM or there is substantial disagreement on why BPM is being pursued.
1.2.2.2 DetailsThis section provides greater detail on how to collect answers to the questions that the previous section introduced.
1.2.2.2.1 What is goal of the BPM initiative?
The goal being defined is the goal for the BPM initiative by the end of the roadmap. The recommended roadmap planning horizon is 2-3 years; therefore the goal should be the goal of the BPM initiative 2-3 years from now. The following table contains suggested goal statements and scoring that may be applied or adapted for particular customers needs.
Table 1–3 BPM Goal Statements
Goal Statement Score
Enable rapid response to changing business conditions (e.g. competition, market forces, acquisition, etc.)
5
Develop a cycle of continuous improvement of business processes. 5

Roadmap Creation Process
1-8 Creating a BPM Roadmap
The goal statements in the above table are used to gage the extent and complexity of the entire BPM initiative and are listed in reverse order of difficulty. It should be obvious that accomplishing the first goal statement is far more difficult that accomplishing the fifth goal statement. Greater organizational maturity is required to achieve the more difficult goals for BPM. Of course, the benefits provided by BPM are commensurably greater as well. The 'Score' column in the table is used (and will be explained) in the gap analysis phase.
1.2.2.2.2 What is the organizational scope of the BPM initiative?
The organizational scope defines which departments, divisions, lines-of-business, etc. are included in the BPM initiative. The most common scopes are either division or enterprise, but other options are possible depending on the company's organizational structure. The following table provides example levels of scope for the BPM initiative.
Defining the scope of the BPM initiative is essential to determining a roadmap. With greater scope, the number of organizational boundaries that must be crossed increases. This increases the complexity of the effort, and, therefore, requires greater organizational maturity. The 'Score' column in the table is used (and will be explained) in the gap analysis phase.
1.2.2.2.3 What are the benefits that BPM is expected to deliver to the organization?
There are many different benefits that an organization can realize by successfully adopting BPM. However, not all benefits can be realized in parallel. When creating a BPM Roadmap emphasis should be placed on the benefits that are highest priority and leave the lower priority benefits for later phases. The table below lists possible benefits from BPM adoption:
Monitor business process efficiency and effectiveness of change based on Key Performance Indicators (KPIs)
4
Improve business process transparency and visibility for improved control and consistency
3
Facilitate streamlining of human tasks through automation. 2
Apply BPM to a limited set of projects to demonstrate the benefits of BPM and build credibility with the business owners.
1
Improve business/IT alignment through common business process language and shared repositories
1
Table 1–4 BPM Initiative Scope
BPM Initiative Scope Score
A small number of projects will be applying process-orientation. 1
One or more business units will use BPM to address all of their projects. 2
The BPM initiative will span all business units within a single division. 3
The BPM initiative will span multiple divisions within the enterprise. 4
The BPM initiative will span the entire enterprise. 5
Table 1–5 Example BPM Benefits
Continuous improvement of business processes
Rapid deployment of business processes
Table 1–3 (Cont.) BPM Goal Statements
Goal Statement Score

Roadmap Creation Process
Creating a BPM Roadmap 1-9
The benefits in the above table can be used as a starting place to identify the benefits that an organization hopes to achieve via BPM adoption. The above table is only a start on the possible benefits and is by no means a comprehensive list. Part of the vision definition is to create a list of possible BPM benefits and prioritize the list.
Once a list has been created, the benefits should be prioritized based on the business and IT objectives of the organization. The easiest way to prioritize the benefits is to assign a high, medium, or low prioritization to each possible benefit. Roughly one third of the possible benefits should be in each prioritization i.e. it does no good to list all the possible benefits as high priority.
1.2.2.2.4 What are the guiding principles for the BPM initiative?
The guiding principles are derived from the top priority benefits and provide enforceable guidance to the BPM initiative. The following table provides some example guiding principles.
The guiding principles should be sufficiently clear and detailed that the principles can be enforced across the entire scope of the BPM initiative and on specific projects that fall under the purview of the initiative. The principles should also serve as a foundation to make more specific decisions in the future.
Rapid / flexible process business change Flexible architecture that enables business and IT agility
Ability to support cross functional and cross divisional processes
Effective use of external service providers
Single implementation and enterprise-view of business processes
Operational improvements
Process granularity recognized by a business user
Skill-set portability
Standardize process and technologies Standards based integration
Quicker re-composition of business processes
Integration with business partners
Extending value of legacy applications Better visibility into business processes
Efficiency and/or consistency through automation
Business process standardization
Decoupling of applications Productivity gains
Table 1–6 Example BPM Guiding Principles
Every core business process must be documented following company standards
Apply a consistent and controlled automation candidate identification process
Utilize standards-based process automation infrastructure
Business process is owned by the enterprise
Reuse existing / legacy application functionality wherever possible
Table 1–5 (Cont.) Example BPM Benefits

Roadmap Creation Process
1-10 Creating a BPM Roadmap
1.2.2.3 OutputThe output from the vision definition phase is the overall goal of the initiative, the scope of the initiative, the expected benefits, and the guiding principles to achieve the goal and the benefits. This vision for the BPM initiative can be captured in a single summary slide and used to educate and align the organization with the BPM initiative. An example of this summary slide is shown in Figure 1–4.
Figure 1–4 Example BPM Vision Summary
This clearly shows the goal and scope of the BPM initiative. It also shows that the BPM principles will be enforced across the entire BPM initiative and that the BPM initiative is expected to deliver the prioritized benefits.
1.2.3 Gap AnalysisThe gap analysis phase compares the current state of the BPM initiative (as measured in the assessment phase) with the goal for the initiative (defined in the vision phase). The gap between these two is then analyzed to determine the causes and remediation approaches are identified.
1.2.3.1 OverviewThe maturity and adoption scores from the current state assessment phase measure the progress of a BPM initiative and, more importantly, identifies specific capabilities that are lacking or lagging and are therefore inhibiting the BPM initiative. The gap between where the organization is currently and where they need to be to achieve their goal is broken down by capability domain (from the BPM Maturity Model) to identify lagging domains. It is further broken down by individual capability to identify specific capabilities that are lacking or lagging. The following diagram illustrates the process:

Roadmap Creation Process
Creating a BPM Roadmap 1-11
Figure 1–5 Gap Analysis Process
Once the lagging capabilities have been identified, a remediation approach for each of the identified inhibitors is determined from industry best practices and prior Oracle experience.
1.2.3.2 DetailsThis section details the steps defined in the previous section.
1.2.3.2.1 Identify Problem Domains
The first step in the gap analysis phase is to identify the domains that exhibit the largest gap between current maturity and the maturity needed to achieve the BPM goal. The gap for the domains can be visually represented by a spider (aka radar) graph as shown Figure 1–6.
Figure 1–6 Vision versus Current Maturity
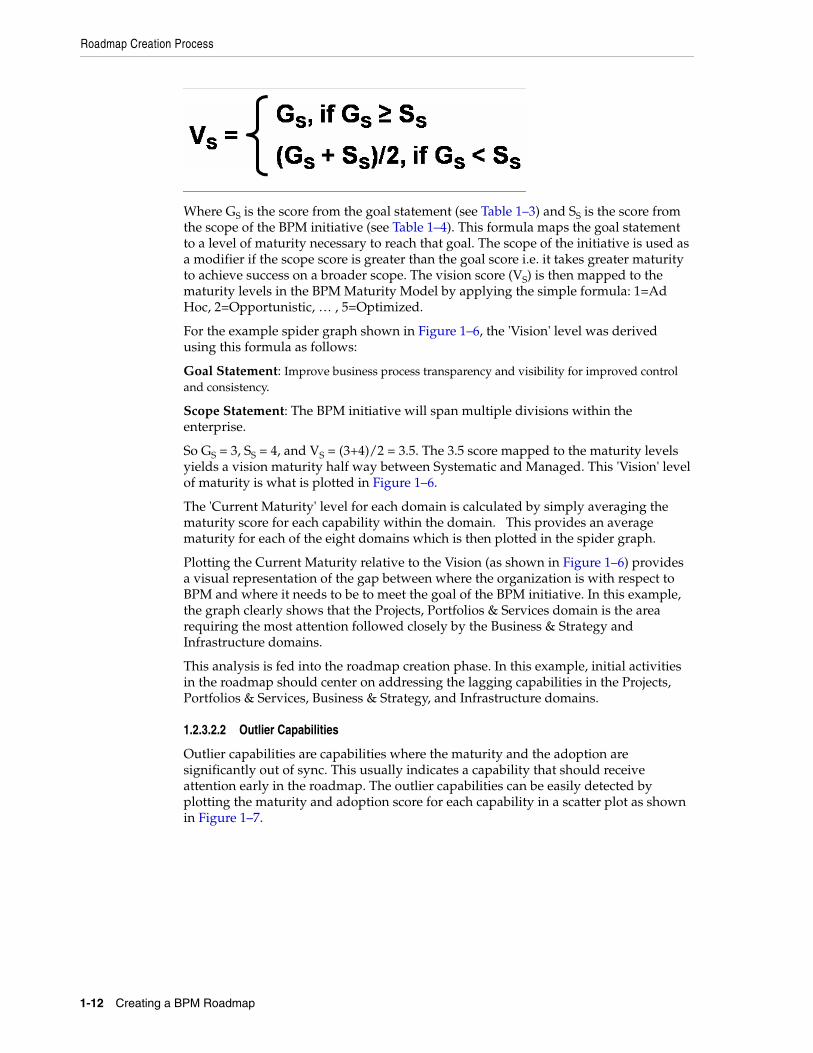
The 'Vision' level is determined by the following formula:
Roadmap Creation Process
1-12 Creating a BPM Roadmap
Where GS is the score from the goal statement (see Table 1–3) and SS is the score from the scope of the BPM initiative (see Table 1–4). This formula maps the goal statement to a level of maturity necessary to reach that goal. The scope of the initiative is used as a modifier if the scope score is greater than the goal score i.e. it takes greater maturity to achieve success on a broader scope. The vision score (VS) is then mapped to the maturity levels in the BPM Maturity Model by applying the simple formula: 1=Ad Hoc, 2=Opportunistic, … , 5=Optimized.
For the example spider graph shown in Figure 1–6, the 'Vision' level was derived using this formula as follows:
Goal Statement: Improve business process transparency and visibility for improved control and consistency.
Scope Statement: The BPM initiative will span multiple divisions within the enterprise.
So GS = 3, SS = 4, and VS = (3+4)/2 = 3.5. The 3.5 score mapped to the maturity levels yields a vision maturity half way between Systematic and Managed. This 'Vision' level of maturity is what is plotted in Figure 1–6.
The 'Current Maturity' level for each domain is calculated by simply averaging the maturity score for each capability within the domain. This provides an average maturity for each of the eight domains which is then plotted in the spider graph.
Plotting the Current Maturity relative to the Vision (as shown in Figure 1–6) provides a visual representation of the gap between where the organization is with respect to BPM and where it needs to be to meet the goal of the BPM initiative. In this example, the graph clearly shows that the Projects, Portfolios & Services domain is the area requiring the most attention followed closely by the Business & Strategy and Infrastructure domains.
This analysis is fed into the roadmap creation phase. In this example, initial activities in the roadmap should center on addressing the lagging capabilities in the Projects, Portfolios & Services, Business & Strategy, and Infrastructure domains.
1.2.3.2.2 Outlier Capabilities
Outlier capabilities are capabilities where the maturity and the adoption are significantly out of sync. This usually indicates a capability that should receive attention early in the roadmap. The outlier capabilities can be easily detected by plotting the maturity and adoption score for each capability in a scatter plot as shown in Figure 1–7.

Roadmap Creation Process
Creating a BPM Roadmap 1-13
Figure 1–7 Capabilities Scatter Plot
As shown in the above graph, the maturity and adoption scores for capabilities usually fall along the diagonal when plotted against each other. In the above example, there are two scores that are significantly off the diagonal, one well above the diagonal and one well below the diagonal. The capability well above the diagonal is a capability from the Architecture domain. The capability well below the diagonal is a capability from the Infrastructure domain. The analyst will need to review the actual capability scores to identify exactly which capabilities yielded the outlier points on the graph.
A capability that falls well above the diagonal indicates a capability that is done very well within a relatively small area of the organization. In this example, there is a capability at a 'Systematic' level of maturity done within a single project. Fostering greater adoption of this capability provides an easy win for the BPM initiative i.e. there is no need to develop greater competency for this capability within the organization since it already exists within the organization. Some training or mentoring can spread the ability more broadly within the organization.
A capability well below the diagonal indicates a capability that is done poorly (or in a non-BPM compliant fashion) very broadly. In this example, there is a capability being done at a 'No BPM' level of maturity across the entire division. Corrective action needs to be taken for this capability since if left uncorrected, it will inhibit (and probably already has inhibited) the BPM initiative.
Capabilities that plot nearer the lower left corner are capabilities that are either non-existent or are lagging behind the other capabilities. These capabilities will be addressed in the next step of the gap analysis process.
The capabilities that plot toward the upper right corner are capabilities that are currently being done well. No remediation is required and the organization should continue business as usual for those capabilities.
1.2.3.2.3 Low Maturity Capabilities
The capabilities that plot nearer the lower left corner in the scatter plot are capabilities that require attention in early phases of the roadmap. Capability heat maps can be used to visually identify these low maturity capabilities as shown in Figure 1–8.

Roadmap Creation Process
1-14 Creating a BPM Roadmap
Figure 1–8 Capabilities Heat Map
The capabilities heat map colors each of the capabilities based on the maturity score recorded for that capability. The above diagram shows the color coding legend as well as each capability with color coding applied. The capabilities are organized by the domains used in the BPM Maturity Model.
The heat maps draw immediate attention to the capabilities that require attention. In the above example, there are five capabilities in the Business & Strategy domain (Business Process Analysis, Business Automation, Process Improvement Approach, Value Chain, Innovation) that scored at the 'No BPM' level of maturity. These capabilities should be addressed in early phases of the BPM Roadmap. Likewise, there are six capabilities in the Projects, Portfolios & Services domain that scored at the 'No BPM' level of maturity. All of the capabilities in the Governance domain were scored at the ’No BPM’ level of maturity, an obvious indicator that BPM is very immature for this organization.
It is important to point out that not all capabilities are of equal importance for a particular organization. In fact, there may be capabilities that are deemed unimportant or even not applicable for a particular organization. Thus, it is necessary to review each capability with a low score and determine whether it is a top priority, a low priority, or unimportant from a roadmap creation perspective.
If a capability is deemed unimportant for a particular organization, it should be removed from the maturity model and the graphics should be regenerated. This should be done with caution. A capability should only be removed if it is clearly not appropriate for the BPM initiative at this organization.
1.2.3.2.4 Determine Remediation Activities
At this point in the gap analysis process, the problem domains have been identified and the problem capabilities within each domain have also been identified. The next step is to identify remedies for each problem domain and capability. The remedies, obviously, depend on the problem being addressed and also frequently have some

Roadmap Creation Process
Creating a BPM Roadmap 1-15
aspect that is organization specific. Thus, unfortunately, it is not possible to provide a prescriptive approach to determining remediation activities for all 60+ capabilities.
However, there are some general guidelines based on the domains that can usually be applied to creating remediation activities.
1.2.3.3 OutputThe output from the gap analysis phase is an understanding of which domains and which individual capabilities are inhibiting the successful achievement of the goal of the BPM initiative. Additionally, remediation activities have been identified to address the lagging domains and capabilities. These remediation activities provide the primary input into the roadmap creation process.
1.2.4 Activity Selection and SchedulingThe remedies identified in the gap analysis phase are prioritized and used to create a plan, called the BPM Roadmap. Business processes are then evaluated to select the
Table 1–7 Remediation per Domain
Domain Remediation Comments
Business & Strategy
Remediation for this domain and the capabilities within this domain usually requires executive management decisions and directives. A common remediation activity is a facilitated workshop with appropriate executives to define the necessary strategies, make decisions, and formulate directives.
Architecture Low scores in this domain usually indicate the lack of a reference architecture for the BPM initiative, or if the reference architecture exists, it lacks completeness and details. Remediation usually entails workshops with Enterprise Architects to specify a complete, detailed reference architecture.
Infrastructure Low scores in this domain usually indicate that the process infrastructure is lacking significant elements. Infrastructure installation and configuration type projects are common remediation activities.
Information Low scores in this domain usually indicate issues with the information architecture, data quality approach, and/or information stewardship. Common remediation activities are workshops to address the causes for the low scores.
Operations, Administration & Management
Remediation activities for low scores in this domain usually entail definition, documentation, and enforcement of BPM compatible OA&M procedures. Low scores could be due to lacking BPM knowledge/skills or could be due to a low maturity of OA&M in general.
Projects, Portfolios & Services
Low scores in this domain usually indicate a lack of BPM compatible management and delivery processes. Common remediation activities entail workshops to modify existing management and delivery processes to inject BPM best practices.
Organization Low scores in this domain usually indicate that roles and responsibilities appropriate for BPM have not been instituted within the organization. There may also be a lack of BPM knowledge/skills. Common remediation activities include developing training plans and workshops to define the necessary roles and responsibilities. Remediation may also require organization restructuring.
Governance Most organizations have existing IT governance in place, so low scores in this domain usually indicate that governance has not been extended to cover BPM. Remediation usually requires a workshop to define and institute the governance extensions required for BPM.

Roadmap Creation Process
1-16 Creating a BPM Roadmap
business processes that are most appropriate for application of BPM technology. This should not be equated to evaluating the value of the business process itself; rather it measures the benefits (versus the risks) of the application of BPM technology.
1.2.4.1 OverviewThere are five steps in this final phase of the process to create a BPM Roadmap. These five steps are illustrated in Figure 1–9.
Figure 1–9 Roadmap Scheduling Process
As shown in the diagram, the main inputs to this phase are the remediation activities identified in the gap analysis phase, the identification of the integration requirements, and the business process selection framework. The final step is to determine timelines and dependencies and organize all the activities into a schedule.
1.2.4.2 DetailsThis section details the steps defined in the previous section.
1.2.4.2.1 Determine Program-Level Activities
The program-level activities are determined by prioritizing the remediation activities identified in the gap analysis phase. Top priority is usually given to remediation activities that focus on the domain with lowest current maturity score. Top priority remediation activities are usually the first activities in the roadmap since the results from these activities are leveraged across the solution and process delivery efforts.
Program-level activities frequently entail changes with wide ranging impacts. For example, changing the software development process (to inject process-oriented best practices) impacts all development teams within the scope of the BPM initiative. Organizational changes can be even more taxing. Therefore, it is usually necessary to undertake these changes in a series of iterations. These iterations become the phases of the overall BPM Roadmap. At a high level, this can be shown graphically as illustrated by Figure 1–10.

Roadmap Creation Process
Creating a BPM Roadmap 1-17
Figure 1–10 Increasing Maturity Over Time
The graph illustrates three iterations each increasing maturity of one or more domains until the desired 'vision' level of maturity is achieved. Notice that the first phase focuses on bringing all domains up to the 'Opportunistic' level of maturity. This means that the first phase will include remedy activities for the Business & Strategy, Infrastructure, and Projects, Portfolios & Services domains. Once near parity is achieved across domains, follow-on phases address the eight domains more uniformly to keep the BPM initiative progressing smoothly.
The amount of change introduced by an iteration must not exceed the organization's ability to absorb that change; therefore the scope of each iteration must be carefully planned. Likewise, the duration of each iteration must be long enough to accomplish some meaningful progress, yet remain short enough to minimize risk and maintain a continuous pace of incremental progress.
1.2.4.2.2 Identify Application Integration Requirements
Having selected the program level activities, the next step is to identify processes that should be included in the roadmap. One of the selection criteria used for the process candidates is the accessibility of functionality from existing applications. It may be necessary to make modifications to these applications to support the new project. There are two main types of changes:
1. Integration efforts
2. Implement functional enhancements to existing applications and SOA Services
The new process should not require that additional capacity or better performance than the existing applications or SOA Services currently provide since, in principle, the business process is not changing; however it is important to be aware of possible changes to non-functional aspects and the potential for increased demands on the application.
The most likely case is that the existing application or SOA Service needs extensions to support the integration in the process automation. These changes should be factored in to the process selection and the effort and integration approach clearly established in advance of project start. Ideally the changes can be done in a backward compatible manner; thereby allowing existing consumers of the SOA Services to move to the new version deployed to support the new process.
Typically integration requirements are best satisfied through a SOA approach, however, since a new SOA project is likely to provide additional benefits such projects

Roadmap Creation Process
1-18 Creating a BPM Roadmap
should be justified separately using the SOA roadmap planning and engineering strategies.
It is possible that the required business application functions do not currently exist anywhere in the organization. In this case, the process candidate may support justification for the development of application or service capabilities in a separate engineering project.
Any of the above types of change to existing application functionality or SOA Services needs to be reflected in the BPM Roadmap regardless of whether or not they are handed off to a separate project. Obviously the processes that use the SOA Services have a dependency on the external change activities so these dependencies must be captured in the roadmap.
1.2.4.2.3 Select Processes
There are three primary areas to analyze to identify the process automation candidates:
1. Alignment with strategic goals
2. Value of benefits, such as frequency of process change, opportunities for optimization, etc.
3. Availability & accessibility of required business application functions
It is possible that the required business application functions do not currently exist anywhere in the organization. In this case, the process candidate may support justification for the development of application or SOA Service capabilities in a separate engineering project.
Process candidate identification and analysis is a large topic and is beyond the scope of this document, but an outline of Business Process Selection Framework can be found in Appendix B. An example graphic of process candidate analysis using the framework is shown in Figure 1–11.
Figure 1–11 Process Candidate Analysis
This example shows six business process candidates. A positive 'Decision Basis Score' indicates a process candidate that should be realized into an automated process. Thus, process candidates 1, 2, 3, 5, and 6 should be included in the BPM Roadmap with

Roadmap Creation Process
Creating a BPM Roadmap 1-19
process candidates 5 and 6 tacked in the earliest phase of the roadmap. Process candidates 4 should not be realized (at this time).
The process candidates that are selected are included in the BPM Roadmap. Process candidates that are not selected should be recorded for future iterations of the roadmap. Although the process candidate did not make the cut for this iteration of the roadmap, it might very well make the cut in a future iteration.
1.2.4.2.4 Define Schedule
The schedule defined in this step is the schedule for the entire BPM initiative; thus it is the high level schedule that illustrates the ordering and dependency relationships between program-level activities, the selected projects, service modifications, and the selected process candidates.
The high level phases of the BPM Roadmap were shown in Figure 1–10, but Figure 1–10 does not include actual timelines since that could not be determined until the projects, integrations, and process candidates had been identified. The steps to put together the schedule are as follows:
1. Create the program level activities schedule
2. Create high-level project schedule
3. Determine delivery dates for application integrations and service modifications
4. Determine delivery dates for process candidates
The first activity of defining the schedule is to determine the start date and duration for the program level activities. These are the initial activities put into the BPM Roadmap.
The next step is to determine the start dates for the selected projects. Projects that are expected to leverage the outcomes of the program level activities (usually all projects) should not begin in earnest until the program-level activities complete. Some overlap is allowed since the earliest phases of a project (e.g. Inception in UP) can usually commence before the program-level activities are completed. The end date for the project is determined by effort, complexity, and resource availability. Sometimes the end date is mandated by business needs. In either case the end date for the project is put into the schedule.
The delivery dates for the application integrations and SOA Service modifications are determined by the needs of the project requiring the changes. Generally the integrations and SOA Service modifications must be available in time for project integration testing. Of course, an earlier delivery date is certainly acceptable and is, in fact, preferable.
Most of the projects included in the BPM Roadmap will have a business process management automation as the primary delivery of the project. Exceptions include the infrastructure projects that deliver the shared BPM infrastructure used by multiple process management automation projects. The delivery dates for the selected business processes are determined and are incorporated into the schedule. The delivery dates for the selected business processes lie within the enclosing project delivery time line.
At this point any resource constraints need to be incorporated into the schedule. This may require that start dates are delayed or durations may increase. Once these constraints have been included, a schedule can be created and might look something like the schedule shown in Figure 1–12.

Roadmap Creation Process
1-20 Creating a BPM Roadmap
Figure 1–12 Roadmap Phase 1 Schedule
The above schedule begins with three program-level activities to address the three domains (Business & Strategy, Projects, Portfolios & Services, and Infrastructure) that scored below the 'Opportunistic' maturity level. The results from the program level activities are then disseminated to all the projects and process candidate realization activities shown in the bottom half of the figure. The Infrastructure Project shown in the roadmap delivers the BPM infrastructure used by the other two projects shown. This process infrastructure project is focused purely on realizing the process infrastructure defined in the ORA BPM Infrastructure document. The Infrastructure Planning (that was part of the program level activities) defines what technologies and products are deployed by the Infrastructure Project.
Project 1 and Project 2 both deliver the automation of business processes (Process Candidate 5 and Process Candidate 6). The two process candidates were selected via the Business Process Selection Framework as described above and shown in Figure 1–11. Finally, the graphic shows the application and SOA Service modifications that are required to support the projects. This is to expose the necessary functionality that is required by the tasks in the business processes.
As discussed earlier, the detail in the initial phase of the BPM Roadmap will be much greater than the detail provided for the later phases. The later phases likely include additional program level activities and more projects and the process candidates on which they are dependent, but will contain less detail. An example of such a schedule is shown in Figure 1–13.

Closing Comments
Creating a BPM Roadmap 1-21
Figure 1–13 BPM Roadmap Subsequent Phases
The first phase schedule was broken down into weeks but only covered two quarters. This schedule covers the entire planning horizon (three years) but with significantly less detail. The projects chosen for the first phase were relatively short in duration and effort. This is to help ensure early wins for the BPM initiative. Subsequent phases can then afford to undertake more complex efforts (e.g. Integrate fulfillment systems and warehouses) that could take years to complete.
Subsequent phases will also likely have additional infrastructure projects that continue to build out the reference architecture. The capabilities of the reference architecture built out in each phase depend on the needs of the processes that are included in the phase.
1.2.4.3 OutputThe output from the roadmap creation phase is the BPM Roadmap that includes a detailed initial phase and less detailed subsequent phases. The BPM Roadmap provides guidance for achieving the goal of the BPM initiative via a series of much smaller transitions. Ideally each of the smaller transitions has its own individual business benefit, but it is frequently necessary to invest a little up front to reap larger benefits down the line.
1.3 Closing CommentsIt is important to keep the end goal in mind when applying this roadmap creation process and especially when executing against the roadmap. The end goal is achieving the goal of the BPM initiative. It is NOT to attain a particular score on the BPM Maturity Model. The success of the BPM initiative is measured by the realization of the prioritized BPM benefits identified in the Future Vision Definition phase. The BPM Maturity Model and the various frameworks are merely tools to help build a plan to achieve the goal.

Closing Comments
1-22 Creating a BPM Roadmap
Finally, and perhaps most importantly, this is an incremental approach. The process described in this document to create a BPM Roadmap should be regularly re-applied and the roadmap should be updated to reflect the changing reality. This allows each iteration to focus on the most pressing needs. Areas not of immediate concern can be relegated to future iterations; thereby reducing the size and complexity of the current iteration.
A
BPM Maturity Model A-1
ABPM Maturity Model
The Oracle BPM Maturity Model defines the following key concepts: capabilities, domains, maturity, and adoption.
A.1 CapabilitiesThe BPM Maturity Model includes over sixty capabilities that capture the best practices that Oracle has collected over many years working with a wide variety of companies. There is still considerable debate on what constitutes BPM best practices and standards and products change fairly regularly; therefore, the BPM Maturity Model remains technology, standards, and product agnostic while still capturing the major tenants of a complete BPM strategy.
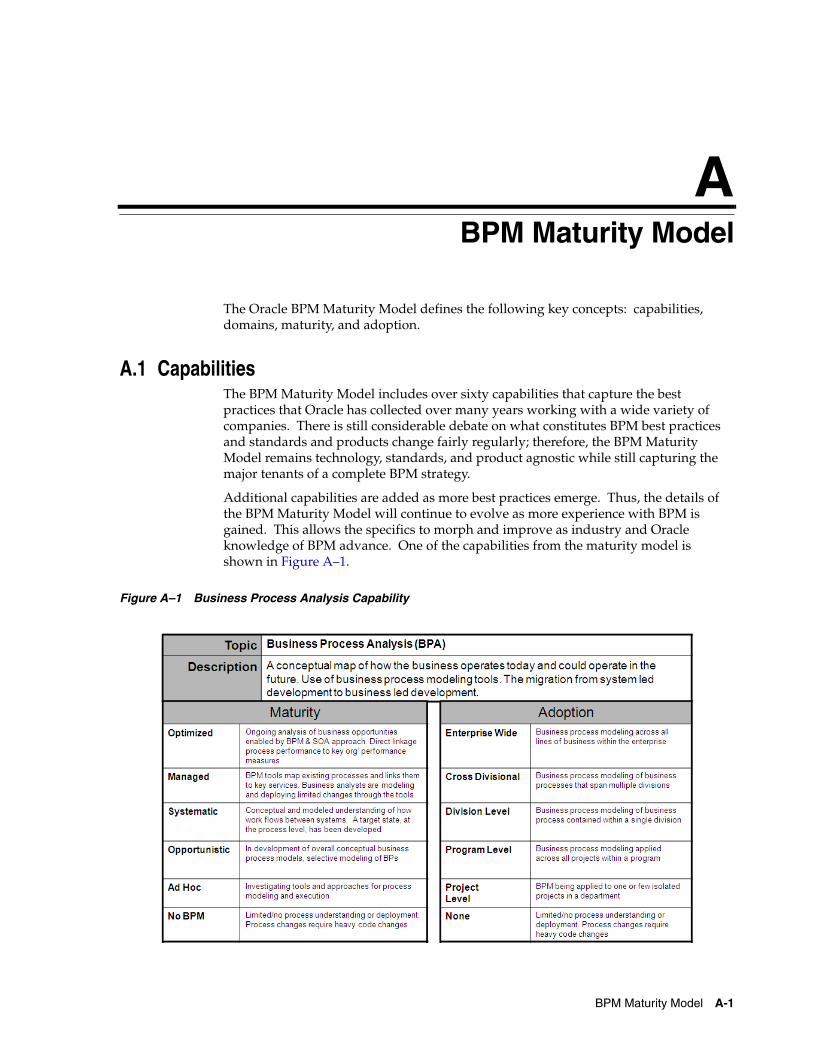
Additional capabilities are added as more best practices emerge. Thus, the details of the BPM Maturity Model will continue to evolve as more experience with BPM is gained. This allows the specifics to morph and improve as industry and Oracle knowledge of BPM advance. One of the capabilities from the maturity model is shown in Figure A–1.
Figure A–1 Business Process Analysis Capability

Domains
A-2 Creating a BPM Roadmap
As shown in the above figure, for each capability included in the model, a description for each level of maturity, and each level of adoption is provided. (The maturity and adoption levels are defined below.) Although there is always some level of subjectivity when measuring capability, these descriptions minimize the subjectivity injected, and thereby provide, as best as possible, an objective measure of both maturity and adoption.
A.2 DomainsThe BPM Maturity Model uses the concept of domains to classify and organize the related capabilities. As depicted in Figure A–2, there are eight domains in the maturity model:
Figure A–2 BPM Capability Domains
■ Business & Strategy - Contains capabilities that provide the high-level constructs that allow the BPM initiative to proceed. This includes such things as business motivation, expected benefits, guiding principles, expected costs, funding model, etc.
■ Architecture - Contains capabilities concerning the definitions of the overall architecture and guidelines for various practitioners to ensure adherence to the architecture.
■ Infrastructure - Contains capabilities concerning the process infrastructure and tools that provide the technical foundation for the BPM initiative.
■ Information - Contains capabilities concerning the information aspects of BPM. This includes shared data models, message formats and schemas, model management, content management, etc.
■ Projects, Portfolios & Services - Contains capabilities concerning the planning and building of processes and the process usage guidelines of process consumers.

Maturity
BPM Maturity Model A-3
■ Operations, Administration & Management - Contains capabilities concerning the post deployment aspects of solutions based on a process-oriented architecture i.e. the Operations, Administration, and Management aspects of BPM.
■ Organization - Contains capabilities concerning the development of corporate competency around BPM including the organizational structure and skills development.
■ Governance - Contains capabilities concerning the governance structures and processes that support and guide the BPM efforts. Maturity and adoption of an adequate amount of governance is a leading indicator of the overall BPM success.
These eight domains, although interrelated, are sufficiently distinct. To succeed at BPM adoption, an organization must adequate progress in all of these domains. Inevitably an organization will be more advanced in some domains (and further in some of the capabilities within a domain) than others. Therefore, it is important to be able to measure the relative maturity within each domain (and capabilities therein) and across domains to identify areas that are lagging. Once the lagging areas have been identified it is possible to formulate remedies and thereby improve the success of the overall BPM initiative.
A.3 MaturityWithin the software industry, maturity is frequently related to the Capability Maturity Model (CMM) and the CMM successor, the Capability Maturity Model Integration (CMMI). The BPM Maturity Model parallels this understanding and measures BPM capability against defined maturity levels. The levels of maturity used in the BPM Maturity Model (from highest to lowest) are:
■ Optimized - Metrics are being consistently gathered and are being used to incrementally improve the capability. Assets are proactively maintained to ensure relevancy and correctness.
■ Managed - The capability is being measured and quantitatively managed via some type of governance structure. Appropriate metrics are being gathered and reported.
■ Systematic - The approach has been reviewed and accepted by affected parties. There has been buy-in to the documented approach and the approach is always (or nearly always) followed.
■ Opportunistic - An approach has been decided upon and is being opportunistically applied. The approach has not been widely accepted nor adopted. It may be informally defined, or if documented, may exist primarily as “shelf ware”.
■ Ad Hoc - Awareness of BPM exists and some groups are embarking on process automation. There is no BPM plan being followed.
■ No BPM - There is no BPM approach being taken. BPM is not underway.
The maturity levels progress from 'No BPM' up to 'Optimized.' These levels define the path an organization usually takes moving toward BPM maturity. BPM by its very nature requires coordination, cooperation, and a common vision to be successful; therefore, it is necessary to define the strategy before it is possible to be truly successful at repeating it and then ultimately optimizing it.

Adoption
A-4 Creating a BPM Roadmap
A.4 AdoptionAdoption measures how widely BPM is being accepted, embraced, and applied within the enterprise. For smaller organizations within a single line-of-business, maturity and adoption are usually tightly related since there is a single approach to BPM being followed by the entire organization.
However, within large companies with multiple divisions or lines-of-business this is not usually the case. It is common to have one or more divisions that are relatively mature in BPM while other divisions are not even attempting BPM. The BPM Maturity Model handles these situations by providing a separate measure for adoption level. This allows a single division to be effectively evaluated for BPM maturity while still capturing the lack of widespread adoption as a separate measure.
The levels of adoption used in the BPM Maturity Model are:
■ Enterprise Level - The capability is implemented consistently across the enterprise i.e. all divisions or business units are applying the same approach.
■ Cross Division - The capability is implemented by multiple divisions using a common approach i.e. the approach is being shared or is spreading to multiple divisions.
■ Division Wide - The capability is implemented consistently across a division or business unit. A division or business unit is led by an executive at the VP level or higher.
■ Program Level - A relatively small group of projects (program) share an implementation of the capability. The program is under a single management structure below the VP level and encompasses less than an entire division or business unit.
■ Project Level - Individual projects implement the capability as appropriate for that specific project. There may be informal and unregulated sharing across projects.
■ No Implementation - There is no current implementation anywhere in the organization of the capability being measured.
For small organizations, it may be desirable to ignore the adoption dimension altogether and simply measure maturity. Conversely, for very large organizations with a goal of achieving enterprise-wide BPM adoption, it may be desirable to measure the maturity for each division or line-of-business separately and then provide a single measure of adoption across the enterprise. It should be noted, however, that for the realization of many of the key BPM benefits, a level of adoption across the organization is critical. For example, it is possible to have two divisions with mature but incompatible capabilities in which case the adoption is lower (division-wide) and that will inhibit an enterprise-wide BPM initiative.
Thus, to properly measure the overall progress of BPM initiative in a large organization, the maturity of the individual capabilities and the degree of adoption of such capabilities across the organization is vital.

B
Business Process Selection Framework B-1
BBusiness Process Selection Framework
The Business Process Selection Framework is used to select which potential business process should be realized through automation. Candidate process scoring is not being used to decide if new process or functionality should be created; rather it is being used to decide if the business process should be realized as an automated process. If a process candidate fails selection for automation it does not reflect on the value of the business process; rather it indicates that the business process is not an appropriate candidate for employing BPM technologies.
The framework is an Excel spreadsheet that is used to score each business process candidate against realization benefits and realization inhibitors. Each worksheet contained in the spreadsheet is described below.
B.1 Value AlignmentThe Value Alignment worksheet is used to measure how well candidate business processes align with the larger goals, objectives, and initiatives of the organization. The Value Alignment worksheet is shown in Figure B–1.
Figure B–1 Value Alignment Worksheet

Parameters
B-2 Creating a BPM Roadmap
The goals, objectives, and key initiatives of the organization are recorded at the top of the worksheet. Each business process candidate is then measured against the goals, objectives, and initiatives by entering a value from 0 to 5 (5 being the highest) based on how well the business process candidate aligns with the goal, objective, or initiative. The worksheet then applies quartiles to the resulting scores to assign a Value Alignment Score. The Value Alignment Score is propagated to the Process Candidates worksheet (see below).
B.2 ParametersThe Parameters worksheet is used to define the criteria used to score the process candidates. Both the realization benefit criteria and the realization inhibitor criteria are defined in this worksheet. The Parameters worksheet is shown in Figure B–2.
Figure B–2 Parameters Worksheet
For each criterion, a text score and the numeric score are defined. Providing a separate text score makes the Process Candidates worksheet more readable and allows process candidates to be evaluated without selecting actual numeric values. After the process candidates have been evaluated by selecting the appropriate text score, the numeric values can be adjusted (if necessary) without requiring revisiting the evaluations.
B.3 WeightingThe weighting worksheet allows the individual criterion to be weighted based on the relative importance of each. The Weighting worksheet is shown in Figure B–3.

Process Candidate Analysis
Business Process Selection Framework B-3
Figure B–3 Weighting Worksheet
The weights for both the realization benefits and realization inhibitor scores must total 100% for the spreadsheet to score the process candidates correctly.
B.4 Process CandidatesThe Process Candidates worksheet is used to evaluate process candidates by selecting a score for each of the criterion. The Process Candidates worksheet is shown in Figure B–4.
Figure B–4 Process Candidate Worksheet
The selections available for each criterion are limited to the text scores provided in the Parameters worksheet. The numeric scores are calculated using the numeric scores in the Parameters worksheet and the weights from the Weighting worksheet.
B.5 Process Candidate AnalysisThe Process Candidate Analysis worksheet generates a graph from the Decision Basis Score calculated in the Process Candidate worksheet. An example of this graph is shown in Figure 1–11.

Process Candidate Analysis
B-4 Creating a BPM Roadmap