Operator’s Manual - METERlibrary.metergroup.com/Manuals/13832_AquaLab VSA_Web.pdf · Seller...
106
Operator’s Manual Decagon Devices, Inc. Version: June 8, 2016 — 14:00:57
Transcript of Operator’s Manual - METERlibrary.metergroup.com/Manuals/13832_AquaLab VSA_Web.pdf · Seller...

Operator’s Manual
Decagon Devices, Inc.
Version: June 8, 2016 — 14:00:57

AquaLab VSA
Decagon Devices, Inc.2365 NE Hopkins Court
Pullman WA 99163
Phone: 509-332-5601Fax: 509-332-5158
Website: www.aqualab.comEmail: [email protected] or [email protected]
TrademarksAquaLab is a registered trademark of Decagon Devices, Inc.
c©2008-2016 Decagon Devices, Inc.
ii
AquaLab VSA CONTENTS
Contents
1 Introduction 11.1 Customer Support . . . . . . . . . . . . . . . . . . . . 11.2 About This Manual . . . . . . . . . . . . . . . . . . . 21.3 Warranty . . . . . . . . . . . . . . . . . . . . . . . . . 21.4 Seller’s Liability . . . . . . . . . . . . . . . . . . . . . . 2
2 About the VSA 42.1 Moisture Sorption Isotherms . . . . . . . . . . . . . . . 42.2 Measurement Method . . . . . . . . . . . . . . . . . . 52.3 AquaLab Vapor Sorption Analyzer Specifications . . . 6
3 Theory 83.1 Moisture Sorption Isotherm Methods . . . . . . . . . . 8
4 Getting Started 204.1 Instrument Setup . . . . . . . . . . . . . . . . . . . . . 21
5 User Interface and Menus 255.1 Isotherm Tab . . . . . . . . . . . . . . . . . . . . . . . 255.2 Measurement Tab . . . . . . . . . . . . . . . . . . . . 255.3 Configuration Tab . . . . . . . . . . . . . . . . . . . . 265.4 Data Tab . . . . . . . . . . . . . . . . . . . . . . . . . 37
6 Cleaning and Maintenance 416.1 Desiccant Cartridge Desiccant Replacement . . . . . . 416.2 Cleaning the Testing Chamber . . . . . . . . . . . . . 456.3 Cleaning Procedures . . . . . . . . . . . . . . . . . . . 47
7 Verification of Calibration 497.1 Water Activity Verification . . . . . . . . . . . . . . . 497.2 Verification Standards . . . . . . . . . . . . . . . . . . 507.3 When to Verify for Linear Offset . . . . . . . . . . . . 517.4 Isotherm Standard Comparison . . . . . . . . . . . . . 58
8 Running a Test 608.1 Becoming Familiar with Stages . . . . . . . . . . . . . 608.2 Running a Moisture Sorption Isotherm Test . . . . . . 60
For the DDI method . . . . . . . . . . . . . . . . . . . 63
iii

CONTENTS AquaLab VSA
For the DVS Method . . . . . . . . . . . . . . . . . . . 658.3 Using DDI to investigate Glass Transition . . . . . . . 688.4 Creating a Working Isotherm Using the VSA . . . . . 688.5 Editing a Running Isotherm Test . . . . . . . . . . . . 698.6 Running a Water Activity Test . . . . . . . . . . . . . 70
9 Moisture Analysis Toolkit 729.1 Configure and Start a New Test . . . . . . . . . . . . . 729.2 Modify a Currently Running Test . . . . . . . . . . . . 729.3 Download and Export . . . . . . . . . . . . . . . . . . 73
10 Sample Preparation 7410.1 Preparing the Sample . . . . . . . . . . . . . . . . . . 7410.2 Sample Needing Special Preparation . . . . . . . . . . 75
11 Troubleshooting 7711.1 Diagnostics Screen . . . . . . . . . . . . . . . . . . . . 91
12 Support and Repair 9512.1 Repair Costs . . . . . . . . . . . . . . . . . . . . . . . 96
13 Appendix A 97
14 Appendix B 98
15 Declaration of Conformity 99
16 Certificate of Traceability 100
iv
AquaLab VSA 1 INTRODUCTION
1 Introduction
The AquaLab Vapor Sorption Analyzer (VSA) is an automatic isothermgenerator from the world leaders in water activity measurement. TheVSA is the only automatic isotherm generator that can generateisotherms using both the Dynamic Vapor Sorption (DVS) method,which generates equilibrium isotherms, and the Dynamic Dew PointIsotherm (DDI) method, which generates dynamic isotherms. Bycombing both methods in one instrument, the VSA makes it possi-ble to investigate both dynamic matrix changes due to water sorptionand the kinetics of those changes. This manual details VSA opera-tion and provides information on the capabilities of your VSA.
1.1 Customer Support
If you ever need assistance with your VSA, have any questions orfeedback, there are several ways to contact us. Decagon has Cus-tomer Service Representatives available to speak with you Mondaythrough Friday, between 7am and 5pm Pacific time.
Note: If you purchased your VSA through a distributor, please con-tact them for assistance.
Email:[email protected] or [email protected]
Phone:509-332-5601
Fax:509-332-5158
If contacting us by email or fax, please include as part of your mes-sage your instrument serial number, your name, address, phone, faxnumber, and a description of your problem or question.
1

1 INTRODUCTION AquaLab VSA
1.2 About This Manual
This manual includes instructions for setting up your VSA whichincludes setting up an isotherm test, running a test, collecting data,and analyzing data. Please read the manual before operating theVSA to ensure your instrument performs to its full potential.
Decagon Devices Inc. provides this manual to aid the end user inunderstanding the basic concepts of moisture sorption isotherms, en-abling them to use our instruments with confidence. We have madeevery effort to ensure the content of this manual is correct and sci-entifically sound.
1.3 Warranty
The VSA has a one-year warranty on parts and labor. Your warrantyautomatically validates upon receipt of the instrument. We contactyou within the first 90 days of your purchase to see how the VSA isworking for you.
1.4 Seller’s Liability
Seller warrants new equipment of its own manufacture against defec-tive workmanship and materials for a period of three years from thedate of receipt of equipment.
Note: We do not consider the results of ordinary wear and tear,neglect, misuse, accident and excessive deterioration due to corro-sion from any cause as defects.
The Seller’s liability for defective parts shall in no event exceed thefurnishing of replacement parts Freight On Board the factory whereoriginally manufactured. Material and equipment covered herebywhich is not manufactured by Seller shall be covered only by thewarranty of its manufacturer. Seller shall not be liable to Buyer forloss, damage or injuries to persons (including death), or to propertyor things of whatsoever kind (including, but not without limitation,
2

AquaLab VSA 1 INTRODUCTION
loss of anticipated profits), occasioned by or arising out of the instal-lation, operation, use, misuse, nonuse, repair, or replacement of saidmaterial and equipment, or out of the use of any method or processfor which the same may be employed. The use of this equipment con-stitutes Buyer’s acceptance of the terms set forth in this warranty.There are no understandings, representations, or warranties of anykind, express, implied, statutory or otherwise (including, but with-out limitation, the implied warranties of merchantability and fitnessfor a particular purpose), not expressly set forth herein.
3
2 ABOUT THE VSA AquaLab VSA
2 About the VSA
The VSA Isotherm Generator is an automatic moisture sorptionisotherm generator that can generate both dynamic and equilibriummoisture sorption isotherms.
2.1 Moisture Sorption Isotherms
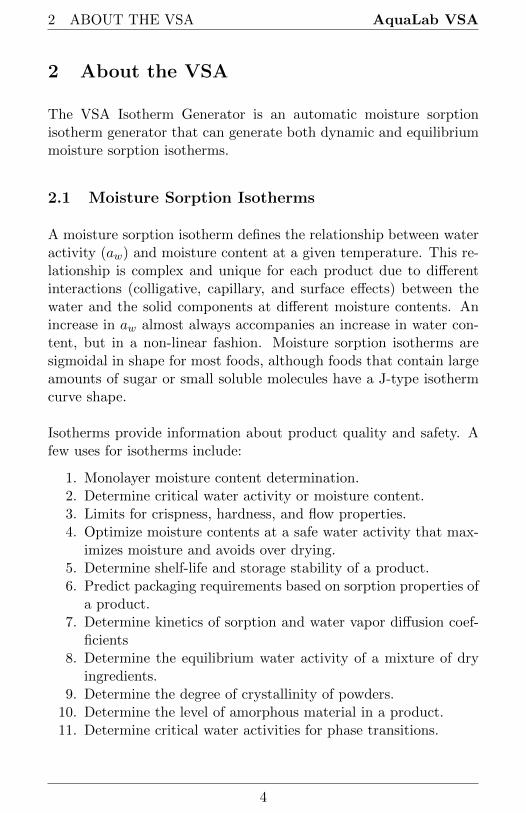
A moisture sorption isotherm defines the relationship between wateractivity (aw) and moisture content at a given temperature. This re-lationship is complex and unique for each product due to differentinteractions (colligative, capillary, and surface effects) between thewater and the solid components at different moisture contents. Anincrease in aw almost always accompanies an increase in water con-tent, but in a non-linear fashion. Moisture sorption isotherms aresigmoidal in shape for most foods, although foods that contain largeamounts of sugar or small soluble molecules have a J-type isothermcurve shape.
Isotherms provide information about product quality and safety. Afew uses for isotherms include:
1. Monolayer moisture content determination.2. Determine critical water activity or moisture content.3. Limits for crispness, hardness, and flow properties.4. Optimize moisture contents at a safe water activity that max-
imizes moisture and avoids over drying.5. Determine shelf-life and storage stability of a product.6. Predict packaging requirements based on sorption properties of
a product.7. Determine kinetics of sorption and water vapor diffusion coef-
ficients8. Determine the equilibrium water activity of a mixture of dry
ingredients.9. Determine the degree of crystallinity of powders.
10. Determine the level of amorphous material in a product.11. Determine critical water activities for phase transitions.
4
AquaLab VSA 2 ABOUT THE VSA
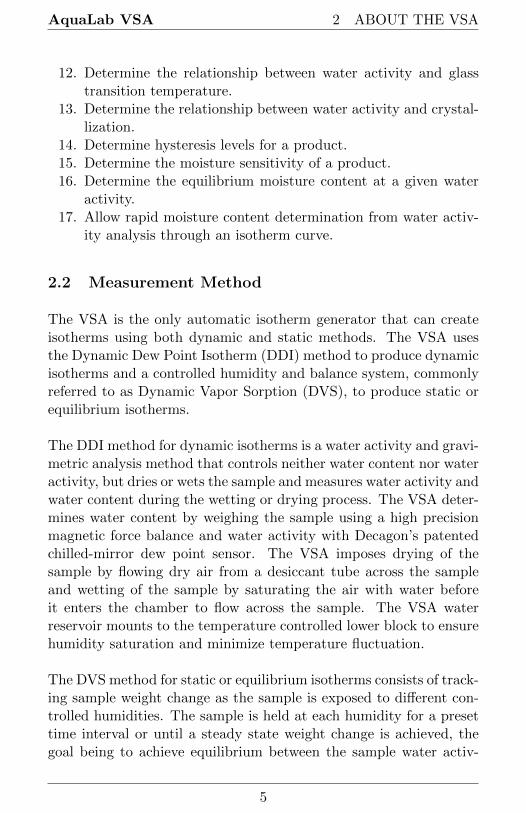
12. Determine the relationship between water activity and glasstransition temperature.
13. Determine the relationship between water activity and crystal-lization.
14. Determine hysteresis levels for a product.15. Determine the moisture sensitivity of a product.16. Determine the equilibrium moisture content at a given water
activity.17. Allow rapid moisture content determination from water activ-
ity analysis through an isotherm curve.
2.2 Measurement Method
The VSA is the only automatic isotherm generator that can createisotherms using both dynamic and static methods. The VSA usesthe Dynamic Dew Point Isotherm (DDI) method to produce dynamicisotherms and a controlled humidity and balance system, commonlyreferred to as Dynamic Vapor Sorption (DVS), to produce static orequilibrium isotherms.
The DDI method for dynamic isotherms is a water activity and gravi-metric analysis method that controls neither water content nor wateractivity, but dries or wets the sample and measures water activity andwater content during the wetting or drying process. The VSA deter-mines water content by weighing the sample using a high precisionmagnetic force balance and water activity with Decagon’s patentedchilled-mirror dew point sensor. The VSA imposes drying of thesample by flowing dry air from a desiccant tube across the sampleand wetting of the sample by saturating the air with water beforeit enters the chamber to flow across the sample. The VSA waterreservoir mounts to the temperature controlled lower block to ensurehumidity saturation and minimize temperature fluctuation.
The DVS method for static or equilibrium isotherms consists of track-ing sample weight change as the sample is exposed to different con-trolled humidities. The sample is held at each humidity for a presettime interval or until a steady state weight change is achieved, thegoal being to achieve equilibrium between the sample water activ-
5

2 ABOUT THE VSA AquaLab VSA
ity and the controlled humidity. Customers typically choose severalhumidity levels to preset during the set up process. The instrumentthen tracks equilibrium progress at each humidity level and auto-matically steps to the next humidity when equilibrium requirementsare achieved. Weight change versus time data is recorded allowingfor determining kinetics of sorption for each humidity level. Usingless stringent equilibrium settings for weight change or setting a re-duced time interval at each step can speed up the isotherm test, butmay give non-equilibrium results. In addition, setting smaller stepsin humidity increase the data resolution of the isotherm, but at theexpense of much longer test times.
The VSA is a stand-alone instrument with an integrated pump sys-tem that eliminates the need for an external gas cylinder, howeveryou can use an external gas source if desired. The instrument con-sists of a case which houses the power supply, air pump, balance,temperature controlled sample chamber, sensor block, sensor andtemperature control electronics, water reservoir, and desiccant sup-ply. Setup is as simple as plugging the instrument in, installing thedesiccant tubes, and filling the water reservoir. Test parameters canbe set using an onboard interface or using a connected computer andVSA software package.
2.3 AquaLab Vapor Sorption Analyzer Specifications
Water Activity (Relative Humidity) Accuracy: ±0.005 aw (0.5% RH)(for volatiles setting, ±0.02 aw, 2% RH)
Water Activity (Relative Humidity) Resolution: 0.0001 aw (0.01%RH); ±0.001 aw (0.1% RH) for volatiles setting
Water Activity (Relative Humidity) Range: 0.03 to 0.95 aw (3% to95% RH)
Water Activity (Relative Humidity) Repeatability: ±0.003 aw (0.3%RH) (for volatiles setting, ±0.02 aw, 2% RH)
Operating Environment: 4 to 50 ◦C; 0 to 90% Relative Humidity(Non-Condensing)
6
AquaLab VSA 2 ABOUT THE VSA
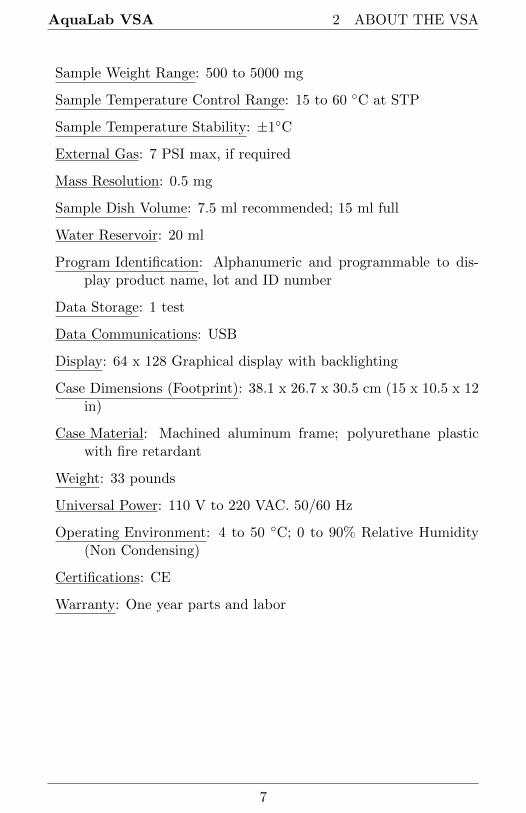
Sample Weight Range: 500 to 5000 mg
Sample Temperature Control Range: 15 to 60 ◦C at STP
Sample Temperature Stability: ±1◦C
External Gas: 7 PSI max, if required
Mass Resolution: 0.5 mg
Sample Dish Volume: 7.5 ml recommended; 15 ml full
Water Reservoir: 20 ml
Program Identification: Alphanumeric and programmable to dis-play product name, lot and ID number
Data Storage: 1 test
Data Communications: USB
Display: 64 x 128 Graphical display with backlighting
Case Dimensions (Footprint): 38.1 x 26.7 x 30.5 cm (15 x 10.5 x 12in)
Case Material: Machined aluminum frame; polyurethane plasticwith fire retardant
Weight: 33 pounds
Universal Power: 110 V to 220 VAC. 50/60 Hz
Operating Environment: 4 to 50 ◦C; 0 to 90% Relative Humidity(Non Condensing)
Certifications: CE
Warranty: One year parts and labor
7

3 THEORY AquaLab VSA
3 Theory
Water profoundly influences product attributes such as quality andsafety. To completely understand water relations in a product re-quires an understanding of the amount of water (moisture content)that can be held at a given energy state (water activity). Moisturesorption isotherms describe the relationship between water activityand moisture content at a constant temperature. The nature of thisrelationship depends on the interaction between water and other in-gredients.
The amount of water vapor that a product has depends on the chem-ical composition, physical-chemical state, and physical structure ofthe product. Consequently, the isotherm shape is unique to eachproduct type due to differences in capillary, surface, and colligativeeffects. (Figure 1) Products that lie in the low water activity portionof the isotherm are often referred to as dry, those in the range of 0.60aw to 0.90 aw are intermediate moisture products, and those havingwater activities higher than 0.90 are high water activity products.
For ease of interpretation, isotherms are often identified by Brunauerclassifications (Brunauer, 1945). Most food and pharmaceutical prod-ucts fall under type I, II, or III. Type I isotherms are typical of veryhygroscopic materials. Type II (sigmoidal) isotherms are typical forintermediate moisture products. Type III (J-shaped) isotherms aretypical for crystalline and coated materials. These general classifica-tions proved useful when isotherms on every product was not feasibledue to time and labor constraints. However, with automation andimproved speed, isotherms can easily be conducted on any productand the uniqueness of each isotherm often proves more valuable thanplacing them in a common classification.
3.1 Moisture Sorption Isotherm Methods
Constructing an isotherm consists of collecting water activity andmoisture content data at various points along the water activityrange. The range of water activities you use often depends on thesituation, but normally run from 0.10 aw up to 0.90 aw. You can run
8
AquaLab VSA 3 THEORY
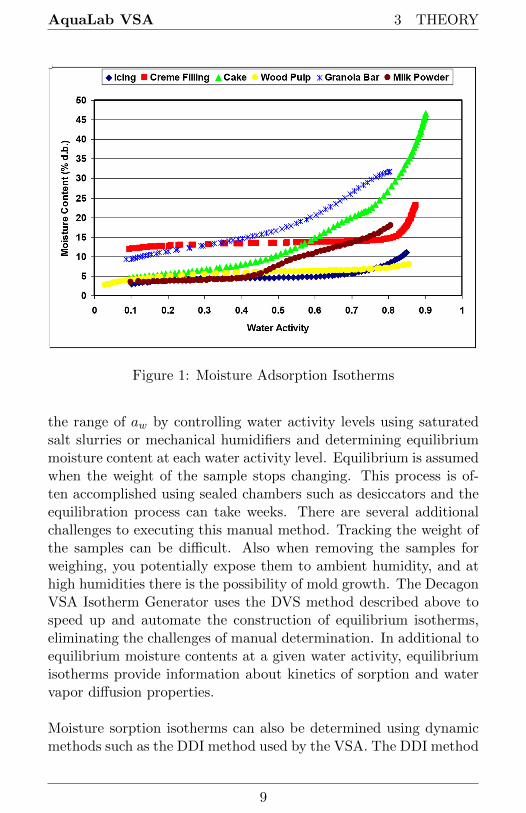
Figure 1: Moisture Adsorption Isotherms
the range of aw by controlling water activity levels using saturatedsalt slurries or mechanical humidifiers and determining equilibriummoisture content at each water activity level. Equilibrium is assumedwhen the weight of the sample stops changing. This process is of-ten accomplished using sealed chambers such as desiccators and theequilibration process can take weeks. There are several additionalchallenges to executing this manual method. Tracking the weight ofthe samples can be difficult. Also when removing the samples forweighing, you potentially expose them to ambient humidity, and athigh humidities there is the possibility of mold growth. The DecagonVSA Isotherm Generator uses the DVS method described above tospeed up and automate the construction of equilibrium isotherms,eliminating the challenges of manual determination. In additional toequilibrium moisture contents at a given water activity, equilibriumisotherms provide information about kinetics of sorption and watervapor diffusion properties.
Moisture sorption isotherms can also be determined using dynamicmethods such as the DDI method used by the VSA. The DDI method
9

3 THEORY AquaLab VSA
directly measures water activity while gravimetrically tracking weight,so there is no dependence on equilibration to known water activitylevels to determine water activity. Adsorption occurs as saturatedwet air passes over the sample. Desorption happens as desiccated airpasses over the sample. After a short period of time, the VSA haltsairflow and takes a snapshot of the sorption process by directly mea-suring the water activity and weight. The advantages of this methodinclude: increased analysis speed as the sample does not have towait for equilibration to a known water activity and an unmatchedlevel of resolution. This makes it possible for dynamic isotherms toproduce high resolution isotherms in a matter of days instead of theweeks it would take to make a comparable isotherm using equilib-rium techniques. The high resolution of dynamic isotherms makesthem valuable for observing sudden changes in sorption propertiesassociated with matrix changes such as glass transition.
The dynamic nature of the DDI method means that moisture con-tents may or may not be at equilibrium and it is possible for there tobe differences between dynamic and equilibrium isotherms. For sam-ples with fast vapor diffusion, penetration by water vapor into thewhole sample is rapid and isotherms using the DDI method for thesetypes of products are comparable to equilibrium methods. However,for samples with slow diffusion rates, moisture movement throughthe sample is slow and complete diffusion of moisture into and outof the sample may be slow enough to give the appearance of vaporequilibrium in the headspace during water activity analysis. In re-ality, the moisture has not had time to be completely absorbed bythe sample. Isotherms for these types of samples developed usingthe DDI method may have lower moisture contents during adsorp-tion and higher moisture contents during desorption than equilibriumisotherms, resulting in higher levels of apparent hysteresis.
Combining DVS and DDI in One Instrument
A unique and important feature of the AquaLab VSA is that it cangenerate both dynamic and equilibrium isotherms. As explainedabove, both DVS and DDI methods have advantages and disad-vantages. While the data they generate agrees in some cases, it
10

AquaLab VSA 3 THEORY
is the uniqueness of the results from each method that gives themvalue. There is information that can only be obtained from dynamicisotherms such as critical water activities for glass transition. Simi-larly, there is information that can only be obtained by equilibriumisotherms such as kinetics of sorption. Therefore, to provide themost information about the moisture characteristics of a material,both types of isotherms are needed. The VSA can provide bothDVS and DDI isotherms and even run them both on one sample.
Hysteresis
Figure 2 shows two isotherms, one obtained by wetting a sample fromcomplete dryness and the other obtained by drying a sample fromsaturation. The arrows show the direction of the process. The watercontent at each water activity is higher during desorption (dryingfrom high water content) than adsorption (wetting from low watercontent). This phenomenon is called hysteresis. The curves in Figure2 represent limits or boundary isotherms since they begin at wateractivities near zero and one. If a drying process reduces the wateractivity of a sample only part way to dryness, and the sample is thenwet again, it follows a path between the wetting and drying bound-ary curves, as shown in Figure 3. These curves are called scanningcurves, and there can be an infinite number of them depending onwhere drying stops and starts.
Figure 2: Full Isotherm Showing Hysteresis
11
3 THEORY AquaLab VSA
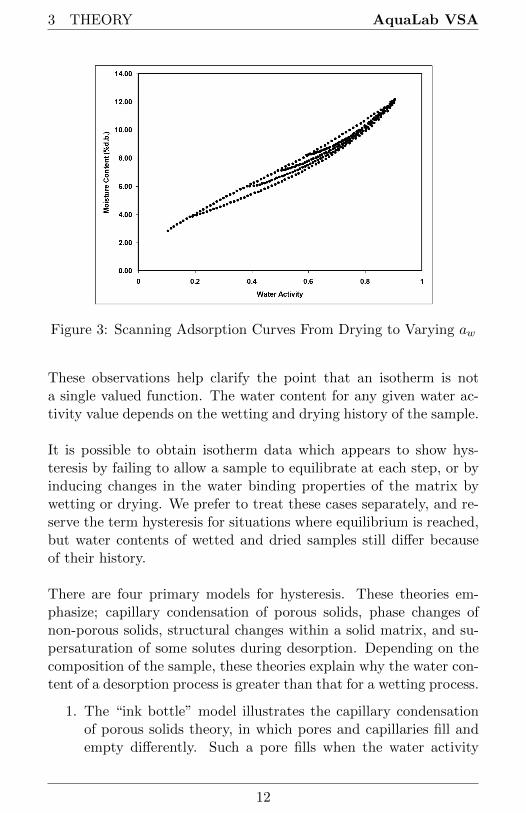
Figure 3: Scanning Adsorption Curves From Drying to Varying aw
These observations help clarify the point that an isotherm is nota single valued function. The water content for any given water ac-tivity value depends on the wetting and drying history of the sample.
It is possible to obtain isotherm data which appears to show hys-teresis by failing to allow a sample to equilibrate at each step, or byinducing changes in the water binding properties of the matrix bywetting or drying. We prefer to treat these cases separately, and re-serve the term hysteresis for situations where equilibrium is reached,but water contents of wetted and dried samples still differ becauseof their history.
There are four primary models for hysteresis. These theories em-phasize; capillary condensation of porous solids, phase changes ofnon-porous solids, structural changes within a solid matrix, and su-persaturation of some solutes during desorption. Depending on thecomposition of the sample, these theories explain why the water con-tent of a desorption process is greater than that for a wetting process.
1. The “ink bottle” model illustrates the capillary condensationof porous solids theory, in which pores and capillaries fill andempty differently. Such a pore fills when the water activity
12

AquaLab VSA 3 THEORY
corresponding to the energy state of the larger radius is ex-ceeded, but empties only when the water activity drops belowthe energy state of the narrow neck radius.
2. A phase change of non-porous solids is illustrated by the factthat desorption from rubbery state can reach equilibrium fasterdue to increased molecular mobility, while adsorption into aglassy material can be slow due to restrictions in molecularmobility.
3. Structural changes within a solid matrix occur when the ma-terial swells and polar sites once obscured are now exposedto bind with water. For example, hydrated protein containsmany sites for water “binding” before desorption while dehy-drated protein has limited polar sites for water binding priorto adsorption.
4. Some solutes may supersaturate below their crystallization wa-ter activity (non-equilibrium condition) and thus, hold morewater as aw declines. Foods with high sugar content frequentlyexhibit this phenomenon.
Non-Equilibrium
If diffusion of water into (adsorption) or out of (desorption) a mate-rial is slow and you do not allow sufficient time for complete diffusion,then there is probably a large amount of apparent hysteresis that youcan reduce by allowing sample equilibration.
Matrix Changes
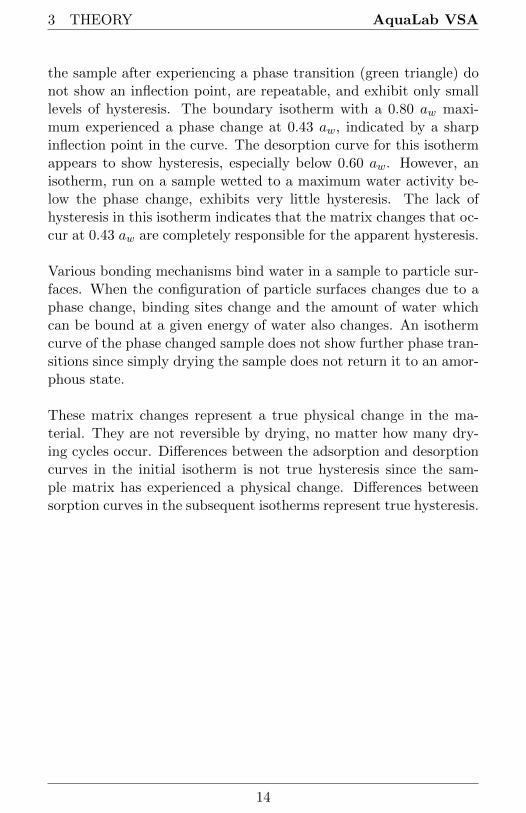
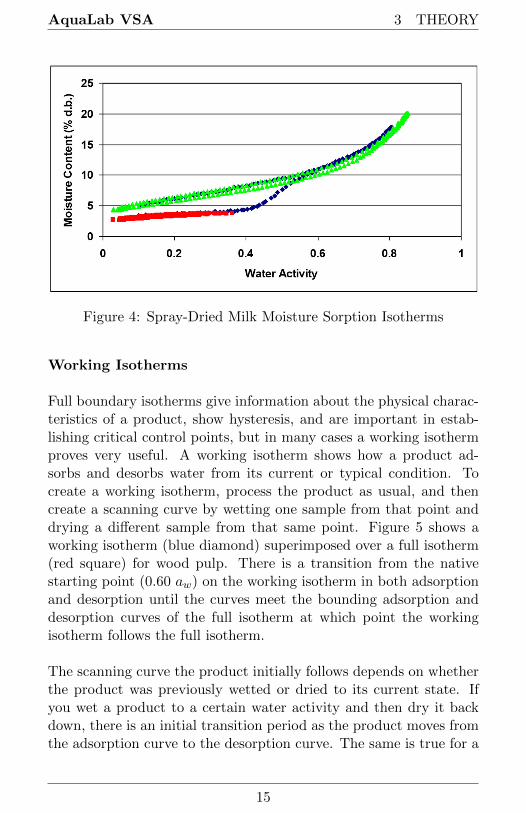
Figure 4 shows three different isotherm curves for spray-dried milkpowder, each with unique maximum water activities and differentsorption histories. The moisture sorption isotherms for spray-driedmilk powder show a change in hysteresis due to a phase change at0.43 aw. When the isotherm ends prior to the phase change at 0.43 aw(red square), there is little hysteresis. When the isotherm ends abovethe phase change (blue diamond), there is apparent, but not actualhysteresis due to the phase change. Subsequent isotherms run on
13
3 THEORY AquaLab VSA
the sample after experiencing a phase transition (green triangle) donot show an inflection point, are repeatable, and exhibit only smalllevels of hysteresis. The boundary isotherm with a 0.80 aw maxi-mum experienced a phase change at 0.43 aw, indicated by a sharpinflection point in the curve. The desorption curve for this isothermappears to show hysteresis, especially below 0.60 aw. However, anisotherm, run on a sample wetted to a maximum water activity be-low the phase change, exhibits very little hysteresis. The lack ofhysteresis in this isotherm indicates that the matrix changes that oc-cur at 0.43 aw are completely responsible for the apparent hysteresis.
Various bonding mechanisms bind water in a sample to particle sur-faces. When the configuration of particle surfaces changes due to aphase change, binding sites change and the amount of water whichcan be bound at a given energy of water also changes. An isothermcurve of the phase changed sample does not show further phase tran-sitions since simply drying the sample does not return it to an amor-phous state.
These matrix changes represent a true physical change in the ma-terial. They are not reversible by drying, no matter how many dry-ing cycles occur. Differences between the adsorption and desorptioncurves in the initial isotherm is not true hysteresis since the sam-ple matrix has experienced a physical change. Differences betweensorption curves in the subsequent isotherms represent true hysteresis.
14
AquaLab VSA 3 THEORY
Figure 4: Spray-Dried Milk Moisture Sorption Isotherms
Working Isotherms
Full boundary isotherms give information about the physical charac-teristics of a product, show hysteresis, and are important in estab-lishing critical control points, but in many cases a working isothermproves very useful. A working isotherm shows how a product ad-sorbs and desorbs water from its current or typical condition. Tocreate a working isotherm, process the product as usual, and thencreate a scanning curve by wetting one sample from that point anddrying a different sample from that same point. Figure 5 shows aworking isotherm (blue diamond) superimposed over a full isotherm(red square) for wood pulp. There is a transition from the nativestarting point (0.60 aw) on the working isotherm in both adsorptionand desorption until the curves meet the bounding adsorption anddesorption curves of the full isotherm at which point the workingisotherm follows the full isotherm.
The scanning curve the product initially follows depends on whetherthe product was previously wetted or dried to its current state. Ifyou wet a product to a certain water activity and then dry it backdown, there is an initial transition period as the product moves fromthe adsorption curve to the desorption curve. The same is true for a
15

3 THEORY AquaLab VSA
product that you previously dried and then wetted up. There is aninitial transition period as the product moves from the desorptioncurve to the adsorption curve. You can observe this transition re-gion at any point on the isotherm if you change the direction of thesorption and the product exhibits hysteresis. (Figure 5)
Figure 5: Working and Full Isotherm for Wood Pulp
Note: Please refer to Section 8.4 for information about running aworking isotherm using the VSA.
Isotherm Models
Several different isotherm models have been proposed and comparedin the literature. These models are necessary to predict the moisturecontent at a given water activity and are used to evaluate thermody-namic functions of water in foods. The models are necessary when us-ing isotherm methods with low data resolution to interpolate betweenisotherm data points. While there are 270 proposed isotherm models,the most commonly used models are the Guggenheim-Andersen-deBoer (GAB) and Brunauer-Emmett-Teller (BET). Since the BETmodel is only applicable up to 0.50 aw, the GAB model is widely
16
AquaLab VSA 3 THEORY
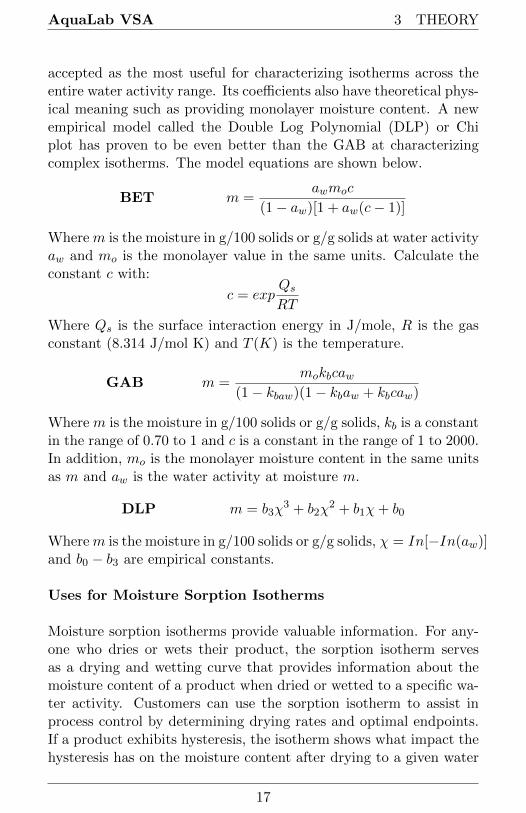
accepted as the most useful for characterizing isotherms across theentire water activity range. Its coefficients also have theoretical phys-ical meaning such as providing monolayer moisture content. A newempirical model called the Double Log Polynomial (DLP) or Chiplot has proven to be even better than the GAB at characterizingcomplex isotherms. The model equations are shown below.
BET m =awmoc
(1− aw)[1 + aw(c− 1)]
Wherem is the moisture in g/100 solids or g/g solids at water activityaw and mo is the monolayer value in the same units. Calculate theconstant c with:
c = expQs
RT
Where Qs is the surface interaction energy in J/mole, R is the gasconstant (8.314 J/mol K) and T (K) is the temperature.
GAB m =mokbcaw
(1− kbaw)(1− kbaw + kbcaw)
Where m is the moisture in g/100 solids or g/g solids, kb is a constantin the range of 0.70 to 1 and c is a constant in the range of 1 to 2000.In addition, mo is the monolayer moisture content in the same unitsas m and aw is the water activity at moisture m.
DLP m = b3χ3 + b2χ
2 + b1χ+ b0
Wherem is the moisture in g/100 solids or g/g solids, χ = In[−In(aw)]and b0 − b3 are empirical constants.
Uses for Moisture Sorption Isotherms
Moisture sorption isotherms provide valuable information. For any-one who dries or wets their product, the sorption isotherm servesas a drying and wetting curve that provides information about themoisture content of a product when dried or wetted to a specific wa-ter activity. Customers can use the sorption isotherm to assist inprocess control by determining drying rates and optimal endpoints.If a product exhibits hysteresis, the isotherm shows what impact thehysteresis has on the moisture content after drying to a given water
17

3 THEORY AquaLab VSA
activity.
An additional function of the isotherm is moisture content predic-tion. Although water activity is a much better predictor of safetyand quality than moisture content, there are times when it is neces-sary to know both water activity and moisture content as well as therelationship between the two parameters for a given product. Wa-ter content measurements can be inaccurate, time-consuming andrequire a precision balance. As an alternative to moisture contentmeasurement methods, you can use the sorption isotherm to deter-mine moisture content based on water activity, usually with betterprecision than actually running a moisture content analysis and inmuch less time.
Customers can utilize isotherms to determine the effect of temper-ature on water activity and moisture content readings. Isothermsconducted at several different temperatures show the temperature atwhich a product, in a sealed package (at constant moisture content),is at unstable water activity levels.
Isotherms can be very valuable for formulation and product devel-opment. By comparing the isotherms of different formulations, it ispossible to determine if a product can be adjusted to allow highermoisture content at a given water activity or a lower water activity ata given moisture content. The result can be a moister product thatis still shelf stable. For those producing multi-component products,it is possible using the isotherms of the two components to determinethe final water activity of the mixture without actually making theproduct. For dried products, the isotherm predicts the moisture con-tent of the product when it is dried to a shelf stable water activitylevel.
Finally, sorption isotherms are valuable for shelf life prediction. Youcan use the product isotherm to determine package requirements de-pending on the products sensitivity to moisture or to determine themonolayer moisture content, which represents the most stable stateof your product. The shape of the isotherm can provide informationabout the level of amorphous to crystalline material in a product.
18
AquaLab VSA 3 THEORY
Changes in the slope of the isotherm indicate phase transitions andcan provide information about critical water activities for maintain-ing texture properties and preventing caking and clumping. Youcan also determine the water activity value where the glass transi-tion temperature equals storage temperature or the crystallizationtemperature equals storage temperature.
19

4 GETTING STARTED AquaLab VSA
4 Getting Started
Components of VSA
The VSA requires a computer and software to generate and ana-lyze isotherm data. You can disconnect and connect the computeronce you begin a test without losing any data. Your VSA ships withthese items.
• The VSA Isotherm Generator main unit
• Operator’s Manual
• Quick Start Guide
• Calibration certificate / SDS certificates
• Power cord
• USB interface cable
• Two stainless steel sample cups
• Three refillable desiccant tubes
• One Decagon cleaning kit
• Two water bottles
• Three vials each of the following verification solution:
0.250 aw 13.41 mol/kg LiCl0.500 aw 8.57 mol/kg LiCl0.760 aw 6.00 mol/kg NaCl0.920 aw 2.33 mol/kg NaCl
• Moisture Analysis Toolkit Software Package with Registration Key
• One 2 g NIST traceable weight
• Tweezers
Note: Please keep your original instrument shipping box. If you everneed to return your VSA, you must ship it in the original packaging.
20
AquaLab VSA 4 GETTING STARTED
4.1 Instrument Setup
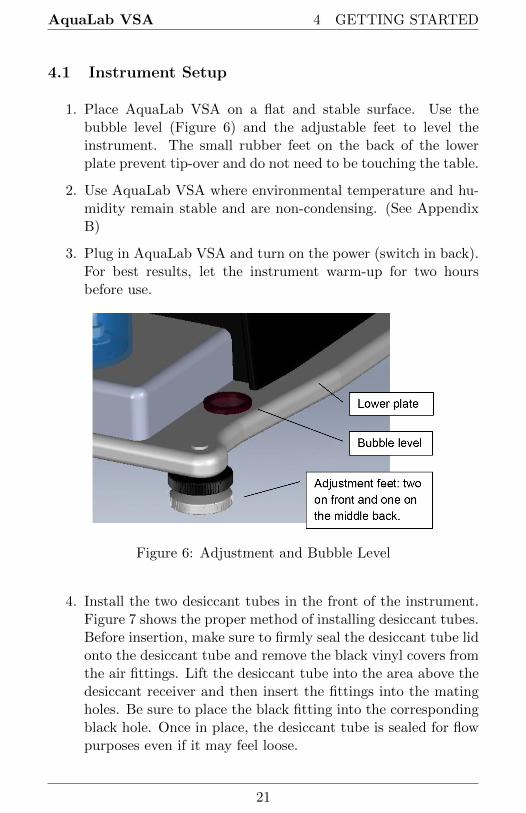
1. Place AquaLab VSA on a flat and stable surface. Use thebubble level (Figure 6) and the adjustable feet to level theinstrument. The small rubber feet on the back of the lowerplate prevent tip-over and do not need to be touching the table.
2. Use AquaLab VSA where environmental temperature and hu-midity remain stable and are non-condensing. (See AppendixB)
3. Plug in AquaLab VSA and turn on the power (switch in back).For best results, let the instrument warm-up for two hoursbefore use.
Figure 6: Adjustment and Bubble Level
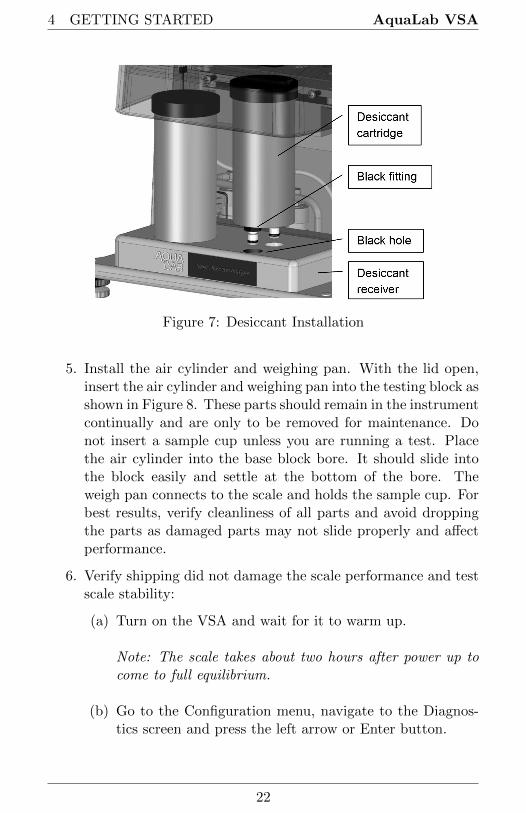
4. Install the two desiccant tubes in the front of the instrument.Figure 7 shows the proper method of installing desiccant tubes.Before insertion, make sure to firmly seal the desiccant tube lidonto the desiccant tube and remove the black vinyl covers fromthe air fittings. Lift the desiccant tube into the area above thedesiccant receiver and then insert the fittings into the matingholes. Be sure to place the black fitting into the correspondingblack hole. Once in place, the desiccant tube is sealed for flowpurposes even if it may feel loose.
21
4 GETTING STARTED AquaLab VSA
Figure 7: Desiccant Installation
5. Install the air cylinder and weighing pan. With the lid open,insert the air cylinder and weighing pan into the testing block asshown in Figure 8. These parts should remain in the instrumentcontinually and are only to be removed for maintenance. Donot insert a sample cup unless you are running a test. Placethe air cylinder into the base block bore. It should slide intothe block easily and settle at the bottom of the bore. Theweigh pan connects to the scale and holds the sample cup. Forbest results, verify cleanliness of all parts and avoid droppingthe parts as damaged parts may not slide properly and affectperformance.
6. Verify shipping did not damage the scale performance and testscale stability:
(a) Turn on the VSA and wait for it to warm up.
Note: The scale takes about two hours after power up tocome to full equilibrium.
(b) Go to the Configuration menu, navigate to the Diagnos-tics screen and press the left arrow or Enter button.
22

AquaLab VSA 4 GETTING STARTED
Figure 8: Sample Cup and Lower Block Assembly
(c) Scroll down, highlight Diagnostics and press the Enterbutton.
(d) Scroll down to the screen that shows the weight. Read-ings should vary no more than 0.5 mg, once the scale hasstabilized.
(e) Lightly tap the table with one finger. If the readings varymore than 0.5 mg after tapping, the table holding theVSA is probably too unstable for accurate weight read-ings during a test. You need to make the table more rigidor find another location for this equipment. Contact yourAquaLab distributor if the scale readings are unstable af-ter placing the unit on a stable structure.
7. Fill the water tank. Remove the black plug on the clear plastictank fill extension located on the back right of the VSA. (Fig-ure 9). Fill the tank with United States Pharmacopeia (USP)purified water until full to top. Reinstall the black plug oncefinished. The black plug should be hand tightened only.
8. Figure 9 shows the location of a filter that you must removeand blow out from time to time when dust builds up on it.The housing around the filter is a snap on housing that you
23

4 GETTING STARTED AquaLab VSA
Figure 9: Tank Fill Extension
can easily remove.
9. Use the water tank drain plug to remove the water from thewater tank.
Note: Have a receptical ready to catch the water flow.
24

AquaLab VSA 5 USER INTERFACE AND MENUS
5 User Interface and Menus
The AquaLab VSA is a stand-alone instrument with arrows and threebuttons useful for navigating menus and beginning tests. There arefour tabs at the top of the display screen, the Isotherm, Measurement,Configuration, and Data tabs. These tabs indicate the four menusyou can access. To change between the tabs press the right mostbutton below the Menu icon. The Enter icon is the Read or Enterbutton.
5.1 Isotherm Tab
The Isotherm tab is the main screen and displays each time youturn on your VSA. If the Isotherm tab screen does not appear, re-fer to Section 11 for troubleshooting. Operators can initiate a newtest from this screen by pressing the wizard icon (third button fromright). If a test is already running, this screen displays the latesttest values including water activity, weight or % moisture contentand temperature. Pressing the second button activates the chartview.
5.2 Measurement Tab
The Measurement tab allows you to take water activity readings ofthe sample in the sample chamber when not running a test. Pushingthe right or left arrow keys changes the display to a temperatureequilibration screen that shows the temperature difference betweenthe sample temperature and the lid temperature.
25

5 USER INTERFACE AND MENUS AquaLab VSA
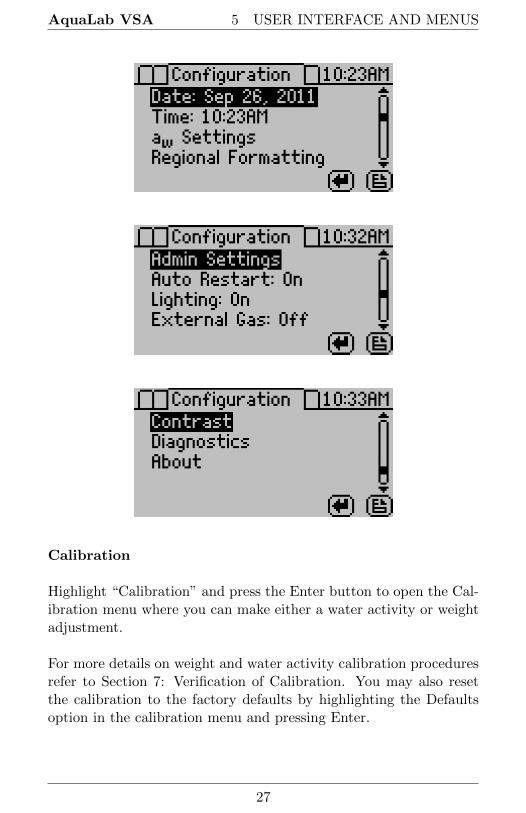
5.3 Configuration Tab
The Configuration tab allows the operator to view various configu-ration options. Pressing the up and down arrows moves through theconfiguration options, while pressing the right and left arrows allowthe operator to page through the options.
26
AquaLab VSA 5 USER INTERFACE AND MENUS
Calibration
Highlight “Calibration” and press the Enter button to open the Cal-ibration menu where you can make either a water activity or weightadjustment.
For more details on weight and water activity calibration proceduresrefer to Section 7: Verification of Calibration. You may also resetthe calibration to the factory defaults by highlighting the Defaultsoption in the calibration menu and pressing Enter.
27

5 USER INTERFACE AND MENUS AquaLab VSA
Volatiles
The instrument gives accurate readings on most samples when thedefault volatiles setting is “Off.” When reading with volatiles offthe chilled mirror method is used by default. However, samples withcertain volatiles in high enough concentrations may give inaccuratewater activity values. This is because the volatiles condense on themirror during the reading process, but do not evaporate from themirror as water does. The concentration of volatiles that causes in-terference is variable and matrix dependent.
The most effective method to determine if volatiles are a problemis to compare dew point readings to capacitance readings. If the dewpoint readings are more than 0.02 higher than the capacitance read-ings, volatiles are likely a problem and it is recommended that thevolatiles setting be switched to On. When you turn the volatiles set-ting on, the instrument only uses the capacitive relative humidity sen-sor for water activities measurements and isotherm tests. All otheroperations and features are the same, including measurement timesand adjusting for linear offset. Press Enter to toggle the volatilessetting on and off.
Weight Reference
Weight reference is the reference used when calculating the percentchange in weight of the sample. This can be based on the initialweight of the test, the starting weight of the stage or the minimumweight during the test. Use this reference anytime you are calculat-ing a percent weight.
28

AquaLab VSA 5 USER INTERFACE AND MENUS
Basis
The VSA generates water activity values and corresponding sam-ple weights during moisture desorption and resorption. To completethe isotherm, the sample weights must be translated into moisturecontents. Moisture content can be calculated in different ways andreported with a variety of different units. The basis parameter al-lows the reporting of moisture content in two different ways, percentmoisture on a wet basis and percent moisture on a dry basis.
Percent Moisture on a Wet Basis (%wb, g/100g total)
%Moisture =initial weight− final weight
initial weight× 100 =
grams of water
100 grams total
Percent Moisture on a Dry Basis (%db, g/100g solids)
%Moisture =initial weight− final weight
final weight× 100 =
grams of water
100 grams total
For food applications, moisture contents are reported on a wet basis.A simple equation converts between the wet and dry basis.
%moisture dry =%moisture wet
100−%moisture wet× 100
%moisture wet =%moisture dry
100 + %moisture dry× 100
Date
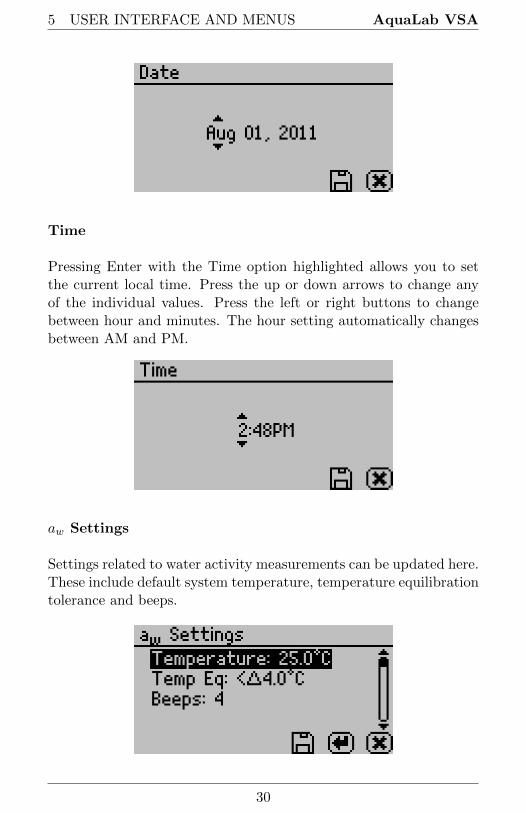
The VSA has an internal calendar and clock that allow it to recordthe time and date of each water activity reading. Press Enter withthe Date option highlighted to set the date in the instrument. Pressthe left and right arrows to change between the month, day and year.Press the up or down arrows to change any of the individual values.
29
5 USER INTERFACE AND MENUS AquaLab VSA
Time
Pressing Enter with the Time option highlighted allows you to setthe current local time. Press the up or down arrows to change anyof the individual values. Press the left or right buttons to changebetween hour and minutes. The hour setting automatically changesbetween AM and PM.
aw Settings
Settings related to water activity measurements can be updated here.These include default system temperature, temperature equilibrationtolerance and beeps.
30

AquaLab VSA 5 USER INTERFACE AND MENUS
Temperature
This setting determines the temperature that the instrument main-tains during water activity measurements. It is also the temperaturethat the instrument returns to after completing a test. The defaulttemperature is 25 ◦C. Press the Enter button to change the temper-ature setting. You can set the VSA anywhere between 15 and 60 ◦Cin 0.1 ◦C intervals. Use the up and down arrows to set the VSA toyour desired temperature.
Temp Eq
Temperature Equilibration Tolerance or “Temp Eq” sets the max-imum difference allowed between the lid and the sample. This lidto sample temperature difference must be less than the Temp Eq inorder to start a water activity measurement. If a sample is out of thisrange, the VSA waits for the sample to equilibrate prior to beginningthe water activity measurement. 4 ◦C is the default setting.
Beeps
Indicates the number of audible beeps after a water activity measure-ment is completed. You can set this value to off (0), 4, or infinity (∞).
Regional Formatting:
Allows you to configure how the VSA displays information. Youmay choose the temperature scale (Celsius vs Fahrenheit), the datedisplay (mm/dd/yy vs. dd/mm/yy), the hour format (12 vs 24 hour)and the language. Press Enter to switch the setting.
31

5 USER INTERFACE AND MENUS AquaLab VSA
Admin Settings
Allows you to create an administrator password as well as add, editand delete additional users. The Admin option allows the admin-istrator to grant or block access to some or all of the configurationoptions. For example, if the administrator wanted to make sure thatall samples were read at 25 ◦C the administrator would set theirtemperature to 25 ◦C and then would lock all other users out of thatConfiguration screen. This is accomplished by entering the Accessfunction and selecting the desired option to toggle it on and off. Ad-ditionally you can lock and unlock all of them at once. (For example,if you do not want an individual changing the instrument measure-ment temperature, the administrator can lock that function for thatindividual.) Administrators can lock the calibration, temperature,temperature equilibration, sensor selection, mode, date/time, region,password, auto-save, number of beeps, contrast, and delete functions.
User Setup
Users can be added, edited or deleted from this screen. To add auser, press the Enter button with the “New” highlighted. To edit ordelete a user, choose the target user and press Enter. When creatinga new user, an alphabet screen appears where you can enter a nameusing lower case, upper case and accents.
32
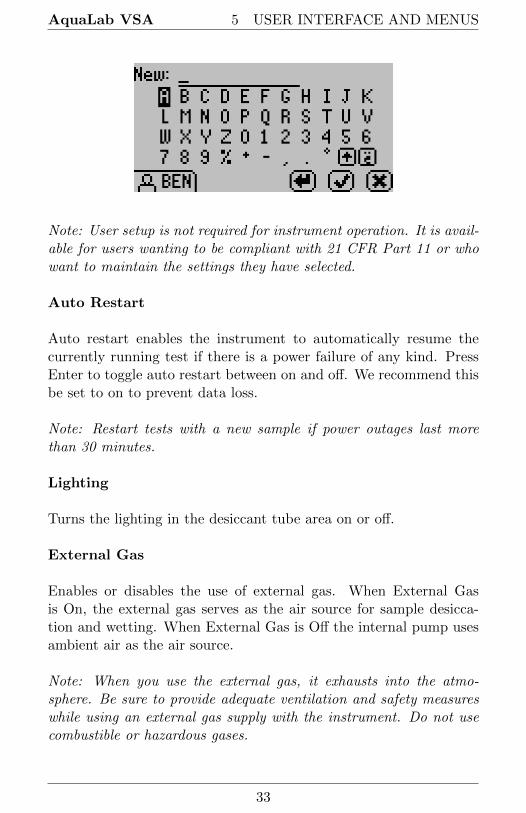
AquaLab VSA 5 USER INTERFACE AND MENUS
Note: User setup is not required for instrument operation. It is avail-able for users wanting to be compliant with 21 CFR Part 11 or whowant to maintain the settings they have selected.
Auto Restart
Auto restart enables the instrument to automatically resume thecurrently running test if there is a power failure of any kind. PressEnter to toggle auto restart between on and off. We recommend thisbe set to on to prevent data loss.
Note: Restart tests with a new sample if power outages last morethan 30 minutes.
Lighting
Turns the lighting in the desiccant tube area on or off.
External Gas
Enables or disables the use of external gas. When External Gasis On, the external gas serves as the air source for sample desicca-tion and wetting. When External Gas is Off the internal pump usesambient air as the air source.
Note: When you use the external gas, it exhausts into the atmo-sphere. Be sure to provide adequate ventilation and safety measureswhile using an external gas supply with the instrument. Do not usecombustible or hazardous gases.
33

5 USER INTERFACE AND MENUS AquaLab VSA
To turn external gas on, highlight “External Gas: Off” and pressEnter. The External Gas screen appears.
To start using external gas, remove the external gas plug from theback of the VSA and insert the desired gas source. Adjust the ex-ternal gas pressure until it is between 5 and 35 kPa (0.7 to 5 psi).The VSA hides the Check Mark until the gas is within the accept-able pressure range. Press the Check Mark to enable external gas orescape to cancel.
Note: When selecting a gas source, choose a gas supply with a filtersystem that eliminates oil and other particulates to help prolong thelife of your VSA. Make sure to keep the external gas plug to use whenyou remove the external gas source.
If the external gas is turned on in the Configuration tab and youwant to turn it off, pressing enter causes the External Gas screen toappear.
To stop using external gas, turn off the external gas source and re-move the external gas tubing and adapters from the back of the in-strument. Reinstall the external gas plug and then press the Check
34

AquaLab VSA 5 USER INTERFACE AND MENUS
Mark to disable external gas or the X to return to the Configurationtab without changing the setting.
Contrast
Allows you to set the contrast of the screen to your liking. View-ing the screen from a sitting versus a standing position may requirecontrast adjustment for the best visibility in that position.
Diagnostics
The Diagnostics screen provides you with detailed information aboutall the sensors in the instrument. Refer to the Troubleshooting sec-tion for details on what kind of values you should expect for eachsensor. Press up or down to page between the different Diagnosticsscreens.
The scale icon on the bottom of the second screen allows you to zerothe balance so that you can take weight readings via the diagnosticscreen. The icon labeled “Act” toggles the actuator system on andoff. With the lid open, pressing this button causes the weigh pan andactuator cylinder to alternatively rise and fall if working properly.
35

5 USER INTERFACE AND MENUS AquaLab VSA
On startup, the pump is turned on and flows dry air into the cham-ber to monitor the desiccating capacity of the tubes. The numberbutton on the bottom screen allows you to switch between the twodesiccant tubes. If you press the number button with the arrow tothe left, it switches to the left desiccant tube (#1). If you press thenumber button with the arrow to the right, it switches to the rightdesiccant tube (#2). Any time you press the desiccant tube button,the pump turns on and blows dry air into the chamber to monitorthe desiccating capacity of the tubes.
The weight calibration value is the current calibration applied tobalance readings. A value of one means no weight calibration isapplied. The dew point and capacitance RH sensor offset values arethe current linear offsets applied to water activity readings for therespective sensor type. A value of zero means that the VSA appliedno water activity offset.
36
AquaLab VSA 5 USER INTERFACE AND MENUS
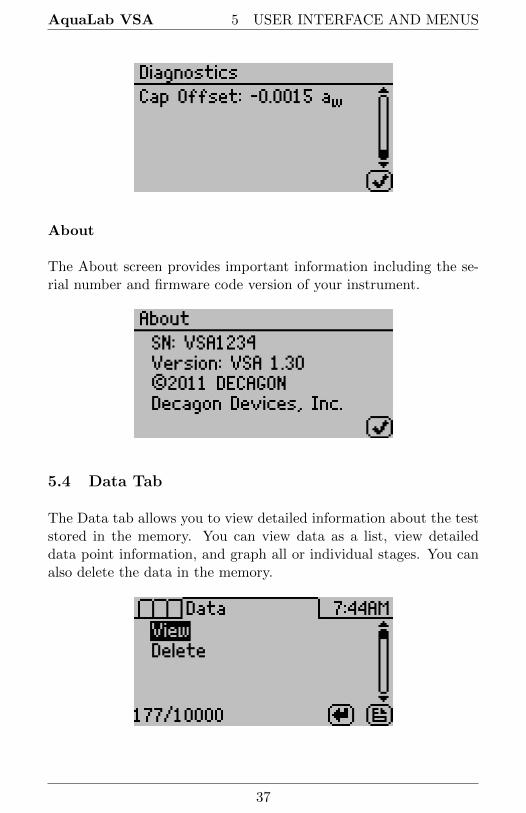
About
The About screen provides important information including the se-rial number and firmware code version of your instrument.
5.4 Data Tab
The Data tab allows you to view detailed information about the teststored in the memory. You can view data as a list, view detaileddata point information, and graph all or individual stages. You canalso delete the data in the memory.
37

5 USER INTERFACE AND MENUS AquaLab VSA
View
This selection brings you to a screen where you can decide how youwant to view your data. You can choose to view your whole test atonce by selecting All or you can view an individual stage. Once thedesired portion of the test is selected, you can then choose to graphthe data by pressing the graph icon or by pressing the enter icon toview summary information of each data record. See Section 9 forinformation about downloading test data to a computer.
Graph Screen
This selection shows a graph of the selected data from the previ-ous screen. Press the directional arrows to change the y or x-axisunits. The title of this graph indicates the test name, stage number(if applicable), and the isotherm type is on the right.
Example of a graph with water activity as the x-axis.
Example of a graph with elapsed time as the x-axis.
38

AquaLab VSA 5 USER INTERFACE AND MENUS
Note: For DVS isotherms, if water activity is the x-axis, only equili-brated data points appear on the chart. To view all the data points,the x-axis must be in terms of the time elapsed.
Summary Screen
This selection allows you to view your stored measurements. Theup/down arrows move you through the stored data with the mostrecent measurements at the top of the table. You may also press theleft and right arrows to page quickly through the data. While on theSummary screen, press the Enter button on a highlighted reading toget detailed information on the reading in the Data screen.
The information shown is the water activity of the sample, the tem-perature, the test time, the user who ran the test (if setup), the dateof the reading, the sensor used, the time of the reading, and the se-quence number of the stored reading.
Delete
Selecting this option deletes all of the information currently stored
39

5 USER INTERFACE AND MENUS AquaLab VSA
in the instrument.
Note: You are not able to recover deleted data so make sure youhave backed up your data to the computer using the Moisture Anal-ysis Toolkit software package prior to deleting the data from the in-strument.
40
AquaLab VSA 6 CLEANING AND MAINTENANCE
6 Cleaning and Maintenance
6.1 Desiccant Cartridge Desiccant Replacement
1. Removal of the desiccant material
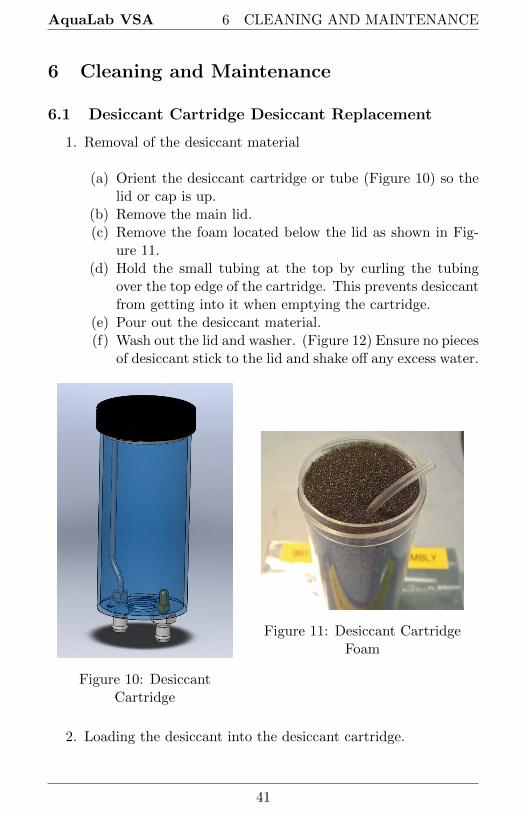
(a) Orient the desiccant cartridge or tube (Figure 10) so thelid or cap is up.
(b) Remove the main lid.(c) Remove the foam located below the lid as shown in Fig-
ure 11.(d) Hold the small tubing at the top by curling the tubing
over the top edge of the cartridge. This prevents desiccantfrom getting into it when emptying the cartridge.
(e) Pour out the desiccant material.(f) Wash out the lid and washer. (Figure 12) Ensure no pieces
of desiccant stick to the lid and shake off any excess water.
Figure 10: DesiccantCartridge
Figure 11: Desiccant CartridgeFoam
2. Loading the desiccant into the desiccant cartridge.
41
6 CLEANING AND MAINTENANCE AquaLab VSA
(a) Orient the desiccant tube so the opening is upward.(b) Hold the tubing to the side of the cartridge and looped
over the edge of the cartridge.(c) Fill the desiccant to the top of the cartridge.(d) Shake or vibrate the desiccant cartridge to settle the ma-
terial.(e) The top of the desiccant should be about 0.1 inches from
the cartridge rim. If not, add more desiccant and settleuntil it reaches 0.1 inches.
(f) Place in the foam at the top.(g) Place the small tubing across the filter and through the
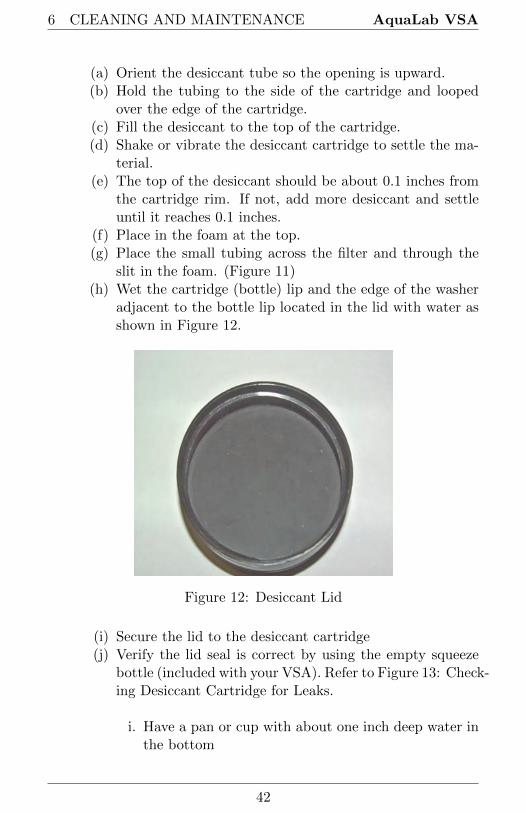
slit in the foam. (Figure 11)(h) Wet the cartridge (bottle) lip and the edge of the washer
adjacent to the bottle lip located in the lid with water asshown in Figure 12.
Figure 12: Desiccant Lid
(i) Secure the lid to the desiccant cartridge(j) Verify the lid seal is correct by using the empty squeeze
bottle (included with your VSA). Refer to Figure 13: Check-ing Desiccant Cartridge for Leaks.
i. Have a pan or cup with about one inch deep water inthe bottom
42

AquaLab VSA 6 CLEANING AND MAINTENANCE
ii. Hold one finger over the output fittingiii. Pressurize the desiccant tube using the pressure bot-
tle as shown in the figure 13.
Note: the bottle just needs to be squeezed with air init, do not put water into the squeeze bottle.
iv. Place the desiccant tube with the lid into the water.If the lid is not sealed, the water could flow into thedesiccant cartridge. Hold the tube in the water onlyas long as needed to verify the test.
v. Look for bubbles escaping from the lid. A large num-ber of bubbles indicates the lid is not sealed. Youmust remove the lid and reset the washer. Lubricatethe washer with water and put the lid back.
(k) When you place the desiccant cartridge into the desiccantreceiver, you should wet the o-rings on the fittings for easeof installation and to reduce wear. Be sure to align theblack fitting with the black ringed hole before insertion toensure a proper seal.
AquaLab uses a 10 to 20 mesh indicating drierite as the desiccant.Indicating drierite is not required but the size of a replacement des-iccant must be 10 to 20 mesh.
43

6 CLEANING AND MAINTENANCE AquaLab VSA
Figure 13: Checking Desiccant Cartridge for Leaks
44

AquaLab VSA 6 CLEANING AND MAINTENANCE
6.2 Cleaning the Testing Chamber
Keeping your VSA clean is vital to maintaining the accuracy of yourinstrument. Dust and sampling debris can contaminate the samplingchamber and must be regularly cleaned out.
Purpose
The cleaning procedure removes grease, dirt and other soluble sub-stances that can absorb or release water during verification, calibra-tion, and sample testing. The mirror must be clean for a smoothand even dew formation. Any contaminants (e.g. fingerprints) onthe mirror can cause the dew to form unevenly and affect the accu-racy of the reading.
When to Clean
The instrument should be cleaned if visual inspection indicates thechamber is dirty or as instructed in the verification flowchart. (Fig-ure 15) We recommend cleaning before each new isotherm test.
Required Cleaning Materials
• A thin plastic rod or other non-metal implement• USP Purified Water• Isopropyl Alcohol (IPA) or AquaLab Cleaning Solution• Kimwipes R©
You may also purchase the AquaLab Cleaning Kit which comes withall the above materials except the Isopropyl Alcohol. The materialsin the kit should last for about one year.
Before you begin
Cleaning your VSA is a multi-step procedure which involves washing,rinsing, and drying for each area. Section 6.3 outlines the cleaningsteps.
Wash your hands with soap and water and use clean lab gloves before
45

6 CLEANING AND MAINTENANCE AquaLab VSA
starting the cleaning procedure. This prevents oils from contaminat-ing the cleaning materials, the sample chamber and the sensors.
Accessing the Sample Chamber
Turn the power off on your AquaLab VSA. If latched, move thelever over to the open position. Lift the chamber cover to expose theVSA sample chamber and sensors. The sample chamber consists ofall surfaces within the red o-ring when the lid is closed.
Follow the cleaning procedures and do not get cleaning solution or al-cohol on the capacitance sensor filter. Repeated exposure of cleaningmaterials or contaminants to the filter may cause inaccurate read-ings. If the filter appears to be contaminated, it may need to bereplaced. (To replace the capacitance sensor filter, use tweezers or asmall knife blade to pry up the edge of the filter, being careful not todisturb the sensor beneath. Discard the soiled filter and with cleanor gloved hands press a new filter into place.)
Figure 14: Sample Chamber Breakdown
46

AquaLab VSA 6 CLEANING AND MAINTENANCE
6.3 Cleaning Procedures
Visit www.aqualab.com/cleaning for a cleaning video tutorial
1. Cleaning the Sample Chamber
Note: Be extremely careful not to damage the fan blades (Fig-ure 14) when cleaning the chamber.
(a) Remove any debris that may have collected within oraround the sample chamber.
(b) Wrap a NEW Kimwipe around the end of the spatula(thin plastic rod) and moisten it with Decagon CleaningSolution.
Note: Do not dip a used Kimwipe into your cleaning so-lution (the cleaning solution can become contaminated).
(c) WASH — Clean upper chamber, o-ring, and all surfacesof the block within the o-ring. You may need to replacethe Kimwipe if it becomes too dirty during this process.
(d) Clean lower block with a fresh Kimwipe. Be sure to cleanthe entire block surface.
(e) RINSE — Repeat steps b through d using new Kimwipeswith USP Purified water.
(f) DRY — Repeat steps b through d using new, dry Kimwipesto help remove any moisture remaining from the cleaning.
Note: Do not reuse Kimwipes.
(g) Visually inspect the sample chamber for cleanliness. Re-clean if necessary.
2. Clean the Mirror
(a) Wrap a new Kimwipe around the end of the spatula andmoisten it with Decagon Cleaning Solution.
(b) WASH — Swipe the moistened Kimwipe across the mir-ror once. (A single swipe is usually sufficient to remove
47
6 CLEANING AND MAINTENANCE AquaLab VSA
contaminants.)(c) RINSE — Repeat steps a and b using new Kimwipes
moistened with USP Purified water instead of cleaningsolution.
(d) DRY — Repeat steps a and b using a new, dry Kimwipesto help remove any moisture remaining from the cleaning.
(e) Visually inspect the mirror for cleanliness. Clean again ifnecessary.
3. Clean the Thermopile and Optical Sensor
(a) Wrap a new Kimwipe around the end of the spatula andmoisten it with Decagon Cleaning Solution.
(b) WASH — Swipe the moistened Kimwipe across thermopileand optical sensor. (A single swipe across the sensor isusually sufficient to remove contaminants.)
(c) RINSE — Repeat steps a and b using new Kimwipesmoistened with USP Purified water instead of cleaningsolution.
(d) DRY — Repeat steps a and b, but use a new, dry Kimwipeto help remove any moisture remaining from the cleaning.
(e) Visually inspect the thermopile and optical sensor for clean-liness. Clean again if necessary.
4. Additional Drying Time
(a) Visually inspect the sample chamber and sensors for con-taminants, including moisture. If necessary, repeat thecleaning process using new Kimwipes.
(b) Leave the chamber open for about five minutes to ensurethe sample chamber is dry.
48

AquaLab VSA 7 VERIFICATION OF CALIBRATION
7 Verification of Calibration
After you have cleaned the chamber and other parts of your VSA, itis important to check the instrument performance in order to correctfor any linear offset that may have occurred.
Before you check the instrument we recommend that you measure asample of the activated charcoal pellets provided in your VSA clean-ing kit from the Measurement Tab. This cleans the air inside thechamber, helping it come back to a stable sampling environment. Itis important to verify VSA water activity calibration against knownstandards to guarantee optimal performance and accuracy. AquaLabrecommends verification before running a new isotherm test.
7.1 Water Activity Verification
AquaLab VSA uses both a capacitance relative humidity sensor anda chilled-mirror dew point technique to determine water activity. Ifyou set volatiles to yes as described in Section 5, the VSA performswater activity verification on the capacitance sensor only. If you setvolatiles to no, the VSA verifies the dew point sensor. While theinstrument does not require a routine full calibration, it is importantto verify for linear offset periodically. The components used by theinstrument to measure water activity are subject to contaminationwhich may affect VSA performance. When this occurs, it changesthe accuracy of the instrument. This is what is called a “linear off-set.”
Therefore, frequent verification assures the VSA is performing cor-rectly. You can check linear offset by using two different verificationstandards.
49

7 VERIFICATION OF CALIBRATION AquaLab VSA
7.2 Verification Standards
Decagon’s verification standards are specially prepared unsaturatedsalt solutions that have a specific molality and water activity valuewhich are accurately measurable. For the most accurate verificationof your VSA performance, we only recommend the verification stan-dards manufactured by Decagon Devices.
Performance verification standards come in six water activity lev-els: and 0.250, 0.500, 0.760, 0.920, 0.984, and 1.000 aw. We producethese standards under a strict quality assurance regime. Please con-tact Decagon Devices to order additional standards or order themvia the web at http://www.aqualab.com/reorder.
Note: To avoid inaccurate water activity readings, verification stan-dards should be used once immediately after opening and not storedin sample cups for repeated use.
Table 1: Verification Flowchart
Verification Standard @ 25 ◦C Water Activity
13.41 mol/kg LiCl 0.250 ±0.0058.57 mol/kg LiCl 0.500 ±0.0056.00 mol/kg NaCl 0.760 ±0.0052.33 mol/kg NaCl 0.920 ±0.005
Note: If you need to obtain a Safety Data Sheet (SDS) for any ofthese standards, a printable version is available on our website athttp://www.decagon.com/education/safety-data-sheets/.
Although distilled water and the 0.984 standard are available as averification standard, Decagon does not recommend using them withthe AquaLab VSA.
To use a verification standard, remove the twist top and pour thecontents into one of the stainless steel sample cups. Customers canfind information about standard values and molality printed on theoutside of the plastic vial.
50
AquaLab VSA 7 VERIFICATION OF CALIBRATION
7.3 When to Verify for Linear Offset
Check the linear offset against two known verification standards be-fore running a new isotherm test. Never verify the linear offset solelyagainst a single standard, since it does not give an accurate rep-resentation of the linear offset. For best results, conduct the VSAwater activity verification using the 0.25 aw and 0.76 aw standards.Checking the water activity of a standard solution can alert you tothe possibility of unit contamination or shifts in the linear offset fromother causes.
Note: The verification process is the same whether you set the volatilesto yes or no, except that the accuracy for the capacitance sensor is±0.020 aw.
Verification
Use steps 1 through 10 to verify for linear offset of your VSA. (Referto the Measure Verification Flowchart in Figure 15)
1. From the Isotherm Tab, navigate to the Measurement tab bypressing the Enter button.
2. Choose a 0.25 aw standard.
3. Remove the weighing pan.
4. Empty a vial of solution into the stainless steel sample cupand place it in the VSA testing chamber. Make sure that yourstandard is as close to the instrument temperature as possible.(Section 5.2)
Note: Make sure the rim and outside of the sample cup areclean.
5. Carefully close the lid and move the lever to the READ posi-tion.
6. Take two readings. The water activity readings should bewithin ±0.005 aw of the given value for the verification stan-dard. See Appendix A for the correct water activity value of
51

7 VERIFICATION OF CALIBRATION AquaLab VSA
Decagons standards at temperatures other than 25 ◦C.
7. If your VSA is reading within ±0.005 aw of the verificationstandard, choose a 0.76 aw standard.
8. Prepare a sample cup of the second verification standard andmake two readings. The second water activity reading for thesecond verification standard should be within ±0.005 aw.
9. If either of the verification standards is not correct, it is prob-ably due to contamination of the sensor chamber. See Section6 for cleaning instructions. After cleaning, repeat verificationfrom step two.
10. If you are consistently getting readings outside the water activ-ity of your first verification standard by more than ±0.005 aw,a linear offset has probably occurred. In this case, adjust thereading to match the correct value of the verification standardsthis section outlines.
Figure 15: Measure Verification Standard Flowchart
52
AquaLab VSA 7 VERIFICATION OF CALIBRATION
Adjust for Linear Offset for Water Activity
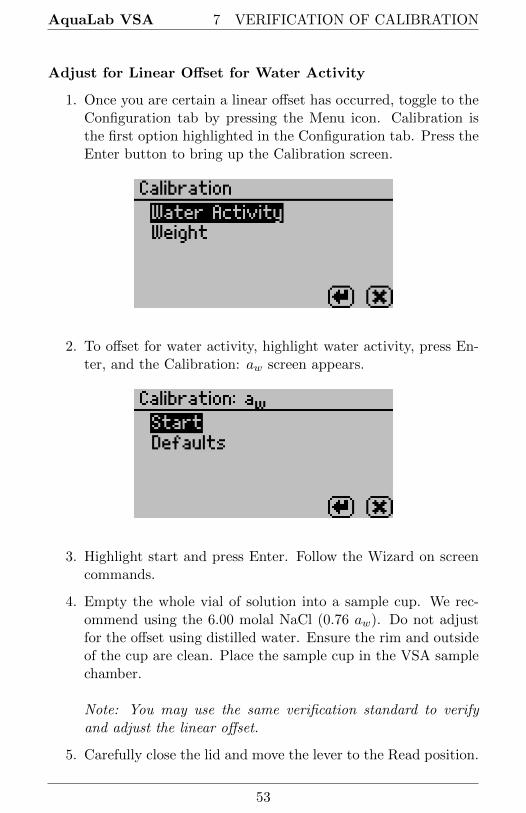
1. Once you are certain a linear offset has occurred, toggle to theConfiguration tab by pressing the Menu icon. Calibration isthe first option highlighted in the Configuration tab. Press theEnter button to bring up the Calibration screen.
2. To offset for water activity, highlight water activity, press En-ter, and the Calibration: aw screen appears.
3. Highlight start and press Enter. Follow the Wizard on screencommands.
4. Empty the whole vial of solution into a sample cup. We rec-ommend using the 6.00 molal NaCl (0.76 aw). Do not adjustfor the offset using distilled water. Ensure the rim and outsideof the cup are clean. Place the sample cup in the VSA samplechamber.
Note: You may use the same verification standard to verifyand adjust the linear offset.
5. Carefully close the lid and move the lever to the Read position.
53

7 VERIFICATION OF CALIBRATION AquaLab VSA
Press the Enter button to begin testing.
Note: If you decide at this point not to continue with the linearoff set program, just return the lever to the Open position orselect the X to return to the previous screen.
6. After your VSA finishes measuring the verification standard, itdisplays the test value.
7. Press the up and down arrows to adjust the water activityreading to its proper value for the your particular verificationstandard. When the VSA displays the correct value, press En-ter to store this new value. Cancel and return to the mainmenu to make no changes.
8. Measure the verification standard again on the MeasurementTab. It should read the proper value (within ±0.005 aw) at agiven temperature for your particular standard (see AppendixA for temperatures other than 25 ◦C).
9. Measure the water activity of a second verification standardaccording to the verification procedure described above. If bothverification readings are within ±0.005 aw then the instrumentis ready to begin testing.
If you still have incorrect verification standard readings after clean-ing the chamber and adjusting for linear offset, contact AquaLab byemail at [email protected] or by phone at 509-332-5601 for fur-ther instructions. If you purchased your AquaLab instrument fromone of our international distributors, please contact them for localservice and support.
Verifying Weight Measurement
The VSA uses a magnetic force balance to gravimetrically track theweight of the sample during the isotherm test. We verify the perfor-mance of this balance against a NIST traceable two gram standardweight. This two gram weight ships with the VSA and should behandled with tweezers and not bare skin.
54
AquaLab VSA 7 VERIFICATION OF CALIBRATION
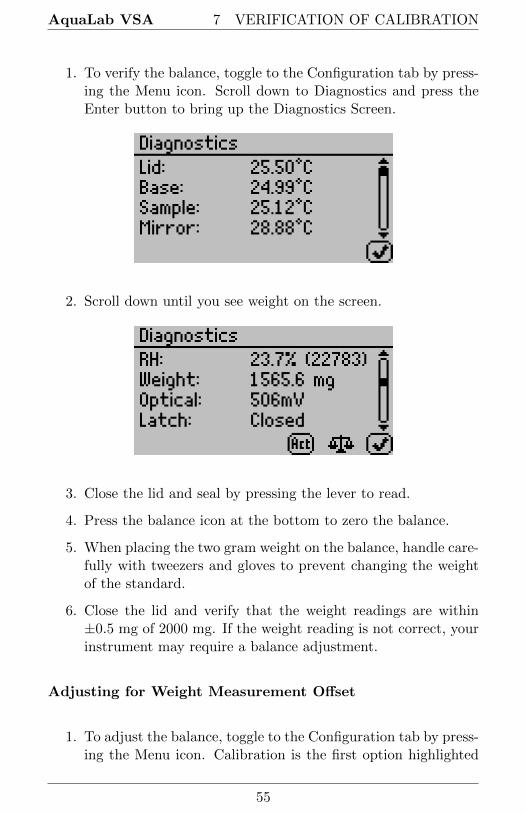
1. To verify the balance, toggle to the Configuration tab by press-ing the Menu icon. Scroll down to Diagnostics and press theEnter button to bring up the Diagnostics Screen.
2. Scroll down until you see weight on the screen.
3. Close the lid and seal by pressing the lever to read.
4. Press the balance icon at the bottom to zero the balance.
5. When placing the two gram weight on the balance, handle care-fully with tweezers and gloves to prevent changing the weightof the standard.
6. Close the lid and verify that the weight readings are within±0.5 mg of 2000 mg. If the weight reading is not correct, yourinstrument may require a balance adjustment.
Adjusting for Weight Measurement Offset
1. To adjust the balance, toggle to the Configuration tab by press-ing the Menu icon. Calibration is the first option highlighted
55
7 VERIFICATION OF CALIBRATION AquaLab VSA
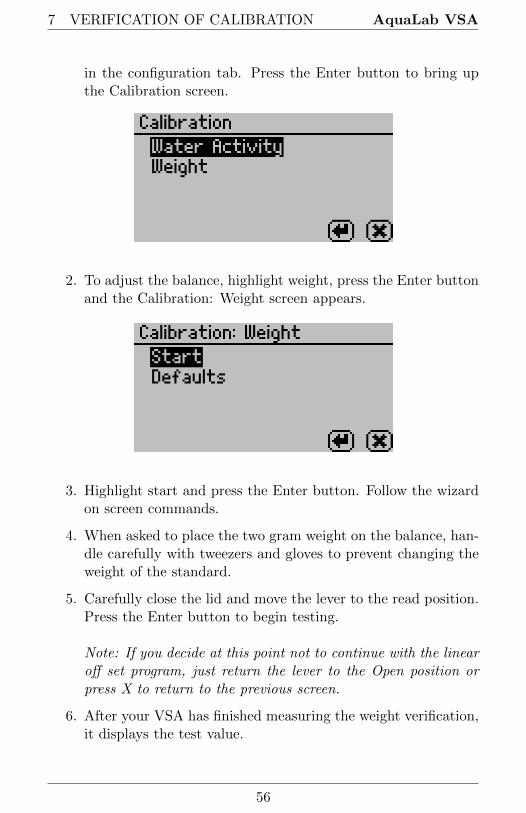
in the configuration tab. Press the Enter button to bring upthe Calibration screen.
2. To adjust the balance, highlight weight, press the Enter buttonand the Calibration: Weight screen appears.
3. Highlight start and press the Enter button. Follow the wizardon screen commands.
4. When asked to place the two gram weight on the balance, han-dle carefully with tweezers and gloves to prevent changing theweight of the standard.
5. Carefully close the lid and move the lever to the read position.Press the Enter button to begin testing.
Note: If you decide at this point not to continue with the linearoff set program, just return the lever to the Open position orpress X to return to the previous screen.
6. After your VSA has finished measuring the weight verification,it displays the test value.
56

AquaLab VSA 7 VERIFICATION OF CALIBRATION
7. Press Save to adjust to the correct value. To cancel and returnto the main menu, press the Cancel button and no changes bemade.
If you continue to have problems with weight readings, contact AquaLabby email at [email protected] or by phone at 509-332-5601 forfurther instructions. If you purchased your AquaLab instrumentfrom one of our international distributors, please contact them forlocal service and support.
How to Restore Factory Defaults
Follow steps 1 through 4 to restore original calibration settings
1. Toggle to the Configuration tab by pressing the Menu icon.Select Calibration and press the Enter button.
2. Select water activity or weight, depending on which defaultsyou want to restore and press Enter.
3. Scroll down to Defaults and press the Enter button to accessthe Restore Factory Defaults routine. To cancel and returnto the main menu, select the Cancel icon. After selecting theEnter icon, the Calibration: aw screen prompts you to reset todefaults.
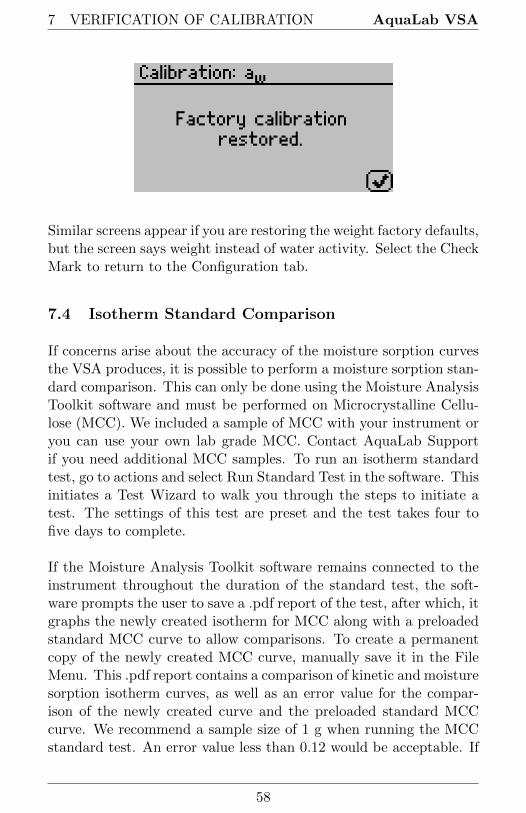
4. To restore the factory calibration values, press the Check Mark.To cancel and return to the main menu, press the Cancel but-ton. After pressing the Check Mark, the Calibration: aw screenverifies that VSA has restored the factory calibration.
57
7 VERIFICATION OF CALIBRATION AquaLab VSA
Similar screens appear if you are restoring the weight factory defaults,but the screen says weight instead of water activity. Select the CheckMark to return to the Configuration tab.
7.4 Isotherm Standard Comparison
If concerns arise about the accuracy of the moisture sorption curvesthe VSA produces, it is possible to perform a moisture sorption stan-dard comparison. This can only be done using the Moisture AnalysisToolkit software and must be performed on Microcrystalline Cellu-lose (MCC). We included a sample of MCC with your instrument oryou can use your own lab grade MCC. Contact AquaLab Supportif you need additional MCC samples. To run an isotherm standardtest, go to actions and select Run Standard Test in the software. Thisinitiates a Test Wizard to walk you through the steps to initiate atest. The settings of this test are preset and the test takes four tofive days to complete.
If the Moisture Analysis Toolkit software remains connected to theinstrument throughout the duration of the standard test, the soft-ware prompts the user to save a .pdf report of the test, after which, itgraphs the newly created isotherm for MCC along with a preloadedstandard MCC curve to allow comparisons. To create a permanentcopy of the newly created MCC curve, manually save it in the FileMenu. This .pdf report contains a comparison of kinetic and moisturesorption isotherm curves, as well as an error value for the compar-ison of the newly created curve and the preloaded standard MCCcurve. We recommend a sample size of 1 g when running the MCCstandard test. An error value less than 0.12 would be acceptable. If
58

AquaLab VSA 7 VERIFICATION OF CALIBRATION
the error value is greater or equal to 0.12, contact AquaLab Supportfor additional assistance.
If you disconnect the Moisture Analysis Toolkit software at any timewhile running the standard test, it does not automatically generatea comparison. Instead, save the completed MCC isotherm curve asa .vsa file and then manually compare it to the preloaded standardMCC curve. To do this, select Standard Comparison from the ac-tion menu in Moisture Analysis Toolkit software to open a file dialogbox. Navigate to and open the .vsa file for the MCC isotherm curve.The software outputs this curve at the conclusion of the standardtest and you can compare these curves with any previously savedMCC standard isotherm curves. Doing so initiates a comparison ofthis curve to the preloaded standard MCC curve and the systemprompts you to save a .pdf of the comparison report. Customers canuse the standard comparison feature anytime to make a comparisonbetween previously saved MCC standard isotherm curves and thepreloaded MCC standard curve.
59

8 RUNNING A TEST AquaLab VSA
8 Running a Test
8.1 Becoming Familiar with Stages
The AquaLab VSA uses test stages to maximize the utility of run-ning an isotherm test. In the vocabulary of setting up and runningmoisture sorption isotherms with the VSA, an isotherm test is con-sidered a collection of stages all performed on one sample. Considereach stage as a unique portion of a test with its own settings whileconducting all stages on one sample and combining the results intoone data set at the end of the isotherm test.
Because each stage is unique, an isotherm test could consist of onestage or up to twenty stages. An example of an isotherm test withmultiple stages might be running a sample through full adsorptionand desorption using the static DVS method for Stage One, then set-ting up Stage Two to run the same test, but using the DDI methodon the same sample. Another example would be to run a samplethrough full adsorption and desorption at 15 ◦C for Stage One, then,in Stage Two, switch the temperature to 25 ◦C and run the same teston the same sample. This stage interface makes it easy to comparedynamic and static isotherms and utilize the advantages offered byboth methods all on a single sample. It also makes it easy to editcurrently running tests.
8.2 Running a Moisture Sorption Isotherm Test
Before starting a test it is important to verify that the VSA is per-forming correctly using Decagon’s Verification Standards. Pleaserefer to Section 7 for instructions on how to verify your VSA andadjust the calibrations if necessary. Tests can also be setup using aWizard interface in the Moisture Analysis Toolkit software (see Sec-tion 9 for more information).
Note: Before starting a test, refer to Appendix B to verify you arerunning under non-condensing conditions, as this could void yourwarranty.
60

AquaLab VSA 8 RUNNING A TEST
1. Before starting a test, set the Volatiles: Yes/No option in theconfiguration menu. If your sample has volatiles, select Yesotherwise select No.
2. On the Main screen, select the Test Wizard.
3. The Warning screen appears to let the user know that anydata points currently on the instrument from previous testsdisappear when you begin a new test. Select the double rightarrow to continue.
4. A new message reminding the user to make sure the waterchamber is full and there is still active (blue) desiccant in thedesiccant tubes. For instructions on filling the water chamberand replacing the desiccant, refer to Section 4 and Section 6respectively. Press the double right arrow to continue or thedouble left arrow to go back.
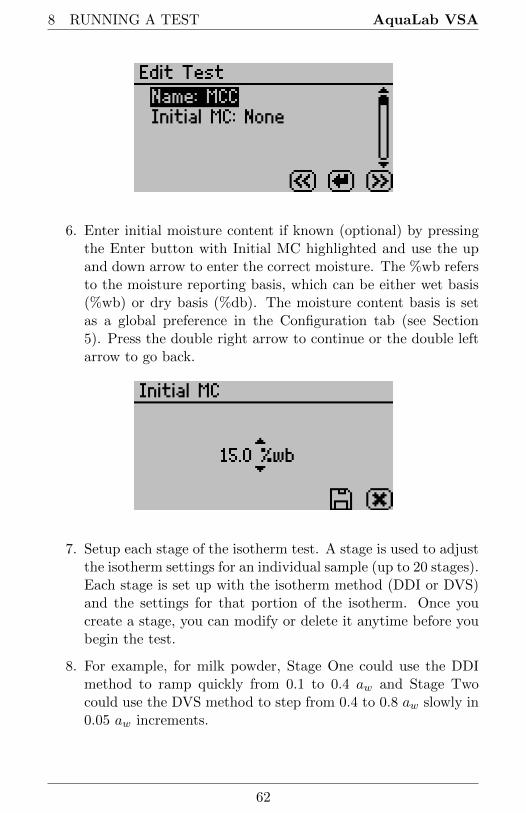
5. The Edit Test screen appears. To provide a name for the test,press the Enter button with Name highlighted and then use thearrow keys to create the name. When finished, press the Savebutton. (The name of a previous test appears by default.)
61
8 RUNNING A TEST AquaLab VSA
6. Enter initial moisture content if known (optional) by pressingthe Enter button with Initial MC highlighted and use the upand down arrow to enter the correct moisture. The %wb refersto the moisture reporting basis, which can be either wet basis(%wb) or dry basis (%db). The moisture content basis is setas a global preference in the Configuration tab (see Section5). Press the double right arrow to continue or the double leftarrow to go back.
7. Setup each stage of the isotherm test. A stage is used to adjustthe isotherm settings for an individual sample (up to 20 stages).Each stage is set up with the isotherm method (DDI or DVS)and the settings for that portion of the isotherm. Once youcreate a stage, you can modify or delete it anytime before youbegin the test.
8. For example, for milk powder, Stage One could use the DDImethod to ramp quickly from 0.1 to 0.4 aw and Stage Twocould use the DVS method to step from 0.4 to 0.8 aw slowly in0.05 aw increments.
62
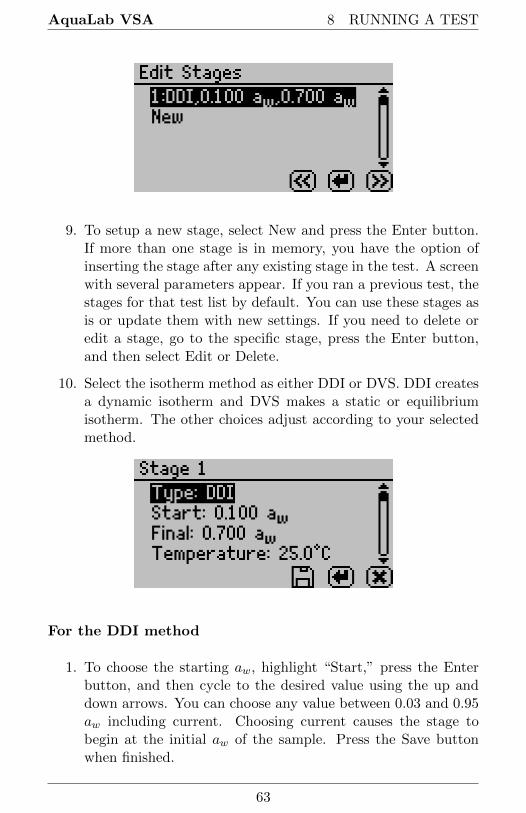
AquaLab VSA 8 RUNNING A TEST
9. To setup a new stage, select New and press the Enter button.If more than one stage is in memory, you have the option ofinserting the stage after any existing stage in the test. A screenwith several parameters appear. If you ran a previous test, thestages for that test list by default. You can use these stages asis or update them with new settings. If you need to delete oredit a stage, go to the specific stage, press the Enter button,and then select Edit or Delete.
10. Select the isotherm method as either DDI or DVS. DDI createsa dynamic isotherm and DVS makes a static or equilibriumisotherm. The other choices adjust according to your selectedmethod.
For the DDI method
1. To choose the starting aw, highlight “Start,” press the Enterbutton, and then cycle to the desired value using the up anddown arrows. You can choose any value between 0.03 and 0.95aw including current. Choosing current causes the stage tobegin at the initial aw of the sample. Press the Save buttonwhen finished.
63

8 RUNNING A TEST AquaLab VSA
2. To choose the final aw, highlight “Final,” press the Enter but-ton, and then cycle to the desired value using the up and downarrows. You can chooses any value between 0.03 and 0.95 aw,including current. Selecting a final aw that is lower than thestarting aw results in desorption, while selecting a final awhigher than the starting aw results in adsorption. Press theSave button when finished.
3. To choose the temperature of the stage, highlight “Tempera-ture,” press the Enter button, and then cycle to the desiredtemperature using the up and down arrow keys (hold downarrows for accelerated scrolling). You can choose any temper-ature between 15 and 60 ◦C and run each stage at a uniquetemperature.
4. To choose the desired aw resolution, highlight “Resolution,”press the Enter button, and then cycle to the desired valueusing the up and down arrows. You can choose any value be-tween 0.003 and 1.0 aw. The resolution for DDI determines thetarget aw resolution. Setting a higher step value makes the testfaster, but decreases the aw resolution. Decagon recommendsa DDI step of 0.01 aw.
5. To choose the air flow rate, highlight “Flow,” press the Enterbutton, and then cycle to the desired value using the up anddown arrows. You can select any value between 10 and 163ml/min. Higher flow rates speed up the test, but may resultin lower data resolution and non-equilibrium conditions. Thedefault value of 100 ml/min is suitable for most products.
6. To choose to include a timeout setting, press the Enter but-ton with “Timeout” highlighted, and then cycle to the desired
64

AquaLab VSA 8 RUNNING A TEST
value using the up and down arrows. You can select any valuebetween 5.0 minutes and 30 days. The timeout determines themaximum time allotted to move from the starting aw to thefinal aw (DDI only) and is optional. The default value is off,which means there is no timeout value.
7. To choose to have the isotherm loop, highlight “Loop” andpress the Enter button to toggle between on and off. Turn-ing loop on causes the isotherm to automatically return to thestarting aw (with the same settings) once the final aw has beenachieved. This would create both an adsorption and desorptioncurve (or vice versa depending on the starting direction).
8. When finished adjusting the settings for the stage, press theSave button to save and return to the Edit Stage screen. PressCancel to return to Edit Stage screen without saving changes.
For the DVS Method
1. To choose the starting aw, highlight “Start,” press the Enterbutton, and then cycle to the desired value using the up anddown arrows. You can choose any value between 0.03 and 0.95aw including “current.” Choosing current means that the stagestarts at the initial aw of the sample. Press the Save buttonwhen finished.
2. To choose the final aw, highlight “Final,” press the Enter but-ton, and then cycle to the desired value using the up and downarrows. You can choose any value between 0.03 and 0.95 awincluding current (see current definition above). Selecting a fi-nal aw that is lower than the starting aw results in desorption,
65

8 RUNNING A TEST AquaLab VSA
while selecting a final aw higher than the starting aw results inadsorption. Press the Save button when finished.
3. To choose the temperature of the stage, highlight “Tempera-ture,” press the Enter button with “Temperature” highlighted,and then cycle to the desired temperature using the up anddown arrow keys. You can choose any temperature between 15and 60 ◦C and each stage can run at a unique temperature.
4. To choose the desired aw step, highlight “Step,” press the Enterbutton, and then cycle to the desired value using the up anddown arrows. You can choose any value between 0.003 and1.0 aw. The step setting for DVS determines the aw values forequilibration and consequently the resolution. A step settingof 0.10 aw with a starting value of 0.1 aw results in humiditybeing controlled to 0.1, 0.2, 0.3 ... up to the final aw, remainingat each level until either equilibrium is achieved based on thetrigger value or reaching the timeout value. Setting a highervalue makes the test faster, but decreases the aw resolution.
To choose the trigger %dm/dt value that indicates equilibra-tion, highlight “Trigger,” press the Enter button to open a newwindow. Cycle to the desired trigger value using the up anddown arrows. The trigger can be shut off or be any value be-tween 0.001 and 1%/hr. The trigger value represents an accept-able change in mass per change in time to indicate equilibriumfor a given step.
Next, choose the number of readings or events meeting thetrigger value that are required to achieve equilibration. For ex-ample, choosing 3 means that in order for a step to have reached
66

AquaLab VSA 8 RUNNING A TEST
equilibrium, three %dm/dt readings in row must be less thanthe set trigger value. You can choose any value between 1 to10. Setting a higher trigger value and a lower number of eventsmakes the test faster, but may not result in complete equilib-rium. We recommend beginning with two events at 0.01%/hr.If you turn the trigger off, the VSA holds the sample at eachstep for the time in the timeout setting. After adjusting allsettings, press the Save button to save the settings and returnto the Stage Setup screen.
5. To choose to include a timeout setting, highlight “Timeout,”press the Enter button, and then cycle to the desired valueusing the up and down arrows. Any value between 5.0 min to30 days can be selected. The timeout determines the maximumtime allotted for each aw step, not the time from starting awto final aw. The default value is off, which means there is notimeout value and only the trigger value determines the endof step. If both a trigger value and timeout value are set,whichever is reached first determines the end of the step.
6. To choose to have the isotherm loop, highlight “Loop” andpress the Enter button to toggle between on and off. Turningloop on causes the isotherm to automatically return to the startaw (with the same settings) once the final aw has been achieved.This would create both an adsorption and desorption curve (orvice versa depending on the starting direction).
7. When finished adjusting the settings for the stage, press theSave button to save and return to the Edit Stage screen. Pressthe Cancel button to return to Edit Stage screen without savingchanges.
67

8 RUNNING A TEST AquaLab VSA
8. After setting up all stages on the Edit Stage screen, select thedouble Right arrow.
9. Follow the message on the screen to place an empty stainlesssteel cup in the chamber and seal it. Press the double rightarrow to tare the cup.
10. Follow the message on the screen to place the sample in thecup and select the double right arrow to weigh the sample.
11. When filling the sample cup, remove the cup from the chamberto avoid spills in the chamber area.
12. Press the Enter button to begin the test.
8.3 Using DDI to investigate Glass Transition
To investigate glass transition events using dynamic isotherms, runa DDI test with the initial water activity set to 0.1 aw, final wateractivity > 0.80 aw, flow rate of 80 to 100 ml/min, resolution of 0.01aw and no timeout should be used.
8.4 Creating a Working Isotherm Using the VSA
Users can generate working isotherms using the VSA, as describedin the Theory section of Section 3, though it requires several steps.
1. Isotherm Tests: Generate two isotherm tests using the VSA,one for adsorption and one for desorption, with both startingat the “current” water activity value. A working isotherm is ananalysis of the sorption characteristics of a sample starting fromits native state. Generating this data requires the analysis oftwo sub-samples in the same condition as the original sample.
2. Adsorption Curve: Analyze one sub-sample for adsorptionfrom its current state. Set up one stage of the test with yourdesired settings for method (DDI or DVS), temperature, stepvalue, flow rate etc., but the starting water activity must be“current,” and the final water activity must be a value higherthan the current water activity of the sample.
68

AquaLab VSA 8 RUNNING A TEST
3. Desorption Curve: Analyze a second sub-sample for desorp-tion from its current state. The test is again setup with onestage with desired settings for method (DDI or DVS), temper-ature, step value, flow rate etc., but the starting water activitymust be “current,” and the final water activity must be a valuelower than the current water activity of the sample.
8.5 Editing a Running Isotherm Test
Users can edit a test that is already running by adding additionalstages to a running test (inserted after the current running stage) atany time using the edit test function. This can be done using eitherthe instrument interface or the software.
1. Press the Wizard icon as you did when starting a test. TheConfigure Test screen appears.
2. Press the double right arrow to edit the selected test. TheConfigure Stages screen appears.
3. The current running stage (spinner icon) and completed stages(lock icons) cannot be edited. Add additional stages by se-
69

8 RUNNING A TEST AquaLab VSA
lecting New and pressing the Enter button. Then setup eachstage as outlined above. To edit an existing stage that is notcurrently running and is not complete, select it and press theEnter button. Adjust the settings as instructed above.
Note: If you do not want to end the current stage, make surethere is not a Check Mark next to “End Current Stage.”
4. To alter a currently running stage, insert a new stage afterthe currently running stage. Make sure to set the starting awto “current” if you want the new stage to resume where theprevious stage left off. Then select “End Current Stage,” pressEnter to make a Check Mark appear and click the Save button.The current stage ends and the newly created stage begins.
Note: To edit a test using the software, see the Moisture AnalysisToolkit software in Section 9.
8.6 Running a Water Activity Test
Note: The Water activity test cannot be done when the isotherm testis running
You can also use the AquaLab VSA as a water activity meter. Forbest results and temperature control, we recommend you use a cleanstainless steel cup for water activity testing and that you remove theweighing pan and place the cup directly on air cylinder when testingfor water activity. If you set volatiles to yes as described in Section5, the VSA determines water activity readings using the capacitancesensor, otherwise, it uses the dew point sensor.
1. From the Measurement tab, move latch left and and readingstarts automatically. The pinwheel spins when taking a mea-surement. Pressing the Enter button also starts a reading.
2. The aw reading for the sample and the temperature displayswhen the VSA finishes.
3. Toggle the Volatiles Yes/No option in the Configuration menuto change between dew point and capacitive readings (Volatiles
70

AquaLab VSA 8 RUNNING A TEST
= Yes → Capacitive Sensor, Volatiles = No → dew point Sen-sor).
71
9 MOISTURE ANALYSIS TOOLKIT AquaLab VSA
9 Moisture Analysis Toolkit Software
While the AquaLab VSA can operate as a stand-alone instrument, acomputer must be attached to download test results. The MoistureAnalysis Toolkit software makes it easy to download moisture sorp-tion isotherm measurements from your VSA, view the data in tableor chart form, export for use in other programs, and easily setup anew test with multiple stages. After installing the Moisture AnalysisToolkit on a computer, follow these steps to utilize the software.
Connect
1. Connect your USB cable between the VSA COM port and theUSB port on your computer.
2. Open the Moisture Analysis Toolkit software.
3. Select the proper COM port in the toolbar.
4. Click the Connect button in the toolbar.
9.1 Configure and Start a New Test
1. Once you connect the VSA, click the Wizard button in thetoolbar.
2. Follow the Wizard instructions and fill in the parameters ofyour test and each stage desired.
3. After completing the Wizard, follow the instructions displayedon the VSA to start your test.
9.2 Modify a Currently Running Test
Note: You can only modify stages that have not yet begun. If youwish to modify the current running stage, simply create a new stageand adjust your stage behavior from the current reading of the VSA.
1. Connect to VSA running test.
2. Click the Wizard button in the toolbar.
72
AquaLab VSA 9 MOISTURE ANALYSIS TOOLKIT
3. Modify stages in the currently running test.
4. Click Next.
5. Click Finish and Allow the Wizard to finish communicatingwith the device.
9.3 Download and Export
1. Once you connect the VSA after a test has been run, a down-load of the test starts automatically, If not, select Download inthe toolbar.
Note: It is strongly recommended to save the test (.vsa) beforecontinuing.
2. From the File menu or using the icon in the toolbar, select“Export” to create an Excel compatible table.
3. To view your data in table format, click the Table button inthe toolbar.
4. To view your data in chart format, click the Chart button inthe toolbar.
While the Moisture Analysis Toolkit does not have a User’s manual,extensive help files exist to guide you through the various featuresand processes of the Moisture Analysis Toolkit. To find these helpfiles in the Moisture Analysis Toolkit, click on the Help menu itemand then select the Moisture Analysis Toolkit Help submenu item todisplay the help files.
73
10 SAMPLE PREPARATION AquaLab VSA
10 Sample Preparation
Proper sample preparation is an important step in keeping your VSAclean and achieving repeatable results. Careful preparation and load-ing of samples lengthen the time needed between cleanings and helpto avoid downtime.
10.1 Preparing the Sample
1. Make sure the sample to be measured is homogeneous. Multi-component samples or samples that have outside coatings canbe measured, but results may vary based on sample prepara-tion methods. Some samples types need special preparation,see Section 10.2.
2. Place the sample in a stainless steel sample cup that has beentared. The sample should cover the majority of the bottom ofthe cup, if possible. The VSA is able to accurately measure asample that does not or cannot cover the bottom of the cup.For example, tablets only need to be placed in the cup andnot flattened or chopped to cover the bottom. A larger samplesurface area increases instrument efficiency by providing morestable infrared sample temperatures and enabling better watersorption.
3. The VSA can accommodate samples of 500 to 5000 mg. Decagonrecommends sample sizes of 1000 to 1500 mg. This sample sizeis able to give a high resolution isotherm curve without addingexcessive time to the test.
4. Do not overfill the sample cup. Optimal results are obtainedby having a thin layer of sample covering the bottom of thecup or a single layer of products such as tablets, pellets, orpieces. Filling the sample cup can extend test time, createlayering within the sample and case-hardening, and can leadto contamination of the chamber. The volume of sample vsweight of the sample has to be optimized for each material toachieve the desired resolution and test times.
74
AquaLab VSA 10 SAMPLE PREPARATION
5. Do not fill the sample cup with sample while it is sitting inthe chamber. The sample cup should be removed from thechamber, sample added and then placed back in the chamberto check the weight. Make sure the rim and outside of thesample cup are clean. Wipe any excess material from the cupwith a clean Kimwipe. Material left on the rim or outside ofthe sample cup can contaminate the chamber and potentiallyinterfere with the scale.
10.2 Sample Needing Special Preparation
Some samples require additional preparation to ensure accurate read-ings. To find out whether special sample preparation methods arenecessary, multiple water activity readings should be taken to see ifreadings stabilize (water activity and time).
Coated and Dried Samples
Samples with high sugar or fat coatings often take a long time toequilibrate. If this is the case for your samples, it is not a problemwith the instrument; it simply means your samples take longer thanmost to equilibrate. To reduce the time needed to test the samplesyou can crush or slice the sample prior to sampling. This increasesthe surface area of the sample, thus decreasing reading times. How-ever, if the effectiveness of the coating is being tested the samplesshould remain unchanged. Also, modifying some samples can alterthe water activity readings and start point of your isotherm.
Slow Water-Emitting Samples
Some extremely dry, dehydrated, highly viscous, water-in-oil (but-ter), high fat, or glassy compositions have slow water emitting prop-erties. Tests with these materials may take longer than with othertypes of materials. Decagon recommends running the test as a DVSrather than DDI to ensure equilibrium is reached. DDI tests on thesesample types do not reach full equilibrium and can show increasedhysteresis. Sampling techniques are especially important for thesesample types. The more surface area to volume the better the test
75
10 SAMPLE PREPARATION AquaLab VSA
runs. Glass beads can be helpful in some instances.
Volatile Samples
Samples with certain volatiles in high enough concentrations maygive inaccurate water activity values when using the chilled mirror.This is because the volatiles condense on the mirror during the read-ing process, but do not evaporate from the mirror as water does.As a result, the reading on samples with volatiles may not be ac-curate. The concentration of volatiles that causes interference isvariable and matrix dependent. The most effective method to de-termine if volatiles are a problem is to take water activity readingsand compare results from the chilled mirror and capacitance sensor.Refer to Section 5 for how to take water activity readings and switch-ing between sensors. If the dew point readings are more than 0.02higher than the capacitance readings, volatiles are likely a problemand should be read with volatiles turned to on. Decagon designedthe VSA for measuring volatiles such as propylene glycol, ethanol,and acetic acid. The VSA contains both the chilled mirror dew pointand a capacitance sensor. After measuring a sample with volatileswith the capacitance sensor, it is a good idea to clean the chamberand run charcoal before switching to the dew point sensor.
Low Water Activity
When a sample water activity is below the cooling capacity of thechilled mirror, the VSA displays a less than symbol or gives a lowwater activity message in the software. If the error persists, see thetroubleshooting section.
76
AquaLab VSA 11 TROUBLESHOOTING
11 Troubleshooting
The AquaLab VSA is a high performance and low maintenance in-strument that Decagon Devices Inc. has designed to have few prob-lems, if customers use their instrument with care and follow theproper procedures in this Operator’s Manual. Unfortunately, eventhe best operators using the best instruments encounter technicaldifficulties on occasion.
Table 2 provides a quick reference table for the troubleshooting guideto direct you to detailed solutions for some of the problems that mayoccur with your VSA. This section lays out the most common prob-lems and solutions for your troubleshooting needs following the quickreference table. If these remedies still do not resolve your problem,then please contact Decagon for help at [email protected].
When contacting support for an issue, be sure to include your contactinformation–Name, Title, Company, Phone Number–the instrumentserial number, and a short description of your issue.
Note: Please ensure that you read through the troubleshooting por-tions thoroughly before contacting Decagon for assistance.
Note: If you purchased your AquaLab VSA instrument from one ofour international distributors, please contact them for local serviceand support.
77
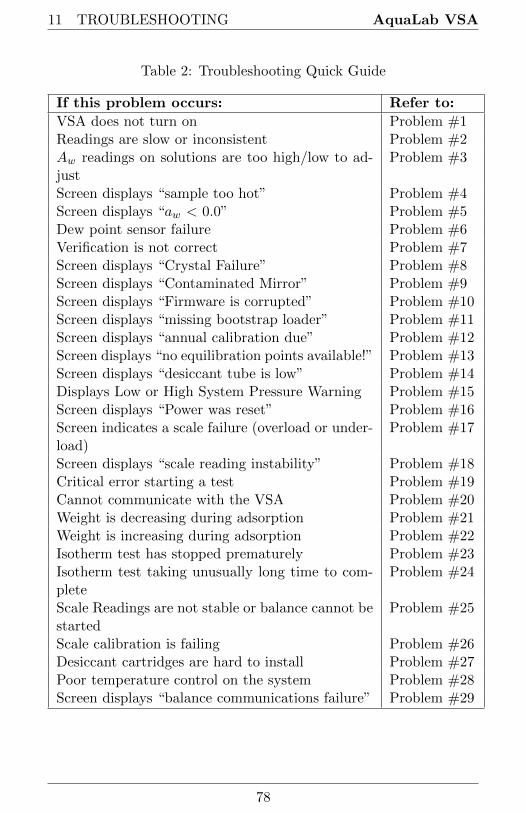
11 TROUBLESHOOTING AquaLab VSA
Table 2: Troubleshooting Quick Guide
If this problem occurs: Refer to:
VSA does not turn on Problem #1Readings are slow or inconsistent Problem #2Aw readings on solutions are too high/low to ad-just
Problem #3
Screen displays “sample too hot” Problem #4Screen displays “aw < 0.0” Problem #5Dew point sensor failure Problem #6Verification is not correct Problem #7Screen displays “Crystal Failure” Problem #8Screen displays “Contaminated Mirror” Problem #9Screen displays “Firmware is corrupted” Problem #10Screen displays “missing bootstrap loader” Problem #11Screen displays “annual calibration due” Problem #12Screen displays “no equilibration points available!” Problem #13Screen displays “desiccant tube is low” Problem #14Displays Low or High System Pressure Warning Problem #15Screen displays “Power was reset” Problem #16Screen indicates a scale failure (overload or under-load)
Problem #17
Screen displays “scale reading instability” Problem #18Critical error starting a test Problem #19Cannot communicate with the VSA Problem #20Weight is decreasing during adsorption Problem #21Weight is increasing during adsorption Problem #22Isotherm test has stopped prematurely Problem #23Isotherm test taking unusually long time to com-plete
Problem #24
Scale Readings are not stable or balance cannot bestarted
Problem #25
Scale calibration is failing Problem #26Desiccant cartridges are hard to install Problem #27Poor temperature control on the system Problem #28Screen displays “balance communications failure” Problem #29
78
AquaLab VSA 11 TROUBLESHOOTING
1.PROBLEM:VSA does not turn on.
SOLUTIONS:
1. Check to make sure your power cord is securely attached to theback of the instrument and it is plugged into the power outlet.
2. A power surge may have caused a fuse to blow. To change thefuses, follow these instructions:
(a) Unplug the power cord.
(b) Locate the panel where the power cord plugs in. The fusebox is on the right side of that panel. Press in on therelease tab and pull the fuse-holder out. Pull the brokenfuse(s) out and replace with a 1.25 Amp 250 V fuse.
Caution: Do not use any other kind of fuse or yourisk damaging your instrument and voiding yourwarranty.
(c) Replace the fuse-holder and push it into the fuse-well untilthe release tab snaps in place.
(d) Connect the power cord and turn your instrument on. Ifthe fuse blows again, a failed component may be causingthe problem. Contact Decagon to make arrangements forrepairs.
2. PROBLEM:Readings are slow or inconsistent.
SOLUTIONS:
1. The sample chamber may be dirty. Refer to Section 6 for di-rections on cleaning the sample chamber.
2. The temperature difference between the sample and the blockchamber may be too great. The sample needs to equilibrate toinstrument temperature before a fast, accurate reading can bemade. (Refer to Section 8)
79

11 TROUBLESHOOTING AquaLab VSA
3. Some products absorb or desorb moisture very slowly, causingmeasurements to take longer than usual, and nothing can bedone to speed up the process. Refer to Section 10 for furtherexplanation.
4. Your sample may contain volatiles. Volatiles are known tocause unstable readings, because they condense on the surfaceof the chilled mirror and alter readings. Please refer to thevolatiles section in Section 10 for hints on reducing difficul-ties with measuring samples with volatiles. If you have fur-ther questions regarding the measurement of volatiles contactDecagon.
5. A fan blade in the block chamber may be broken or bent. Ifeven salt standards take a long time to read, and the samplechamber is clean, you may have a broken chamber fan blade.This is especially likely if you have just cleaned the chamber.If you suspect this may have happened, contact Decagon fordetails on replacement.
3. PROBLEM:Water activity readings on verification standards are too high/lowand a linear offset adjustment cannot be made any higher/lower.
SOLUTIONS:
1. The thermopile in your chamber, which measures sample tem-perature, may have become contaminated. Refer to Section 6for directions on cleaning.
2. The chamber mirror may be dirty. Refer to Section 6 for di-rections on cleaning.
4. PROBLEM:Warning screen displays a message that the sample is too hot.
80
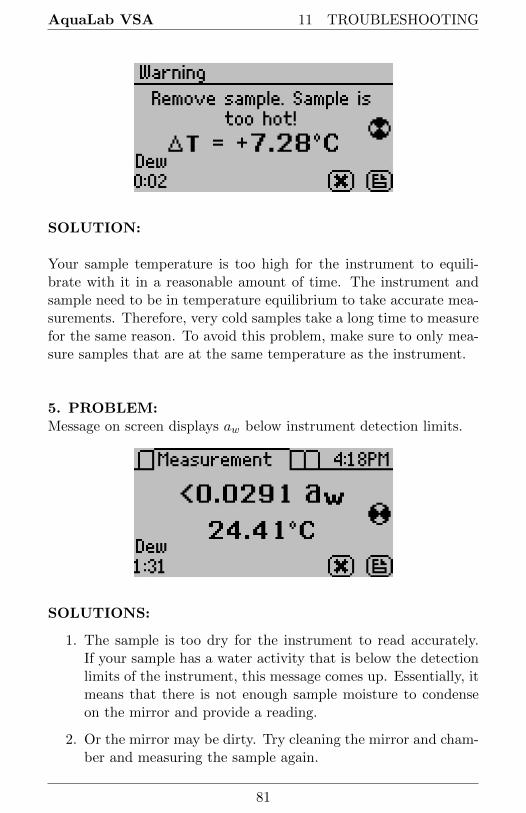
AquaLab VSA 11 TROUBLESHOOTING
SOLUTION:
Your sample temperature is too high for the instrument to equili-brate with it in a reasonable amount of time. The instrument andsample need to be in temperature equilibrium to take accurate mea-surements. Therefore, very cold samples take a long time to measurefor the same reason. To avoid this problem, make sure to only mea-sure samples that are at the same temperature as the instrument.
5. PROBLEM:Message on screen displays aw below instrument detection limits.
SOLUTIONS:
1. The sample is too dry for the instrument to read accurately.If your sample has a water activity that is below the detectionlimits of the instrument, this message comes up. Essentially, itmeans that there is not enough sample moisture to condenseon the mirror and provide a reading.
2. Or the mirror may be dirty. Try cleaning the mirror and cham-ber and measuring the sample again.
81

11 TROUBLESHOOTING AquaLab VSA
6. PROBLEM:Message on screen displaying dew point sensor failure.
SOLUTION:
The cooler is damaged and needs to be serviced by Decagon. SeeSection 12 for detailed instructions.
7. PROBLEM:Verification is not correct.
SOLUTION:
1. The sample chamber and mirror need to be cleaned. See Sec-tion 6 for detailed cleaning instructions. If verification is stillnot correct, then linear offset has occurred.
2. Verify and Adjust for Linear offset. After you have cleanedthe sample chamber and mirror, use a Verification Standard toverify and adjust for Linear offset. (Section 7)
8. PROBLEM:Message on screen displays “Crystal Failure”
82

AquaLab VSA 11 TROUBLESHOOTING
SOLUTION:
The crystal that runs the firmware is having trouble starting. Oc-casionally, cycling the power can solve this problem. If this messagecontinues to appear, Decagon needs to service the instrument. SeeSection 12 for return instructions and contact information.
9. PROBLEM:Message on screen displays “Contaminated mirror.”
SOLUTION:
The mirror used for dew point measurements requires cleaning. Fol-low the cleaning instructions outlined in Section 6 before trying torun your sample again. If this message continues to appear, contactyour Decagon Representative for further options.
10. PROBLEM:Message on screen displays the error “Firmware is corrupted.”
83
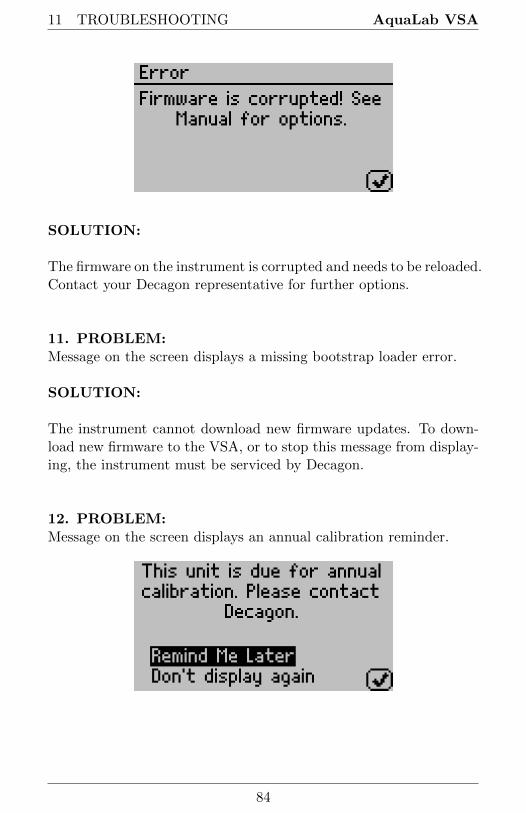
11 TROUBLESHOOTING AquaLab VSA
SOLUTION:
The firmware on the instrument is corrupted and needs to be reloaded.Contact your Decagon representative for further options.
11. PROBLEM:Message on the screen displays a missing bootstrap loader error.
SOLUTION:
The instrument cannot download new firmware updates. To down-load new firmware to the VSA, or to stop this message from display-ing, the instrument must be serviced by Decagon.
12. PROBLEM:Message on the screen displays an annual calibration reminder.
84
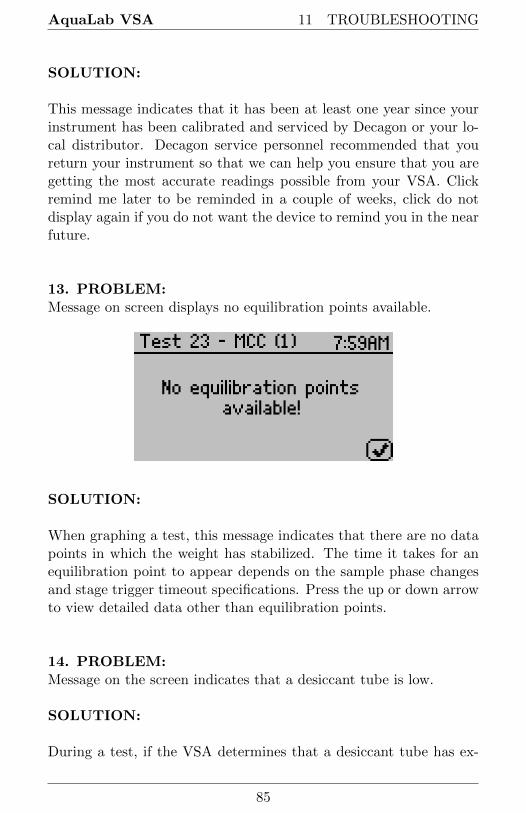
AquaLab VSA 11 TROUBLESHOOTING
SOLUTION:
This message indicates that it has been at least one year since yourinstrument has been calibrated and serviced by Decagon or your lo-cal distributor. Decagon service personnel recommended that youreturn your instrument so that we can help you ensure that you aregetting the most accurate readings possible from your VSA. Clickremind me later to be reminded in a couple of weeks, click do notdisplay again if you do not want the device to remind you in the nearfuture.
13. PROBLEM:Message on screen displays no equilibration points available.
SOLUTION:
When graphing a test, this message indicates that there are no datapoints in which the weight has stabilized. The time it takes for anequilibration point to appear depends on the sample phase changesand stage trigger timeout specifications. Press the up or down arrowto view detailed data other than equilibration points.
14. PROBLEM:Message on the screen indicates that a desiccant tube is low.
SOLUTION:
During a test, if the VSA determines that a desiccant tube has ex-
85

11 TROUBLESHOOTING AquaLab VSA
hausted its drying capacity, it automatically switches to the otherdesiccant tube. When this event occurs, a message appears indi-cating that the exhausted desiccant tube needs to be replaced. SeeSection 6 for information on replacing the desiccant tube.
15. PROBLEM:Screen displays a Low or High System Pressure Warning.
SOLUTION:
Anytime the VSA instrument requires air flow, it monitors the sys-tem pressure and sends a warning if the system pressure is outsidethe expected range for the current scenario. This may be caused byone of several issues.
1. External gas flowing when the external gas setting is off.2. External gas not flowing when external gas setting is on.3. External gas pressure outside the recommended range for run-
ning a test.4. External gas input plug not properly installed or missing when
external gas is off.5. Both desiccant tubes not properly installed or missing.6. Water chamber plug not properly installed or missing.7. Pump system failing.
If you continue to receive a message after the above items have beenchecked, contact your Decagon representative for further options.
16. PROBLEM:Screen displays “Power was reset.”
86
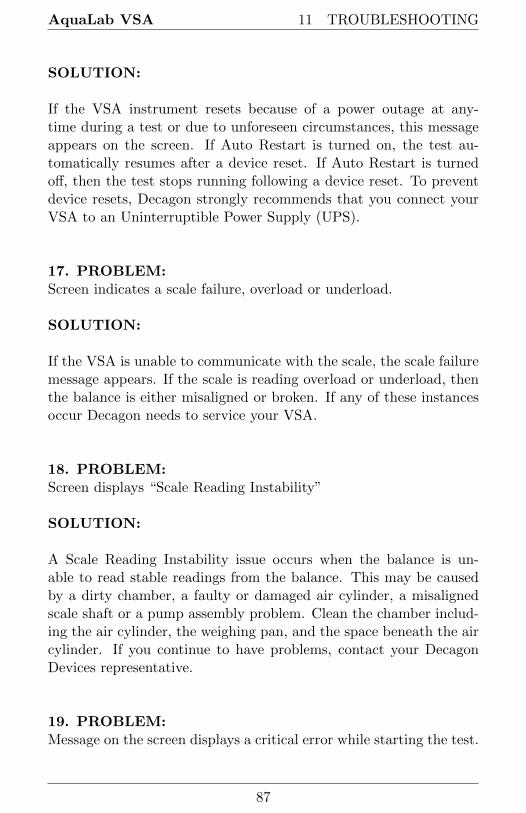
AquaLab VSA 11 TROUBLESHOOTING
SOLUTION:
If the VSA instrument resets because of a power outage at any-time during a test or due to unforeseen circumstances, this messageappears on the screen. If Auto Restart is turned on, the test au-tomatically resumes after a device reset. If Auto Restart is turnedoff, then the test stops running following a device reset. To preventdevice resets, Decagon strongly recommends that you connect yourVSA to an Uninterruptible Power Supply (UPS).
17. PROBLEM:Screen indicates a scale failure, overload or underload.
SOLUTION:
If the VSA is unable to communicate with the scale, the scale failuremessage appears. If the scale is reading overload or underload, thenthe balance is either misaligned or broken. If any of these instancesoccur Decagon needs to service your VSA.
18. PROBLEM:Screen displays “Scale Reading Instability”
SOLUTION:
A Scale Reading Instability issue occurs when the balance is un-able to read stable readings from the balance. This may be causedby a dirty chamber, a faulty or damaged air cylinder, a misalignedscale shaft or a pump assembly problem. Clean the chamber includ-ing the air cylinder, the weighing pan, and the space beneath the aircylinder. If you continue to have problems, contact your DecagonDevices representative.
19. PROBLEM:Message on the screen displays a critical error while starting the test.
87
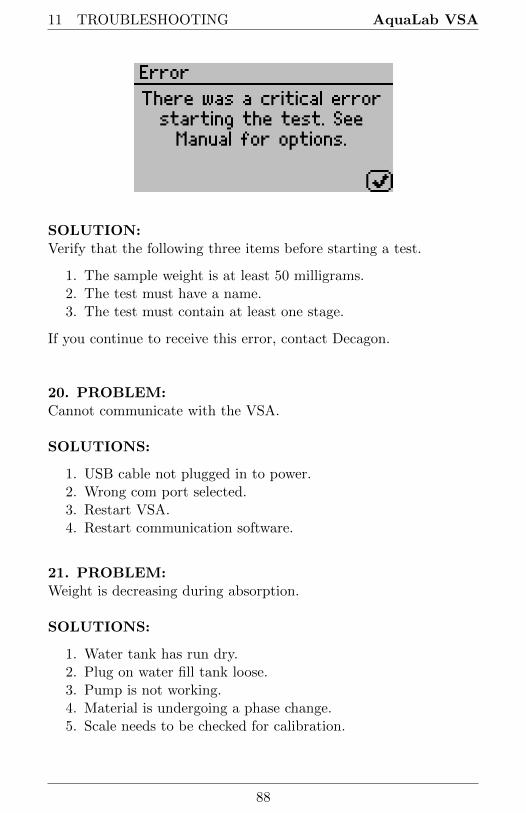
11 TROUBLESHOOTING AquaLab VSA
SOLUTION:Verify that the following three items before starting a test.
1. The sample weight is at least 50 milligrams.2. The test must have a name.3. The test must contain at least one stage.
If you continue to receive this error, contact Decagon.
20. PROBLEM:Cannot communicate with the VSA.
SOLUTIONS:
1. USB cable not plugged in to power.2. Wrong com port selected.3. Restart VSA.4. Restart communication software.
21. PROBLEM:Weight is decreasing during absorption.
SOLUTIONS:
1. Water tank has run dry.2. Plug on water fill tank loose.3. Pump is not working.4. Material is undergoing a phase change.5. Scale needs to be checked for calibration.
88

AquaLab VSA 11 TROUBLESHOOTING
22. PROBLEM:Weight is increasing during desorption.
SOLUTIONS:
1. Desiccant cartridge has been used up.2. Pump is not working.3. Desiccant tube/tubes leaking.4. Scale needs to be checked for calibration.
23. PROBLEM:Isotherm test has stopped prematurely.
SOLUTIONS:
1. Download the test with the Moisture Analysis Toolkit.2. Navigate to the Table view.3. Scroll down to the last data record in the list.4. Look in the special condition column to see what caused the
test to stop prematurely.5. Refer to the troubleshooting section that references the special
condition indicated.
24. PROBLEM:Isotherm test is taking an unusually long time to complete, even athigh flow rates.
SOLUTIONS:
1. Sample has very slow sorption properties.2. Increase the flow rate.3. Water tank has run dry.4. Desiccant cartridge has been used up.
25. PROBLEM:Scale readings are not stable or the sample cups cannot be tared.
89

11 TROUBLESHOOTING AquaLab VSA
SOLUTIONS:
1. Unstable bench or support for the VSA.2. Air cylinder internal parts need to be cleaned. Lift out air
cylinder and clean.3. Interior parts have shifted and are contacting so air cylinder
does not slide.4. Verify actuation using ACT Button in diagnostics as described
in Section 5.
26. PROBLEM:Scale calibration is failing.
SOLUTIONS:
1. Air cylinder and internal parts need to be cleaned.2. Air cylinder is not actuating. May be sticking due to contami-
nation in chamber.
27. PROBLEM:Desiccant cartridges hard to install.
SOLUTIONS:
Dampen the o-rings on the desiccant cartridge using water beforeinstalling.
28. PROBLEM:Poor temperature control on the system.
SOLUTIONS:
1. Clean the filters on the enclosure fans.2. Check that external fan on the back of the unit is operational.
29. PROBLEM:Screen Displays: “Balance Communication Failure.”
90

AquaLab VSA 11 TROUBLESHOOTING
Figure 16
SOLUTIONS:
1. Press the check button to retry the balance communication.
2. Try cycling the power on the instrument.
3. If you continue to have problems, please contact your Decagonrepresentative.
11.1 Diagnostics Screen
If, after cleaning your instrument and reading the other troubleshoot-ing hints, you have reason to believe that one of the components ofyour VSA may be causing measurement error, you may access ascreen that displays values for component performance. Navigate tothe Configuration tab and then scroll down to the Diagnostics op-tion. Press Enter to open a list of components and their values.
This screen shows typical values for the temperature sensors on theinstrument. Press up and down to scroll between the different pages.Lid, base and sample temperatures may fluctuate but should notchange more than 0.03 ◦C. Typical ranges for the lid, base and sam-ple temperatures are between 24.5 and 25.5 ◦C, when unit tempera-ture is set to 25 ◦C.
91

11 TROUBLESHOOTING AquaLab VSA
If the mirror temperature is at lid temperature, the cooler has failedand must be replaced. If the mirror is below the lid temperature orappears to be random, the thermocouple wire is broken and must berepaired. If the lid temperature is much higher than the set temper-ature, the lid fan may have failed and must be replaced.
RH: This screen shows the capacitive sensor RH percentage whichshould always be between 0 and 100%.
Weight: The weight measurement updates in real-time and canbe zeroed for measurements by pressing the scale icon (2nd buttonfrom the left). If the weight reads overload or underload, the balanceis broken and needs to be replaced. A negative value indicates thatthe balance needs to be re-zeroed if you want to take weight mea-surements.
Optical: A typical optical range is between 500 mV and 2900 mV.
Latch: To determine if the latch is functioning properly, open andclose the latch while monitoring the latch status on the screen. If thescreen does not update the latch status when you open and close thelatch, the latch magnet may need to be re-seated (with the correctpolarity) or the Hall Effect sensor needs to be realigned with themagnet.
Actuator: The Act button toggles the actuator on and off, lift-ing the sample pan up and down to confirm the actuator functionsproperly. Use this button to verify that the actuator works correctlyand that it is not throwing off weight readings. Occasionally contam-inants or defects can cause the cylinder to stick and prevent accurate
92

AquaLab VSA 11 TROUBLESHOOTING
weight measurements. The Act button is an easy way to verify theactuator function.
Pump: The pump pressure is only valid when the pump is active.When the pump is off, the pressure should be between 0 and 0.7 kPa.This pressure reading also applies to an auxiliary air supply. Whenthe air supply is active the pressure in the system should not exceed52 kPa. If the pump pressure continually reads zero (even when youpress the switch desiccant button) then the pump system may needto be serviced.
Desiccant: The desiccant humidity value indicates the effectivenessof the desiccant tubes. Initially when the diagnostic screen is turnedon, the pump supplies flow through the active desiccant tube to helpverify that it can desiccate properly. After 30 seconds of pumping,the desiccant humidity reading should be 5% or less. If the desic-cant humidity is unable to reach 5% humidity, refer to Section 6 forinstructions on replacing the desiccant tubes.
Weight Cal: The weight calibration saved a scalar into memorythat applies to all subsequent weight readings. A scalar of 1 meansthat the weight has not been changed from the default factory cali-bration. If the scalar strays too far from 1, you may need to reverifythe balance and also certify the weight standard again.
Dew Offset: The chilled mirror dew point calibration offset is zeroif it is running off of the default factory calibration. This value indi-cates the offset the instrument applies to the water activity readingsfor accurate readings.
93
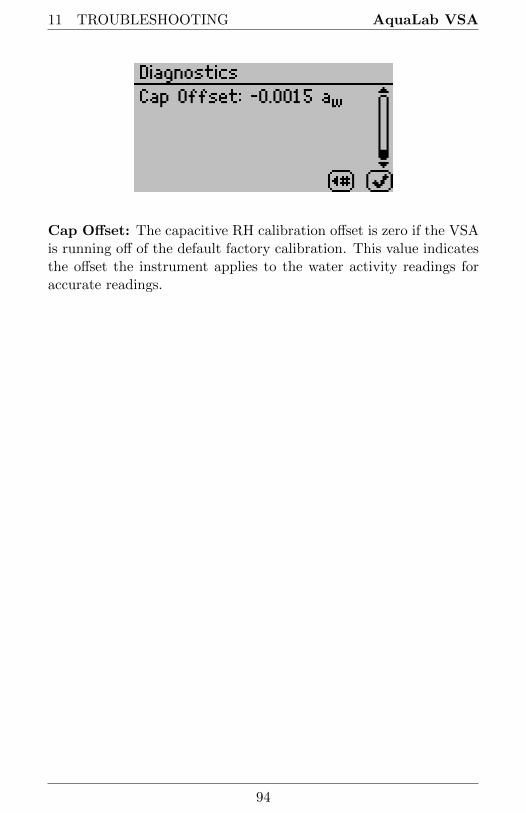
11 TROUBLESHOOTING AquaLab VSA
Cap Offset: The capacitive RH calibration offset is zero if the VSAis running off of the default factory calibration. This value indicatesthe offset the instrument applies to the water activity readings foraccurate readings.
94
AquaLab VSA 12 SUPPORT AND REPAIR
12 Support and Repair
Note: If you purchased your AquaLab from one of our internationaldistributors, please contact them. They can provide you with localsupport and service.
When encountering problems with your VSA (that you are unable toresolve with the help of this manual), please contact Decagon Cus-tomer Support at [email protected], 509-332-5601 or fax us at509-332-5158. Please have the serial number and model of the in-strument ready.
AquaLab annual calibration is available. For details on sending yourAquaLab to Decagon or your distributor for calibration, contact usby phone or email at [email protected].
All instruments returning to Decagon for servicing must be accom-panied with a Return Material Authorization (RMA) number. Priorto shipping the instrument, please contact a Decagon customer sup-port representative to obtain an RMA number.
Shipping Directions
The following steps should help to ensure the safe shipping and pro-cessing of your VSA.
1. Ship the VSA in its original cardboard box with foam insert.Failure to ship in proper packaging can damage the scale andvoid the warranty.
2. Do not ship the power cord or serial cable and be sure the watertank is empty.
3. Remove the desiccant tubes and wrap them in bubble wrap toinclude with your VSA.
4. Remove the weight pan and air cylinder, wrap both separatelyto prevent damage.
5. On the RMA form, please verify the ship to and bill to infor-mation, contact name, and problem description. If anything is
95
12 SUPPORT AND REPAIR AquaLab VSA
incorrect please contact a Decagon representative.
6. Tape the box in both directions for added support.
7. Include the RMA number in the attention line on the shippinglabel.
Ship to:Decagon Devices Inc.ATTN: RMA (insert your RMA #)2365 NE Hopkins CourtPullman, WA 99163
12.1 Repair Costs
Decagon Devices repairs manufacturer defects and instruments withinthe one year warranty at no charge. We charge you for non-warrantyrepairs based on cost of parts, labor and shipping. An extra fee maybe charged for rush work. Decagon can provide an estimated repaircost upon request.
96

AquaLab VSA 13 APPENDIX A
13 Appendix A
Temperature Correctionof Decagon’s Verification Standards
Table 3: Water Activity of Selected Solutions
Temp. H2O0.50 2.33 6.00 8.57 13.41
(◦C)mol/kg mol/kg mol/kg mol/kg mol/kgKCL NaCL NaCL LiCl LiCl
10.0 1.000 0.984 0.923 0.762 0.491 0.234
15.0 1.000 0.984 0.923 0.761 0.492 0.238
20.0 1.000 0.984 0.922 0.760 0.496 0.245
25.0 1.000 0.984 0.920 0.760 0.500 0.250
30.0 1.000 0.984 0.920 0.760 0.504 0.255
35.0 1.000 0.984 0.920 0.760 0.508 0.261
40.0 1.000 0.984 0.921 0.760 0.512 0.266
50.0 1.000 0.984 0.894 0.740 0.517 0.275
60.0 1.000 0.984 0.894 0.740 0.505 0.279
Note: The AquaLab VSA measures these verification standards to±0.005 aw, ±0.02 with volatiles on yes.
97

14 APPENDIX B AquaLab VSA
14 Appendix B
Non-Condensing Conditions for VSA Testing
Non-Condensing Ambient Humidity Limit for Test Temperatures Below 25°C
Ambient 1s·c Test 11·c Test 2o·c Test 23°C Test 2s·c Test
Temperature (0C)
16.0 93.8 100.0 100.0 100.0 100.0
17.0 88.0 100.0 100.0 100.0 100.0
18.0 82.6 93.9 100.0 100.0 100.0
19.0 77.6 88.2 100.0 100.0 100.0
20.0 72.9 82.9 100.0 100.0 100.0
21.0 68.6 77.9 94.0 100.0 100.0
22.0 64.5 73.3 88.4 100.0 100.0
23.0 60.7 69.0 83.2 100.0 100.0
24.0 57.1 64.9 78.4 94.1 100.0
25.0 53.8 61.2 73.8 88.7 100.0
26.0 50.7 57.6 69.5 83.6 94.2
27.0 47.8 54.3 65.6 78.8 88.8
28.0 45.1 51.2 61.8 74.3 83.8
29.0 42.6 48.4 58.3 70.1 79.1
30.0 40.2 45.6 55.1 66.2 74.6
31.0 37.9 43.1 52.0 62.5 70.5
32.0 35.8 40.7 49.1 59.1 66.6
33.0 33.9 38.5 46.4 55.8 62.9
34.0 32.0 36.4 43.9 52.8 59.5
35.0 30.3 34.4 41.5 49.9 56.3
36.0 28.7 32.6 39.3 47.2 53.3
37.0 27.1 30.8 37.2 44.7 50.4
38.0 25.7 29.2 35.2 42.4 47.8
39.0 24.4 27.7 33.4 40.1 45.3
40.0 23.1 26.2 31.7 38.0 42.9
This table shows the maximum advisable ambient humidity levels for the ambient room and test temperatures. Staying within these limits prevents condensation in and on the VSA. Operating in humidity and temperature conditions beyond these limits voids the VSA warranty and can damage
the instrument. Please contact us if you have any questions or require any additional assistance.
98
AquaLab VSA 15 DECLARATION OF CONFORMITY
15 Declaration of Conformity
Application of Council Directive: 2004/108/EC and 2011/65/EU
Standards to which conformity isdeclared:
EN 61326-1:2013 and
EN 50581:2012
Manufacturer’s Name: Decagon Devices, Inc 2365 NEHopkins Ct. Pullman, WA 99163USA
Type of Equipment: AquaLab Vapor Sorption Ana-lyzer
Model Number: VSA
Year of First Manufacture: 2011
The undersigned hereby declares on behalf of Decagon Devices, Inc.that the above referenced products, to which this declaration relates,fully conform to the provisions of the Council Directives and stan-dards referenced above.
Michael WadsworthEngineering Director7-9-2015
99

16 CERTIFICATE OF TRACEABILITY AquaLab VSA
16 Certificate of Traceability
Decagon Devices, Inc.2365 NE Hopkins CourtPullman WA 99163 USA
Tel: 509-332-5601Fax: [email protected]
Decagon Inc. manufactures the VSA according to temperature stan-dards with calibration traceable to the National Institute of Stan-dards and Technology (NIST).
100

Index
Annual Calibration Service, 95Aqualab VSA Information, 5
Balance Magnetic Force, 54
Calibration, 27Verification of, 49
Certificate of Traceability, 100Cleaning Procedures, 47
Block and Sensors, 46Testing Chamber, 45
Components, VSA, 20Configuration Tab, 26, 53Customer Support, 1, 95
Data Tab, 37Declaration of Conformity, 99Desiccant Cartridge
Replacement, 41Desorption, 10Diagnostics, 35Dynamic Dew Point Isotherm
(DDI), 63Dynamic Vapor Sorption (DVS),
62, 65
Email, 1, 95, 100Equilibrium Isotherms, 1, 5, 9External Gas, 6, 33
Flow Rate, Air, 64, 89Fuse, 79
Glass Transition, 5, 10, 19, 68
Hysteresis, 11, 17
Isotherm
Models, 16Moisture Sorption, 8Types, 8
Isotherm Tab, 25
Linear Offset, 49
Matrix Changes, 1, 13Measurement Tab, 25Microcrystalline Cellulose (MCC),
58Moisture Analysis Toolkit, 72Moisture Content
Basis, 28Moisture Sorption Isotherm
Moisture Sorption, 4Test, 60
Power Outage, 87Product Development, 18
Salt Standard, 50Sample Prep
Coated and Dried, 75Low Water Activity, 76Preparation, 74Slow Water Emitting, 75Volatiles, 76
Sample Preparation, 74Seller’s Liability, 2Setup
Instrument, 21Shelf Life Prediction, 18Specifications, 6Stages, 60Standards, 50, 97Static Isotherms, 60
101

INDEX AquaLab VSA
Tabs, 25Tare, 68Temperature Control Range, 7Test Wizard, 61Theory, 8Trigger, 66Troubleshooting, 77
User Interface, 25
Vapor Equilibrium, 10Verification Standards, 49Volatiles, 28, 80
Warranty, 2, 96Water Activity
Accuracy, 6Range, 6Repeatability, 6Resolution, 6Testing, 70
Water Tank, 23Weight Reference, 28Working Isotherm, 68
102