Operations of and Future Plans for the Pierre Auger...
42
June 2009 Operations of and Future Plans for the Pierre Auger Observatory Presentations for the 31st International Cosmic Ray Conference, L´ od´ z , Poland, July 2009 1. Performance and operation of the Surface Detectors of the Pierre Auger Observatory presented by Tiina Suomijarvi ................................ Page 6 2. Extension of the Pierre Auger Observatory using high-elevation fluorescence telescopes (HEAT) presented by Matthias Kleifges ....................... Page 10 3. AMIGA - Auger Muons and Infill for the Ground Array of the Pierre Auger Observatory presented by M. Platino ..................................... Page 14 4. Radio detection of Cosmic Rays at the southern Auger Observatory presented by A.M. van den Berg ............................................ Page 18 5. Hardware Developments for the AMIGA enhancement at the Pierre Auger Observatory presented by Peter Buchholz ................................. Page 22 6. A simulation of the fluorescence detectors of the Pierre Auger Observatory using GEANT 4 presented by Pedro Assis ................................ Page 26 7. Education and Public Outreach at the Pierre Auger Observatory presented by Greg Snow .............................................................. Page 30 8. BATATA: A device to characterize the punch-through observed in under- ground muon detectors and to operate as a prototype for AMIGA presented by G. Medina-Tanco ........................................................ Page 34 9. Progress with the Northern Part of the Pierre Auger Observatory presented by John L. Harton .......................................................... Page 38
Transcript of Operations of and Future Plans for the Pierre Auger...

June 2009
Operations of and Future Plans
for the
Pierre Auger Observatory
Presentations for the31st International Cosmic Ray Conference, Lodz , Poland, July 2009
1. Performance and operation of the Surface Detectors of the Pierre AugerObservatory presented by Tiina Suomijarvi . . . . . . . . . . . . . . . . . . . . . . . . . . . . . . . . Page 6
2. Extension of the Pierre Auger Observatory using high-elevation fluorescencetelescopes (HEAT) presented by Matthias Kleifges . . . . . . . . . . . . . . . . . . . . . . . Page 10
3. AMIGA - Auger Muons and Infill for the Ground Array of the Pierre AugerObservatory presented by M. Platino . . . . . . . . . . . . . . . . . . . . . . . . . . . . . . . . . . . . . Page 14
4. Radio detection of Cosmic Rays at the southern Auger Observatorypresented by A.M. van den Berg . . . . . . . . . . . . . . . . . . . . . . . . . . . . . . . . . . . . . . . . . . . .Page 18
5. Hardware Developments for the AMIGA enhancement at the Pierre AugerObservatory presented by Peter Buchholz . . . . . . . . . . . . . . . . . . . . . . . . . . . . . . . . .Page 22
6. A simulation of the fluorescence detectors of the Pierre Auger Observatoryusing GEANT 4 presented by Pedro Assis . . . . . . . . . . . . . . . . . . . . . . . . . . . . . . . . Page 26
7. Education and Public Outreach at the Pierre Auger Observatory presentedby Greg Snow . . . . . . . . . . . . . . . . . . . . . . . . . . . . . . . . . . . . . . . . . . . . . . . . . . . . . . . . . . . . . . Page 30
8. BATATA: A device to characterize the punch-through observed in under-ground muon detectors and to operate as a prototype for AMIGA presentedby G. Medina-Tanco . . . . . . . . . . . . . . . . . . . . . . . . . . . . . . . . . . . . . . . . . . . . . . . . . . . . . . . .Page 34
9. Progress with the Northern Part of the Pierre Auger Observatory presentedby John L. Harton . . . . . . . . . . . . . . . . . . . . . . . . . . . . . . . . . . . . . . . . . . . . . . . . . . . . . . . . . .Page 38

PIERRE AUGER COLLABORATION
J. Abraham8, P. Abreu71, M. Aglietta54, C. Aguirre12, E.J. Ahn87, D. Allard31, I. Allekotte1,J. Allen90, J. Alvarez-Muniz78, M. Ambrosio48, L. Anchordoqui104, S. Andringa71, A. Anzalone53,
C. Aramo48, E. Arganda75, S. Argiro51, K. Arisaka95, F. Arneodo55, F. Arqueros75, T. Asch38,H. Asorey1, P. Assis71, J. Aublin33, M. Ave96, G. Avila10, T. Backer42, D. Badagnani6,
K.B. Barber11, A.F. Barbosa14, S.L.C. Barroso20, B. Baughman92, P. Bauleo85, J.J. Beatty92,T. Beau31, B.R. Becker101, K.H. Becker36, A. Belletoile34, J.A. Bellido11, 93, S. BenZvi103,C. Berat34, P. Bernardini47, X. Bertou1, P.L. Biermann39, P. Billoir33, O. Blanch-Bigas33,F. Blanco75, C. Bleve47, H. Blumer41, 37, M. Bohacova96, 27, D. Boncioli49, C. Bonifazi33,
R. Bonino54, N. Borodai69, J. Brack85, P. Brogueira71, W.C. Brown86, R. Bruijn81, P. Buchholz42,A. Bueno77, R.E. Burton83, N.G. Busca31, K.S. Caballero-Mora41, L. Caramete39, R. Caruso50,
W. Carvalho17, A. Castellina54, O. Catalano53, L. Cazon96, R. Cester51, J. Chauvin34,A. Chiavassa54, J.A. Chinellato18, A. Chou87, 90, J. Chudoba27, J. Chye89d, R.W. Clay11,
E. Colombo2, R. Conceicao71, B. Connolly102, F. Contreras9, J. Coppens65, 67, A. Cordier32,U. Cotti63, S. Coutu93, C.E. Covault83, A. Creusot73, A. Criss93, J. Cronin96, A. Curutiu39,
S. Dagoret-Campagne32, R. Dallier35, K. Daumiller37, B.R. Dawson11, R.M. de Almeida18, M. DeDomenico50, C. De Donato46, S.J. de Jong65, G. De La Vega8, W.J.M. de Mello Junior18,
J.R.T. de Mello Neto23, I. De Mitri47, V. de Souza16, K.D. de Vries66, G. Decerprit31, L. delPeral76, O. Deligny30, A. Della Selva48, C. Delle Fratte49, H. Dembinski40, C. Di Giulio49,
J.C. Diaz89, P.N. Diep105, C. Dobrigkeit 18, J.C. D’Olivo64, P.N. Dong105, A. Dorofeev88, J.C. dosAnjos14, M.T. Dova6, D. D’Urso48, I. Dutan39, M.A. DuVernois98, R. Engel37, M. Erdmann40,
C.O. Escobar18, A. Etchegoyen2, P. Facal San Luis96, 78, H. Falcke65, 68, G. Farrar90,A.C. Fauth18, N. Fazzini87, F. Ferrer83, A. Ferrero2, B. Fick89, A. Filevich2, A. Filipcic72, 73,I. Fleck42, S. Fliescher40, C.E. Fracchiolla85, E.D. Fraenkel66, W. Fulgione54, R.F. Gamarra2,
S. Gambetta44, B. Garcıa8, D. Garcıa Gamez77, D. Garcia-Pinto75, X. Garrido37, 32, G. Gelmini95,H. Gemmeke38, P.L. Ghia30, 54, U. Giaccari47, M. Giller70, H. Glass87, L.M. Goggin104,M.S. Gold101, G. Golup1, F. Gomez Albarracin6, M. Gomez Berisso1, P. Goncalves71,
M. Goncalves do Amaral24, D. Gonzalez41, J.G. Gonzalez77, 88, D. Gora41, 69, A. Gorgi54,P. Gouffon17, S.R. Gozzini81, E. Grashorn92, S. Grebe65, M. Grigat40, A.F. Grillo55,
Y. Guardincerri4, F. Guarino48, G.P. Guedes19, J. Gutierrez76, J.D. Hague101, V. Halenka28,P. Hansen6, D. Harari1, S. Harmsma66, 67, J.L. Harton85, A. Haungs37, M.D. Healy95,T. Hebbeker40, G. Hebrero76, D. Heck37, V.C. Holmes11, P. Homola69, J.R. Horandel65,
A. Horneffer65, M. Hrabovsky28, 27, T. Huege37, M. Hussain73, M. Iarlori45, A. Insolia50,F. Ionita96, A. Italiano50, S. Jiraskova65, M. Kaducak87, K.H. Kampert36, T. Karova27,P. Kasper87, B. Kegl32, B. Keilhauer37, E. Kemp18, R.M. Kieckhafer89, H.O. Klages37,M. Kleifges38, J. Kleinfeller37, R. Knapik85, J. Knapp81, D.-H. Koang34, A. Krieger2,
O. Kromer38, D. Kruppke-Hansen36, F. Kuehn87, D. Kuempel36, N. Kunka38, A. Kusenko95, G. LaRosa53, C. Lachaud31, B.L. Lago23, P. Lautridou35, M.S.A.B. Leao22, D. Lebrun34, P. Lebrun87,
J. Lee95, M.A. Leigui de Oliveira22, A. Lemiere30, A. Letessier-Selvon33, M. Leuthold40,I. Lhenry-Yvon30, R. Lopez59, A. Lopez Aguera78, K. Louedec32, J. Lozano Bahilo77, A. Lucero54,
H. Lyberis30, M.C. Maccarone53, C. Macolino45, S. Maldera54, D. Mandat27, P. Mantsch87,A.G. Mariazzi6, I.C. Maris41, H.R. Marquez Falcon63, D. Martello47, O. Martınez Bravo59,
H.J. Mathes37, J. Matthews88, 94, J.A.J. Matthews101, G. Matthiae49, D. Maurizio51, P.O. Mazur87,M. McEwen76, R.R. McNeil88, G. Medina-Tanco64, M. Melissas41, D. Melo51, E. Menichetti51,A. Menshikov38, R. Meyhandan14, M.I. Micheletti2, G. Miele48, W. Miller101, L. Miramonti46,
S. Mollerach1, M. Monasor75, D. Monnier Ragaigne32, F. Montanet34, B. Morales64, C. Morello54,J.C. Moreno6, C. Morris92, M. Mostafa85, C.A. Moura48, S. Mueller37, M.A. Muller18,
R. Mussa51, G. Navarra54, J.L. Navarro77, S. Navas77, P. Necesal27, L. Nellen64,C. Newman-Holmes87, D. Newton81, P.T. Nhung105, N. Nierstenhoefer36, D. Nitz89, D. Nosek26,L. Nozka27, M. Nyklicek27, J. Oehlschlager37, A. Olinto96, P. Oliva36, V.M. Olmos-Gilbaja78,
M. Ortiz75, N. Pacheco76, D. Pakk Selmi-Dei18, M. Palatka27, J. Pallotta3, G. Parente78,E. Parizot31, S. Parlati55, S. Pastor74, M. Patel81, T. Paul91, V. Pavlidou96c, K. Payet34, M. Pech27,
J. Pekala69, I.M. Pepe21, L. Perrone52, R. Pesce44, E. Petermann100, S. Petrera45, P. Petrinca49,A. Petrolini44, Y. Petrov85, J. Petrovic67, C. Pfendner103, R. Piegaia4, T. Pierog37, M. Pimenta71,
T. Pinto74, V. Pirronello50, O. Pisanti48, M. Platino2, J. Pochon1, V.H. Ponce1, M. Pontz42,P. Privitera96, M. Prouza27, E.J. Quel3, J. Rautenberg36, O. Ravel35, D. Ravignani2,

A. Redondo76, B. Revenu35, F.A.S. Rezende14, J. Ridky27, S. Riggi50, M. Risse36, C. Riviere34,V. Rizi45, C. Robledo59, G. Rodriguez49, J. Rodriguez Martino50, J. Rodriguez Rojo9,
I. Rodriguez-Cabo78, M.D. Rodrıguez-Frıas76, G. Ros75, 76, J. Rosado75, T. Rossler28, M. Roth37,B. Rouille-d’Orfeuil31, E. Roulet1, A.C. Rovero7, F. Salamida45, H. Salazar59b, G. Salina49,
F. Sanchez64, M. Santander9, C.E. Santo71, E.M. Santos23, F. Sarazin84, S. Sarkar79, R. Sato9,N. Scharf40, V. Scherini36, H. Schieler37, P. Schiffer40, A. Schmidt38, F. Schmidt96, T. Schmidt41,
O. Scholten66, H. Schoorlemmer65, J. Schovancova27, P. Schovanek27, F. Schroeder37, S. Schulte40,F. Schussler37, D. Schuster84, S.J. Sciutto6, M. Scuderi50, A. Segreto53, D. Semikoz31,
M. Settimo47, R.C. Shellard14, 15, I. Sidelnik2, B.B. Siffert23, A. Smiałkowski70, R. Smıda27,B.E. Smith81, G.R. Snow100, P. Sommers93, J. Sorokin11, H. Spinka82, 87, R. Squartini9,
E. Strazzeri32, A. Stutz34, F. Suarez2, T. Suomijarvi30, A.D. Supanitsky64, M.S. Sutherland92,J. Swain91, Z. Szadkowski70, A. Tamashiro7, A. Tamburro41, T. Tarutina6, O. Tascau36,
R. Tcaciuc42, D. Tcherniakhovski38, D. Tegolo58, N.T. Thao105, D. Thomas85, R. Ticona13,J. Tiffenberg4, C. Timmermans67, 65, W. Tkaczyk70, C.J. Todero Peixoto22, B. Tome71,
A. Tonachini51, I. Torres59, P. Travnicek27, D.B. Tridapalli17, G. Tristram31, E. Trovato50,M. Tueros6, R. Ulrich37, M. Unger37, M. Urban32, J.F. Valdes Galicia64, I. Valino37, L. Valore48,
A.M. van den Berg66, J.R. Vazquez75, R.A. Vazquez78, D. Veberic73, 72, A. Velarde13,T. Venters96, V. Verzi49, M. Videla8, L. Villasenor63, S. Vorobiov73, L. Voyvodic87‡, H. Wahlberg6,
P. Wahrlich11, O. Wainberg2, D. Warner85, A.A. Watson81, S. Westerhoff103, B.J. Whelan11,G. Wieczorek70, L. Wiencke84, B. Wilczynska69, H. Wilczynski69, C. Wileman81, M.G. Winnick11,
H. Wu32, B. Wundheiler2, T. Yamamoto96a, P. Younk85, G. Yuan88, A. Yushkov48, E. Zas78,D. Zavrtanik73, 72, M. Zavrtanik72, 73, I. Zaw90, A. Zepeda60b, M. Ziolkowski42
1 Centro Atomico Bariloche and Instituto Balseiro (CNEA-UNCuyo-CONICET), San Carlos de Bariloche,Argentina
2 Centro Atomico Constituyentes (Comision Nacional de Energıa Atomica/CONICET/UTN- FRBA), Buenos Aires,Argentina
3 Centro de Investigaciones en Laseres y Aplicaciones, CITEFA and CONICET, Argentina4 Departamento de Fısica, FCEyN, Universidad de Buenos Aires y CONICET, Argentina
6 IFLP, Universidad Nacional de La Plata and CONICET, La Plata, Argentina7 Instituto de Astronomıa y Fısica del Espacio (CONICET), Buenos Aires, Argentina
8 National Technological University, Faculty Mendoza (CONICET/CNEA), Mendoza, Argentina9 Pierre Auger Southern Observatory, Malargue, Argentina
10 Pierre Auger Southern Observatory and Comision Nacional de Energıa Atomica, Malargue, Argentina11 University of Adelaide, Adelaide, S.A., Australia
12 Universidad Catolica de Bolivia, La Paz, Bolivia13 Universidad Mayor de San Andres, Bolivia
14 Centro Brasileiro de Pesquisas Fisicas, Rio de Janeiro, RJ, Brazil15 Pontifıcia Universidade Catolica, Rio de Janeiro, RJ, Brazil
16 Universidade de Sao Paulo, Instituto de Fısica, Sao Carlos, SP, Brazil17 Universidade de Sao Paulo, Instituto de Fısica, Sao Paulo, SP, Brazil
18 Universidade Estadual de Campinas, IFGW, Campinas, SP, Brazil19 Universidade Estadual de Feira de Santana, Brazil
20 Universidade Estadual do Sudoeste da Bahia, Vitoria da Conquista, BA, Brazil21 Universidade Federal da Bahia, Salvador, BA, Brazil
22 Universidade Federal do ABC, Santo Andre, SP, Brazil23 Universidade Federal do Rio de Janeiro, Instituto de Fısica, Rio de Janeiro, RJ, Brazil
24 Universidade Federal Fluminense, Instituto de Fisica, Niteroi, RJ, Brazil26 Charles University, Faculty of Mathematics and Physics, Institute of Particle and Nuclear Physics, Prague,
Czech Republic27 Institute of Physics of the Academy of Sciences of the Czech Republic, Prague, Czech Republic
28 Palacky University, Olomouc, Czech Republic30 Institut de Physique Nucleaire d’Orsay (IPNO), Universite Paris 11, CNRS-IN2P3, Orsay, France31 Laboratoire AstroParticule et Cosmologie (APC), Universite Paris 7, CNRS-IN2P3, Paris, France32 Laboratoire de l’Accelerateur Lineaire (LAL), Universite Paris 11, CNRS-IN2P3, Orsay, France
33 Laboratoire de Physique Nucleaire et de Hautes Energies (LPNHE), Universites Paris 6 et Paris 7, ParisCedex 05, France

34 Laboratoire de Physique Subatomique et de Cosmologie (LPSC), Universite Joseph Fourier, INPG,CNRS-IN2P3, Grenoble, France35 SUBATECH, Nantes, France
36 Bergische Universitat Wuppertal, Wuppertal, Germany37 Forschungszentrum Karlsruhe, Institut fur Kernphysik, Karlsruhe, Germany
38 Forschungszentrum Karlsruhe, Institut fur Prozessdatenverarbeitung und Elektronik, Karlsruhe, Germany39 Max-Planck-Institut fur Radioastronomie, Bonn, Germany
40 RWTH Aachen University, III. Physikalisches Institut A, Aachen, Germany41 Universitat Karlsruhe (TH), Institut fur Experimentelle Kernphysik (IEKP), Karlsruhe, Germany
42 Universitat Siegen, Siegen, Germany44 Dipartimento di Fisica dell’Universita and INFN, Genova, Italy
45 Universita dell’Aquila and INFN, L’Aquila, Italy46 Universita di Milano and Sezione INFN, Milan, Italy
47 Dipartimento di Fisica dell’Universita del Salento and Sezione INFN, Lecce, Italy48 Universita di Napoli ”Federico II” and Sezione INFN, Napoli, Italy
49 Universita di Roma II “Tor Vergata” and Sezione INFN, Roma, Italy50 Universita di Catania and Sezione INFN, Catania, Italy
51 Universita di Torino and Sezione INFN, Torino, Italy52 Dipartimento di Ingegneria dell’Innovazione dell’Universita del Salento and Sezione INFN, Lecce, Italy
53 Istituto di Astrofisica Spaziale e Fisica Cosmica di Palermo (INAF), Palermo, Italy54 Istituto di Fisica dello Spazio Interplanetario (INAF), Universita di Torino and Sezione INFN, Torino, Italy
55 INFN, Laboratori Nazionali del Gran Sasso, Assergi (L’Aquila), Italy58 Universita di Palermo and Sezione INFN, Catania, Italy
59 Benemerita Universidad Autonoma de Puebla, Puebla, Mexico60 Centro de Investigacion y de Estudios Avanzados del IPN (CINVESTAV), Mexico, D.F., Mexico
61 Instituto Nacional de Astrofisica, Optica y Electronica, Tonantzintla, Puebla, Mexico63 Universidad Michoacana de San Nicolas de Hidalgo, Morelia, Michoacan, Mexico
64 Universidad Nacional Autonoma de Mexico, Mexico, D.F., Mexico65 IMAPP, Radboud University, Nijmegen, Netherlands
66 Kernfysisch Versneller Instituut, University of Groningen, Groningen, Netherlands67 NIKHEF, Amsterdam, Netherlands68 ASTRON, Dwingeloo, Netherlands
69 Institute of Nuclear Physics PAN, Krakow, Poland70 University of Łodz, Łodz, Poland
71 LIP and Instituto Superior Tecnico, Lisboa, Portugal72 J. Stefan Institute, Ljubljana, Slovenia
73 Laboratory for Astroparticle Physics, University of Nova Gorica, Slovenia74 Instituto de Fısica Corpuscular, CSIC-Universitat de Valencia, Valencia, Spain
75 Universidad Complutense de Madrid, Madrid, Spain76 Universidad de Alcala, Alcala de Henares (Madrid), Spain
77 Universidad de Granada & C.A.F.P.E., Granada, Spain78 Universidad de Santiago de Compostela, Spain
79 Rudolf Peierls Centre for Theoretical Physics, University of Oxford, Oxford, United Kingdom81 School of Physics and Astronomy, University of Leeds, United Kingdom
82 Argonne National Laboratory, Argonne, IL, USA83 Case Western Reserve University, Cleveland, OH, USA
84 Colorado School of Mines, Golden, CO, USA85 Colorado State University, Fort Collins, CO, USA
86 Colorado State University, Pueblo, CO, USA87 Fermilab, Batavia, IL, USA
88 Louisiana State University, Baton Rouge, LA, USA89 Michigan Technological University, Houghton, MI, USA
90 New York University, New York, NY, USA91 Northeastern University, Boston, MA, USA92 Ohio State University, Columbus, OH, USA
93 Pennsylvania State University, University Park, PA, USA94 Southern University, Baton Rouge, LA, USA
95 University of California, Los Angeles, CA, USA
4
96 University of Chicago, Enrico Fermi Institute, Chicago, IL, USA 98 University of Hawaii, Honolulu, HI, USA
100 University of Nebraska, Lincoln, NE, USA 101 University of New Mexico, Albuquerque, NM, USA 102 University of Pennsylvania, Philadelphia, PA, USA
103 University of Wisconsin, Madison, WI, USA 104 University of Wisconsin, Milwaukee, WI, USA
105 Institute for Nuclear Science and Technology (INST), Hanoi, Vietnam ‡ Deceased
a at Konan University, Kobe, Japan b On leave of absence at the Instituto Nacional de Astrofisica, Optica y Electronica
c at Caltech, Pasadena, USA d at Hawaii Pacific University
Note added: An additional author, C. Hojvat, Fermilab, Batavia, IL, USA, should be added to papers 2,3,4,5,6,7,8,9 in this collection

PROCEEDINGS OF THE 31st ICRC, ŁODZ 2009 1
Performance and operation of the Surface Detector of the PierreAuger Observatory
T. Suomijarvi ∗ for the Pierre Auger Collaboration †
∗Institut de Physique Nucleaire, Universite Paris-Sud, IN2P3-CNRS, Orsay, France†Observatorio Pierre Auger, Av. San Martın Norte 304, (5613) Malargue, Argentina
Abstract. The Surface Array of the Pierre AugerObservatory consists of 1660 water Cherenkov detec-tors that sample at the ground the charged particlesand photons of air showers initiated by energetic cos-mic rays. The construction of the array in Malargue,Argentina is now complete. A large fraction of thedetectors have been operational for more than fiveyears. Each detector records data locally with timingobtained from GPS units and power from solarpanels and batteries. In this paper, the performanceand the operation of the array are discussed. Weemphasise the accuracy of the signal measurement,the stability of the triggering, the performance ofthe solar power system and other hardware, and thelong-term purity of the water.
Keywords: Detector performance, Surface Detector,Pierre Auger Observatory
I. I NTRODUCTION
The Surface Detector (SD) of the Pierre Auger Ob-servatory is composed of Water Cherenkov Detectors(WCD) extending over an area of 3000 km2 with 1500 mspacing between detectors. In addition to the detectorsin the regular array, some locations of the array wereequipped with two and three nearby detectors, placedat ∼10 meters from each other. These ”twins” and”triplets” provide a very useful testbench for studiesof signal fluctuation, timing resolution and energy andangular reconstruction precision. Combined with theHEAT telescopes and the AMIGA muon detector array,a denser array of WCD with detector spacing of 750 mhas also been deployed. The total number of detectorstations is 1660. The hardware of the surface detector isdescribed extensively in [1], [2].
Installation of detectors started in 2002 and the Ob-servatory has been collecting stable data since January2004. The construction was completed in June 2008.Figure 1 shows the current status of the array.
The Observatory has been running now with its fullconfiguration for nearly one year and its commissioningis completed. The failure rates of various componentshave been assessed and the Surface Detector is nowentering into a regular long term operation and main-tenance phase. Some detectors have been operationalalready for more than 8 years which permits the studyof their long term performance. In this paper, after ashort description of the Surface Detector, the detectorresponse and uniformity, its acceptance and long-term
Fig. 1: Current deployment status of the array. Tankswithin the shaded area are filled with water and inoperation.
performance, and finally its operation and maintenanceare discussed.
II. D ESCRIPTION OF THESURFACE DETECTOR
Each WCD consists of a 3.6 m diameter water tankcontaining a TyvekR© liner for uniform reflection ofthe Cherenkov light. The liner contains 12,000 l ofultra-high purity water with resitivity typically higherthan 5 MΩ.cm. Three nine-inch-diameter photomulti-plier tubes (PMTs) are symmetrically distributed at adistance of 1.20 m from the center of the tank andlook downwards through windows of clear polyethyleneinto the water to collect the Cherenkov light producedby the passage of relativistic charged particles throughthe water. The water height of 1.2 m makes it alsosensitive to high energy photons, which convert in thewater volume. A solar power system provides an averageof 10 W for the PMTs and the electronics packageconsisting of a processor, GPS receiver, radio transceiverand power controller.
The signals produced by the Cherenkov light are readout by three large 9” XP1805 Photonis photomultipliers.The PMTs are equipped with a resistive divider basehaving two outputs: anode and amplified last dynode [3].This provides a large dynamic range, totaling 15 bits,
Page 6

2 PIERRE AUGER COLLABORATION, SD PERFORMANCE AND OPERATION
extending from a few to about105 photoelectrons. Thehigh voltage is provided locally. The nominal operatinggain of the PMTs is 2×10⁵ and can be extended to 106.The base, together with the HV module, is protectedagainst humidity by silicone potting.
The signals from anode and dynode are filtered anddigitised at 40 MHz using 10 bit Flash Analog-DigitalConverters (FADC). Two shower triggers are used:threshold trigger (ThT) and time-over-threshold (ToT)trigger. The first one is a simple majority trigger witha threshold at 3.2 VEM (Vertical Equivalent Muon).The ToT trigger requires 12 FADC bins with signalslarger than 0.2 VEM in a sliding window of 3µs.The time-over-threshold trigger efficiently triggers onthe shower particles far away from the shower core.In addition, a muon trigger allows for recording ofcontinuous calibration data. The third level trigger, T3,initiates the data acquisition of the array. It is formed atthe Central Data Acquisition System (CDAS), and it isbased on the spatial and temporal combination of localstation triggers. Once a T3 is formed, all FADC tracesfrom stations passing the local trigger are sent to theCDAS.
A common time base is established for differentdetector stations by using the GPS system. Each tankis equipped with a commercial GPS receiver (MotorolaOnCore UT) providing a one pulse per second outputand software corrections. This signal is used to syn-chronise a 100 MHz clock which serves to timetag thetrigger. Each detector station has an IBM 403 Pow-erPC micro-controller for local data acquisition, softwaretrigger and detector monitoring, and memory for datastorage. The station electronics is implemented in asingle module called the Unified Board, and mountedin an aluminum enclosure. The electronics package ismounted on top of the hatch cover of one of the PMTsand protected against rain and dust by an aluminumdome.
The detector calibration is inferred from backgroundmuons. The average number of photoelectrons per muoncollected by one PMT is 95. The measurement of themuon charge spectrum allows us to deduce the chargevalue for the Vertical Equivalent Muon,QV EM , fromwhich the calibration is inferred for the whole dynamicrange. The cross calibration between the two channels,anode and dynode outputs, is performed by using smallshower signals in the overlap region of the two channels[4].
The decay constant of the muon signal is related tothe absorption length of the light produced. This dependson various parameters such as the TyvekR© reflectivityand the purity of the water. The signal decay constantcorrelates with the so called area-to-peak (A/P) ratio ofthe signal:
A/P =QV EM
IV EM
(1)
where IV EM is the maximum current of the muonsignal. This area-to-peak ratio is a routine monitoring
hpk1Entries 2799Mean 47.97RMS 4.601
VEM current (ADC counts)20 30 40 50 60 70 80
0
50
100
150
200
250 hpk1Entries 2799Mean 47.97RMS 4.601
Fig. 2: VEM measured for 2799 PMTs.
quantity that is directly available from the local stationsoftware.
III. D ETECTOR RESPONSE AND UNIFORMITY
Stable data taking with the Surface Detector started inJanuary 2004 and various parameters are continuouslymonitored to ensure the good performance of the detec-tors. The noise levels are very low. For both the anodeand dynode channels, the mean value of the pedestalfluctuation RMS is below 0.5 FADC channels corre-sponding to about 0.01 VEM. The intrinsic resolutionof the GPS time tagging system is about 8 ns requiringa good precision for the station location. An accuracybetter than 1 meter is obtained for the tank position bymeasuring the positions with differential GPS.
Figure 2 shows the muon peak current (IV EM ) valuesfor a large number of PMTs. The mean value of themuon peak (IV EM ) is at channel 48 with an RMS of4.6 showing a very good uniformity of the detectorresponse. Trigger rates are also remarkably uniform overall detector stations, also implying good calibration andbaseline determination. The mean value of the thresholdtrigger rate is 22 Hz with dispersion less than 2%. Thetime-over threshold trigger is about 1 Hz with a largerdispersion. This is due to the fact that this trigger issensitive to the pulse shape and thus is more sensitiveto the characteristics of the detector. It is observed thatthe new detectors often have ToT values which arehigher and then stabilise after a few months to about1 Hz. The trigger studies and the studies on the muonresponse show that the detectors have, after a few monthstabilisation, a good uniformity.
Day-night atmospheric temperature variations can belarger than 20C. In each tank, temperature is measuredon the PMT bases, on the electronics board, and on thebatteries which allows to correlate various monitoringdata with the temperature. Typical day-night variationsare of the order of 2 ADC channels for the muon peak.This is mainly due to the sensitivity of the PMTs totemperature. These temperature variations also slightlyaffect the ToT-trigger. The muon calibration is made on-line every minute. This continuous calibration allows to
Page 7

PROCEEDINGS OF THE 31st ICRC, ŁODZ 2009 3
Date01/01/04 31/12/04 31/12/05 31/12/06 01/01/08 31/12/08
.yr.
sr)
2E
xpo
sure
(km
0
2000
4000
6000
8000
10000
12000
Fig. 3: Evolution of the exposure between January 1st,2004 and December 31st, 2008.
correct for the day-night temperature effects.
IV. D ETECTOR ACCEPTANCE
To ensure good data quality for physics analysisthere are two additional off-line triggers. The physicstrigger, T4, is needed to select real showers from theset of stored T3 data. This trigger is mainly based oncoincidence between adjacent detector stations withinthe propagation time of the shower front. In addition,there is a so-called fiducial trigger, T5, which excludesevents where a part of the shower may be missing. Thefull efficiency of the SD trigger and event selection isreached at 3 1018 eV. Above this energy, the calculationof the exposure is based on the determination of thegeometrical aperture and of the observation time. Figure3 shows the evolution of the integrated exposure betweenJanuary 1st, 2004 and December 31st, 2008.
The fiducial trigger is based on hexagons allowingto exploit the regularity of the array. The aperture ofthe array is obtained as a multiple of the apertureof the elemental hexagon cell. In practice, any activestation with six active neighbors contributes exactly tothe elementary hexagon aperture, a cell. The number ofcells, Ncell(t), is not constant over time due to possibletemporary problems in the stations (e. g. failures ofelectronics, power supply, communication system, etc.).Ncell(t) is constantly monitored. In Fig. 4 the evolutionof the number of hexagonal cells with time is shown.
The very precise monitoring of the array configura-tions has allowed us to exploit data during the con-struction phase. The evolution as a function of time ofthe number of trigger cells is globally similar to theevolution of the acceptance. Some differences howevercan be seen. For example, the pronounced dip seen inFig. 4 in January 2008 corresponds to a large storm thataffected the communication system.
V. L ONG-TERM PERFORMANCE
Figure 5 shows the area-to-peak ratio for a typicalPMT channel as a function of time. Two main effects
Date31/12/04 31/12/05 31/12/06 01/01/08 31/12/08
Cel
lN
200
400
600
800
1000
1200
Fig. 4: Evolution of the number of hexagon cells asa function of time between January 1st, 2004 andDecember 31st, 2008.
3.6
3.8
4
4.2
4.4
072003
012004
072004
012005
072005
012006
072006
012007
072007
012008
072008
012009
072009
Are
a/P
eak
(25n
s)
time(MM/YYYY)
maxmin
Fig. 5: Area-to-peak ratio as a function of time for atypical PMT channel. The upper curve corresponds tothe maximum value and the lower curve to the minimumvalue during 24 hours reflecting the day-night variations.
are observed: a slight global decrease and small seasonalvariations. The two curves reflect the maximum day-night variations (see figure caption).
The maximum day-night variations are due to outsidetemperature variations. As explained above, the muoncalibration is made on-line every minute which allows tocorrect for this effect. Seasonal amplitudes of variaionsin the area-to-peak ratio are∼1%. The seasonal effectsare also mostly due to outside temperature changes. Theglobal decrease of the signal as a function of time couldbe due to changes in the liner reflectivity or in the waterquality. From the current studies, the expected fractionalsignal loss in 10 years is less than 10% which givesconfidence in a very good long-term performance of theSurface Detector.
VI. OPERATION AND MAINTENANCE
Currently more than 1600 surface detector stationsare operational. Concerning the WCD itself, only very
Page 8

4 PIERRE AUGER COLLABORATION, SD PERFORMANCE AND OPERATION
few failures have been detected. Only a few liners wereobserved to leak shortly after installation. In this case,which constitutes the worst failure mode, the tank isemptied and brought back to the Assembly Buildingfor replacement of the interior components. Similarly,only a few solar panels have been damaged or weremissing. Solar power system parameters are recordedand analyzed using the central data acquisition system.The average battery lifetime is 4 years, and batteries arechanged during regular maintenance trips.
The PMTs and electronic boards are the most criticalelements of the Surface Detector stations. They aresubject to very severe environmental conditions: temper-ature variations, humidity, salinity and dust. The failurerates of the PMTs are about 20 per year (about 0.5%).Some HV module and base problems have been detectedas well as some problems due to bad connections. Allother failures except those concerning the PMTs (suchas broken photocathode) can be repaired on site. It iscurrently estimated that the number of spare PMTs issufficient for about 10-15 more years of operation. Thefailure rate of electronic boards is about 1% per year.Some of the problems are repaired simply by reflashingthe software. Most of the electronic problems can alsobe repaired on site. All the spare parts are stored on site.
The operation of the array is monitored online andalarms are set on various parameters. The maintenancegoal is to have no more that 10 detector stations out ofoperation at any time. It is currently estimated that thelong-term maintenance (including the battery change)requires about 3 field trips per week. This maintenancerate is within the original expectations.The maintenanceis organized by the Science Operation Coordinator andperformed by local technicians. The Surface Detectordoes not require a permanent presence of physicists fromother laboratories on site. However, remote shifts for thedata quality monitoring will be implemented.
VII. C ONCLUSIONS
The construction of the Southern site of the PierreAuger Observatory in Malargue, Argentina, was com-pleted in June 2008 and the Observatory has been run-ning now with its full configuration for nearly one year.The operation of the Surface Detector array is monitoredonline and alarms are set on various parameters. Thedesign is robust to withstand the adverse field conditions.The failure rates of various components are low and mostof the failures can be repaired on site. The maintenanceis performed by local technicians.
The characteristics of the Surface Detector stations arevery uniform and the noise levels and resolutions exceedoriginal requirements. The acceptance of the array isconstantly monitored. This has allowed to take reliablephysics data also in the construction phase.
Some detectors have been operational already formore than 8 years which has allowed to study the long-term performance of the Surface Detector. In particular,these studies have shown that the water quality remainsexcellent over several years.
Intensive and automatic monitoring, low failure rates,and local maintenance capabilities give confidence ina very stable long-term operation of the Pierre AugerSurface Detector.
REFERENCES
[1] Auger Collaboration,Nucl. Instrum. Meth. A423 (2004) 50[2] I. Allekotte et al., Nucl. Instrum. Meth. A586 (2008) 409[3] B. Genolini et al.,Nucl. Instrum. Meth. A504 (2003) 240[4] X. Bertou et al.,Nucl. Instrum. Meth. A568 (2006) 839
Page 9

PROCEEDINGS OF THE 31st ICRC, ŁODZ 2009 1
Extension of the Pierre Auger Observatory using high-elevationfluorescence telescopes (HEAT)
Matthias Kleifges∗ for the Pierre Auger Collaboration
∗Forschungszentrum Karlsruhe, Institut fur Prozessdatenverarbeitung und Elektronik,Postfach 3640, 76021 Karlsruhe, Germany
Abstract. The original fluorescence telescopes of thesouthern Pierre Auger Observatory have a field ofview from about 1.5 to 30 in elevation. The con-struction of three additional telescopes (High Eleva-tion Auger Telescopes HEAT) is nearing completionand measurements with one telescope have started.A second telescope will be operational by the timeof the conference. These new instruments have beendesigned to improve the quality of reconstructionof showers down to energies of 1017 eV. The extratelescopes are pivot-mounted for operation with afield of view from 30 to 58. The design is optimisedto record nearby showers in combination with theexisting telescopes at one of the telescope sites, aswell as to take data in hybrid mode using the mea-surements of surface detectors from a more compactarray and additional muon detectors (AMIGA). Thedesign, expected performance, status of construction,and first measurements are presented.
Keywords: HEAT, high-elevation fluorescence tele-scope, galactic, extragalactic
I. INTRODUCTION
The Pierre Auger Observatory has been designed tomeasure the energy, arrival direction and compositionof cosmic rays from about 1018 eV to the highestenergies with high precision and statistical significance.The construction of the southern site near Malargue,Province of Mendoza, Argentina is completed since mid2008 and the analysis of the recorded data has providedfirst results with respect to the energy spectrum [1], thedistribution of arrival directions [2], the composition,and upper limits on the gamma ray and neutrino flux[3], [4]. The measured cosmic ray observables at thehighest energies are suitable to tackle open questions likeflux suppression due to the GZK cut-off, to discriminatebetween bottom-up and top-down models and to locatepossible extragalactic point sources.
However, for best discrimination between astrophysi-cal models, the knowledge of the evolution of the cosmicray composition in the transition region from galacticto extragalactic cosmic rays in the range 1017 eV to1019 eV is required. Tests of models for the accelera-tion and transport of galactic and extragalactic cosmicrays are sensitive to the composition and its energydependence in the transition region where the currentobservatory has low efficiency.
30° field of view
Fig. 1. Effect of limited field of view on reconstruction: Showersapproaching the telescope have much higher reconstruction probabilitythan those departing.
The fluorescence technique is best suited to determinethe cosmic ray composition by a measurement of thedepth of shower maximum. However, it is difficult tolower the energy threshold with the original design ofthe fluorescence telescopes. As the fluorescence lightsignal is roughly proportional to the primary particleenergy, low energy showers can be detected only atclose distance to a telescope. The field of view of theexisting Auger fluorescence telescope (FD) is limited to30 above the horizon (see figure 1). At close distancesonly the lowest few kilometres of the atmosphere arewithin the field of view. However, low energy showersreach their maximum of development at higher altitudes.Thus, the crucial region around the shower maximumis generally not observable. The small fraction of theshower development, which falls within the field of view,is mostly very dim and is insufficient to determine thedepth of shower maximum Xmax. In addition, this cut-off effect also depends on primary mass and showerdirection. A plain reconstruction of the shower profileusing raw data would yield biased results with respectto zenith angle and mass composition. Cuts on the datato remove this bias (anti-bias cuts) are not useful asonly very few showers would be left for the Xmax
determination.From these arguments it is clear that an effective
and unbiased detection of cosmic rays of lower energiesrequires the extension of the field of view to larger eleva-tions. From the data collected since 2004, we know thatthe quality of reconstruction is improved considerably ifshowers are recorded by a hybrid trigger. These hybridevents provide information on the shower profile fromthe FD telescopes, but in addition at least one surface
Page 10

2 M. KLEIFGES et al. HEAT EXTENSION OF THE PIERRE AUGER OBSERVATORY
detector has detected secondary shower particles simul-taneously. The data from the SD system restricts the timeand the location of the shower impact point on ground.This improves the reconstruction of the shower geometrysignificantly [5]. An accurate geometry reconstructionwith an uncertainty of about 0.5 is the necessary basisfor energy and composition determination. But recordingof hybrid data needs also adequate trigger efficiencyfor the individual surface detectors at lowest energies.Therefore, an enlarged energy range down to 10 17 eVwith high-quality hybrid events requires an extendedfield of view for FD telescopes in combination witha surface detector array of higher density in a smallfraction of the observatory.
II. DESIGN AND PROPERTIES OF HEAT
In 2006 the Auger Collaboration decided to extendthe original fluorescence detector, a system consistingof 24 telescopes located at four sites, by three HighElevation Auger Telescopes (HEAT). These telescopeshave now been constructed, and they are located 180 mnorth-east of the Coihueco FD building. At the sametime, the collaboration deployed extra surface detectorstations as an infill array of 25 km2 close to and inthe field of HEAT. Additional large area muon detectors(AMIGA) [6] will determine the muon content of theshower and further improve the determination of thecomposition of the primary cosmic ray particles.
The design of HEAT is very similar to the original FDsystem, except for the possibility to tilt the telescopesupwards by 29. In both cases a large field of viewof about 30× 30 is obtained using a Schmidt optics.Fluorescence light entering the aperture is focused by aspherical mirror onto a camera containing 440 hexagonalPMTs. An UV transmitting filter mounted at the entrancewindow reduces background light from stars effectively.An annular corrector ring assures a spot size of about0.6 despite the large effective aperture of 3 m2. Thehigh sensitivity of the Auger FD telescopes enablesthe detection of high energy showers up to 40 kmdistance. A slow control system for remote operationfrom Malargue allows safe handling.
Differences between the conventional FD telescopesand HEAT are caused by the tilting mechanism. Whilethe original 24 FD telescopes are housed in four solidconcrete buildings, the 3 HEAT telescopes are installedin individual, pivot-mounted enclosures (see figure 2).Each telescope shelter is made out of lightweight in-sulated walls coupled to a steel structure. It rests ona strong steel frame filled with concrete. An electricmotor can tilt this heavy platform though a commercialhydraulic drive by 29 within two minutes. The wholedesign is very rigid and can stand large wind andsnow loads as required by legal regulations. All opticalcomponents are connected to the heavy-weight groundplate to avoid wind induced vibrations and to keep thegeometry fixed.
Fig. 2. Photo of the 3 HEAT telescopes tilted upward, end of January2009. In the background the telecommunication tower of Coihueco isvisible.
Mirror and camera are adjusted in horizontal position.However, by tilting the telescope the varying gravita-tional force on camera body and mirror can changetheir relative position. Supplemental fixing bolts and animproved support structures are foreseen to keep thealignment of the optical system stable, which is essentialfor telescope pointing and optical resolution. Sensors forinclination are mounted at the mirror top, camera topand bottom, and at the aperture box. Distance sensorsmonitor the critical distance between camera and severalpoints at the mirror system. These sensors are readoutfrequently for monitoring purposes.
Another design change for HEAT is the use of animproved DAQ electronics. The concept of the newelectronics is the same as before, but as several elec-tronic circuits have become obsolete, every front-endboard had to be redesigned. Like the conventional FDelectronics, the DAQ of one HEAT telescope contains20 Analog Boards (AB) for analog signal processing,20 First Level Trigger (FLT) boards for signal digitizingand storage, and one Second Level Trigger (SLT) boardfor the recognition of fluorescence light tracks and theinitiation of data readout.
Along with faster FPGA logic the sampling rate wasincreased from 10 MHz to 20 MHz. The cut-off fre-quency of the anti-aliasing filters on the AB was adaptedto about 7 MHz, but the other functions of the boardremain the same. The redesigned FLT board implementsall functions in FPGA of the Cyclone II FPGA family.A new custom-designed backplane provides dedicatedpoint-to-point links between the FLT and SLT whichlead to a factor 40 higher readout speed compared tothe previous design. The usage of state-of-the-art FPGAin combination with the higher speed also establishesnew fields of application for the DAQ system. TheHEAT DAQ system is also the baseline design and theprototype for the Auger North FD electronics.
III. OPERATION OF HEAT
The horizontal (‘down’) position is the only positionin which a person can physically enter the enclosure.This configuration is used for installation, commission-ing, and maintenance of the hardware. The absolute
Page 11

PROCEEDINGS OF THE 31st ICRC, ŁODZ 2009 3
calibration of the telescopes will be performed in thisposition as well. As the field of view of the exist-ing Coihueco telescopes overlaps with HEAT in downposition, it is possible to record air showers or lasertracks simultaneously. By comparing the reconstructionresults from both installations one can directly determinethe telescope resolution in energy and Xmax. We alsowant to reserve part of the time at one HEAT telescopefor prototype studies for Auger North. Recording thesame event in Coihueco and with the Auger Northprototype will allow a direct comparison of the triggerand reconstruction efficiencies.
The tilted (‘up’) position is the default HEAT state.Telescopes are moved into this position at the beginningof a measuring run and stay that way untill the endof the run. From the trigger point of view the tele-scopes operate like a fifth FD building. Data of of thedifferent installations (HEAT, diffenent FD sites, infilland Amiga, surface detector) are merged offline only,but the exchange of triggers in real time makes therecording of hybrid showers possible. The combineddata will improve the accuracy of shower energy andXmax determination at all energies, but especially at thelower end down to 1017 eV.
IV. FIRST MEASUREMENTS
First measurements were performed with HEAT tele-scope #2 at the end of January 2009. From January,30th to February, 1st the telescope was operated for twonights in up and down position. At first, the camera wasilluminated with a short light pulse from a blue LEDlocated at the center of the mirror. The High Voltagefor the PMTs and the individual electronic gains wereadjusted to achieve uniform light response in every pixel.Subsequent measurements with the LED pulser wereperformed at different tilting angles, but with the samesettings as found in in down position. No indicationswere found for a gain change due to changed orientationof the PMTs in the Earth’s magnetic field.
In the next step, the mechanical stability of theoptical system was verified. The telescope was tiltedseveral times from down to up position and back. Thereadings of the inclination and distance sensors wererecorded during the movement. The analysis of the dis-tance between camera and center of the mirror showeddamped oscillations of low amplitude which stoppedwithin seconds after the movement terminated. At restthe distance change between up and down position isless than 0.5 mm which is neglible for the telescope’soptical properties.
After these cross-checks several showers were re-corded with the telescope tilted in up position and incoincidence with Coihueco telescopes #4 or #5. One ofthe recorded events is shown in figure 3. The event dataof both telescopes match very well in time (colour of thepixels in figure 3). The reconstruction yields a showerdistance of 2.83±0.06 km from Coihueco and an energyof the primary particle of (2.0 ± 0.2) · 1017 eV.
azimuth [deg]30 40 50 60 70 80
elev
atio
n [d
eg]
0
10
20
30
40
50
HEAT #2 -->
<-- Coihueco #5
1. February 2009, 2:36 UTC
Fig. 3. This shower was recorded by HEAT telescope #2 andCoihueco telescope #5.The relative arrival time of the fluorescencelight is coded in the colour of the pixel. The solid line is a fit of theshower detector plane.
In figure 4, the reconstructed longitudinal showerprofile is shown together with a fit to a Gaisser-Hillasfunction. The fit yields a value of (657 ± 12) g cm−2
for Xmax. The plot also accentuates the need for HEATtelescopes for an accurate reconstruction: Using only thedata point above a slant depth of 700 g cm−2 (Coihuecodata) it would not have been possible to fit the profileand find a precise maximum.
]2slant depth [g/cm400 500 600 700 800 900
)]2dE
/dX
[PeV
/(g/c
m
0
0.1
0.2
0.3
0.4
0.5/Ndf= 37.6/412χ
HEAT data points Coihueco data
Fig. 4. Longitudinal shower profile of event in figure 3 together withGaisser-Hillas-fit. Only a fit using both HEAT (left) and Coihueco(right) data points results in a reasonable Xmax value.
V. CONCLUSION AND OUTLOOK
First measurements with a single telescope havedemonstrated that HEAT will improve the energy thresh-old of the Pierre Auger Observatory at the Southernsite down to about 10
17 eV. The HEAT design satisfiesall requirements with respect to stability and ease ofoperation. It is expected that all three HEAT telescopesare fully operational in September 2009. They willprovide interesting data in the transition region fromgalactic to extragalactic sources and allow importantprototype tests for the design of the Auger North FDsystem.
Page 12

4 M. KLEIFGES et al. HEAT EXTENSION OF THE PIERRE AUGER OBSERVATORY
REFERENCES
[1] F. Schussler for the Pierre Auger Colloboration, Measurement ofthe cosmic ray energy spectrum above 1018 eV with the PierreAuger Observatory, these proceedings (2009), ID # 0114
[2] J. D. Hague for the Pierre Auger Collaboration, Correlation ofthe highest energy cosmic rays with nearby extragalactic objectsin Pierre Auger Observatory data, these proceedings (2009), ID# 0143
[3] P. Homola for the Pierre Auger Collaboration, Ultra-high en-ergy photon studies with the Pierre Auger Observatory, theseproceedings (2009), ID # 0030
[4] J. Tiffenberg for the Pierre Auger Collaboration, Limits on theflux of diffuse ultra high energy neutrinos set using the PierreAuger Observatory, these proceedings (2009), ID # 0180
[5] P. Sommers, Capabilities of a giant hybrid air shower detector,Astroparticle Physics, Vol. 3 (1995), p349-360
[6] P. Buchholz for the Pierre Auger Collaboration, Hardware De-velopments for the AMIGA enhancement at the Pierre AugerObservatory, these proceedings (2009), ID # 0043
Page 13

PROCEEDINGS OF THE 31st ICRC, ŁODZ 2009 1
AMIGA - Auger Muons and Infill for the Ground Array of thePierre Auger Observatory
Manuel Platino∗ for the Pierre Auger Collaboration†
∗Centro Atomico Constituyentes (Comision Nacional de Energıa Atomica/CONICET/UTN-FRBA)†Observatorio Pierre Auger, Av. San Martın Norte 304 (5613) Malargue, Prov. Mendoza, Argentina
Abstract. AMIGA consists of 85 detector pairs eachone composed of a surface water-Cherenkov detectorand a buried muon counter. Each muon counterhas an area of 30 m2 and is made of scintillatorstrips with doped optical fibers glued to them, whichguide the light to 64 pixel photomultiplier tubes.The detector pairs are arranged at 433 and 750 marray spacings in order to perform a detailed studyof the 1017 eV to 1019 eV spectrum region. Designparameters and performance requisites are outlined.Construction of the first muon detectors, associatedsoftware and hardware, and the results of laboratorytests are described. Some preliminary results on theperformance of the 750 m array of surface detectorsare presented.
Keywords: Muon detectors; Pierre Auger observa-tory; Enhancement.
I. INTRODUCTION
The Pierre Auger Observatory was built to detect thehighest energy cosmic rays known in nature with twodistinctive design features, a large size and a hybriddetection system in an effort to observe a large numberof events per year with minimum systematic uncertain-ties. The Southern component of the Auger Observatoryis located in the Province of Mendoza, Argentina, andit spans an area of 3000 km2 covered with over 1600water Cherenkov surface detectors (SDs) deployed ona 1500 m triangular grid with 24 fluorescence detector(FD) telescopes grouped in units of 6 at four siteson the array periphery, each one with a 30 × 30
elevation and azimuth field of view [1], [2]. With sucha geometry the Auger Observatory has been able to castlight on two spectral features at the highest energies,the ankle and the GZK-cutoff [3], [4]. At lower energiesthe electromagnetic fields deflect the particle trajectoriesrendering impossible to identify the sources, but stillcomposition studies should help discriminate whetherthe sources are galactic or extragalactic, and wherethe transition occurs. Besides the mentioned ankle andGZK-cutoff, the cosmic ray spectrum has two otherfeatures where the spectral index abruptly changes: theknee (∼ 4× 10¹⁵ eV) and the second knee (∼ 4× 10¹⁷
eV). The transition from galactic to extragalactic sourcesis assumed to occur either at the second knee or alongthe ankle (see [5] and references therein) and the wayto identify it would be a change in the cosmic ray
composition from dominant heavy primaries to eithera mixed or light-dominated composition.
II. AMIGA BASELINE DESIGN
Within the Auger baseline design described above, thesurface array is fully efficient above ∼ 3 × 10¹⁸ eVand in the hybrid mode this range is extended down to∼ 1018 eV which does not suffice to study the secondknee - ankle region. For this purpose [6], Auger hastwo enhancements: AMIGA (“Auger Muons and Infillfor the Ground Array”) [5], [7], [8] and HEAT (“HighElevation Auger Telescopes”) [9]. Only a small area isneeded since the cosmic ray flux increases rapidly withdecreasing particle total energy. On the other hand, thedetectors have to be deployed at shorter distances amongeach other in a denser array since lower energies imply asmaller air shower footprint. AMIGA consists of a groupof detector pairs deployed in a denser array comprising61 detectors spaced 750 m apart and 24 extra detectorsspaced 433 m apart. All 85 pairs are placed within de1500 m SD array. This group of SDs is referred in thispaper as the Graded Infill Array or simply the infill.Currently the infill has 35 surface detectors, which havebeen operational since September 2008, accounting for40% of its planned full aperture. Figure 1 shows thedeployment progress of the infill in the Southern AugerObservatory at the time of this paper.
Each AMIGA detector pair consists of a waterCherenkov SD and a neighboring buried muon counter(MC). The MC consists of three scintillator moduleseach one lodged in a PVC casing. The scintillators arehighly segmented in strips 400 cm long × 4.1 cm wide ×1.0 cm high made of extruded polystyrene doped withfluor and co-extruded with a TiO2 reflecting coating.They have a groove on the top side where a wave-length-shifter optical fiber is glued and covered with reflectivefoil. The fibers end at an optical connector matched andaligned to a 64 channel multi anode Hamamatsu H8804photomultiplier tube (PMT) of 2 mm × 2 mm pixels.The coupling of the fibers to the PMT requires a finepolishing of the surface that touches the glass on top ofthe photocathode. For this purpose we use a fly-cutterto polish the surface of the 64 fibers attached to theoptical connector as a single unit in order to make thefibers-connector surface as even as possible. The contactof the fiber connector to the PMT glass is lubricatedwith optical grease and the alignment system chosen forthe PMT to fibers coupling is the same one as used by
Page 14

2 M. PLATINO et al. AMIGA
Fig. 1: The Graded Infill Array of the Southern AugerObservatory. The bigger hexagon highlights the 750mspaced SDs. The next smaller hexagon highlights thedenser 433m spaced SDs, not deployed yet. The smallesthexagon highlights the UC. The crossed SDs are part ofthe 750 m array but still not deployed on site at the timeof this paper. The darkest spots indicate the SDs that arepart of the Auger original array.
the OPERA project (see Figure 47 in [10]). Each MCwould then be composed of 192 independent channelsburied alongside a SD at a depth to be experimentallydetermined [11].
To test the baseline design, an engineering array alsocalled Unitary Cell (UC) is being built at 7 of the 61surface detector stations locations in the 750 m infillarray, forming an hexagon around the “Los Piojos”central SD. In this array, each MC is composed of 4modules rather than 3 since a module is halved intotwo with 200 cm long scintillator bars, providing 256independent channels in order to assess muon pile-upclose to the airshower core. Each MC of the UC will beburied 2.25 m deep.
Figure 2 shows a diagram of the scintillator module.The 64 400 cm strips are placed in two groups of 32at each side of a central dome where the electronicsis lodged. The module casing is built with PVC panels(transparent in the figure to reveal the strips) onto whichthe strips with fibers are glued. Structural stability isprovided by four PVC U section bars placed at bothsides of the central dome all along the module. The UCMCs are equipped with 0.8 mm diameter St. Gobbin and1.0 mm diameter Kuraray fibers for the 200 cm and 400cm strips, respectively.
AMIGA electronics have both an underground anda surface component powered by solar panels, whichprovide a total of 20W, 24V DC supply to the buried MCon each SD pair. Each scintillator module has a PMT towhich a set of printed circuit boards (PCBs) are con-nected to provide PMT pulse filtering and amplification,digitization, sampling and storing in an internal memory(see [12] for more details on the PCBs). Each PMTsignal is filtered by an inverter amplifier of gain ∼ 3.8and digitized, whose output is sampled and transformed
U Section
bars
Scintillator Strips
Electronics
dome
Fig. 2: AMIGA scintillator module. Top PVC panelscovering the scintillator strips are not shown. High-lighted are the strips, the PVC U bars, the PMT andelectronics dome, zoomed in the top right insert.
into digital data by a Cyclone III EP3C25 Field Pro-grammable Gate Array (FPGA) from Altera every 3.125ns [12], [13]. The discrimination level can be controlledindependently for each of the 64 channels using 8units of 8-channel programmable 12 bit digital-to-analogconverters (TLV5630 by Texas Instruments) which arecommanded at any given time from the FPGA. Afterlaboratory experiments, the threshold was set at ∼ 30%of the pixel mean single photo electron (SPE) amplitude(∼ 15 mV after amplification). The underground elec-tronics is regulated by a microcontroller (TMS470 16-bit Risc by Texas Instruments) which performs the datatransfer to the surface and the slow control (temperature,humidity and power supplies monitoring).
The digitized pulses are continuously stored in acircular buffer in a static RAM memory, task performedby the FPGA, and upon reception of an SD trigger signalthey are adequately channeled through a CAN bus bythe microcontroller to the surface detector [13]. On thesurface a single board microcomputer receives the dataand upon a request from the central data acquisitionsystem at the Auger campus, transmits both SD and MCdata by a radio link using the IEEE 802.15.4 standard,as proposed for the AMIGA network. The topologyused for this network is point-to-multipoint, in whichevery SD of the infill connects to a hub in the nearbyCoihueco hill. Ultra low power consumption, industrialgrade XBee pro radios working over IP are used for thispurpose. The Linux TUN driver running on the singleboard microcomputer of the surface detector is used totunnel the IP network through the serial port and theXBee radio. Relatively low bit rate (effective ∼ 125kbps) and 100 bytes frames requires header compressionfor IP traffic. The first successful tests with the 802.15.4installed on the “Tierra del Fuego” SD showed no dataloss and a reliable communication to the Auger campus.
Page 15

PROCEEDINGS OF THE 31st ICRC, ŁODZ 2009 3
180
160
140
120
100
80
60
40
20
0
-20
[mV
]
4 (2 SPE)
2
15
100% SPE
30%
0%
0 20[ns]
analog signal
digital signal
0 0 0 1 1 1 1 0 0 0
Fig. 3: Analog train of pulses produced by an impingingbackground muon on a scintillator strip and schematicsof data digitalization.
[ns]0 10 20 30 40 50
12
10
8
6
4
2
S1
S0
Initial Pulses
Overlapped pulses
Digital samples
Muon detected
Window
Fig. 4: Diagram of the one-bit sampling system used bythe AMIGA front end. The Y axis indicate the number ofeach arriving pulse at a given channel of the PMT from amuon excited scintillator bar. The X axis indicates time.
A smaller 16 channel version of the scintillator mod-ule was built in 2007 and buried for three months inCentro Atomico Constituyentes (CAC) in Buenos Aires.We measured the amplitude and charge histograms fora Hamamatsu H8711-06 PMT both on the surface andunderground. The results showed no significant changeon the performance in this first successful data takenfrom a buried prototype [14].
A typical amplified train of pulses produced by abackground muon is shown in Figure 3, labeled “analogsignal”. We see it comprises of four distinctive pulses,the fourth one is an isolated SPE pulse while the thirdone is a pile up of more than one SPE. Indicated are theequivalent voltage values for the mean SPE amplitude(labeled 100% SPE) and the discrimination level at 30%.
Fig. 5: AMIGA Scanner built at Centro Atomico Con-stituyentes
The digits on top of each pulse indicate the deducedcumulative number of SPEs that arrive at the PMT. Theexpected discrimination of this signal is labeled in Figure3 as “digital signal” and the 0 − 1 string illustratesthe output of the four possible 3.125 ns FPGA signals(see [12] for prototype measurements of the samplingprocess). Results of the simulated sampling and muoncounting process are shown in Figure 4, as performedby the analog front end and the digital board undera one-bit system. This plot shows the arrival time of12 SPE pulses (labeled “initial pulses”) generated in agiven channel of the scintillator module by an imping-ing background muon and their corresponding duration(indicated by the length in the X direction of the 12lines distributed in the Y axis from 1 to 12). The arrivaltime of each “initial pulse” is simulated based on resultsobtained from the characterization of the scintillator-fiber system, and their duration in time is obtained frommeasurements of the analog front end characterization.The “overlapped pulses” is the resulting digitized signalobtained at the front end after discrimination, comprisedof the overlapping of all the analog “initial pulses” intime. The “digital samples” are taken at locations witha mean 3.125 ns separation with fluctuations which takeinto account the jitter introduced during the samplingby the FPGA. The “window” between inverted trianglesdenotes the time frame within which no further muoncounts are allowed. The AMIGA trigger counts a muonif three or more “digital samples” of value S1 are withinthis time window. If exactly two S1s are within the timewindow, they will be counted as a muon if and only ifthere is one or more S0s between them. Note that thelate coming SPE is not overcounted as a muon. AMIGAdigital electronics uses a digital 0 for S1 and a digital 1for S0. These values are switched in these simulationsfor clarity purposes.
PMTs will be tested in a dark box built in the AMIGAlaboratory at CAC before transportation to the AugerObservatory. The relevant parameters to be checkedfor each PMT are: relative quantum efficiency, gainuniformity between pixels, crosstalk, overall dark-rate(sum of 64 channels) and the SPE mean amplitude.
Page 16

4 M. PLATINO et al. AMIGA
864
ϕ [º]
2 10 12 14 16
No
. o
f E
ntr
ies
0
5
10
15
20
25
30
35
Fig. 6: Reconstruction of arrival direction with andwithout infill SDs histogram. ϕ represents the differencebetween angles of arrival of the reconstructed showerwith minus without the infill measurements.
The response of each scintillator strip will be charac-terized with a 5 mCu 137Cs radioactive source mountedon an X-Y positioning system or “scanner” designedfor this purpose. Figure 5 shows the AMIGA scanneras mounted today in the scintillator module assemblyworkshop at CAC. The X-Y positioning system has two1 mm precision linear guides, one for each dimensionmoved by step-by-step motors. The positioning systemhas a total effective displacement of 3.75 m in the Xaxis and 4 m in the Y axis, expandable up to 9 m. Datacollected on the scintillator modules tests will be storedon the AMIGA detectors database to keep track of thestatus of all the MCs during and after the deployment,and for simulation purposes.
III. INFILL MEASUREMENTS
AMIGA data acquisition has now started with theSD 750 m infilled area and preliminary analyzes arepresented with a data set restricted to events with zenithangle θ < 60 and well constrained within the infill (i.e.with the six SDs of the hexagon enclosing the highestsignal SD in its center active). The graded infill wasenvisaged to both have saturated efficiency down to 1017
eV and significantly improve and test on the main arrayreconstruction uncertainties [8]. The latter was tested byreconstructing events with and without the infill and byimposing further data cuts of ≥ 7 and ≥ 3 SDs, respec-tively. The distribution of the space angle differencesbetween the mentioned reconstructions are compared inFigure 6. The 68% of such differences results to beinside 1.4, which shows the good compatibility of thetwo arrays, and is mostly related to the uncertainty of theAuger regular reconstruction due to the expected betterinfill accuracy being a denser array.
We also focused on a study of the preliminary energycalibration (see [15] for the method details as applied tothe 1500 m SD array) based on events simultaneouslydetected by the infill and the FD. Note that althoughthe infill and main array calibrations are both extractedfrom FD energy measurements, they will differ sincethey have to be optimized for different energy ranges,
log (S(600,38º)[VEM])10
1.2 1.4 1.6 1.8
log
(FD
En
erg
y [
eV])
17.2
17.4
17.6
17.8
18
18.2
18.4
10
1
Fig. 7: Correlation between S(600, 38) and the FDenergy
infill signals are more attenuated with zenith angle, andthe infill shower ground parameter is taken at 600 minstead of 1000 m.
Figure 7 shows the correlation between the con-stant intensity cut corrected shower ground parameterS(600, 38) and the FD assigned energy fitted with anexponential function.
IV. SUMMARY
The AMIGA baseline design is finalized and outlined.Final design details are being adjusted in the electronicsand the mechanical mounting at the time of this paper.The laboratory tests on the scintillator module prototypeand the electronics show positive results. A muon detec-tor module was buried and successfully operated. Fieldtests on the communications also show system reliability.Infill data acquisition has already began and analysis ledto a preliminary calibration.
REFERENCES
[1] The Pierre Auger Collaboration (J. Abraham et al.), Nucl. Inst.& Meth., A523 (2004) 50-59.
[2] I. Allekotte et al., Nucl. Inst. & Meth., A586 (2008) 409-420.[3] T. Yamamoto for the Pierre Auger Collaboration, Proc. 30th
ICRC (Merida-Mexico), V4, #318 (2007) 331-334.[4] The Pierre Auger Collaboration (J. Abraham et al.), Astropart.
Phys. 29 (2008) 188-204.[5] A.D. Supanitsky et al., Astropart. Phys. 29 (2008) 461-470.[6] G. Medina Tanco for the Pierre Auger Collaboration, Proc. 30th
ICRC (Merida-Mexico), V5, #991 (2007) 1101-1104.[7] A. Etchegoyen for the Pierre Auger Collaboration, Proc. 30th
ICRC (Merida-Mexico), V5, #1307 (2007) 1191-1194.[8] M.C. Medina et. al., Nucl. Inst. and Meth. A566 (2006) 302-311.[9] H. Klages for the Pierre Auger Collaboration, Proc. 30th ICRC
(Merida-Mexico), V5, #65 (2007) 849-852.[10] The OPERA Collaboration, The OPERA Target Tracker Techni-
cal Design Report, (2000).[11] F. Sanchez for the Pierre Auger Collaboration, Proc. 30th ICRC
(Merida-Mexico), V5, #1277 (2007) 1179-1182.[12] P. Buchholz for the Pierre Auger Collaboration, Proc. 31st ICRC
(these proceedings, Łodz-Poland), #43 (2009).[13] Z. Szadkowski for the Pierre Auger Collaboration, Proc. 31st
ICRC (these proceedings, Łodz-Poland), #371 (2009).[14] I.P. Sidelnik et al., 1st La Plata Int. School, Compact Objects
and their Emission, (2008) 115-120.[15] M. Roth for the Pierre Auger Collaboration, Proc. 30th ICRC
(Merida-Mexico), V4, #313 (2007) 327-330.
Page 17

PROCEEDINGS OF THE 31st ICRC, ŁODZ 2009 1
Radio detection of cosmic rays at the southern Auger ObservatoryA.M. van den Berg∗, for the Pierre Auger Collaboration†
∗Kernfysisch Versneller Instituut, University of Groningen, NL-9747 AA, Groningen, The Netherlands†Av. San Martın Norte 304, (5613) Malargue, Prov. de Mendoza, Argentina
Abstract. An integrated approach has been de-veloped to study radio signals induced by cosmicrays entering the Earth’s atmosphere. An engineeringarray will be co-located with the infill array of thePierre Auger Observatory. Our R&D effort includesthe physics processes leading to the developmentof radio signals, end-to-end simulations of realistichardware configurations, and tests of various systemson site, where coincidences with the other detectorsystems of the Observatory are used to benchmarkthe systems under development.
Keywords: radio detection
I. INTRODUCTION
Results from the Southern Pierre Auger Observatoryas well as the baseline design of the NorthernObservatory [1] point to the need of very large aperturedetection systems for ultra-high energy cosmic rays(UHE CRs); see, e.g., Ref [2]. There are a numberof worldwide efforts to develop and establish newdetection techniques that promise a cost-effectiveextension of currently available apertures to even largerdimensions. These are, for example, the observationfrom space of fluorescence emission by showers or theuse of large arrays of radio antennas.
The detection of radio emission induced by high-energyand ultra-high-energy cosmic rays hitting the Earth’satmosphere is possible because of coherent radiationfrom the extensive air shower at radio frequencies.This radiation, which is emitted by secondary particlescreated in the air shower, can be measured with simpleradio antennas, as was demonstrated first by Jelley in1965 [3]. Recently, improved technology has led to arevival of this technique. Radio detectors, like LOPESand CODALEMA produce promising results at energiesbeyond 1017 eV [4], [5].
With its nearly 100% duty cycle, a signal-to-noiseratio scaling with the square of the cosmic-ray energy,its high angular resolution, and its sensitivity to thelongitudinal air-shower evolution, the radio techniqueis particularly well-suited for detection of UHE CRsin large-scale arrays. Therefore, we are performing anR&D project to study UHE CRs using the detectionof coherent radio emission from air showers in theEarth’s atmosphere. The project, called AERA (AugerEngineering Radio Array), will have a dimension ofabout 20 km2. For such an area we expect an UHE
CR rate of about 5000 identified radio events per year.This data set will be used to address both scientificand technological questions. At the same time, thescale of such an array is large enough to test conceptsfor the deployment of hardware, for the operation ofhardware and software, and to monitor the sustainabilityof critical parts of the whole system for a much largerarray.
Fig. 1. Locations of the radio setups at the southern Observatory.Existing setups are located near the BLS and the CLF; the futureAERA is near Coihueco.
AERA will fulfill three science goals which are notindependent from each other, but have to be tackledsequentially in the time of operation and analysis and inclose conjunction with data from the baseline detectorsof the Observatory [6] and the enhancements AMIGA[7]and HEAT [8]. They are all located in the north-easternpart of the Observatory near the Coihueco fluorescencebuilding, see Fig. 1. The three science goals are listedbelow.
1) Thorough investigation of the radio emission froman air shower at the highest energies. This includesthe understanding of all the dependencies of theradio signal on general shower parameters andon the shower geometry. By this a better insightinto the underlying emission mechanism will bepossible; the question has to be answered whichis the theory of choice and to which level one hasto consider additional effects [9].
2) Exploration of the capability of the radio-detectiontechnique. Determination of the extend and accu-
Page 18

2 A.M. VAN DEN BERG et al. RADIO DETECTION OF COSMIC RAYS AT AUGER
racy of stand-alone radio-detection to provide in-formation on the most important physics quantitiesof UHE CRs: primary energy, primary mass, andarrival direction.
3) Composition measurements between 1017.4 and1018.7 eV where we expect the transition fromgalactic to extragalactic origin of cosmic rays.With super-hybrid measurements at the AMIGAsite [7], AERA will contribute with a worldwideunrivaled precision to the study of the cosmic-rayenergy spectrum and composition in the energyrange of the transition .
AERA will be co-located with AMIGA, which is over-looked by the HEAT detector. These enhancements ofthe Observatory provide worldwide the only possibilityto study the details of radio emission from air showersin a timely manner.
II. PRESENT STATUS OF THE PROJECT
Initial measurements have been made showing thatindeed radio detection of UHE CRs can be performedat the southern site of the Auger Observatory with asetup near the BLS, another one near the CLF (seeFig. 1). Still the number of radio events in coincidencewith its Surface Detector Array (SD) is relativelysmall, mainly because of the relatively small scaleof the radio detector arrays used. A description ofthe setups used is presented in Ref. [10]. Here welist some of the initial results and present a shortdescription of these setups. One setup consists ofthree dual active fat dipole antennas, mounted nearthe CLF in a triangular configuration with a baselineof 139 m. With this setup, self-triggered events arebeing recorded and using GPS time stamps, they arecompared to events registered with the SD Array ofthe Observatory. The other setup, located near theBLS, uses dual logarithmic periodic dipole antennasand is triggered externally using a set of two particledetectors. Also in this case the Radio-Detection Stationsare mounted on a triangular grid; here the baseline is100 m. Both setups measure the electric field strengthin two polarization directions: east-west and north-south.
Several coincident events between SD and externallytriggered Radio-Detection Stations located near the BLShave been recorded [11]. In 27 cases we have recordedsimultaneously in three different Radio-DetectionStations a coincidence with the SD. This allowedus to compare in these cases the arrival direction asdetermined by our Radio-Detection Stations with thatfrom SD. The histogram in Fig. 2 displays for 27 eventsthe measured angular difference between the arrivaldirection as determined with SD and as determined byour three Radio-Detection Stations. Using a Rayleighfunction, the 68%-quantile of the distribution ofthe angular difference has been determined to be(8.8± 1.0). In most events, the number of SD stationsused in the event reconstruction was 3 or 4. The angular
resolution for these type of SD events is about 2.0
and can thus be neglected. The major contribution tothe angular uncertainty is the relative small distance of100 m between the Radio-Detection Stations comparedto the timing accuracy obtained (about 3 ns).
ADEntries 27
Mean 7.097
RMS 3.287
]° [RD-SD
Angular Distance0 2 4 6 8 10 12 14 16 18 20
En
trie
s
0
2
4
6
8
10
ADEntries 27
Mean 7.097
RMS 3.287
ADEntries 27
Mean 7.097
RMS 3.287
° 1.0)± = (8.8 68 %σ
Fig. 2. Plot of the angular difference between the arrival directionof observed air showers using data from the Surface Detector Arrayand from the Radio-Detection Stations near the BLS. The histogramindicates the data obtained for 27 events; the dashed line is a fit throughthese data using a Rayleigh function; see text for details.
The sky distribution of radio events observed with thesetup near the CLF and in coincidence with the SDArray is presented in Fig. 3. As expected we observethat the efficiency for the observation of cosmic rayswith the SD Array does not depend on the azimuthangle. The sky plot of the observed radio events,however, is highly asymmetric with a large excess ofevents arriving from the south: this represents more than70% of all events. This observed asymmetry providesfurther support for the geomagnetic origin of radioemission by air showers and has been observed beforein the northern hemisphere [12]. The Earth’s magneticfield vector at the site of the Pierre Auger Observatorymakes an angle of about 60 with respect to the zenithand its azimuthal angle is 90 (i.e. north). This isindicated as the cross in Fig. 3. In the geomagneticmodel, electric pulses will be strongest if the showeraxis is perpendicular to the magnetic field vector. Andfor these observed events the trigger for radio detectionwas a simple pulse-height threshold on the radio signal,which explains why we detected more events comingfrom the south than from the north.
Studies with solitary systems have been performed.These systems are powered by solar energy, havea wireless connection to a central DAQ system, andoperate in self-trigger and/or externally triggered modes.Special attention has been paid to reduce self-inducednoise caused by DC-DC converters and by digitalelectronics. With this system self-triggered events havebeen obtained. However, for these events there wereno data from more than two radio stations and thusthe arrival direction could not be compared with that
Page 19

PROCEEDINGS OF THE 31st ICRC, ŁODZ 2009 3
-1.5 -1.0 -0.5 0.0 0.5 1.0 1.5
-1.5
-1.0
-0.5
0.0
0.5
1.0
1.5
-0.0
0.2
0.4
0.6
0.8
1.0
90
60
30
0 0
60120
180
240 300
360
Fig. 3. Sky map of 36 radio events registered with the autonomoussystem in coincidence with the SD Array in local spherical coordinates.The zenith is at the center and the azimuths are oriented as follows:0 east, 90 north. The geomagnetic field direction in Malargue isindicated by the cross.
from SD. Nevertheless this is the first time ever thatsuch an independent detection has been achieved usingRadio-Detection Stations [13].
Noise levels have been studied in detail. For this analysiswe have defined the root mean square (RMS) valuefor 750 consecutive samples of each time trace withhave a sampling rate of 400 MS s−1. Using a digitalfilter the analyzed signals were limited to the frequencyband between 50 and 55 MHz. The distribution ofthese RMS values, measured for a period of almost oneyear, are plotted in Fig. 4. This figure displays for twopolarizations the distribution of all the calculated RMSvalues as a function of the local sidereal time (LST) forone of the Radio-Detection Stations. For both directionsof the polarization, we recognize the same trend: anincrease in the RMS value around 18:00 LST (see alsoRef. [11]). This time coincides with the passage overthe Radio-Detection Station of an area near the galacticcenter with an increased brightness temperature in theradio frequency band [14]. These studies enable us tomonitor the overall detection threshold and the gainpattern of antennas used.
The signal development of radio pulses inducedby UHE CRs in the atmosphere has been modeledusing extensive Monte-Carlo simulations, trackingelectron- and positron density distributions, and byusing macroscopic calculations [9]. In addition, amodular detector simulation package has been written,where various important components of the signaldevelopment as it passes through the electronicschain can be simulated and compared with data [15].A conceptual design has been made for the offlineanalysis and visualization codes [16]. This package willbe merged with the standard offline analysis which is
Figure 7: The RMS as function of the local sidereal time, the color coding givesthe number of events in a certain bin. Upper left: Antenna 1 East - West. Upperright: Antenna 1 North - South. Lower left: Antenna 2 East - West. Lower right:Antenna 2 North - South.
To investigate the relation between the RMS and the dependence of the backgroundper frequency the average frequency spectrum is calculated per RMS value. Thisis shown in Figure 8. Figure 8 indicates that high RMS values are due to twodi!erent contributions: Narrow lines start to appear and the noise level over thecomplete frequency range increases (narrow and broad band noise). However, thisfigure does not imply that broadband and small band background levels increaseat the same time, since this is the average frequency spectrum. The narrow linesare believed to be due to man-made emission (for example radio stations or com-munication channels). The increase of the broadband background level is harderto pin point down. Causes can be nearby electronic devices, power lines, weathere!ects, atmospheric interactions etc.
In order to investigate the main behavior of the background in the frequencydomain, a selection is made. In each time bin of Figure 7, 80% of the total number
7
Fig. 4. RMS value of the noise level measured with one of the Radio-Detection Stations as a function of the LST filtered for the frequencyband between 50 and 55 MHz. The plotted RMS values have beencorrected for cable losses and amplification between the output of thelogarithmic periodic dipole antenna and the receiver unit, but not forthe antenna gain. The grey scale indicates number of counts per hourand per 0.012 µV MHz−1. The data were collected between May2007 and April 2008.
being used for the analysis of data obtained with theother detector systems used in the Observatory.
III. AERA: THE 20 KM2 ARRAY
The baseline parameters for AERA are about 150Radio-Detection Stations distributed over an area ofapproximately 20 km2. Figure 5 shows an areal viewof the site. AERA will have a core of 24 stationsdeployed on a triangular grid with a baseline of150 m. This core is about 4 km east of the Coihuecofluorescence telescope; it provides an excellent overlapfor events which will be observed with both detectionsystems. Around this core, there will be 60 stations ona triangular grid with a pitch size of 250 m. Finally,the outer region of AERA will have 72 stations witha mutual distance of 375 m. Each Radio-DetectionStation will operate on solar power and has its localdata-acquisition. Like the SD of the Observatory, eventdefinition will be based on timing information sentthrough wireless communication by the Radio-DetectionStations to a central data-acquisition system, locatednear the center of AERA. The design of the antennasand of the electronics will be optimized to have ahigh sensitivity in the frequency band between 30 and
Page 20

4 A.M. VAN DEN BERG et al. RADIO DETECTION OF COSMIC RAYS AT AUGER
-1
0
1
2
3
0 1 2 3 4 5 6 7 8 9 10 11 12
x (km)
y (k
m)
RD stationSD station
Coihueco
Fig. 5. Areal view of AERA at the western part of the Pierre Auger Observatory. Radio-Detection Stations are denoted as dots, detectors ofthe SD Array as triangles. All coordinates are relative to the Coihueco fluorescence building; see also Fig. 1.
80 MHz. Every Radio-Detection Station will have a ringbuffer which can contain streaming data (4 channels,200 MS s−1, 12 bits per sample) for a period of 3 s.
Energy lg E [eV]
Eve
nts
pe
r ye
ar
LOPES extr.CODALEMA extr.MC simul.
1
10
102
103
104
17 17.5 18 18.5 19
Fig. 6. Expected number of events per year as function of the showerenergy according to extrapolations of LOPES and CODALEMA mea-surements as well as Monte-Carlo simulations, based on the REAS2code and with zenith angle Θ < 60; see text for details.
The expected performance of the array has beencalculated applying different methods. Measurementsof the lateral distribution of the radio signal as obtainedby the LOPES [17] and CODALEMA [18] experimentshave been taken into account as well as showersimulations with the REAS2 code [19]. To estimate theexpected event rates, the effective area is multipliedwith the cosmic-ray flux. The present estimates arebased on the spectrum measured by the Pierre AugerCollaboration [20]. The flux below 1018.45 eV has beenextrapolated, assuming a spectral index of −3.3, whichis typical for the energy region between the secondknee and the ankle, 1017.6 - 1018.6 eV. The expectednumber of events per year is depicted in Fig. 6 for thethree different approaches. The main difference betweenthe approaches is in the threshold region, where thelargest uncertainty comes from the extrapolation of theflux spectrum to lower energies. Taking a conservative
approach and using the CODALEMA and LOPESextrapolations, the threshold for the radio array isaround ≈ 1017.2 eV.
Summarizing, AERA will be the first large radio-detection array for the observation of UHE CRs. Asit will be co-located with the other detector systemsof Auger it will provide additional and complementaryinformation on air showers which can be used, e.g., forthe determination of the composition of UHE CRs.
REFERENCES
[1] J.L. Harton, this conference.[2] A.V. Olinto et al., arXiv 0903.0205.[3] J.V. Jelley et al., Nature 205 (1965) 327.[4] A. Haungs, Nucl. Instr. and Meth.A (2009),
doi:10.1016/j.nima.2009.03.033.[5] P. Lautrido et al., Nucl. Instr. and Meth.A (2009),
doi:10.1016/j.nima.2009.03.164.[6] B.R. Dawson for the Pierre Auger Collaboration, Proc. of the
30th ICRC, Merida, Mexico, Vol. 4 (2008) 425.[7] A. Etchegoyen for the Pierre Auger Collaboration, Proc. of the
30th ICRC, Merida, Mexico, Vol. 5 (2008) 1191 and M. Platinofor the Pierre Auger Collaboration, this conference.
[8] H. Klages for the Pierre Auger Collaboration, Proc. of the 30thICRC, Merida, Mexico, Vol. 5 (2008) 849 and M. Kleifges forthe Pierre Auger Collaboration, this conference.
[9] T. Huege, Nucl. Instr. and Meth. A (2009),doi:10.1016/j.nima.2009.03.165.
[10] A.M. van den Berg for the Pierre Auger Collaboration, Proc. ofthe 30th ICRC, Merida, Mexico, Vol. 5 (2008) 885.
[11] J. Coppens for the Pierre Auger Collaboration, Nucl. Instr. andMeth. A (2009), doi:10.1016/j.nima.2009.03.119.
[12] D. Ardouin et al., Astrop. Phys. 31 (2009) 192.[13] B. Revenu for the Pierre Auger Collaboration, Nucl. Instr. and
Meth. A (2009), doi:10.1016/j.nima.2009.03.028.[14] H. Alvarez, J. Aparici, J. May, and F. Olmos, Astron. Astrophys.
Suppl. Ser. 124 (1997) 315.[15] S. Fliescher for the Pierre Auger Collaboration, Nucl. Instr. and
Meth. A (2009), doi:10.1016/j.nima.2009.03.068.[16] J. Rautenberg for the Pierre Auger Collaboration, Nucl. Instr.
and Meth. A (2009), doi:10.1016/j.nima.2009.03.032.[17] A. Horneffer for the LOPES collaboration, Proc. of the 30th
ICRC, Merida, Mexico, Vol. 4 (2008) 83.[18] C. Riviere, private communication.[19] T. Huege, R. Ulrich, R. Engel, Astropart. Phys. 27 (2007) 392.[20] J. Abraham et al. (the Pierre Auger Collaboration), Phys. Rev.
Lett. 101 (2008) 061101.
Page 21

PROCEEDINGS OF THE 31st ICRC, ŁODZ 2009 1
Hardware Developments for the AMIGA Enhancement at thePierre Auger Observatory
P. Buchholz∗ for the Pierre Auger Collaboration†.
∗Fachbereich Physik, Universitat Siegen, Walter-Flex-Str. 3, D57068 Siegen, Germany† Observatorio Pierre Auger, Av. San Martın Norte 304 (5613) Malargue, Prov. Mendoza, Argentina
Abstract. To extend the energy threshold of theAuger Observatory to lower energies and to measurethe number of muons in extensive air showers, theAMIGA (Auger Muons and Infill for the Ground Ar-ray) enhancement is being developed. The completemuon detector system, including the scintillationdetectors, the analogue front-end, trigger and thedigital readout electronics, as well as the powersupplies and slow-control electronics, have beendesigned. Prototypes of all components have beenproduced and tested separately in system tests. Theperformances of all components and the completesystem will be discussed.
Keywords: Pierre Auger Observatory, AMIGA,muon detector, readout electronics
I. I NTRODUCTION
The Pierre Auger Observatory is the largest air showerdetector in the world with a hybrid detection systemconsisting of a surface detector array (SD) and a fluo-rescence detector (FD). The SD of the Southern site nearMendoza, Argentina, consists of more than 1600 water-Cherenkov detectors arranged in a triangular grid with1500 m spacing. It is overlooked by 24 fluorescencetelescopes of the FD, arranged in four groups of sixtelescopes each [1], [2]. The Auger collaboration hasbeen successfully taking data for several years measuringwith full efficiency energies above3×1018 eV using theSD and above about1018 eV including the FD. To reachfull efficiency also for lower energies down to about1017 eV, from which the second knee and the ankle ofthe energy spectrum can be fully seen and where thetransition from galactic to extra galactic cosmic raysis assumed to occur, the Auger Observatory will beupgraded with two additional detector setups, AMIGA(Auger Muons and Infill for the Ground Array) andHEAT (High Elevation Auger Telescopes). HEAT will bediscussed in detail elsewhere [3]. The AMIGA enhance-ment consists of 85 water-Cherenkov surface detectors,each with a 30 m2 plastic scintillator buried about 2.5 munderground. The final depth will be decided taking theresults of the BATATA detector setup into account [4].Out of the 85 detector stations 61 are arranged in a750 m triangular grid and 24 in a 433 m grid. Theyare overlooked by the FD and HEAT. The scintillatorswill be used to determine the muon content of the airshower, which is one of the relevant shower parameters
e.g. for composition analyses. Since the Infill part ofAMIGA, i.e. the additional arrays of surface detectors,is described elsewhere [5], this contribution concentrateson the muon detector part, especially on tests performedwith a prototype system. For a detailed description ofthe muon detector system see also [5].
II. T HE AMIGA MUON DETECTOR
The muon detector of an AMIGA detector station con-sists of three independent muon scintillation counters,each divided into 64 strips and read out by a 64 channelmulti anode photomultiplier (PMT). To process the PMToutput signals, a modular readout system of four differ-ent electronic boards has been developed and prototypesof all modules have been produced and successfullytested. These modules are the Mother Board (MB), theDaughter Board (DB), the Digital Board (DGB) and thePower Distributor Board (PDB). By the end of 2009 amuon counter prototype will be installed in the Augerarray using a 4.8 m long scintillator module (Figure 2)and the complete electronics system consisting of theexisting prototypes. Following a test run of about twomonths with this detector, another prototype detector,consisting of a 8.8 m long scintillator module, willbe added. After another test run period the first finalmuon counter of the AMIGA array will be installed.To equip all 85 AMIGA detector stations almost 3000individual boards are needed, which underlines the needfor an automatized test system during mass production.Each of the 85 AMIGA muon counter electronics setupswill be tested and fully characterised in Siegen beforebeing installed in the AMIGA array without any furtherdismounting. In the following, short descriptions of allboards and the corresponding test results are given.Figure 1 shows an overview of the complete prototypesystem and Figure 3 a picture of the assembled systemin the laboratory.
A. Mother Board
The MB provides a socket for the multi-channel PMT,its power supply and monitoring of the high voltageapplied. Signals are distributed to 8 DBs, pluggedinto the MB. In all tests concerning the steering andmonitoring of the high voltage of the PMT, the MBprototype performed as specified.
Page 22

2 P. BUCHHOLZ - AMIGA HARDWARE DEVELOPMENTS
Fig. 1: Schematic overview of the AMIGA muon counter prototype system.
Fig. 2: Schematic view of one possible arrangement ofthe AMIGA detector pair consisting of one SD stationand four buried muon scintillation counters. The hatchedmodule with a length of 4.8 m will be used for the firstprototype.
B. Daughter Board
The DB is the signal forming module of the muoncounter electronics chain. Each DB consists of eightchannels, in which the analogue photomultiplier signalsdistributed by the MB are inverted and amplified byoperational amplifiers by a factor of about 3.1. In asecond step, the outputs of the operational amplifiers arecompared to a given threshold. In case the amplitude ofthe signal in one channel exceeds the threshold voltage,the digital output signal of this channel is set to zero.
Fig. 3: Picture of the prototype system as assembled inthe laboratory.
To compensate variations of the PMT gains as wellas variations of the gains of the operational amplifiers,the threshold voltage can be set individually for eachchannel using an eight channel DAC (digital-to-analogconverter) on each DB. Figure 4 shows measured singleelectron input pulses and the corresponding output ofthe DB. The bandwidth of the DB has been measuredas (134 ± 5) MHz, which is more than sufficient.The typical behaviour of a single channel is shown inFigure 5.
Page 23

PROCEEDINGS OF THE 31st ICRC, ŁODZ 2009 3
Fig. 4: Example of measured input and output pulses ofthe DB. The lower graph schows the amplitude of theinput pulses, the middle graph the comparator output andthe two upper graphs the clock and the resulting digitaldata in the FPGA.
Fig. 5: Bandwidth measurement of a typical DB channel.
C. Digital Board
The DGB continuously stores the digitised data re-ceived from the DBs into a ring buffer. Receiving atrigger signal (T1) from its corresponding SD stationdigitised muon data of 1.6µs before and 3.2µs afterthe trigger signal are stored in a memory. Only the muondata confirmed by a higher trigger level signal (T3) issent via radio to the central data acquisition.
This readout is realized by using an FPGA, an externalRAM, a microcontroller unit (MCU) and a single board
Fig. 6: Measured trigger propagation delay.
Fig. 7: Measured signal jitter.
computer (SBC) and is described in detail in [6]. Thetests discussed here were performed using a prototypesystem consisting of two separate boards, one for theFPGA and one for the MCU. These will be merged intoone DGB in the next iteration.
To synchronise data from the muon detectors withevents recorded by the SD, a dedicated line for the T1trigger is used. The signal delay of this line has beenmeasured using the prototype system. It stems fromthe cable length of about 15 m, the galvanic isolationin the underground electronics and the latencies of thetransmitter and receiver module. The latter also addsjitter to the signal.
As can be seen in Figures 6 and 7 a delay of 106 nsand a jitter of about 55 ps have been measured. Sincethe digital input pulses from the DBs are sampled witha rate of 320 MHz by the FPGA, which corresponds tosampling intervals of 3.125 ns, this jitter is negligible.
D. Power Distributor Board
The PDB derives all supply voltages needed by theelectronics modules from the battery voltage of + 24 V.In addition, the ground levels of both detectors, the SDstation and the muon detector, are electrically isolatedfrom each other to reduce noise generated by ground
Page 24
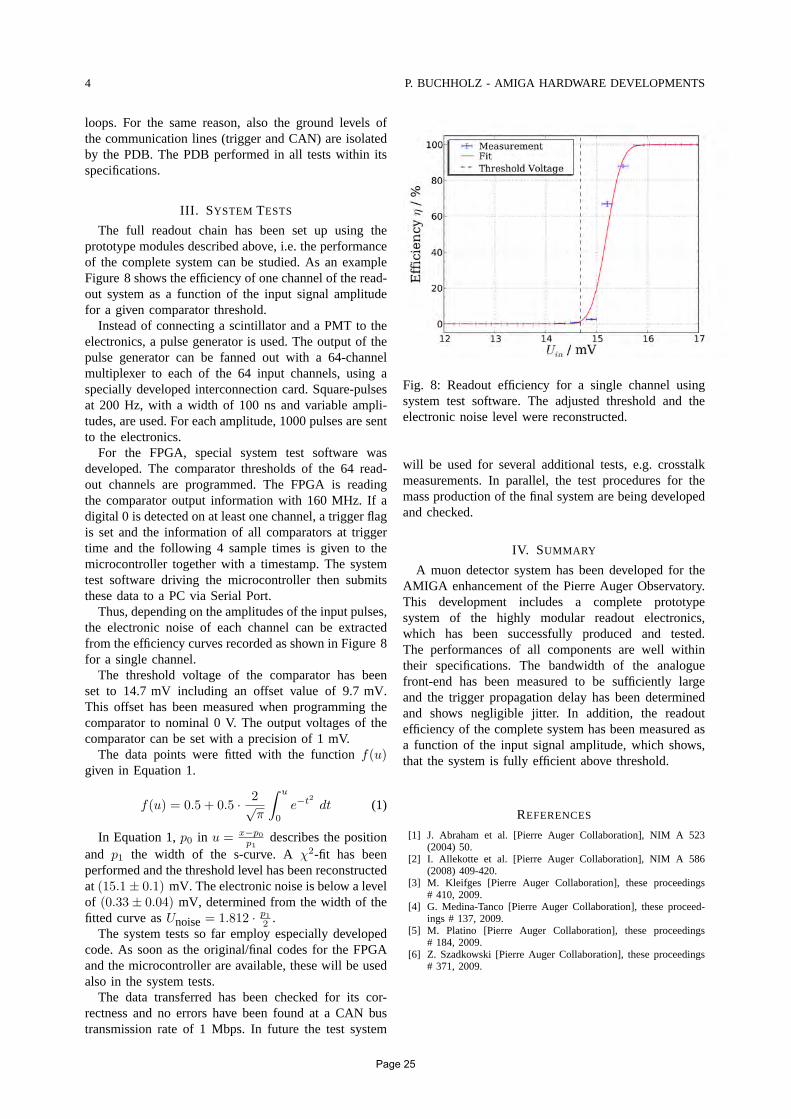
4 P. BUCHHOLZ - AMIGA HARDWARE DEVELOPMENTS
loops. For the same reason, also the ground levels ofthe communication lines (trigger and CAN) are isolatedby the PDB. The PDB performed in all tests within itsspecifications.
III. SYSTEM TESTS
The full readout chain has been set up using theprototype modules described above, i.e. the performanceof the complete system can be studied. As an exampleFigure 8 shows the efficiency of one channel of the read-out system as a function of the input signal amplitudefor a given comparator threshold.
Instead of connecting a scintillator and a PMT to theelectronics, a pulse generator is used. The output of thepulse generator can be fanned out with a 64-channelmultiplexer to each of the 64 input channels, using aspecially developed interconnection card. Square-pulsesat 200 Hz, with a width of 100 ns and variable ampli-tudes, are used. For each amplitude, 1000 pulses are sentto the electronics.
For the FPGA, special system test software wasdeveloped. The comparator thresholds of the 64 read-out channels are programmed. The FPGA is readingthe comparator output information with 160 MHz. If adigital 0 is detected on at least one channel, a trigger flagis set and the information of all comparators at triggertime and the following 4 sample times is given to themicrocontroller together with a timestamp. The systemtest software driving the microcontroller then submitsthese data to a PC via Serial Port.
Thus, depending on the amplitudes of the input pulses,the electronic noise of each channel can be extractedfrom the efficiency curves recorded as shown in Figure 8for a single channel.
The threshold voltage of the comparator has beenset to 14.7 mV including an offset value of 9.7 mV.This offset has been measured when programming thecomparator to nominal 0 V. The output voltages of thecomparator can be set with a precision of 1 mV.
The data points were fitted with the functionf(u)
given in Equation 1.
f(u) = 0.5 + 0.5 ·2√
π
∫u
0
e−t2
dt (1)
In Equation 1,p0 in u =x−p0
p1
describes the positionand p1 the width of the s-curve. Aχ2-fit has beenperformed and the threshold level has been reconstructedat (15.1 ± 0.1) mV. The electronic noise is below a levelof (0.33 ± 0.04) mV, determined from the width of thefitted curve asUnoise= 1.812 · p1
2.
The system tests so far employ especially developedcode. As soon as the original/final codes for the FPGAand the microcontroller are available, these will be usedalso in the system tests.
The data transferred has been checked for its cor-rectness and no errors have been found at a CAN bustransmission rate of 1 Mbps. In future the test system
Fig. 8: Readout efficiency for a single channel usingsystem test software. The adjusted threshold and theelectronic noise level were reconstructed.
will be used for several additional tests, e.g. crosstalkmeasurements. In parallel, the test procedures for themass production of the final system are being developedand checked.
IV. SUMMARY
A muon detector system has been developed for theAMIGA enhancement of the Pierre Auger Observatory.This development includes a complete prototypesystem of the highly modular readout electronics,which has been successfully produced and tested.The performances of all components are well withintheir specifications. The bandwidth of the analoguefront-end has been measured to be sufficiently largeand the trigger propagation delay has been determinedand shows negligible jitter. In addition, the readoutefficiency of the complete system has been measured asa function of the input signal amplitude, which shows,that the system is fully efficient above threshold.
REFERENCES
[1] J. Abraham et al. [Pierre Auger Collaboration], NIM A 523(2004) 50.
[2] I. Allekotte et al. [Pierre Auger Collaboration], NIM A 586(2008) 409-420.
[3] M. Kleifges [Pierre Auger Collaboration], these proceedings# 410, 2009.
[4] G. Medina-Tanco [Pierre Auger Collaboration], these proceed-ings # 137, 2009.
[5] M. Platino [Pierre Auger Collaboration], these proceedings# 184, 2009.
[6] Z. Szadkowski [Pierre Auger Collaboration], these proceedings# 371, 2009.
Page 25

PROCEEDINGS OF THE 31st ICRC, ŁODZ 2009 1
A simulation of the fluorescence telescopes of the Pierre AugerObservatory using Geant4
Pedro Assis∗, for the Pierre Auger Collaboration †
∗Laboratorio de Instrumentacao e Fısica Experimental de Partıculas (LIP), Lisboa, Portugal†Observatorio Pierre Auger, Av.San Martin Norte 304, (5613)Malargue, Mendoza, Argentina
Abstract. A simulation of the fluorescence tele-scopes of the Pierre Auger Observatory was devel-oped, profiting from the capabilities of Geant4 todescribe complex 3D geometries realistically and toallow the required optical processes to be included inthe simulation. Account was taken of the descriptionof all optical components of the telescopes. Thissimulation is included in the Pierre Auger offlinesoftware framework and is being used in severalstudies of the fluorescence detector performance. Themain features of the simulation are reviewed.
Keywords: Geant4 simulation, fluorescence tele-scope, Pierre Auger Observatory
I. I NTRODUCTION
A detailed simulation of the fluorescence telescopesof the Pierre Auger Observatory was developed, takingadvantage of the capabilities of Geant4 [1], [2] to de-scribe complex 3D geometries realistically and to allowthe required optical processes to be included in thesimulation. The Fluorescence Detector (FD) of the PierreAuger Observatory is composed of 24 fluorescence tele-scopes, located in four buildings overlooking the SurfaceDetector array. Each telescope features Schmidt opticsconsisting of a ring shaped corrector lens placed at theentrance pupil and a 11 m2 spherical mirror. The incom-ing light is focused on to a spherical camera, containing440 hexagonal pixels made of photo-multipliers (PMT)and light guides [3].
Geant4 is a software toolkit, developed in the C++programming language, to simulate the interaction ofparticles through complex 3D geometries. In Geant4 theuser defines the geometry and composition of the media,as well as a primary particle and its properties. Thekernel then takes care of the tracking and interactionsof the primary and secondary particles throughout thedefined “world”, taking into account the properties of thetraversed materials and the selected physical processes.
The tracking of optical photons includes refractionand reflection at medium boundaries, Rayleigh scatteringand bulk absorption. The optical properties of a medium,such as refractive index, absorption length and reflectiv-ity coefficients, can be expressed as tabulated functionsof the wavelength. In addition, specific characteristicsof the optical interfaces between different media can bedefined using the UNIFIED optical model [4], whichprovides a realistic description of surface finish andreflector coatings. Complex geometries can be defined
by exploiting the Constructive Solid Geometry (CSG)functionalities in Geant4, that allows to build complexsolids from simple ones using boolean operations.
This simulation is included in the Pierre Auger sim-ulation and reconstruction framework [5]. It is beingused in several performance studies of the fluorescencetelescopes, in particular those related to the optical spotand the light detection efficiency.
II. I MPLEMENTATION OF THE TELESCOPE
COMPONENTS WITHGEANT4
Account was taken of the description of the correctorlens profile, the details of the mirror geometry, includingthe parameters of each individual mirror, and the differ-ent components of the camera, including light guidesand photo-multipliers (PMT). The optical properties ofall materials, such as the absorption length and therefractive index, are described in the simulation.
The filter at the entrance pupil of the fluorescencetelescopes is implemented as a disk made of M-UG6 [6],with a diameter of 2.2 m and a thickness of 3.25 mm. Thefilter is positioned perpendicular to the optical axis of thetelescope at(0, 0,−10 cm) 1. The refractive index is setto n = 1.526 and the absorption length is computed fromthe transmittance for the filter material with a nominalvalue of0.83 at a wavelength of 370 nm for a thicknessof 3.25 mm.
The simulation of the corrector lens, made of BK7glass, uses the Geant4 classG4Polycone. Given thelens axial symmetry this class enables the descriptionof an arbitrary profile, by its decomposition into asufficiently large number of straight segments. The seg-mentation of the corrector lens in24 petals, each withan angular width of14.735 is also implemented in thesimulation. A visualization of the lens profile is shownin figure 1.
The telescope mirror, composed by64 hexagonalelements arranged in8 rows, is implemented in fulldetail in the simulation. The mirror elements are quasi-hexagonal spherical mirrors, and their shape dependson the position in the telescope mirror. To define themirror elements,3 to 5 (depending on the type ofelement) trapezoids are joined and the resulting solid
1The telescope coordinate system is defined with thez axis alignedwith the optical axis, pointing outwards, they axis horizontal and thex axis orthogonal to thez andy axis, pointing downwards. The originof this coordinate system coincides with the geometrical centre of thecorrector lens.
Page 26

2 P.ASSISet al. FLUORESCENCE TELESCOPES SIMULATION
(a) (b)
Fig. 1. (a) Detail of the corrector lens in the Geant4 simulation.The curvature of the corrector ring is magnified to be visible. (b) Asegment of the telescope mirror. The trapezoids joined to make themirror element are artificially displaced for better visualization.
is intersected with a spherical shell, with inner radiusequal to the radius of curvature of the mirror element. Avisualisation of one mirror element is shown in figure 1.The positioning of the hexagonal elements emulates thealignment procedure performed in the real telescopes,with the centre of curvature of each element coincidingwith the alignment point, which is located at the originof the telescope reference frame. The optical propertiesof the mirror are implemented by defining the reflectivityin the interface surface between the air and the mirror.The curvature radius, positioning angles and reflectivityof each individual segment are read from a database.
The cameras of the fluorescence telescopes are com-posed by the light guides, the PMTs and the supportingstructure [7]. The light guides are placed at the vertexesof each hexagonal PMT. In the Geant4 simulation theyare made by the union of three triangular prisms, eachbuilt using the Geant4 classG4Polyhedra. The re-flectivity at the surface interface is set to0.9 for allwavelengths. In the simulation the PMTs include thehexagonal window and the metallic photocathode. Asensitive detector is associated to the photocathode tosimulate the detection of photons. The quantum effi-ciency is taken into account a posteriori by applyingit to the recorded signal at each pixel. Both the PMTsand the light guides are placed following the curvature ofthe camera. The body of the camera support and feet arealso included, to correctly simulate the shadow effect. Aview of the camera as implemented in the simulation isshown in figure 2.
The fully assembled telescope is visualised in figure 3which shows photons arriving at the telescope parallelto the optical axis tracked through the various opticalelements of the telescope and focused onto the camera.
III. S IMULATION OF THE TELESCOPE PERFORMANCE
The simulation is being used in studies of the per-formance of the fluorescence telescopes, concerning theoptical spot and the light detection efficiency. Some ofthe results of these studies are summarized below.
Fig. 2. View of the camera in the Geant4 simulation. The pictureshow the light guides in light blue and the PMT windows in red.
A. The Optical Spot
The telescope optics was studied by characterisingthe image produced on the focal surface. The photonposition in the focal surface is defined by the elevationangle, α = arcsin (x/RFS), and the azimuth angle,β = arcsin (−y/RFS), where RFS is the radius ofcurvature of the focal surface andx, y the Cartesiancoordinates of the photon at the camera. Beams ofparallel photons were simulated at input angles, withrespect to the telescope axis, ofθ = 0, θ = 5, θ = 10
and 15, with ϕ = 135 The spots observed at theideal focal surface are shown in figure 4. For photonswith an input angle ofθ = 0 the spot presents analmost complete circular symmetry, which arises fromthe symmetry of the telescope with respect to the opticalaxis, only broken by the square camera body. For largerangles the central region of the spot is deformed alongthe same direction as the input direction of the photons.This is due to the photons passing through the correctorlens. Since the mirror is spherical, the contribution dueto the photons crossing the hollow part of the lensstill results in a symmetric spot, except for the regionobscured by the camera. These spots obtained withthe Geant4 simulation confirm the optics performanceexpected from previous ray tracing studies [8].
B. Photon Distribution at the PMTs
Photons crossing the focal surface reach the PMTs,directly or after being reflected by the lightguides. Theposition of the photons on the PMT window are shownin figure 5. In the top image the spot is contained insidethe pixel, with few hits on the light guide and the centreof the pixel densely illuminated. However, when theincoming photons are focused at the vertex of a lightguide the three adjacent PMTs are hit, as shown in thebottom image of figure 5. In this case a large fractionof photons is reflected at the light guides, resultingin a blind circular region centred on the light guidevertex. From these example cases it is clear that theilluminated zones of the PMTs vary with the position ofthe spot centre. The collection efficiency of a PMT variesalong the photocathode, which can yield an additional
Page 27

PROCEEDINGS OF THE 31st ICRC, ŁODZ 2009 3
Fig. 3. View of the assembled telescope and the tracking of photons.
Fig. 4. Spots produced at the ideal focal surface for incident angles of0, 5, 10 and15. For each generated photon the relative position(αrel, βrel) with respect to the expected position for an ideal opticalsystem is shown.
contribution to the overall telescope efficiency with thespot centre position. The non-uniformity of the PMTresponse can be taken into account in this simulationframework.
C. Comparison with laboratory data
The simulation was compared with laboratory mea-surements of the light detection uniformity [7] (andreferences therein), where a small version of the camerawith seven pixels was used. Since the telescope opticsis fully implemented in the Geant4 simulation and the
[degree]α-1.8 -1.6 -1.4 -1.2 -1 -0.8 -0.6 -0.4 -0.2 0
[deg
ree]
β
-1
-0.8
-0.6
-0.4
-0.2
0
0.2
0.4
0.6
0.8
1
1
10
210
(a)
[degree]α-1 -0.8 -0.6 -0.4 -0.2 0 0.2 0.4 0.6 0.8 1
[deg
ree]
β
-1
-0.8
-0.6
-0.4
-0.2
0
0.2
0.4
0.6
0.8
1
1
10
210
(b)
Fig. 5. The spot seen at the PMTs. Lines are drawn to representthe pixel boundaries (solid) and the light guides boundaries (dashed).Photons simulated with the expected position at the pixel centre (a)and at the vertex of the light guide (b).
Page 28
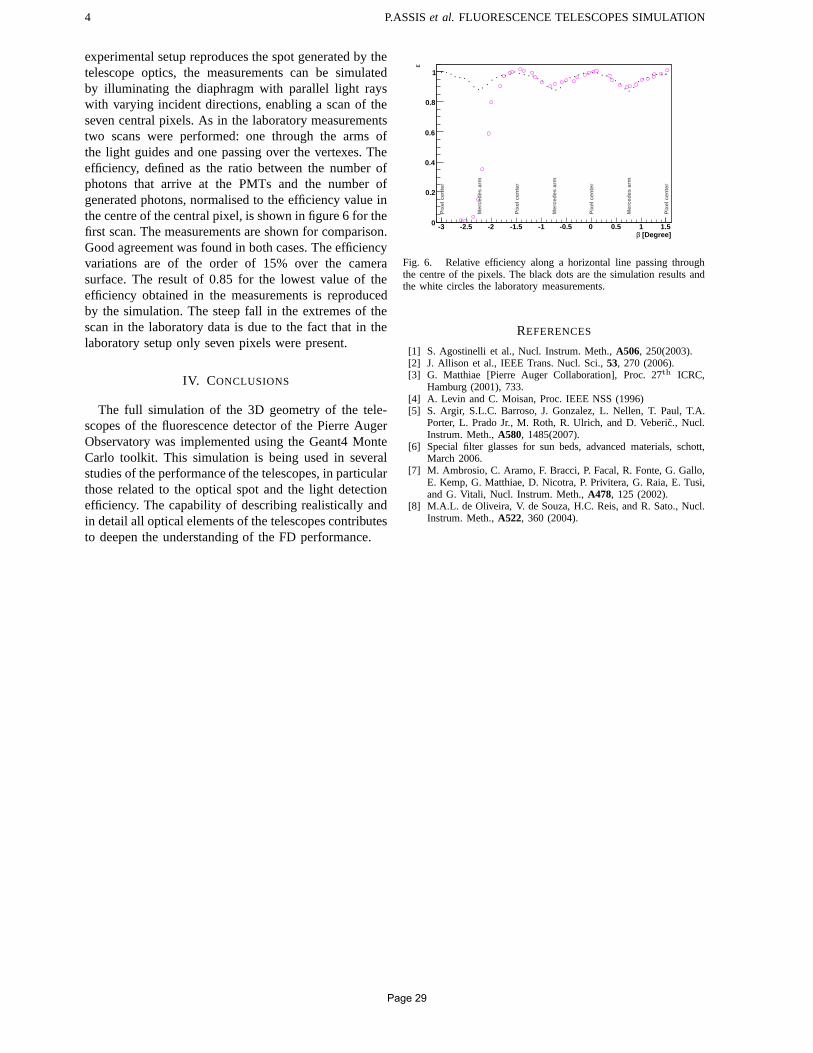
4 P.ASSISet al. FLUORESCENCE TELESCOPES SIMULATION
experimental setup reproduces the spot generated by thetelescope optics, the measurements can be simulatedby illuminating the diaphragm with parallel light rayswith varying incident directions, enabling a scan of theseven central pixels. As in the laboratory measurementstwo scans were performed: one through the arms ofthe light guides and one passing over the vertexes. Theefficiency, defined as the ratio between the number ofphotons that arrive at the PMTs and the number ofgenerated photons, normalised to the efficiency value inthe centre of the central pixel, is shown in figure 6 for thefirst scan. The measurements are shown for comparison.Good agreement was found in both cases. The efficiencyvariations are of the order of 15% over the camerasurface. The result of 0.85 for the lowest value of theefficiency obtained in the measurements is reproducedby the simulation. The steep fall in the extremes of thescan in the laboratory data is due to the fact that in thelaboratory setup only seven pixels were present.
IV. CONCLUSIONS
The full simulation of the 3D geometry of the tele-scopes of the fluorescence detector of the Pierre AugerObservatory was implemented using the Geant4 MonteCarlo toolkit. This simulation is being used in severalstudies of the performance of the telescopes, in particularthose related to the optical spot and the light detectionefficiency. The capability of describing realistically andin detail all optical elements of the telescopes contributesto deepen the understanding of the FD performance.
[Degree]β-3 -2.5 -2 -1.5 -1 -0.5 0 0.5 1 1.5
ε
0
0.2
0.4
0.6
0.8
1
Pix
el c
ente
r
Mer
cede
s ar
m
Pix
el c
ente
r
Mer
cede
s ar
m
Pix
el c
ente
r
Mer
cede
s ar
m
Pix
el c
ente
r
Fig. 6. Relative efficiency along a horizontal line passing throughthe centre of the pixels. The black dots are the simulation results andthe white circles the laboratory measurements.
REFERENCES
[1] S. Agostinelli et al., Nucl. Instrum. Meth.,A506, 250(2003).[2] J. Allison et al., IEEE Trans. Nucl. Sci.,53, 270 (2006).[3] G. Matthiae [Pierre Auger Collaboration], Proc. 27th ICRC,
Hamburg (2001), 733.[4] A. Levin and C. Moisan, Proc. IEEE NSS (1996)[5] S. Argir, S.L.C. Barroso, J. Gonzalez, L. Nellen, T. Paul, T.A.
Porter, L. Prado Jr., M. Roth, R. Ulrich, and D. Veberic., Nucl.Instrum. Meth.,A580, 1485(2007).
[6] Special filter glasses for sun beds, advanced materials,schott,March 2006.
[7] M. Ambrosio, C. Aramo, F. Bracci, P. Facal, R. Fonte, G. Gallo,E. Kemp, G. Matthiae, D. Nicotra, P. Privitera, G. Raia, E. Tusi,and G. Vitali, Nucl. Instrum. Meth.,A478, 125 (2002).
[8] M.A.L. de Oliveira, V. de Souza, H.C. Reis, and R. Sato., Nucl.Instrum. Meth.,A522, 360 (2004).
Page 29

PROCEEDINGS OF THE 31
ICRC, ŁODZ 2009 1
Education and Public Outreach for the Pierre Auger ObservatoryG. R. Snow
, for the Pierre Auger Collaboration
University of Nebraska, Lincoln, Nebraska USA
Observatorio Pierre Auger, Av. San Martın Norte 304, (5613) Malargue, Mendoza, Argentina
Abstract. The scale and scope of the physics studiedat the Auger Observatory offer significant opportuni-ties for original outreach work. Education, outreachand public relations of the Auger collaboration arecoordinated in a separate task whose goals are toencourage and support a wide range of education andoutreach efforts that link schools and the public withthe Auger scientists and the science of cosmic rays,particle physics, and associated technologies. Thepresentation will focus on the impact of the collabo-ration in Mendoza Province, Argentina, as: the AugerVisitor Center in Malargue that has hosted over40,000 visitors since 2001, a collaboration-sponsoredscience fair held on the Observatory campus inNovember 2007, the Observatory Inauguration inNovember 2008, public lectures, school visits, andcourses for science teachers. A Google-Earth modelof the Observatory and animations of extensive airshowers have been created for wide public release. Asthe collaboration prepares its northern hemispheresite proposal, plans for an enhanced outreach pro-gram are being developed in parallel and will bedescribed.
Keywords: Auger Education and Outreach
I. INTRODUCTION
Education and public outreach (EPO) have been anintegral part of the Auger Observatory since its incep-tion. The collaboration’s EPO activities are organizedin a separate Education and Outreach Task that wasestablished in 1997. With the Observatory headquarterslocated in the remote city of Malargue, population20,000, early outreach activities, which included publictalks, visits to schools, and courses for science teachersand students, were aimed at familiarizing the localpopulation with the science of the Observatory andthe presence of the large collaboration of internationalscientists in the isolated communities and countryside ofMendoza Province. The collaboration has been success-ful becoming part of the local culture. As an example ofthe Observatorys integration into local traditions, the col-laboration has participated in the annual Malargue Dayparade since 2001 with collaborators marching behinda large Auger banner (see Fig. 1). The Observatory’sEPO efforts have been documented in previous ICRCcontributions [1]. We report here highlights of recenteducation, outreach, and public relations efforts.
Fig. 1: The Auger collaboration and Science Fair partic-ipants in the November 2007 Malargue Day Parade.
II. THE AUGER VISITOR CENTER IN MALARGUE
The Auger Visitor Center (VC), located in the cen-tral office complex and data acquisition building inMalargue, continues to be a popular attraction. Throughthe end of April 2007, the VC has hosted 43,777 visitorswith an average of about 6000 per year. A noticeableincrease of visitors occured after the opening of a new,nearby planetarium [2] in August 2008. Fig. 2 showsthe number of visitors logged per year from November2001 through April 2009. The VC is managed by a smallstaff led by Observatory employee Analıa Caceres whichincludes local teacher Miguel Herrera and other Augercollaborators. Fig. 2 shows Auger physicist Julio Ro-driguez explaining the Observatory to a visiting schoolgroup in the data acquisition center.
Recent exhibits that were field tested at the VC,notably the illuminated scale model of the Observatorydeveloped at the Forschungscentrum Karlsruhe [1] andthe Google Earth fly-over animation [3] developed byStephane Coutu of Pennsylvania State University, havesince been replicated elsewhere. As examples, copies ofeach display are in the interim Auger North VC at LamarCommunity College in Colorado and in a new physicsand astrophysics learning center called the Galileiumin Teramo, Italy, whose director is Auger collaboratorAurelio Grillo.
III. THE 2007 AUGER SCIENCE FAIR
Following a successful Science Fair held in November2005, the Collaboration sponsored a second Fair onNovember 16-17, 2007, that attracted the exhibitionof 40 science projects in the areas of natural science,mathematics, and technology (see Fig. 3), in contrast to
Page 30

2 SNOW et al. AUGER EDUCATION AND OUTREACH
Fig. 2: Top: Number of visitors logged by year at theAuger Visitor Center. Bottom: Julio Rodriguez with aschool group visiting the Observatory.
29 projects presented at the 2005 Fair. While the 2005Fair was open only to high school level particpants, the2007 Fair offered awards in four age categories: grades1-3, 4-7, 8-9, and 10-12. A team of Auger collaboratorsjudged the projects on the basis of science content,oral and visual presentation, and the written report thataccompanied each project. Although the Fair’s partici-pants came from all over Mendoza Province, a noticablenumber of participants and award recipients attended theJames Cronin School in Malargue. The collaboration isindebted to the Observatory staff, the local organizingteam of three science teachers, and the city of Malarguefor helping to make the Science Fair a success. Athird Auger Science Fair is scheduled to take place inNovember 2009.
IV. THE 2008 AUGER INAUGURATION
The Collaboration held an inauguration ceremony onNovember 13-15, 2008, to mark the complete installationof the southern hemisphere Observatory. More than 200guests and 100 collaborators attended. Guests includedJulio Cobos, the Vice President of Argentina, CelsoJacque, the Governor of Mendoza Province, both shownin Fig. 4, the directors of Fermilab and CERN, severalambassadors, many high-level officials from fundingagencies and research officers from collaborating in-stutions. The 3-day event featured talks on the historyand status of the Observatory, the unveiling of com-memorative monument, traditional folk music and danceperformances during an outdoor asado, and opportu-
Fig. 3: Top: The 2007 Science Fair in the AssemblyBuilding. Bottom: Jim Cronin with Science Fair awardrecipients.
nities for visitors to tour the vast Auger site. Manyguests indicated how much they were impressed withObservatory and even enjoyed the dusty two-hour rideacross the Pampa Amarilla.
V. OTHER OUTREACH ACTIVITIES
The scholarship program which brings top Malarguestudents to Michigan Technical University (MTU), de-scribed in [1], has enjoyed continued success. A fifthstudent in the program, who would normally begin hisstudies in science or engineering in the fall 2009, willbe delaying matriculation for one year and enroll atMTU in the fall of 2010. The first MTU student fromMalargue who enrolled in 2001 completed a MastersDegree in mechanical engineering and has embarked onan engineering career in the U.S. The second and thirdstudents have also graduated and returned to Argentinawith their engineering degrees. The fourth student willbegin his third year of studies at MTU in the fall 2009.
In August 2007 and 2008, Observatory employeeAnalıa Caceres served as a lead organizer for the Na-tional Week of Science and Technology held at theMalargue Convention Center. These interdisciplinarysymposia drew paricipants from all over Argentina andfeatured several Auger collaborators speaking about theObservatory and other science topics.
The public release of extensive air shower data forinstructional purposes [1] has proven to be successful,and web-based information and instructions are now
Page 31

PROCEEDINGS OF THE 31
ICRC, ŁODZ 2009 3
Fig. 4: Top: Auger collaborator Miguel Mostafa (left)translating the comments of Argentina Vice President,Julio Cobos, at the 2008 Inauguration. Bottom: Mendozagovernor Celso Jacque presenting a plaque to Augercollaborator Ingo Allekotte at the Inauguration.
available in English, Spanish, French, Italian, and Ger-man [4]. The web sites register an average of 50 uniquehits per day from 43 countries, although the bulk of thetraffic is from the U.S., Argentina, and a few Europeancountries. A major spike in usage occured just afterthe Collaboration published its notable result on thecorrelation of arrival directions of its highest energyevents with AGN galaxies [5]. The public data servedas the basis for an award-winning science fair projectof two students from Lamar High School in Colorado,shown in Fig. 5.
In the fall 2008, Randy Landberg, Education andOutreach Director for the Kavli Institute for Cosmolog-ical Physics, Auger collaborators from the University ofChicago, and personnel from the American Museum ofNatural History (AMNH) in New York received U.S.National Scienc Foundation funding to produce a 10-minute, high-resolution video about the Observatory.The video is foreseen as one of the AMNH onlineScience Bulletins [6]. A AMNH film crew visited theObservatory in November 2008 to shoot footage ofObservatory sites and surroundings and to film inter-views with Auger collaborators. The Science Bulletin isscheduled to be released in the late spring 2009.
Many Auger collaborators have organized activitiesat their institutions and in local communities associatedwith the 2009 International Year of Astronomy.
Fig. 5: Students from Lamar High School with theirscience fair poster based on Auger data released to thepublic.
VI. AUGER NORTHERN SITE OUTREACH
As the Auger collaboration prepares its proposal tobuild a northern hemisphere site in southeast Colorado,the Education and Outreach Task continues to lay thegroundwork for a comprehensive outreach program thatwill be linked to the outreach efforts in the southernhemisphere. Primary outreach goals in this period are topromote the Observatory in southeast Colorado, provideinformation to people at all levels, and establish earlyties with science teachers and students in the region’sschools. Lamar Community College (LCC) has beennamed the host institution for Auger North outreach, andefforts have been led by LCC employee Brad Thompson.
An interim Visitor Center has been established (seeFig. 6) in the LCC library which features explanatoryposters, take-home information brochures, a scale modelof a Surface Detector (SD) station, an SD photomul-tiplier tube, scintillator detectors which register cosmicray muons as viewed on an oscilloscope, and a large flatscreen monitor to view the Google Earth display [3] ofthe Observatory. This display was recently expanded toinclude the layout of the proposed northern site. A largerstate-of-the-art visitor center is foreseen to be includedin the headquarters of Auger North at LCC.
A recent highlight was the installation of two full-sized SD detector stations in the area, one on theLCC campus, and one near the county fairgrounds inthe nearby town of Las Animas. The names for thesestations, Pierre’s Dream and Cosmos, respectively, weredetermined by a contest among area primary schoolstudents. The SD stations allow area landowners to viewexamples of detetectors they will be asked to host ontheir property as Auger North proceeds.
Page 32

4 SNOW et al. AUGER EDUCATION AND OUTREACH
Fig. 6: The interim Visitor Center at LCC.
An unveiling ceremony for the detectors was held onOctober 27, 2007, in both Lamar and Las Animas, withthe mayors of each town welcoming the Observatory tothe area. The winners of the detector naming contestwere also recognized at the ceremony, as shown inFig. 7. Additional SD stations are presently being placedin visible locations in other towns in the footprint ofthe Auger North array, namely, in Springfield and Eads,Colorado. In addition to their role in public relations,the detectors will be filled with water and outfitted withtemperature sensors for freezing studies, part of theR&D for Auger North.
Fig. 7: Shown with the display SD station at LCC arethe students and families responsible for the detector’sname.
REFERENCES
[1] G. Snow for the Pierre Auger Collaboration, “Education andPublic Outreach for the Auger Observatory”, Proc. of the 27thICRC, Hamburg, Germany, 2001; B. Garcıa and G. Snow for thePierre Auger Collaboration, “Education and Public Outreach forthe Auger Observatory”, Proc. of the 29th ICRC, Pune, India,2005; G. Snow for the Pierre Auger Collaboration, “Educationand Outreach for the Auger Observatory”, Proc. of the 30thICRC, Merida, Mexico, 2007.
[2] See http://www.malargue.gov.ar/plaetario.php.[3] The Google Earth model is available at: http://www.auger.org/
features/google earth.html.[4] See as examples http://cabtep5.cnea.gov.ar/experiments/auger/
ED/, http://apcpaox.in2p3.fr/ED/, or Wikipedia.[5] J. Abraham, et al., “Correlation of the highest energy cosmic
rays with nearby extragalactic objects”, Science 318, 939 (9November 2007).
[6] See http://www.amnh.org/sciencebulletins/.
Page 33

PROCEEDINGS OF THE 31st ICRC, ŁODZ 2009 1
BATATA: A device to characterize the punch-through observed inunderground muon detectors and to operate as a prototype for
AMIGA
Medina-Tanco Gustavo∗, for the Auger Collaboration†
∗Instituto de Ciencias Nucleares (ICN), Univ. Nacional Autonoma de Mexico, Mexico D.F.† Observatorio Pierre Auger, Av. San Martın Norte 304 (5613) Malargue, Prov. Mendoza, Argentina.
Abstract. BATATA is a hodoscope comprising threeX-Y planes of plastic scintillation detectors. Thissystem of buried counters is complemented by anarray of 3 water-Cherenkov detectors, located at thevertices of an equilateral triangle with 200 m sides.This small surface array is triggered by extensiveair showers. The BATATA detector will be installedat the centre of the AMIGA array, where it will beused to quantify the electromagnetic contaminationof the muon signal as a function of depth, and soto validate, in situ, the numerical estimates made ofthe optimal depth for the AMIGA muon detectors.BATATA will also serves as a prototype to aid thedesign of these detectors.
Keywords: muon-hodoscope, punch-through-characterization, AMIGA
I. I NTRODUCTION
High energy cosmic rays are indirectly characterizedby measuring the extensive air shower cascades thatthey trigger in the Earth atmosphere. At ground level,and at distances greater than a few tens of metersfrom the axis, the shower is dominated by just twocomponents: electromagnetic (electrons, positrons andphotons) and muonic. The relative weight of these twocomponents has invaluable information about the natureof the primary cosmic ray and of the high energyhadronic processes taking place at high altitude duringthe first interactions. Water Cherenkov detectors usedby the Pierre Auger Observatory measure the combinedenergy deposition of charged particles inside its volumeand are not well suited for discriminating betweenelectromagnetic and muonic components. Therefore, aspart of the Auger surface low energy extension AMIGA[1], buried muon scintillators will be added to theregular surface stations of an infill region of the array.Provided enough shielding is ensured, these counterswill allow the measurement of the muon signal and, incombination with their Cherenov tank companions, theestimate of the electromagnetic component. The finalobjective of this assemblage is to achieve high qualitycosmic ray composition measurements along the ankleregion [2]. Several prototyping activities are beingcarried out for the muon counters [3] and an additionaldetector is being constructed, BATATA. The mainobjective of the latter is to quantify the electromagnetic
Fig. 1: Surface (top) and buried (bottom) sections of theBATATA detector and working principle.
contamination of the muon signal as a function ofdepth, and so to validate in situ the numerical estimatesmade of the optimal depth for the AMIGA muondetectors. BATATA will be installed at the center of thefuture AMIGA array and will also serve as a prototypeto aid the design of its detectors. The chosen site, fromthe point of view of soil properties and, therefore, ofpunch-through characteristics, is statistically equivalentto any other location of the area covered by the infill [4].
II. T HE DETECTOR
A schematic view of BATATA is shown in Figure1. The detector is composed by a set of three paralleldual-layer scintillator planes, buried at fix depths rangingfrom 0.50 m to 2.5 m.
Page 34

2 MEDINA-TANCO G. et al. BATATA MUON DETECTOR
Each layer in a plane is 4 m2 and is composed by49 rectangular strips of4 cm x 2 m, oriented at a rightangle with respect to its companion layer, which givesan xy-coincidencepixel of 4x4 cm2. The scintillators areMINOS-type extruded polystyrene strips [5], with anembedded Bicron BC92 wavelength shifting fiber, of1.5mm in diameter [6]. Building and quality assessmentprotocols (e.g., cutting, polishing, gluing and painting)as well as the characterization procedures of the opticalfibers and scintillator bars can be found in [7]. Light iscollected by Hamamatsu H7546B 64 pixels multi-anodePMTs [8]. Eachx-y plane is fitted inside an individualcasing, where each orthogonal direction ends in its ownfront-end electronic board (FE), as shown schematicallyin Figure 2.
Fig. 2: Schematic view of the arrange of scintillators,optical fibers and front-end electronics inside the casingfor any one of the three BATATA planes.
The casings are made of fiber glass and were speciallydesigned to be water- and light-tight and to withstandhandling during shipping and burying. They have twocaps which allow for easy access to the correspondingfront-end boards and optical couplings between PMTsand optical fiber cookies. The caps can be dismounted intwo steps if necessary, one for inspection and servicing,and a second for cabling replacement, ensuring in bothcases that water-tightness can be recovered. Addition-ally, the casing and sealing are versatile enough to allowfor the straight forward addition of new components andcabling not specifically foreseen in the original design.
The front-end electronics works in counting modeand signals are transmitted to the surface DAQ stageusing low-voltage differential signaling (LVDS). Anystrip signal above threshold opens a GPS-tagged2
µs data collection window. Data, including signal andbackground, are acquired by a system of FPGA Spartanboards and a TS7800 single board computer. The codecontrolling the data flux at the FPGA level was writtenin VHDL (VHSIC -Very High Speed Integrated Circuits-hardware description language).
The front end boards are12.3′′×9.3′′ and comprise64
channels, of which only49 are actually used at present.
The multi-anode PMT and its high-voltage supply arelocated on the board. Each channel includes: (i) anamplification stage, which uses the AD8009 operatedat amplification factor∼ 6, (ii) a discrimination stage,which uses a MAX9201 high-speed, low power, quadcomparator with fast propagation delay (7ns typ at 5mVoverdrive) connected in bipolar mode, (iii) a digital-to-analog converter TLC7226C to independently setup thediscrimination voltage of each channel and, (iv) a high-speed differential line driver SN55LVDS31 to transformthe discriminator output into a differential signal whichis carried out to the surface and to the DAQ system some17 m away (see, Figure 3).
Fig. 3: Front-end board: (top) general view with multi-anode PMT, (bottom) single channel layout.
Each stage of the FE board has been tested withcontrolled square pulses of 50 mV height and≈10 nswidth injected at a frequency of 1 kHz. Mean outputsof the amplification and differentiation stages as well asoutput rates of 16 different channels are shown in Figure4.
The front end electronics resides in an enclosurewhich only exchanges heat with the surrounding groundby conduction. It has being experimentally determinedthat, under the most unfavorable conditions, the equi-librium temperature at the surface of the board neverexceeds40 oC, which is well inside the working rangeof the electronic components.
A cosmic ray EAS event triggers at least tens ofchannels in a time scale o aµ-sec. This rate is much
Page 35

PROCEEDINGS OF THE 31st ICRC, ŁODZ 2009 3
Time (ns)10 20 30 40 50 60 70
Am
plit
ud
e (m
V)
-300
-200
-100
0
100
200
300
50mV≈ 250mV≈ 350mV≈
Input signal Amplification stage Differentiation stage
Discriminator Threshold (mV)-40 -30 -20 -10 0 10
Rat
e (H
z)
0
200
400
600
800
1000
1200
1400
1600
Pin 1
Pin 3
Pin 5
Pin 7
Pin 17
Pin 19
Pin 21
Pin 23
Pin 33
Pin 35
Pin 37
Pin 39
Pin 49
Pin 51
Pin 53
Pin 55
11 mV
Fig. 4: Testing and characterization measurement on FEboard with controlled square pulses of 50 mV height and≈10 ns width injected at a frequency of 1 kHz.
higher than the∼kHz background of the detector dueto low energy cosmic rays and natural radioactivity.Therefore, EAS events can be easily detected with asimple trigger scheme implemented at the FPGA level.The FPGA trigger is implemented via software and canbe easily changed if appropriate. In order to ensure thestability of the trigger rate, background events are alsorecorded at fixed time intervals during each run and areused to re-calibrate the discriminator thresholds at theend of each run. Additionally, in order to characterizethe electromagnetic punch-through, EAS inside a limitedenergy range and with axis at a defined distance fromthe detector have to be selected. In order to attain this,BATATA also counts with a small triangular surface ar-ray of 3 regular SD Cherenkov stations at a separation of200 m. This array provides the required offline selectioncapability for quasi-vertical showers in the vicinity of10
PeV.The power consumption of BATATA is. 200 W.
This power is supplied by an array of20 solar panelswith their corresponding batteries, ensuring continuousoperation during low insolation winter months.
III. E ND-TO-END SIMULATIONS AND DATA ANALYSIS
Muons are penetrating particles and propagate throughthe ground following a well defined track. Therefore,it is expected that, most of the times, they will onlytrigger one pixel at each layer. Furthermore, muons willtend to triggerx-y pixels in coincidence inside the sameplane. Electrons, positrons and photons, on the otherhand, are much less penetrating and generate rapidlyevolving electromagnetic showers underground whichhave a lateral extension. Therefore, they will tend toleave 2-dimensional footprints in the detector, speciallyat the depths of maximum development of the cascadesbetween∼ 30 and ∼ 80 cm for particles that, on theground, have energies in the range∼ 0.5–10 GeV.These differences between muon and electromagneticsignatures at the detector are used for discrimination.This is schematically shown in Figure 1, and motivatesthe uneven depths chosen for the three scintillator planesof BATATA.
The data analysis requires a thorough understandingof the statistical response of the detector to EAS par-ticles impinging the ground above and in its vicinity.Therefore, a comprehensive set of numerical end-to-endsimulations of the detector have been carried out. Acombination of AIRES [9] and Geant4 [10] is used tosimulate EAS development from the top of the atmo-sphere up to the ground, where particles are injectedand followed using Geant4 while they propagate throughthe soil and into the scintillator bars. The subsequentphotons produced by the dopants inside the polystyrenestrips are followed while bouncing off the TiO2 coveringand into the wavelength shifting optical fiber. Finally,the green-shifted photons thus produced by the dopantof the fiber are transfered along up to the window of thePMT. The several parameters involved in the simulationof the scintillator are then fine-tunned to reproduce thestructure of the time profiles and integrated charges ofmuon pulses actually measured under laboratory condi-tions. In parallel, the shower impinging the surface arrayis reconstructed using the Offline Auger reconstructionand data handling package [11].
Figure 5 shows some example of the output of theend-to-end simulations for the underground segment ofBATATA. Figure 5a shows one simulated muon tracksand 2 low energy electromagnetic cascades crossingthe 3 planes of the detector and the correspondingtriggered strips, i.e., producing a voltage above thresholdin their front-end discriminator. Figure 5b shows thesimulated and the real mean pulse shape for backgroundmuons. The output of the overall simulation chain isan electronic PMT signal as shown in Figure 5c. Ascan be seen from Figure 5d, where a measured muonsignal is shown, the simulations are able to reproducesatisfactorily the output of the detector.
IV. CONCLUSIONS
A hodoscope, BATATA, comprising three X-Y planesof plastic scintillation detectors, complemented by an
Page 36

4 MEDINA-TANCO G. et al. BATATA MUON DETECTOR
(a)
Time (ns)108 110 112 114 116 118 120 122 124 126 128
Am
plit
ud
e (m
V)
-30
-25
-20
-15
-10
-5
0
Lab. Meas.
Simulations
(b)
Time (ns)60 80 100 120 140 160 180 200
Am
plit
ud
e (m
V)
-50
-40
-30
-20
-10
0
(c)
Time (ns)60 80 100 120 140 160 180 200
Am
plit
ud
e (m
V)
-20
-15
-10
-5
0
(d)
Fig. 5: End-to-end simulations. (a) Simulated muon tracks and low energy electromagnetic cascades. (b) Real andsimulated mean pulse shape at 160 cm from the edge of a scintillator. (c) Simulated muon signal. (d) Actuallaboratory measured muon signal.
array of 3 water-Cherenkov detectors at a separationof 200 m is under construction and will be installedat the centre of the AMIGA extension to the Augerbaseline design. BATATA will be used to quantify theelectromagnetic contamination of the muon signal as afunction of depth. and will also serve as a prototype toaid the design of the AMIGA muon detectors.
BATATA is in its final phase of construction and itsdeployment will start on July 2009 with commissioningalong the second semester of the year.
ACKNOWLEDGEMENTS
This work is partially supported by the Mexicanagencies CONACyT and UNAM’s CIC and PAPIIT.
REFERENCES
[1] M. Platino for the Pierre Auger Colaboration, these Proceedings.[2] G. Medina-Tanco for the Pierre Auger Collaboration, Proc. of
the 30th ICRC,2 (2008) 1101.[3] P. Buchholz for the Pierre Auger Colaboration, these Proceed-
ings.[4] C. Canet, G. Medina Tanco, T. Pi, et al., The site of the BATATA
detetor in Malarge, Argentina: Geological characterization, GAPNote, 159, 2008. http://www.auger-mirror.nucleares.unam.mx/BATATAdocs/
[5] The MINOS Collaboration, Technical Design Report, The MI-NOS Detectors, FNAL internal document NuMI-L-337, 1998.. –A. Pla-Dalmau, A. D. Bross, A.D., V.V. Rykalin, Nuclear ScienceSymposium Conference Record, IEEE, v.1 (2003) 102.
[6] Plastic Scintillating Fibers http://www.detectors.saint-gobain.com
[7] F. Snchez, D. Supanitsky, G. A. Medina-Tanco, et al., PMTandscintillator strips testing and characterization for the BATATAdetector, GAP Note, 158, 2008 – A. D. Supanitsky, A. Guz-man, G. A. Medina-Tanco, et al., Optical fiber characterizationand scintillator strip assembly for the BATATA detector, GAPNote, 157, 2008. http://www.auger-mirror.nucleares.unam.mx/BATATAdocs/
[8] http://optical-components.globalspec.com/datasheets/2636/Hamamatsu/
[9] S. Sciutto, AIRES Users Manual and Reference Guide, http://www.fisica.unlp.edu.ar/auger/aires
[10] S. Agostinelli, et al., NIM A, 506 (2003) 250. – Allison,J. etal., IEEE Transactions on Nuclear Science, 53 (206) 270.
[11] S. Argiro, S.L.C. Barroso, J. Gonzalezc, et al. NIM A 580(2007)1485.
Page 37

PROCEEDINGS OF THE 31st ICRC, ŁODZ 2009 1
Progress with the Northern Part of the Pierre Auger Observatory
John L. Harton ∗ for the Pierre Auger Collaboration
∗Colorado State University, Department of Physics, Fort Collins, CO 80523 USA
Abstract. It is planned to build the northern part ofthe Pierre Auger Observatory in southeast Colorado,USA. Results from the southern section of the AugerObservatory, which has recently been completed,imply a scientific imperative to create a much largeracceptance for the extremely rare cosmic rays ofenergy above a few times1019 eV. The plan for AugerNorth is to cover an area greater than 20,000 km2,seven times the area of Auger South in Argentina.The motivation for Auger North and the status ofpreparations will be presented including: R&D workat the Colorado site on a small surface detectorarray; atmospheric monitoring measurements; R&Don new electronics and communications equipment;and outreach and relations with the local community.
Keywords: Ultra-high energy, Cosmic rays, Auger.
I. AUGER SOUTH REVIEW
The southern Pierre Auger Observatory nearMalargue, Argentina was completed in June 2008 andhas produced science results for events with primarycosmic ray energies in the EeV range and above. Thepublished results are based on exposures taken while theobservatory was growing, and the integrated exposuresare about 9,000km2 sr yr. One year of data takingwith the full Auger South instrument (including arrivaldirection zenith angles from 0 to 60 degrees) representsapproximately 7,000km2 sr yr. These results includethe energy spectrum, with observation of the ‘ankle’andGZK-like features [1], and limits on the flux of primaryphotons [2] [3] and tau neutrinos [4]. The photon limitsare already restricting some top-down models of cosmicray production, and the neutrino limit is the best acrossthe energy range expected for neutrinos produced in theGZK interaction. Studies of the arrival directions of thehighest energy particles show that they correlate withthe matter density within about 100 Mpc, and they maycorrelate with relatively nearby active galactic nuclei [5][6]. The steep drop in flux, first published by HiRes [7],occurs at about 60 EeV and generally corresponds in theAuger data to the threshold energy for the correlationwith directions to nearby extragalactic objects. So themost energetic cosmic rays, those with the trans-GZKenergies, appear to be of extragalactic origin. In additiondata from Auger South have been used to study theaverage position of maximum shower development inthe atmosphere,Xmax, and its correlation with primarycosmic ray type. For sources further than about 20 Mpc
from Earth, light nuclei, such as carbon, nitrogen, andoxygen will break up due to interactions with photonsmore readily than iron, so the only nuclei expected tosurvive these distances in significant percentages areiron nuclei and protons. The Auger South result onXmax shows thatXmax is tending to smaller valuesas energies approach the GZK feature, and this canbe interpreted to indicate, within current models ofhadronic interactions that are extrapolated from lowerenergies, that the primary composition is getting heavier[8] [9]. This measurement could signal new hadronicphysics if the primary cosmic rays are protons.
The Auger South instrument is composed of an arrayof detectors to measure particles from extensive cosmicray showers that reach the ground and optical detectorsthat overlook the surface detectors. The optical detectors,which function on dark and clear nights, measure thefluorescence of atmospheric nitrogen along the axis ofthe particle shower. The surface array of Auger Southis comprised of over 1,600 water Cherenkov detectorsplaced on a triangular grid with 1.5 km spacing, cover-ing 3,000 square kilometers [10]. On the periphery ofthe surface array are four buildings each housing sixtelescopes [11] that record the nitrogen fluorescence.
The results from Auger South present compellingevidence that the sources of cosmic rays above 60EeV are extra-galactic and that the GZK effect reducesprimary energies below this level for particles fromsources more distant than the nearby universe. Thus itwill be possible to study the nearby sources at highestenergies without a diffuse background from the entireuniverse. Additionally, Auger South data allow one tomeasure particle interactions at energies not accessibleto manmade accelerators, up to∼500 TeV in the centerof mass system, and there may be hints of new particlephysics.
II. A UGER NORTH
The Auger South results imply an imperative tostudy the highest energy cosmic rays with the greateststatistical precision possible. The Auger South detectorrecords approximately 20-25 trans-GZK events per year.The plan for Auger North is to build a ground arraycovering 20,500 km2 with near complete fluorescencedetector coverage. Auger North is proposed for southeastColorado, USA - see Figure 1. The acceptance is seventimes that of Auger South, so the full Auger Observatory,South plus North, will detect (assuming flux about thesame in the north as in the south) approximately 180 ofthe most interesting events per year - hopefully enough
Page 38

2 AUGER NORTH
Fig. 1: Site of the northern part of the Pierre AugerObservatory. The shaded area in the southeast corner ofthis Colorado map shows the 8,000 square miles (20,500square kilometers) planned for Auger North. The sitecould extend eastward into Kansas.
Fig. 2: Layout of the northern Auger detector. Each dotrepresents a Cherenkov detector. The fluorescence de-tector positions are given by circles, and the permanentcalibration lasers are shown as small arrows. The 2000km2 infill is shaded (lower right) and has higher densityof surface detectors .
to study the energy spectra from individual sources in10-20 years of observation.
The design of Auger North focuses on the highestenergies while profiting from the successful experiencewith the southern Auger instrument. Water Cherenkovdetectors and fluorescence detectors similar to those inthe south are planned. There will be a few changes.The most important is that the Auger North surfacedetector spacing will be
√2 miles (2.28 km) on a square
grid. This spacing takes advantage of the land ownershippattern and partial road grid in the western United States,which is based on 1-mile (1.6 km) squares. For most ofthe array only every second corner of the square milegrid will have a surface detector unit. We plan 4,000detectors covering 8,000 square miles for the majority ofthe array. On 800 square miles (2000 km2) we will placea detector on every grid corner. Four-hundred additionalsurface detectors are needed for this in-fill, which willprovide a connection to the high statistics at AugerSouth. The energy at which Auger South approaches100% trigger efficiency is 3 EeV. Studies using AugerSouth data indicate that the trigger efficiency on the
√2-
mile pattern will be 90% at 30 EeV and that the 800square-mile infill will be 90% efficient at 4 EeV. Weplan to build five fluorescence detector buildings with atotal of 39 telescopes at Auger North. Figure 2 showsthe layout of Auger North. The telescopes will be fartherapart than in the south to minimize costs, but above30 EeV Auger North will still have near full hybridcoverage.
Other important changes include the use of only onelarge PMT in each surface detector instead of the threeat Auger South (cost savings), and the need to insulatethe Cherenkov tanks (colder winters in Colorado thanin Malargue). The topography in Colorado is not asflat as at the Auger South site, and there are no hillssurrounding Auger North as there are in the south. Thesefactors make it impossible to use the communicationsparadigm at Auger South in which data are transmittedfrom individual detectors to the fluorescence buildingson the perimeter of the surface array. At Auger Norththe data will flow from tank to tank until reaching acollection point. At Auger South the absolute calibrationof the fluorescence detector is based on periodicallyplacing a calibrated light source at the aperture of eachtelescope [12] to illuminate all 440 PMTs in the detector.This calibration is checked from time to time using amobile laser positioned a few km from the telescope[13]. The laser is fired vertically, and the calculable fluxof scattered photons is used to check the calibrationof a line of PMT pixels in the telescope. The methodis cumbersome since it requires moving the laser inthe field to illuminate different telescopes or pixels.At Auger North we plan an array of permanent lasersto complement the method using a light source at thetelescope aperture.
The fluorescence detectors for Auger North will bevery similar to those in Malargue. The basic design is
Page 39

PROCEEDINGS OF THE 31st ICRC, ŁODZ 2009 3
Fig. 3: Tentative layout for the Auger North R&Darray. Light circles represent possible sites for fullyfunctioning tank detectors; darker circles indicate sitesfor communications-only equipment. The two arms arethe minimum needed to test the tank-to-tank communi-cations system.
unchanged, but the electronics and slow control willbe updated. The main testbed for the Auger Northfluorescence detector is the three HEAT telescopes [14]being built at Auger South.
III. R&D FOR AUGER NORTH
The main changes for Auger North require R&D toconfirm the new designs and and in some cases to solvetechnical challenges. To this end the collaboration isbuilding a small R&D array south of Lamar, Colorado,the main city in the site region. Lamar CommunityCollege (LCC), located a few miles north of the R&Darray, is the host institution for education and outreachfor Auger north. LCC is operating an interim visitors’center at the college, and puts on lectures for localresidents at schools. Plans call for the main Auger Northcampus to be built at LCC.
Figure 3 shows the layout of the R&D array. We planto deploy 6 to 10 fully functioning Auger North tanksand 10 to 14 stations that have only communicationsequipment. We plan to start the deployment in 2009.The layout of the R&D array is driven by the new
communications system, which uses the long and shortarms to funnel the data to the central data acquisitioncenter. In summer 2008 Auger collaborators made asurvey of the signal transmission from all points on theR&D array to the neighboring stations.
The Auger South tanks are made of roto-moldedpolyethylene without insulation. One approach to in-sulate the Auger North tanks is to use a chemicallyfoaming resin inside the tank as a manufacturing step.The technique is promising, and a few insulated tankshave been produced, but it is not yet at a productionstage. We have made studies over the past few winterswith non-insulated and hand-insulated Auger tanks inColorado and Argentina with temperature probes inand around the tanks. We have measured significantheat flow from the ground into the tank in the winter,which indicates that the bottom of the tank should notbe insulated. Our thermal models generally predict thewater temperature as a function of ambient temperatureand incident sunlight as the tanks approach freezingand ice starts to form. Work continues with the newlymanufactured tanks insulated using the foaming resin.The goal is to optimize the thickness of the insulation(for cost) in the face of a simulated historical period ofextreme cold.
Atmospheric studies at the Colorado site are movingforward with a system based on successful work atAuger South. We plan to install a vertically firing laserthat will be viewed by two detection systems: a RamanLIDAR receiver installed at the laser site and directedalong the laser beam to record the backscattered signal;and a system with a mirror and PMT camera similar tothose used at HiRes (but with only a narrow stripe ofPMT’s installed) which we call the AMT (AtmosphericMonitoring Telescope). The AMT will be placed 30-40km from the vertical laser beam, and so it is very similarto the CLF[15]/XLF technique used at Auger South tomeasure the vertical aerosol optical depth up to approx-imately 6 km. The two systems will make independentmeasurements of the aerosols while providing a test bedfor Auger North atmospheric monitoring. In addition, weplan to place a nitrogen laser approximately 4 km fromthe AMT to test the concept of the permanent absolutecalibration laser. The AMT will use the electronicsdeveloped for the HEAT telescopes.
Other R&D includes work on surface detector elec-tronics to extend the dynamic range of the Cherenkovdetectors, and studies with new GPS receivers. We willalso exercise deployment techniques and in general learnabout working in Colorado to build Auger North. ThisR&D array is similar to the Engineering Array [16] ofAuger South in that the goals are to fully reconstructextensive air showers at each site - separately with thesurface detector in Colorado and the HEAT fluorescencedetectors in Argentina. The aim is to bring as manycomponents as possible to the pre-production stage andto validate cost estimates for Auger North.
Page 40

4 AUGER NORTH
(a) Array areas to scale. (b) Exposures
Fig. 4: Array areas and recorded or planned exposures for ground arrays of UHECR detectors: AGASA; TelescopeArray; the southern part of the Auger Observatory; and the northern part of the Auger Observatory. The exposureplot is on a log scale.
IV. OUTLOOK
The goals of the Auger Observatory have been, sincethe inception of the project, to“discover and understandthe source or sources of cosmic rays with energiesexceeding1019 eV.”. Results from the southern sectionof the Observatory in Argentina have shown that thehighest energy particles are likely of extra-galactic originand that the flux of these particles drops significantly atthe energy where a correlation with matter in the nearbyuniverse sets it. The highest energy cosmic rays do notarrive isotropically at 99% confidence level. The datafrom Auger South indicate that the primaries are notphotons and that they are tending toward heavier nucleias the energy approaches the energy of the flux drop andthe correlation with extra-galactic matter. The correlationand the tendency toward shallowXmax pose a challengeto our understanding from the astrophysical point ofview. The solution lies in gaining more data at energiesat and above the energy of the flux drop and correlation,which is about 60 EeV. The Auger South detector islarge enough to detect about 20-25 of these events ayear. Figure 4a shows scale outlines of four cosmic raydetector arrays, and 4b plots corresponding exposures(assuming a certain start date for Auger North). Theleft half of Figure 4a shows AGASA, which is nolonger taking data, the Telescope Array near Delta, Utah,USA, and Auger South at Malargue, Argentina. Theproposed northern part of the Auger Observatory isalso shown; it is about seven times the area of AugerSouth. Assuming the flux of trans-GZK events in thenorthern hemisphere is about the same as that measuredin the south, Auger North and Auger South together willmeasure approximately 180 trans-GZK events per year.
REFERENCES
[1] [J. Abraham, et al.],Physical Review Letters 101 (2008), 061101.[2] [J. Abraham, et al.], Astroparticle Physics 27 (2007), 155.[3] [J. Abraham, et al.], Astroparticle Physics 29 (2008), 243.
[4] [J. Abraham et al.], Physical Review Letters 100 (2008),211101.[5] [J. Abraham, et al.] Science 318 (2007), 939.[6] [J. Abraham, et al.] Astroparticle Physics 29 (2008), 188.[7] [R. Abbasi et al.] Phys.Rev.Lett.100:101101,2008.[8] M. Unger for the Pierre Auger Collaboration, 30th ICRC,
Merida, 2007, arXiv:0706.1495 [astro-ph].[9] J. A. Bellido for the Pierre Auger Collaboration, These proceed-
ings, 31st ICRC, Łodz 2009[10] [J. Abraham et al.], Nuclear Instruments and MethodsA523
(2004), 50.[11] A. A. Watson, Proc. 30th ICRC (2007) (Merida),
arXiv:0801.2321 [astro-ph].[12] [J.T. Brack, et al.], Astropart.Phys.20:653-659,2004.[13] R. Knapik for the Pierre Auger Collaboration, Proc. 30th ICRC
(2007) (Merida).[14] M. Kleifges for the Pierre Auger Collaboration, These proceed-
ings, 31st ICRC, Łodz 2009[15] [B. Fick et al.], JINST 1:P11003,2006.[16] [M. Albrow et al.], Nuclear Instruments and Methods A523
(2004), 50.
Page 41
Acknowledgements
The successful installation and commissioning of the Pierre Auger Observatory would nothave been possible without the strong commitment and effort from the technical and admin-istrative staff in Malargue.
We are very grateful to the following agencies and organizations for financial support:
Comision Nacional de Energıa Atomica, Fundacion Antorchas, Gobierno De La Provinciade Mendoza, Municipalidad de Malargue, NDM Holdings and Valle Las Lenas, in gratitudefor their continuing cooperation over land access, Argentina; the Australian ResearchCouncil; Conselho Nacional de Desenvolvimento Cientıfico e Tecnologico (CNPq),Financiadora de Estudos e Projetos (FINEP), Fundacao de Amparo a Pesquisa do Estadode Rio de Janeiro (FAPERJ), Fundacao de Amparo a Pesquisa do Estado de Sao Paulo(FAPESP), Ministerio de Ciencia e Tecnologia (MCT), Brazil; AVCR AV0Z10100502 andAV0Z10100522, GAAV KJB300100801 and KJB100100904, MSMT-CR LA08016, LC527,1M06002, and MSM0021620859, Czech Republic; Centre de Calcul IN2P3/CNRS, CentreNational de la Recherche Scientifique (CNRS), Conseil Regional Ile-de-France,Departement Physique Nucleaire et Corpusculaire (PNC-IN2P3/CNRS), DepartementSciences de l’Univers (SDU-INSU/CNRS), France; Bundesministerium fur Bildung undForschung (BMBF), Deutsche Forschungsgemeinschaft (DFG), FinanzministeriumBaden-Wurttemberg, Helmholtz-Gemeinschaft Deutscher Forschungszentren (HGF),Ministerium fur Wissenschaft und Forschung, Nordrhein-Westfalen, Ministerium furWissenschaft, Forschung und Kunst, Baden-Wurttemberg, Germany; Istituto Nazionale diFisica Nucleare (INFN), Ministero dell’Istruzione, dell’Universita e della Ricerca (MIUR),Italy; Consejo Nacional de Ciencia y Tecnologıa (CONACYT), Mexico; Ministerie vanOnderwijs, Cultuur en Wetenschap, Nederlandse Organisatie voor WetenschappelijkOnderzoek (NWO), Stichting voor Fundamenteel Onderzoek der Materie (FOM),Netherlands; Ministry of Science and Higher Education, Grant Nos. 1 P03 D 014 30, N202090 31/0623, and PAP/218/2006, Poland; Fundacao para a Ciencia e a Tecnologia,Portugal; Ministry for Higher Education, Science, and Technology, Slovenian ResearchAgency, Slovenia; Comunidad de Madrid, Consejerıa de Educacion de la Comunidad deCastilla La Mancha, FEDER funds, Ministerio de Ciencia e Innovacion, Xunta de Galicia,Spain; Science and Technology Facilities Council, United Kingdom; Department of Energy,Contract No. DE-AC02-07CH11359, National Science Foundation, Grant No. 0450696,The Grainger Foundation USA; ALFA-EC / HELEN, European Union 6th FrameworkProgram, Grant No. MEIF-CT-2005-025057, European Union 7th Framework Program,Grant No. PIEF-GA-2008-220240, and UNESCO.
Page 42