Operations Management (Production)southwest.mpls.k12.mn.us/uploads/omswh11052015ppt.pdf · Levis...
29
CHAPTER NINE Operations Management (Production) Manufacturing Service
Transcript of Operations Management (Production)southwest.mpls.k12.mn.us/uploads/omswh11052015ppt.pdf · Levis...
CHAPTER NINE
Operations Management (Production)
Manufacturing Service

What’s Had The Biggest Effect on Productivity?
0 20 40 60 80
Computers & Technology
Quality & Customer Satisfaction
Empowering Workers
Hiring Part-Time Workers
Downsizing
Percentage of Workforce

Leading U.S. Manufacturing States
0 100 200 Miles
WASHINGTON
OREGON
IDAHO
MONTANA
WYOMING
NEVADA
CALIFORNIA
UTAH
ARIZONA
COLORADO
NEWMEXICO
KANSAS
OKLAHOMA
MISSOURI
ARKANSAS
TEXAS
LOUISIANA
MISSISSIPPI
ILLINOIS
NORTHDAKOTA
SOUTHDAKOTA
MINNESOTA
WISCONSIN
IOWA
NEBRASKA
MICHIGAN
MICHIGAN
INDIANA
OHIO
WEST
VIRGINIA
PENNSYLVANIA
NEWYORK
VIRGINIA
DC
KENTUCKY
VTNH
MAINE
RI
MASS
CONN
NEW
JERSEY
DELAWARE
MARYLAND
NORTHCAROLINA
TENNESSEE
ALABAMA GEORGIA
SOUTH
CAROLINA
FLORIDA
HAWAII
ALASKA
0 600 Miles0 200 Miles
California
New York
Illinois
Ohio
Pennsylvania
Texas

The Americans and the Japanese decided to engage in a competitive boat race.
Both teams practiced hard and long to reach their peak performance.
On the big day they felt they were ready
The Japanese won by a mile.
Afterwards the American team was discouraged by the loss. Morale sagged.
Corporate management decided that the reason for the crushing defeat had to be found, so a consulting firm was hired to investigate the problem and recommend corrective action

The consultants finding:
The Japanese team had eight people rowing and one person steering;
the American team had one person rowing and eight people steering..
After a year of study and millions spent analyzing the problem,
the consultant firm concluded that too many people were steering and not enough were rowing on the American team
So as race day neared again the following year, the American team’s management structure was completely reorganized.

Four steering managers, three area steering managers, and a new performance review system for the person rowing the boat to provide work incentive.
The next year, the Japanese won by TWO miles
The new structure:
Humiliated, the American corporation laid off the rower for poor performance and gave the managers a bonus for discovering the problem.

What has the US done to regain a competitive edge?
Customer focus
Cost savings through site selection
New manufacturing techniques
Reliance on the Internet
Total Quality Management ISO 9000/ISO 140000

Using land, labor, capital, entrepreneurship, knowledge to produce goods and services.
Transforms resources into goods and services.
inventory management
quality control follow-up services
production scheduling

The Production & Operations Process
Inputs Conversion Process Output
Manufacturing
Service
UB’s Dry Cleaners
1. Facility location
a. Near resources b. Near markets
2. Facility layout
a. For services: customer friendly b. For manufacturing - customer focused work cells - away from assembly lines c. Outsourcing
3. Quality Control
a. Measurement of products and services against set requirements
b. Often at the end of the line c. Now quality becomes everyone’s
concern

Quality Control Standards
Six Sigma () Quality (3.4)
Statistical Quality Control (SQC)
Statistical Process Control (SPC)
Deming Cycle (Plan, Do, Check, Act) (Eliminate mistakes)
Quality Function Deployment (QFD) (maximize customer satisfaction)
Baldridge Award
ISO 9000/14000/9001:2002

1. Baldridge Awards: quality in
a. leadership b. Strategic planning c. Customer and market focus d. Information and analysis e. Human resource focus f. Process management g. Business results

2. ISO 9000 - Sets global measures for the quality of
individual products - Provides a common denominator of business
quality accepted around the world
3. ISO 14000
- Concerns managing an organization’s environmental impact
- Requires targets, policies and reviews of environmental programs
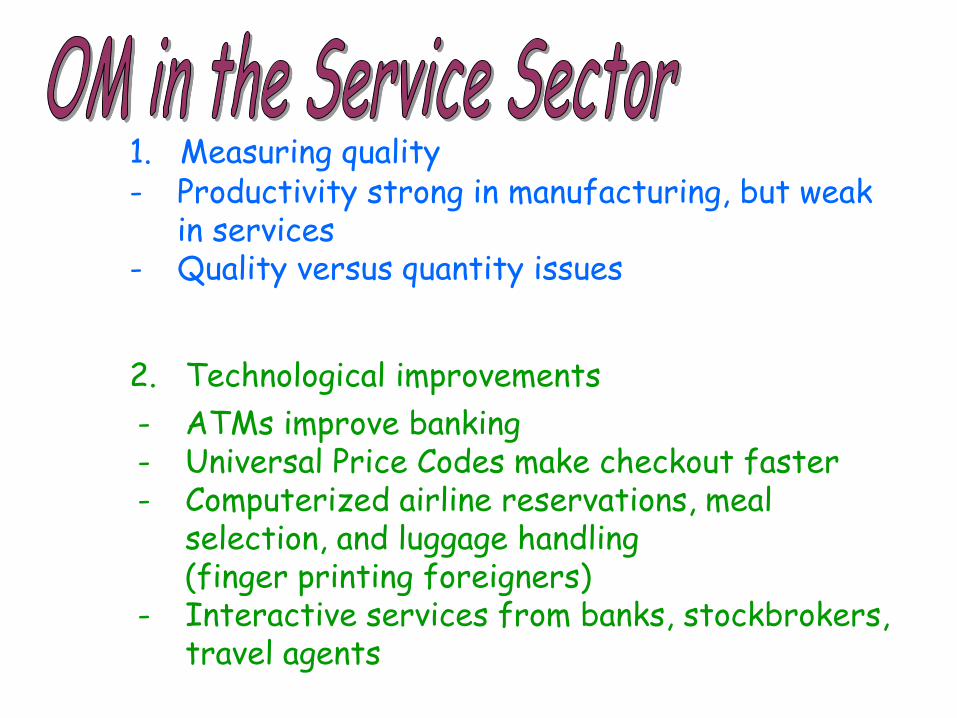
1. Measuring quality - Productivity strong in manufacturing, but weak
in services - Quality versus quantity issues
2. Technological improvements
- ATMs improve banking - Universal Price Codes make checkout faster - Computerized airline reservations, meal
selection, and luggage handling (finger printing foreigners) - Interactive services from banks, stockbrokers,
travel agents

1. Form Utility - the value added by the creation of finished
goods and services
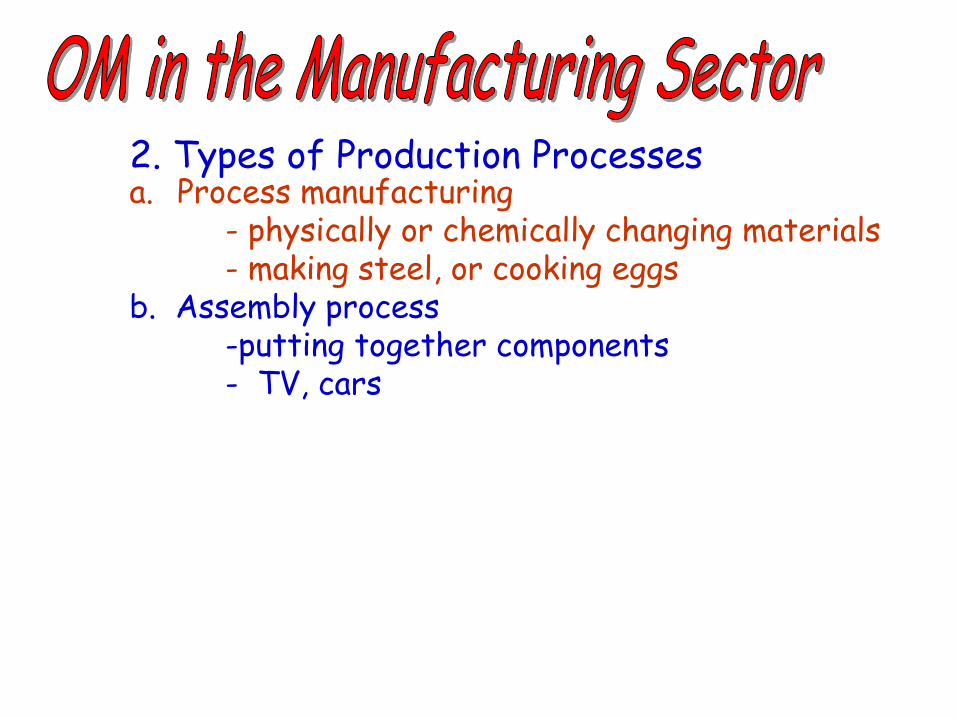
2. Types of Production Processes a. Process manufacturing - physically or chemically changing materials - making steel, or cooking eggs b. Assembly process -putting together components - TV, cars
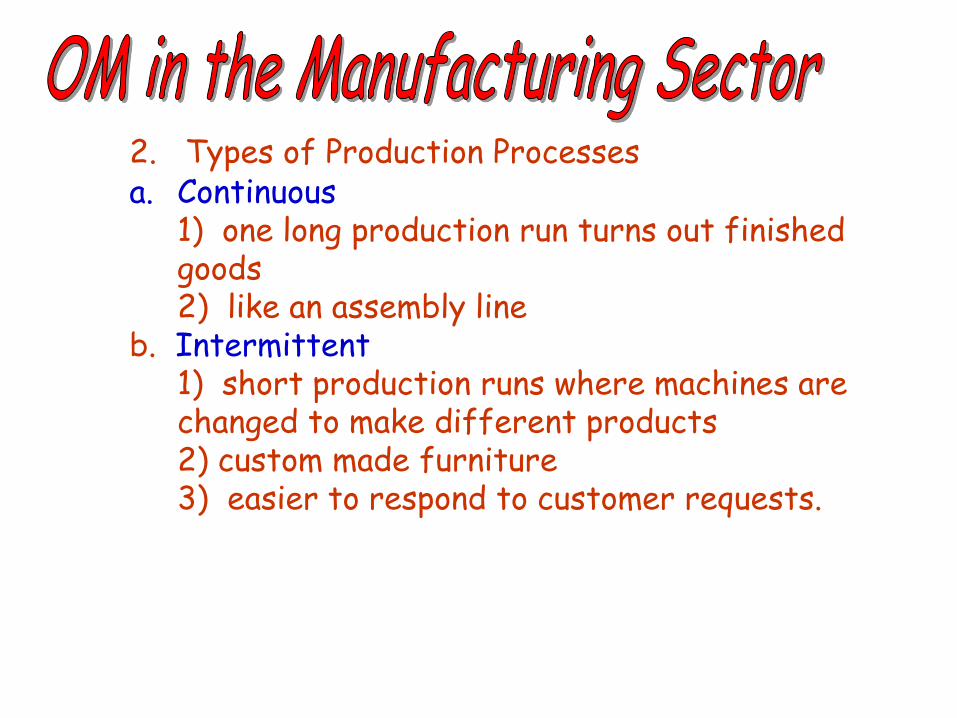
2. Types of Production Processes a. Continuous 1) one long production run turns out finished
goods 2) like an assembly line b. Intermittent 1) short production runs where machines are
changed to make different products 2) custom made furniture 3) easier to respond to customer requests.

1. Materials Requirement Planning (MRP) a. Uses sales forecasts to make sure required
parts are available when needed b. Now outdated
2. MRPII – Manufacturing resource planning a. involved more than just materials b. also has been updated 3. ERP Enterprise resource planning
a. Links multiple firms. b. Monitors quality and satisfaction as it’s
happening. c. IT has had a major influence

Modern Production Techniques
Just-In-Time (JIT) Inventory
Purchasing
Flexible Manufacturing
Lean Manufacturing
Mass Customizing
Competing in Time
Technology Assisted Computer-Aided
Design (CAD)
Computer-Aided Manufacturing (CAM)

1. Just in time inventory control (JIT) a. Parts and supplies are delivered just
as needed in the production process b. Avoids storage charges and damages
2. Internet purchasing a. Reduces purchasing costs b. 3 types 1) trading exchange platforms - assist companies in several markets 2) industry-sponsored exchanges 3) Net market makers -host electronic marketplaces

3. Flexible Manufacturing a. Designing machines to do multiple tasks b. Ford makes both V-8 and V-6 engines
4. Lean Manufacturing a. Increasing capacity to produce high-quality
goods while decreasing need for resources b. Workers perform a cluster of tasks, not one
assembly line job.
5. Mass customization - Flexible machines can produce a good as fast
as mass-produced goods once could.

6. Competing in Time a. Being as fast or faster than all
competition in responding to customer want and needs
b. Essential in global marketplace
7. CAD and CAM a. CAD – 3D designing b. CAM – direct computer involvement in
production process c. CIM Computer Integrated Manufacturing 1) software that unites CAD and CAM 2) currently expensive 3) cuts 80% of the time needed to
program machines to make parts
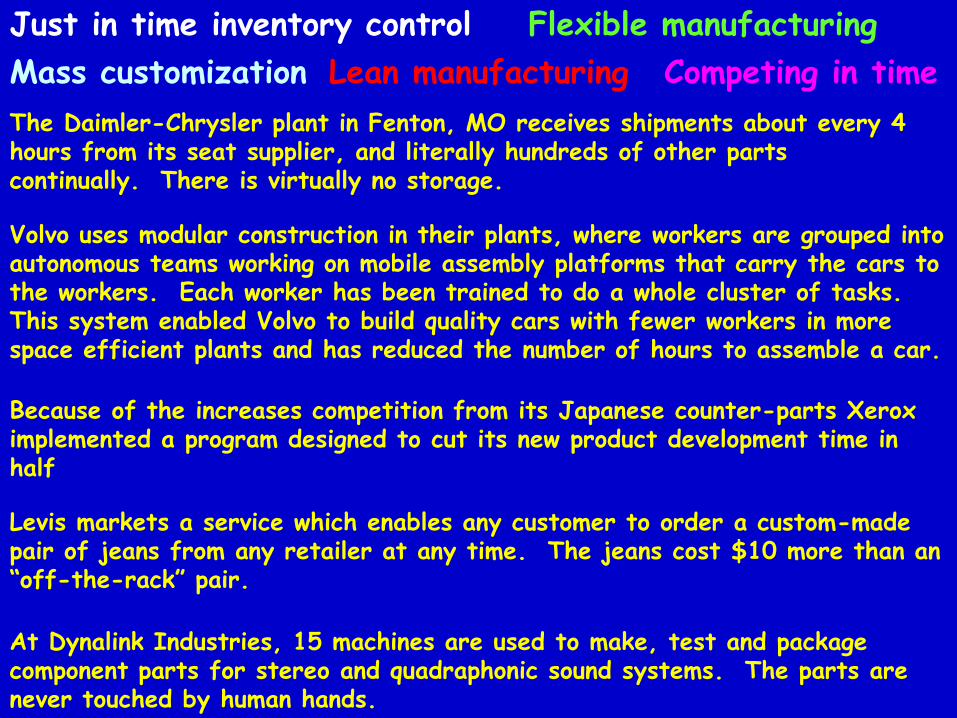
Just in time inventory control
Mass customization Competing in time
Flexible manufacturing
Lean manufacturing
The Daimler-Chrysler plant in Fenton, MO receives shipments about every 4 hours from its seat supplier, and literally hundreds of other parts continually. There is virtually no storage.
Volvo uses modular construction in their plants, where workers are grouped into autonomous teams working on mobile assembly platforms that carry the cars to the workers. Each worker has been trained to do a whole cluster of tasks. This system enabled Volvo to build quality cars with fewer workers in more space efficient plants and has reduced the number of hours to assemble a car.
Because of the increases competition from its Japanese counter-parts Xerox implemented a program designed to cut its new product development time in half
Levis markets a service which enables any customer to order a custom-made pair of jeans from any retailer at any time. The jeans cost $10 more than an “off-the-rack” pair.
At Dynalink Industries, 15 machines are used to make, test and package component parts for stereo and quadraphonic sound systems. The parts are never touched by human hands.

Control Procedures
Program Evaluation & Review Techniques (PERT)
Critical Path Method (CPM)
Gantt Chart

Program Evaluation & Review Techniques (PERT)
Designing a PERT Chart
1. Analyze and sequence task that need to be done
2. Estimate the time needed to complete each task
3. Draw a PERT network illustrating the two previous steps
4. Identify the critical path - the sequence that takes the longest
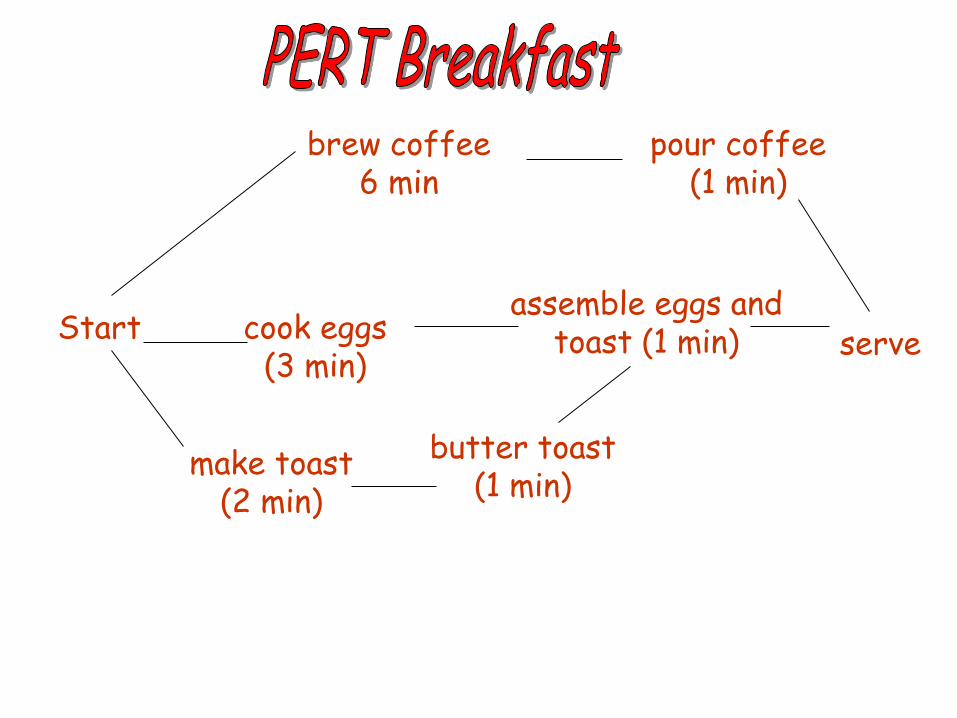
Start Start
make toast (2 min)
butter toast (1 min)
cook eggs (3 min)
assemble eggs and toast (1 min)
brew coffee 6 min
pour coffee (1 min)
serve