
OPERATIONS IN MALAYSIA STATUTORY FINANCIAL … · STATUTORY DECLARATION 1 ... and by virtue of the...
40
OPERATIONS IN MALAYSIA STATUTORY FINANCIAL STATEMENTS 31 DECEMBER 2004
Transcript of OPERATIONS IN MALAYSIA STATUTORY FINANCIAL … · STATUTORY DECLARATION 1 ... and by virtue of the...

OPERATIONS IN MALAYSIA
STATUTORY FINANCIAL STATEMENTS
31 DECEMBER 2004

STATUTORY DECLARATION 1
STATEMENT OF CORPORATE GOVERNANCE 2 - 3
AUDITORS’ REPORT 4
STATEMENT OF ASSETS AND LIABILITIES 5
INCOME STATEMENT 6
GENERAL INSURANCE REVENUE ACCOUNT 7 - 8
CASH FLOW STATEMENT 9 - 10
NOTES TO THE FINANCIAL STATEMENTS 11 - 38
CONTENTS
STATUTORY DECLARATION PURSUANT TO SECTION 336(6)OF THE COMPANIES ACT, 1965
I, William Michael Rigby, the officer primarily responsible for the financial management of the operations in Malaysiaof American Home Assurance Company, do solemnly and sincerely declare that the financial statements for the financialyear ended 31 December 2004 set out on pages 5 to 38 are, in my opinion, correct and I make this solemn declarationconscientiously believing the same to be true, and by virtue of the provisions of the Statutory Declarations Act, 1960.
WILLIAM MICHAEL RIGBY
Subscribed and solemnly declared by the abovenamed William Michael Rigby at Kuala Lumpur on 28 March 2005.
Before me:
T. THANDONEE RAJAGOPAL (No. W228)COMMISSIONER FOR OATHS
Kuala Lumpur
1
FINANCIAL STATEMENTS

STATEMENT OF CORPORATE GOVERNANCE
The Management of the operations in Malaysia of American Home Assurance Company has pleasure in submitting thestatement of Corporate Governance for the financial year ended 31 December 2004.
This Statement of Corporate Governance relates only to the activities of the Malaysian Branch of American HomeAssurance Company.
MANAGEMENT ACCOUNTABILITY
The Management has a documented and well-communicated organisational structure that clearly shows lines ofreporting responsibility and authority. Individual’s duties and responsibilities are documented in job descriptions. Anti-Money Laundering measures are diligently practised. Disclosure of conflicts of interest is required to be made once ayear for all senior management under the American International Group (“AIG”) Code of Conduct.
Proper communication channels have been put in place to ensure priority information is being communicated to theright personnel. Operational manuals which document policies and procedures, internal controls and risk managementare constantly reviewed and updated. These manuals and updates are circulated to all staff concerned. Our Statementof Corporate Governance is overtly reflected on policies issued.
A formal process is in place and being practised for the development of individual goals. Staff performance appraisalsare done annually with half yearly reviews to ensure all goals are on track and not in conflict with the AIG corporateobjectives.
CORPORATE INDEPENDENCE
The Management ensures compliance with JPI/GPI 19 in respect of Bank Negara Malaysia ("BNM") guidelines onRelated-Party Transactions.
INTERNAL CONTROLS AND OPERATIONAL RISK MANAGEMENT
An established and effective internal control and risk management system has been put in place to enable therecognition and continued assessment of material risks that could affect the Corporation’s performance and financialcondition. This system is constantly being reviewed to enhance its effectiveness.
A dedicated Internal Audit team is available to carry out independent examination of the operations. The team reportsto the Audit Committee based in New York.
2
FINANCIAL STATEMENTS

STATEMENT OF CORPORATE GOVERNANCE (CONTINUED)
PUBLIC ACCOUNTABILITY
The Management maintains a practice of professionalism in its business conduct. The policyholder’s rights andinterests are paramount in all consideration and decisions.
FINANCIAL REPORTING
The Management ensures that books and records for the preparation of financial statements are properly maintainedin accordance with approved accounting standards. Key financial information is made available to the public inaccordance with the provision of Section 95(1) of the Insurance Act, 1996. Regular statutory reporting which isprepared with due care and diligence has been made as required by BNM.
BY THE MANAGEMENT OF AMERICAN HOME ASSURANCE COMPANY, OPERATIONS IN MALAYSIA
WILLIAM MICHAEL RIGBY28 March 2005
3
FINANCIAL STATEMENTS

AUDITORS’ REPORT ON THE FINANCIAL STATEMENTS OFTHE CORPORATION’S OPERATIONS IN MALAYSIAPURSUANT TO SECTION 336 OF THE COMPANIES ACT, 1965
We have audited the financial statements set out on pages 5 to 38 of the operations in Malaysia of American HomeAssurance Company. These financial statements are the responsibility of the Corporation’s directors. It is ourresponsibility to form an independent opinion, based on our audit, on these financial statements and to report ouropinion to you, in accordance with Section 174 of the Companies Act, 1965 and for no other purpose. We do notassume responsibility to any other person for the content of this report.
We conducted our audit in accordance with approved auditing standards in Malaysia. Those standards require that weplan and perform the audit to obtain reasonable assurance about whether the financial statements are free of materialmisstatement. An audit includes examining, on a test basis, evidence supporting the amounts and disclosures in thefinancial statements. An audit also includes assessing the accounting principles used and significant estimates madeby the directors, as well as evaluating the overall financial statement presentation. We believe that our audit provides areasonable basis for our opinion.
In our opinion:
(a) the financial statements have been prepared in accordance with the provisions of the Companies Act, 1965 andMASB approved accounting standards in Malaysia so as to give a true and fair view of:
(i) the matters required by Section 169 of the Companies Act, 1965 to be dealt with in the financial statements; and
(ii) the state of affairs of the Corporation’s operations in Malaysia as at 31 December 2004 and of the results andcash flows of the Corporation’s operations in Malaysia for the financial year ended on that date;
and
(b) the accounting and other records required by the Act to be kept by the Corporation’s operations in Malaysia havebeen properly kept in accordance with the provisions of the Act.
PRICEWATERHOUSECOOPERS DATO’ AHMAD JOHAN BIN MOHAMMAD RASLAN(No. AF: 1146) (No. 1867/09/06 (J))Chartered Accountants Partner of the firm
Kuala Lumpur28 March 2005
4
FINANCIAL STATEMENTS
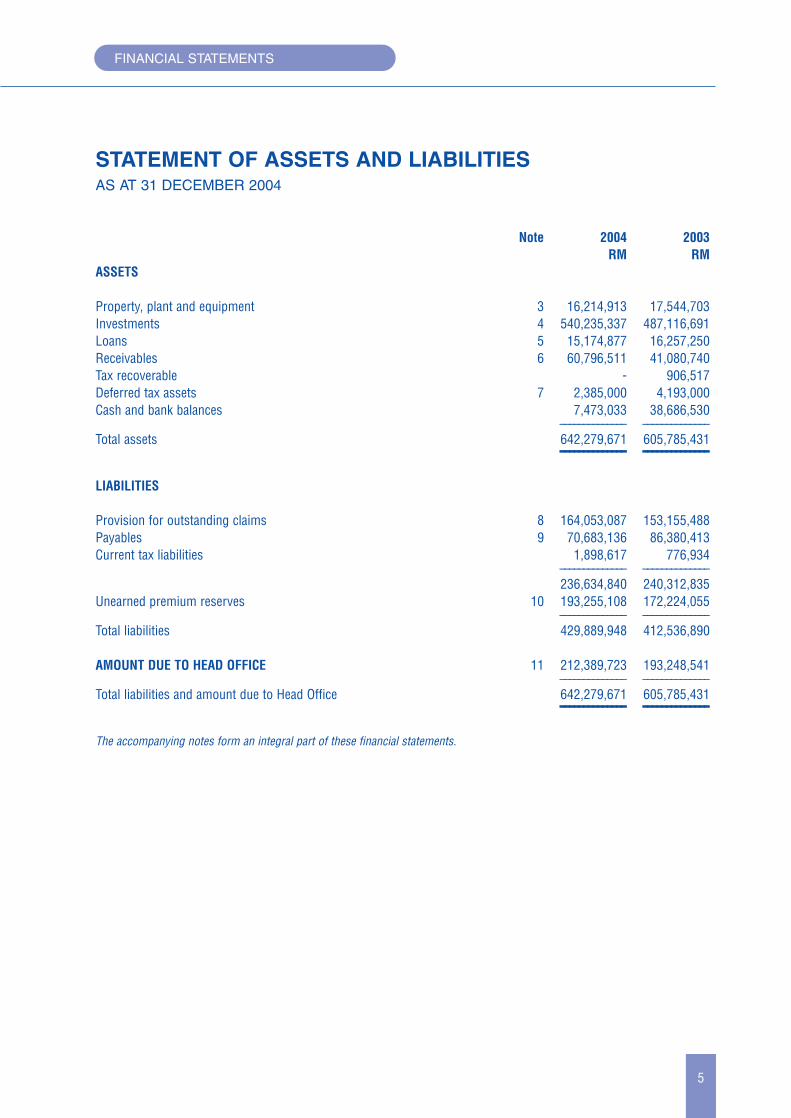
STATEMENT OF ASSETS AND LIABILITIES AS AT 31 DECEMBER 2004
Note 2004 2003RM RM
ASSETS
Property, plant and equipment 3 16,214,913 17,544,703Investments 4 540,235,337 487,116,691Loans 5 15,174,877 16,257,250Receivables 6 60,796,511 41,080,740Tax recoverable - 906,517Deferred tax assets 7 2,385,000 4,193,000Cash and bank balances 7,473,033 38,686,530
–––––––––––––– ––––––––––––––Total assets 642,279,671 605,785,431–––––––––––––– ––––––––––––––LIABILITIES
Provision for outstanding claims 8 164,053,087 153,155,488Payables 9 70,683,136 86,380,413Current tax liabilities 1,898,617 776,934
–––––––––––––– ––––––––––––––236,634,840 240,312,835
Unearned premium reserves 10 193,255,108 172,224,055–––––––––––––– ––––––––––––––
Total liabilities 429,889,948 412,536,890
AMOUNT DUE TO HEAD OFFICE 11 212,389,723 193,248,541–––––––––––––– ––––––––––––––
Total liabilities and amount due to Head Office 642,279,671 605,785,431–––––––––––––– ––––––––––––––The accompanying notes form an integral part of these financial statements.
5
FINANCIAL STATEMENTS
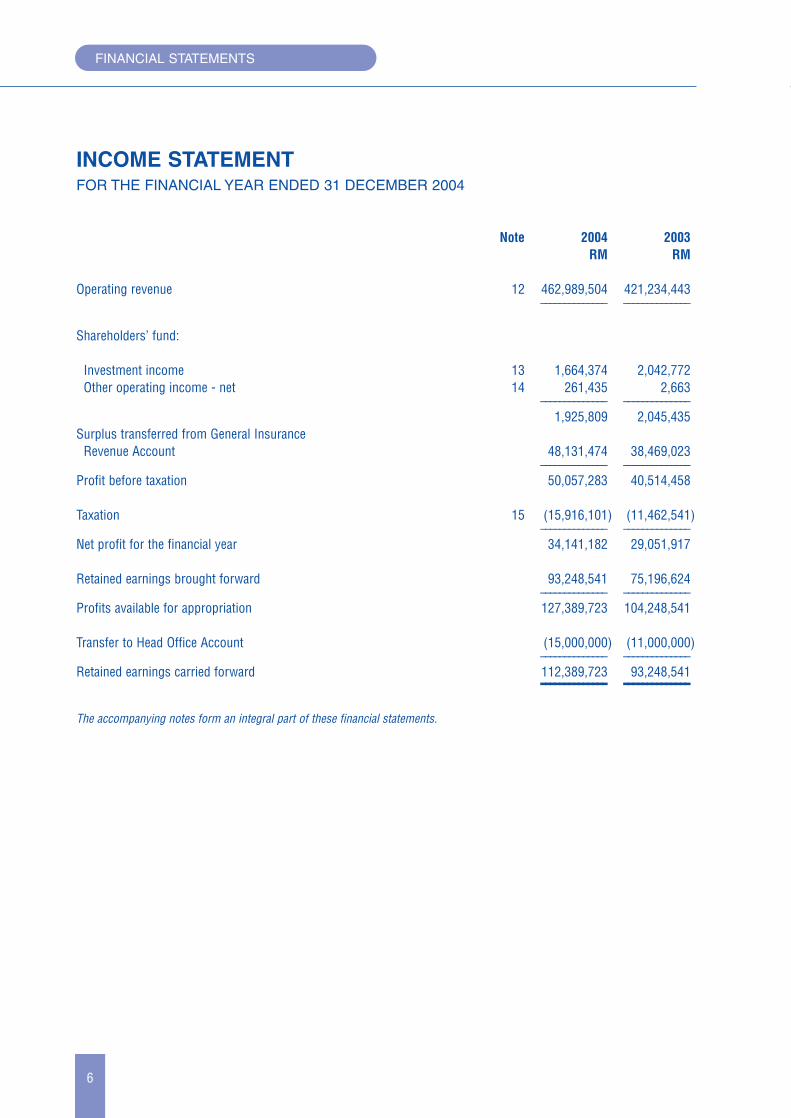
INCOME STATEMENTFOR THE FINANCIAL YEAR ENDED 31 DECEMBER 2004
Note 2004 2003RM RM
Operating revenue 12 462,989,504 421,234,443–––––––––––––– ––––––––––––––
Shareholders’ fund:
Investment income 13 1,664,374 2,042,772Other operating income - net 14 261,435 2,663
–––––––––––––– ––––––––––––––1,925,809 2,045,435
Surplus transferred from General InsuranceRevenue Account 48,131,474 38,469,023
–––––––––––––– ––––––––––––––Profit before taxation 50,057,283 40,514,458
Taxation 15 (15,916,101) (11,462,541)–––––––––––––– ––––––––––––––
Net profit for the financial year 34,141,182 29,051,917
Retained earnings brought forward 93,248,541 75,196,624–––––––––––––– ––––––––––––––
Profits available for appropriation 127,389,723 104,248,541
Transfer to Head Office Account (15,000,000) (11,000,000)–––––––––––––– ––––––––––––––
Retained earnings carried forward 112,389,723 93,248,541–––––––––––––– ––––––––––––––The accompanying notes form an integral part of these financial statements.
6
FINANCIAL STATEMENTS

GENERAL INSURANCE REVENUE ACCOUNTFOR THE FINANCIAL YEAR ENDED 31 DECEMBER 2004
Marine,aviation
Note Fire Motor and transit Miscellaneous TotalRM RM RM RM RM
Gross premium 132,120,313 153,779,117 8,783,757 146,446,734 441,129,921Reinsurance (92,765,510) (13,560,149) (4,965,859) (57,734,212) (169,025,730)
–––––––––––––– –––––––––––––– –––––––––––––– –––––––––––––– ––––––––––––––Net premium 39,354,803 140,218,968 3,817,898 88,712,522 272,104,191
(Increase)/decrease in unearned premiumreserves 10 (40,461,984) (4,933,032) 361,688 24,002,275 (21,031,053)
–––––––––––––– –––––––––––––– –––––––––––––– –––––––––––––– ––––––––––––––Earned premium (1,107,181) 135,285,936 4,179,586 112,714,797 251,073,138
Net claims incurred 16 (14,019,762) (97,804,000) (1,874,798) (36,339,935) (150,038,495)Net commission 7,553,916 (14,751,218) 140,966 (5,795,359) (12,851,695)
–––––––––––––– –––––––––––––– –––––––––––––– –––––––––––––– ––––––––––––––Underwriting (deficit)/
surplus beforemanagement expenses (7,573,027) 22,730,718 2,445,754 70,579,503 88,182,948–––––––––––––– –––––––––––––– –––––––––––––– ––––––––––––––
Management expenses 17 (63,016,420)––––––––––––––
Underwriting surplus 25,166,528
Investment income 13 20,195,209
Other operatingincome - net 14 2,769,737
––––––––––––––Surplus transferred to
Income Statement 48,131,474––––––––––––––The accompanying notes form an integral part of these financial statements.
7
FINANCIAL STATEMENTS

GENERAL INSURANCE REVENUE ACCOUNTFOR THE FINANCIAL YEAR ENDED 31 DECEMBER 2003
Marine,aviation
Note Fire Motor and transit Miscellaneous TotalRM RM RM RM RM
Gross premium 64,669,270 143,938,902 10,328,051 182,604,571 401,540,794Reinsurance (34,103,893) (11,902,831) (6,287,545) (104,098,110) (156,392,379)
–––––––––––––– –––––––––––––– –––––––––––––– –––––––––––––– ––––––––––––––Net premium 30,565,377 132,036,071 4,040,506 78,506,461 245,148,415
Decrease/(increase) in unearned premiumreserves 10 468,819 (480,113) (208,925) (30,722,001) (30,942,220)
–––––––––––––– –––––––––––––– –––––––––––––– –––––––––––––– ––––––––––––––Earned premium 31,034,196 131,555,958 3,831,581 47,784,460 214,206,195
Net claims incurred 16 (8,992,267) (88,840,183) (1,748,122) (27,458,418) (127,038,990)Net commission (690,704) (13,692,980) 313,616 2,550,402 (11,519,666)
–––––––––––––– –––––––––––––– –––––––––––––– –––––––––––––– ––––––––––––––Underwriting surplus
before managementexpenses 21,351,225 29,022,795 2,397,075 22,876,444 75,647,539–––––––––––––– –––––––––––––– –––––––––––––– ––––––––––––––
Management expenses 17 (55,887,200)––––––––––––––
Underwriting surplus 19,760,339
Investment income 13 17,650,877
Other operatingincome - net 14 1,057,807
––––––––––––––Surplus transferred to
Income Statement 38,469,023––––––––––––––The accompanying notes form an integral part of these financial statements.
8
FINANCIAL STATEMENTS
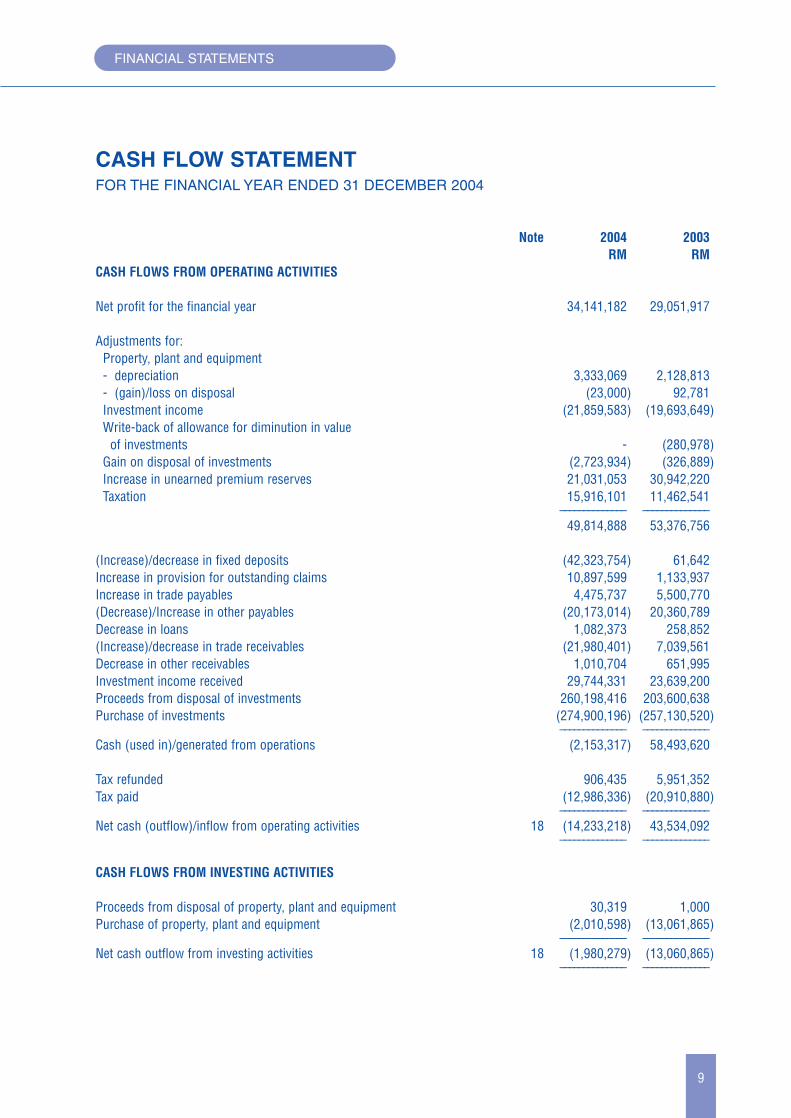
CASH FLOW STATEMENTFOR THE FINANCIAL YEAR ENDED 31 DECEMBER 2004
Note 2004 2003RM RM
CASH FLOWS FROM OPERATING ACTIVITIES
Net profit for the financial year 34,141,182 29,051,917
Adjustments for:Property, plant and equipment- depreciation 3,333,069 2,128,813- (gain)/loss on disposal (23,000) 92,781Investment income (21,859,583) (19,693,649)Write-back of allowance for diminution in value
of investments - (280,978)Gain on disposal of investments (2,723,934) (326,889)Increase in unearned premium reserves 21,031,053 30,942,220Taxation 15,916,101 11,462,541
–––––––––––––– ––––––––––––––49,814,888 53,376,756
(Increase)/decrease in fixed deposits (42,323,754) 61,642Increase in provision for outstanding claims 10,897,599 1,133,937Increase in trade payables 4,475,737 5,500,770(Decrease)/Increase in other payables (20,173,014) 20,360,789Decrease in loans 1,082,373 258,852(Increase)/decrease in trade receivables (21,980,401) 7,039,561Decrease in other receivables 1,010,704 651,995Investment income received 29,744,331 23,639,200Proceeds from disposal of investments 260,198,416 203,600,638Purchase of investments (274,900,196) (257,130,520)
–––––––––––––– ––––––––––––––Cash (used in)/generated from operations (2,153,317) 58,493,620
Tax refunded 906,435 5,951,352Tax paid (12,986,336) (20,910,880)
–––––––––––––– ––––––––––––––Net cash (outflow)/inflow from operating activities 18 (14,233,218) 43,534,092
–––––––––––––– ––––––––––––––
CASH FLOWS FROM INVESTING ACTIVITIES
Proceeds from disposal of property, plant and equipment 30,319 1,000Purchase of property, plant and equipment (2,010,598) (13,061,865)
–––––––––––––– ––––––––––––––Net cash outflow from investing activities 18 (1,980,279) (13,060,865)
–––––––––––––– ––––––––––––––
9
FINANCIAL STATEMENTS
CASH FLOW STATEMENTFOR THE FINANCIAL YEAR ENDED 31 DECEMBER 2004 (Continued)
Note 2004 2003RM RM
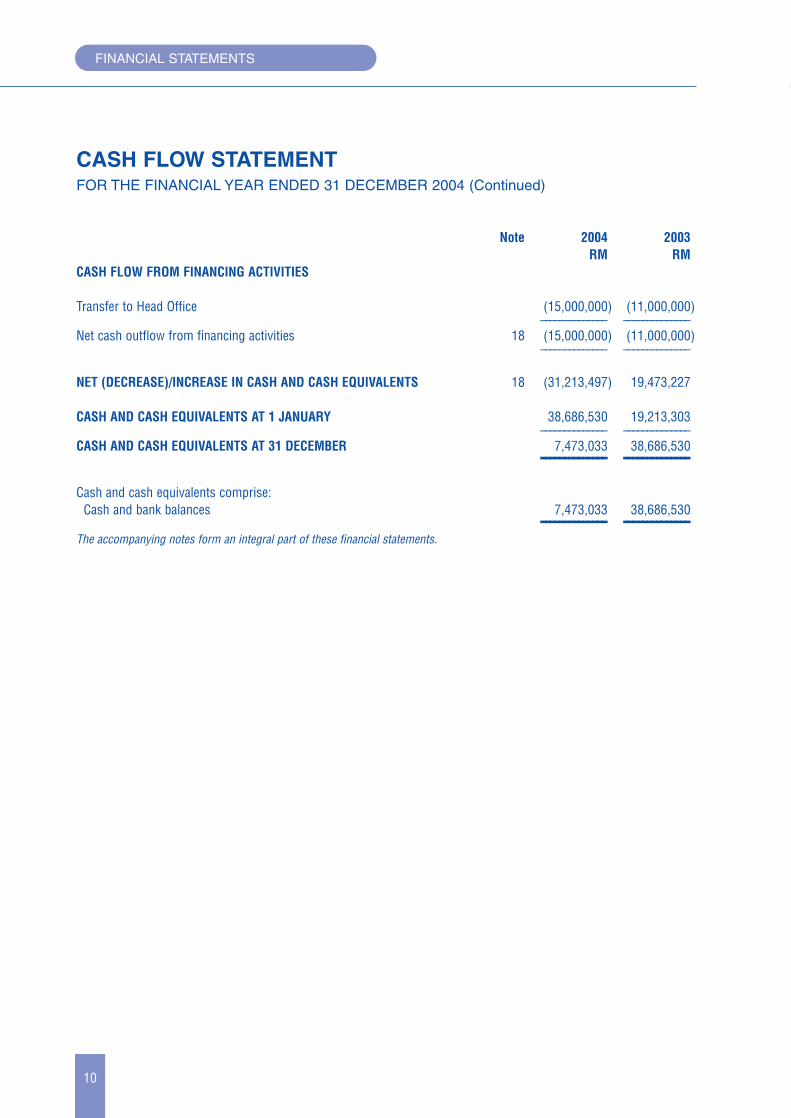
CASH FLOW FROM FINANCING ACTIVITIES
Transfer to Head Office (15,000,000) (11,000,000)–––––––––––––– ––––––––––––––
Net cash outflow from financing activities 18 (15,000,000) (11,000,000)–––––––––––––– ––––––––––––––
NET (DECREASE)/INCREASE IN CASH AND CASH EQUIVALENTS 18 (31,213,497) 19,473,227
CASH AND CASH EQUIVALENTS AT 1 JANUARY 38,686,530 19,213,303–––––––––––––– ––––––––––––––
CASH AND CASH EQUIVALENTS AT 31 DECEMBER 7,473,033 38,686,530–––––––––––––– ––––––––––––––Cash and cash equivalents comprise:
Cash and bank balances 7,473,033 38,686,530–––––––––––––– ––––––––––––––The accompanying notes form an integral part of these financial statements.
10
FINANCIAL STATEMENTS

NOTES TO THE FINANCIAL STATEMENTS - 31 DECEMBER 2004
1 PRINCIPAL ACTIVITY AND GENERAL INFORMATION
The principal activity of the Corporation’s operations in Malaysia ("the Branch") is the underwriting of all classes ofgeneral insurance business. There has been no significant change in the nature of this activity during the financialyear.
The number of employees as at the end of the financial year in the Branch was 597 (2003: 556).
The ultimate holding corporation of American Home Assurance Company is American International Group, Inc., acorporation incorporated in the United States of America.
The address of the registered office and principal place of business of the Branch is Wisma AIG, No 99, JalanAmpang, 50450 Kuala Lumpur.
The financial statements were authorised for issue on 28 March 2005.
2 SIGNIFICANT ACCOUNTING POLICIES
The following accounting policies have been used consistently in dealing with items which are considered materialin relation to the financial statements.
(a) Basis of preparation
The financial statements of the Branch have been prepared under the historical cost convention and comply withMASB approved accounting standards in Malaysia, the provisions of the Companies Act, 1965, the InsuranceAct, 1996 and relevant Guidelines and Circulars issued by Bank Negara Malaysia (“BNM”) in all material aspects.
The preparation of financial statements in conformity with the provisions of the Companies Act, 1965 and MASBapproved accounting standards in Malaysia requires the use of estimates and assumptions that affect thereported amounts of assets and liabilities and disclosure of contingent assets and liabilities at the date of thefinancial statements, and the reported amounts of revenues and expenses during the reported financial year.Although these estimates are based on the Management’s best knowledge of current events and actions, actualresults may differ from estimates.
11
FINANCIAL STATEMENTS

NOTES TO THE FINANCIAL STATEMENTS (CONTINUED)
(b) Property, plant and equipment
Property, plant and equipment are stated at cost or valuation less accumulated depreciation and accumulatedimpairment losses.
Depreciation of property, plant and equipment is provided on a straight line basis calculated to write off the costof each asset over the estimated useful lives of the assets concerned. The annual rates used are:
Furniture and equipment 10% - 20%Computer equipment 10% - 20%Motor vehicles 20%Renovation 5% - 20%
At each financial year end, the Branch assesses whether there is any indication of impairment. If suchindications exist, an analysis is performed to assess whether the carrying amount of the asset is fullyrecoverable. A write down is made if the carrying amount exceeds the recoverable amount. See accountingpolicy Note 2(g) on impairment of assets.
Gains and losses on disposals are determined by comparing proceeds with carrying amounts and are creditedor charged to the revenue account and/or income statement.
Repairs and maintenance are charged to the revenue account and/or income statement during the financial yearin which they are incurred. The cost of major renovations is included in the carrying amount of the asset whenit is probable that future economic benefits in excess of the originally assessed standard of performance of theexisting asset will flow to the Branch. Major renovations are depreciated over the remaining useful life of therelated assets.
(c) Foreign currencies
Foreign currency transactions in the Branch are accounted for at the exchange rates prevailing at the transactiondates. Foreign currency monetary assets and liabilities are translated at the exchange rates prevailing at the dateof the statement of assets and liabilities. Exchange differences arising from the settlement of foreign currencytransactions and from the translation of foreign currency monetary assets and liabilities are included in theincome statement and/or revenue account.
The principal closing rates used in the translation of foreign currency amounts as at the financial year end areas follows:
Foreign currency 2004 2003United States Dollar 3.800 3.800Singapore Dollar 2.246 2.230Hong Kong Dollar 0.494 0.489
12
FINANCIAL STATEMENTS

NOTES TO THE FINANCIAL STATEMENTS (CONTINUED)
(d) Investments
Malaysian Government Securities, Cagamas papers and other unquoted approved debt securities as specifiedby BNM which are intended to be held to maturity, are stated at cost, adjusted for the amortisation of premiumsor accretion of discounts, calculated on a constant yield basis, from the date of purchase to maturity date. Theamortisation of premiums and accretion of discounts are recognised in the revenue account and/or incomestatement.
Quoted investments are stated at the lower of cost and market value determined on an aggregate portfolio basisby each category of investments, except that where diminution in value of a particular investment is notregarded as temporary, specific allowance is made against the value of that investment. Market value isdetermined by reference to the stock exchange closing price at the date of the statement of assets and liabilities.
Unquoted investments are stated at cost and an allowance for diminution in value is made where, in the opinionof the Management, there is a decline other than temporary in the value of such investments. Where there hasbeen a decline other than temporary in the value of an investment, such a decline is recognised as an expensein the financial year in which the decline is identified.
(e) Employee benefits
(i) Short-term employees benefits
Wages, salaries, paid annual leave and sick leave, bonuses and non-monetary benefits are accrued in thefinancial year in which the associated services are rendered by employees of the Branch.
(ii) Post-employment benefits
The Branch’s contributions to the Employees’ Provident Fund, the national defined contribution plan, arecharged to the income statement and/or revenue account in the financial year to which they relate. Once thecontributions have been paid, the Branch has no further payment obligations.
(f) Trade receivables
Trade receivables are carried at invoiced amount less an allowance made for doubtful debts.
Known bad debts are written off and specific allowance is made for any premiums including agents’ balancesor reinsurance balances which remain outstanding for more than six months from the date on which theybecome receivable and for all debts which are considered doubtful.
13
FINANCIAL STATEMENTS

NOTES TO THE FINANCIAL STATEMENTS (CONTINUED)
(g) Impairment of assets
The carrying values of assets are reviewed for impairment when there is an indication that the assets might beimpaired. Impairment is measured by comparing the carrying values of the assets with their recoverableamounts. The recoverable amount is the higher of the net realisable value and the value in use, which ismeasured by reference to discounted cash flows. Recoverable amounts are estimated for individual assets, or,if it is not possible, for the cash-generating unit.
An impairment loss is charged to the revenue account and/or income statement immediately.
A subsequent increase in the recoverable amount of an asset is treated as reversal of the previous impairmentloss and is recognised to the extent of the carrying amount of the asset that would have been determined (netof amortisation and depreciation) had no impairment loss been recognised. The reversal is recognised in therevenue account and/or income statement immediately.
(h) Operating leases
Leases of assets where a significant portion of the risks and rewards of ownership are retained by the lessor areclassified as operating leases. Payments made under operating leases are charged to the income statement andrevenue account on a straight line basis over the lease period.
When an operating lease is terminated before the lease period has expired, any payment required to be made tothe lessor by way of penalty is recognised as an expense in the financial year in which termination takes place.
(i) General insurance underwriting results
The general insurance underwriting results are determined for each class of business after taking into accountreinsurances, commissions, unearned premiums and claims incurred.
Premium income
Premium income is recognised in a financial year in respect of risks assumed during that particular financialyear. Premiums from direct business are recognised during the financial year upon the issuance of premiumdebit notes. Premiums in respect of risks incepted for which debit notes have not been issued as of the date ofthe statement of assets and liabilities are accrued at the date.
Inward treaty reinsurance premiums are recognised on the basis of periodic advices received from cedinginsurers.
Outward reinsurance premiums are recognised in the same accounting period as the original policy to which thereinsurance relates.
14
FINANCIAL STATEMENTS
NOTES TO THE FINANCIAL STATEMENTS (CONTINUED)
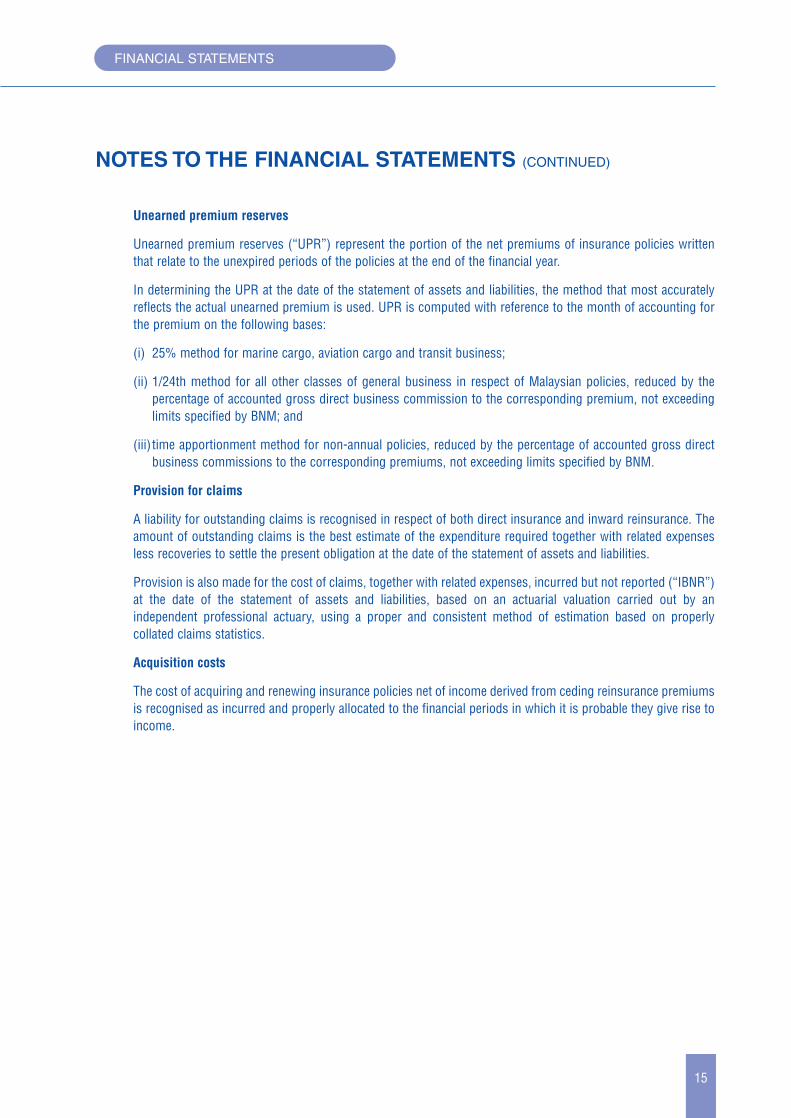
Unearned premium reserves
Unearned premium reserves (“UPR”) represent the portion of the net premiums of insurance policies writtenthat relate to the unexpired periods of the policies at the end of the financial year.
In determining the UPR at the date of the statement of assets and liabilities, the method that most accuratelyreflects the actual unearned premium is used. UPR is computed with reference to the month of accounting forthe premium on the following bases:
(i) 25% method for marine cargo, aviation cargo and transit business;
(ii) 1/24th method for all other classes of general business in respect of Malaysian policies, reduced by thepercentage of accounted gross direct business commission to the corresponding premium, not exceedinglimits specified by BNM; and
(iii) time apportionment method for non-annual policies, reduced by the percentage of accounted gross directbusiness commissions to the corresponding premiums, not exceeding limits specified by BNM.
Provision for claims
A liability for outstanding claims is recognised in respect of both direct insurance and inward reinsurance. Theamount of outstanding claims is the best estimate of the expenditure required together with related expensesless recoveries to settle the present obligation at the date of the statement of assets and liabilities.
Provision is also made for the cost of claims, together with related expenses, incurred but not reported (“IBNR”)at the date of the statement of assets and liabilities, based on an actuarial valuation carried out by anindependent professional actuary, using a proper and consistent method of estimation based on properlycollated claims statistics.
Acquisition costs
The cost of acquiring and renewing insurance policies net of income derived from ceding reinsurance premiumsis recognised as incurred and properly allocated to the financial periods in which it is probable they give rise toincome.
15
FINANCIAL STATEMENTS

NOTES TO THE FINANCIAL STATEMENTS (CONTINUED)
(j) Other revenue recognition
Interest income on loans is recognised on an accrual basis except where a loan is considered non-performing,i.e. where repayments are in arrears for more than six months, in which case recognition of such interest issuspended. Subsequent to suspension, interest is recognised on the receipt basis until all arrears have beenpaid.
Other interest income, including the amount of amortisation of premiums and accretion of discounts, isrecognised on a time proportion basis that takes into account the effective yield of the asset.
Dividend income is recognised when the right to receive payment is established.
Gains or losses arising on disposal of investments are credited or charged to the revenue account and/or incomestatement.
(k) Income taxes
Current tax expense is determined according to the tax laws of the jurisdiction in which the Branch operates andincludes all taxes based upon the taxable profits.
Deferred tax is recognised in full, using the liability method, on temporary differences arising between theamounts attributed to assets and liabilities for tax purpose and their carrying amounts in the financialstatements.
Deferred tax assets are recognised to the extent that it is probable that taxable profits will be available againstwhich the deductible temporary differences or unused tax losses can be utilised.
Tax rates enacted or substantively enacted by the statement of assets and liabilities date are used to determinedeferred tax.
(l) Contingent liabilities and contingent assets
The Branch does not recognise a contingent liability but discloses its existence in the financial statements. Acontingent liability is a possible obligation that arises from past events whose existence will be confirmed byuncertain future events beyond the control of the Branch or a present obligation that is not recognised becauseit is not probable that an outflow of resources will be required to settle the obligation. A contingent liability alsoarises in the extremely rare case where there is a liability that cannot be recognised because it cannot bemeasured reliably.
A contingent asset is a possible asset that arises from past events whose existence will be confirmed byuncertain future events beyond the control of the Branch. The Branch does not recognise contingent assets butdiscloses its existence where inflows of economic benefits are probable, but not virtually certain.
(m) Provisions
Provisions are recognised when the Branch has a present legal or constructive obligation as a result of pastevents, when it is probable that an outflow of resources will be required to settle the obligation, and when areliable estimate of the amount can be made.
16
FINANCIAL STATEMENTS

NOTES TO THE FINANCIAL STATEMENTS (CONTINUED)
(n) Cash and cash equivalents
Cash and cash equivalents consist of cash and bank balances excluding fixed and call deposits, that are readilyconvertible to known amounts of cash and which are subject to an insignificant risk of changes in value.
(o) Financial instruments
Description
A financial instrument is any contract that gives rise to both a financial asset of one enterprise and a financialliability or equity instrument of another enterprise.
A financial asset is any asset that is cash, a contractual right to receive cash or another financial asset fromanother enterprise, a contractual right to exchange financial instruments with another enterprise underconditions that are potentially favourable, or an equity instrument of another enterprise.
A financial liability is any liability that is a contractual obligation to deliver cash or another financial asset toanother enterprise, or to exchange financial instruments with another enterprise under conditions that arepotentially unfavourable.
Recognition method
The particular recognition method adopted for financial instruments recognised on the statement of assets andliabilities date is disclosed in the individual accounting policy note associated with each item.
Fair values
The Branch’s basis of estimation of fair values for financial instruments is as follows:
Component Method of determining fair values
• Malaysian Government Securities • Indicative market prices and Cagamas papers
• Unquoted corporate debt securities • Interest rate yield obtained from comparable quoted investments
• Quoted equity securities • Quoted market prices
• Loans receivable • Discounted future cash flows based on the contracted maturity period. Discount rates are based on currentmarket value
• Other financial assets and liabilities • Carrying values assumed towith a maturity period of less than approximate their fair valuesone year
17
FINANCIAL STATEMENTS

NOTES TO THE FINANCIAL STATEMENTS (CONTINUED)
3 PROPERTY, PLANT AND EQUIPMENT
Furniture and Computer Motorequipment equipment vehicles Renovation Total
RM RM RM RM RMFinancial year ended
31 December 2004Net book value at
1 January 2004 6,041,341 4,624,667 103,000 6,775,695 17,544,703Additions at cost 342,994 1,095,605 - 571,999 2,010,598Disposals - (7,319) - - (7,319)Depreciation charge (794,135) (1,881,554) (63,333) (594,047) (3,333,069)–––––––––––––– –––––––––––––– –––––––––––––– –––––––––––––– ––––––––––––––Net book value at
31 December 2004 5,590,200 3,831,399 39,667 6,753,647 16,214,913–––––––––––––– –––––––––––––– –––––––––––––– –––––––––––––– ––––––––––––––At 31 December 2004Cost 6,634,291 16,141,323 330,000 7,638,493 30,744,107Accumulated depreciation (1,044,091) (12,309,924) (290,333) (884,846) (14,529,194)
–––––––––––––– –––––––––––––– –––––––––––––– –––––––––––––– ––––––––––––––Net book value 5,590,200 3,831,399 39,667 6,753,647 16,214,913–––––––––––––– –––––––––––––– –––––––––––––– –––––––––––––– ––––––––––––––Financial year ended
31 December 2003Net book value at
1 January 2003 385,192 5,640,386 169,000 510,854 6,705,432Additions at cost 5,910,926 604,940 - 6,545,999 13,061,865Disposals (41,915) - - (51,866) (93,781)Depreciation charge (212,862) (1,620,659) (66,000) (229,292) (2,128,813)
–––––––––––––– –––––––––––––– –––––––––––––– –––––––––––––– ––––––––––––––Net book value at
31 December 2003 6,041,341 4,624,667 103,000 6,775,695 17,544,703–––––––––––––– –––––––––––––– –––––––––––––– –––––––––––––– ––––––––––––––At 31 December 2003Cost 6,291,297 15,056,697 330,000 7,066,493 28,744,487Accumulated depreciation (249,956) (10,432,030) (227,000) (290,798) (11,199,784)
–––––––––––––– –––––––––––––– –––––––––––––– –––––––––––––– ––––––––––––––Net book value 6,041,341 4,624,667 103,000 6,775,695 17,544,703–––––––––––––– –––––––––––––– –––––––––––––– –––––––––––––– ––––––––––––––
18
FINANCIAL STATEMENTS

NOTES TO THE FINANCIAL STATEMENTS (CONTINUED)
3 PROPERTY, PLANT AND EQUIPMENT (Continued)
Included in the cost of property, plant and equipment are the following fully depreciated property, plant andequipment which are still in use:
2004 2003RM RM
Furniture and equipment 4,850 -Motor vehicles 160,000 -
–––––––––––––– ––––––––––––––164,850 -–––––––––––––– ––––––––––––––
4 INVESTMENTS
2004 2003Carrying Market Carrying Market
value value value valueRM RM RM RM
Malaysian Government Securities 244,723,077 298,863,178Amortisation of premiums (4,103,242) (7,213,345)
–––––––––––––– ––––––––––––––240,619,835 241,672,000 291,649,833 287,089,800–––––––––––––– –––––––––––––– –––––––––––––– ––––––––––––––
Cagamas papers 70,510,300 19,998,200(Amortisation of premiums)/accretion of discounts (17,922) 441
–––––––––––––– ––––––––––––––70,492,378 70,306,000 19,998,641 19,266,000
–––––––––––––– –––––––––––––– –––––––––––––– ––––––––––––––
Other investments 220,000 220,000–––––––––––––– ––––––––––––––
Quoted:Equity securities of corporations:
Quoted in Malaysia 22,692,963 10,663,786Allowance for diminution in value - -
–––––––––––––– ––––––––––––––22,692,963 25,336,028 10,663,786 12,615,520
–––––––––––––– –––––––––––––– –––––––––––––– ––––––––––––––
19
FINANCIAL STATEMENTS

NOTES TO THE FINANCIAL STATEMENTS (CONTINUED)
4 INVESTMENTS (Continued)
2004 2003Carrying Market Carrying Market
value value value valueRM RM RM RM
Unquoted:Corporate debt securities 81,618,850 81,869,350Amortisation of premiums (1,255,231) (807,707)
–––––––––––––– ––––––––––––––80,363,619 81,061,643
–––––––––––––– ––––––––––––––Fixed deposits with licensed banks 125,846,542 83,522,788
–––––––––––––– ––––––––––––––Total investments 540,235,337 487,116,691–––––––––––––– ––––––––––––––The maturity structure of Malaysian Government Securities, Cagamas papers, corporate debt securities and fixeddeposits above is as follows:
2004 2003Carrying Carrying
value valueRM RM
Investments maturing within 12 months 9,200,000 21,089,610Investments maturing after 12 months 508,122,374 455,143,295
–––––––––––––– ––––––––––––––517,322,374 476,232,905–––––––––––––– ––––––––––––––
5 LOANS
2004 2003RM RM
Unsecured staff loans 6,424,877 7,121,566Bank guaranteed loans 8,750,000 9,135,684
–––––––––––––– ––––––––––––––15,174,877 16,257,250
–––––––––––––– ––––––––––––––
Receivable within 12 months 1,090,777 1,130,510Receivable after 12 months 14,084,100 15,126,740
–––––––––––––– ––––––––––––––15,174,877 16,257,250–––––––––––––– ––––––––––––––
20
FINANCIAL STATEMENTS

NOTES TO THE FINANCIAL STATEMENTS (CONTINUED)
6 RECEIVABLES
2004 2003RM RM
Trade receivablesDue premiums including agents, brokers and
co-insurers balances 45,204,947 27,046,845Due from reinsurers and cedants 15,858,863 15,871,584
–––––––––––––– ––––––––––––––61,063,810 42,918,429
Allowance for doubtful debts (13,393,710) (17,228,730)–––––––––––––– ––––––––––––––
47,670,100 25,689,699–––––––––––––– ––––––––––––––
Other receivablesInterest income due and accrued 6,395,049 7,648,975Assets held under Malaysian Motor Insurance Pool 2,654,222 2,851,504Other receivables, deposits and prepayments 3,386,398 3,630,430Amount due from related corporations 690,742 1,260,132
–––––––––––––– ––––––––––––––13,126,411 15,391,041
–––––––––––––– ––––––––––––––60,796,511 41,080,740–––––––––––––– ––––––––––––––
The amount due from related corporations is unsecured, interest-free and has no fixed terms of repayment.
The currency exposure of the amount due from related corporations is set out below:
2004 2003RM RM
Ringgit Malaysia 98,517 46,914United States Dollar 592,225 1,213,218
–––––––––––––– ––––––––––––––690,742 1,260,132–––––––––––––– ––––––––––––––
21
FINANCIAL STATEMENTS

22
FINANCIAL STATEMENTS
NOTES TO THE FINANCIAL STATEMENTS (CONTINUED)
7 DEFERRED TAX ASSETS
Deferred tax assets and liabilities are offset when there is a legally enforceable right to set off current tax assetsagainst current tax liabilities and when the deferred taxes relate to the same tax authority.
The following amounts, determined after appropriate offsetting, are shown in the statement of assets and liabilities:
2004 2003RM RM
Subject to income tax:Deferred tax assets 2,385,000 4,193,000–––––––––––––– ––––––––––––––
At 1 January 4,193,000 1,987,000(Charged)/credited to income statement/revenue account (Note 15): (1,808,000) 2,206,000
- property, plant and equipment (122,000) 191,000- investments (740,000) 2,405,000- trade and other receivables (865,000) (212,000)- unearned premium reserves (81,000) 42,000- others - (220,000)
–––––––––––––– ––––––––––––––At 31 December 2,385,000 4,193,000–––––––––––––– ––––––––––––––
2004 2003RM RM
Subject to income tax:Deferred tax assets (before offsetting)Investments 1,502,000 2,242,000Trade and other receivables 2,768,000 4,085,000Unearned premium reserves 303,000 384,000
–––––––––––––– ––––––––––––––4,573,000 6,711,000
Offsetting (2,188,000) (2,518,000)–––––––––––––– ––––––––––––––
Deferred tax assets (after offsetting) 2,385,000 4,193,000–––––––––––––– ––––––––––––––Deferred tax liabilities (before offsetting)Property, plant and equipment 1,356,000 1,234,000Trade and other receivables 832,000 1,284,000
–––––––––––––– ––––––––––––––2,188,000 2,518,000
Offsetting (2,188,000) (2,518,000)–––––––––––––– ––––––––––––––
Deferred tax liabilities (after offsetting) - -–––––––––––––– ––––––––––––––

NOTES TO THE FINANCIAL STATEMENTS (CONTINUED)
8 PROVISION FOR OUTSTANDING CLAIMS
2004 2003RM RM
Provision for outstanding claims 246,030,237 240,423,003Recoverable from reinsurers (81,977,150) (87,267,515)
–––––––––––––– ––––––––––––––Net outstanding claims 164,053,087 153,155,488–––––––––––––– ––––––––––––––
9 PAYABLES
2004 2003RM RM
Trade payablesDue to agents, brokers, co-insurers and insureds 24,408,969 21,883,067Due to reinsurers and cedants 40,720,453 46,358,769
–––––––––––––– ––––––––––––––65,129,422 68,241,836
–––––––––––––– ––––––––––––––Other payablesPayroll liabilities 653,816 997,289Duties and other taxes payable 2,229,161 1,240,443Accrual for Insurance Guarantee Scheme Fund levy 991,741 890,000Accrued expenses 879,671 1,948,065Accrued capital expenditure 382,750 12,002,785Other payables 416,575 1,059,995
–––––––––––––– ––––––––––––––5,553,714 18,138,577
–––––––––––––– ––––––––––––––70,683,136 86,380,413–––––––––––––– ––––––––––––––
23
FINANCIAL STATEMENTS

NOTES TO THE FINANCIAL STATEMENTS (CONTINUED)
10 UNEARNED PREMIUM RESERVES
Marine,aviation
Fire Motor and transit Miscellaneous TotalRM RM RM RM RM
2004Short termAt 1 January 2004 22,979,232 62,758,219 2,454,148 84,032,456 172,224,055Increase /(decrease)
in reserves 40,461,984 4,933,032 (361,688) (28,250,410) 16,782,918–––––––––––––– –––––––––––––– –––––––––––––– –––––––––––––– ––––––––––––––
At 31 December 2004 63,441,216 67,691,251 2,092,460 55,782,046 189,006,973–––––––––––––– –––––––––––––– –––––––––––––– –––––––––––––– ––––––––––––––
Long termAt 1 January 2004 - - - - -Increase in reserves - - - 4,248,135 4,248,135
–––––––––––––– –––––––––––––– –––––––––––––– –––––––––––––– ––––––––––––––At 31 December 2004 - - - 4,248,135 4,248,135
–––––––––––––– –––––––––––––– –––––––––––––– –––––––––––––– ––––––––––––––Total 63,441,216 67,691,251 2,092,460 60,030,181 193,255,108–––––––––––––– –––––––––––––– –––––––––––––– –––––––––––––– ––––––––––––––2003Short termAt 1 January 2003 23,448,051 62,278,106 2,245,223 53,310,455 141,281,835(Decrease)/increase
in reserves (468,819) 480,113 208,925 30,722,001 30,942,220–––––––––––––– –––––––––––––– –––––––––––––– –––––––––––––– ––––––––––––––
At 31 December 2003 22,979,232 62,758,219 2,454,148 84,032,456 172,224,055–––––––––––––– –––––––––––––– –––––––––––––– –––––––––––––– ––––––––––––––
Long termAt 1 January 2003 - - - - -(Decrease)/increase
in reserves - - - - -–––––––––––––– –––––––––––––– –––––––––––––– –––––––––––––– ––––––––––––––
At 31 December 2003 - - - - -–––––––––––––– –––––––––––––– –––––––––––––– –––––––––––––– ––––––––––––––
Total 22,979,232 62,758,219 2,454,148 84,032,456 172,224,055–––––––––––––– –––––––––––––– –––––––––––––– –––––––––––––– ––––––––––––––
24
FINANCIAL STATEMENTS

NOTES TO THE FINANCIAL STATEMENTS (CONTINUED)
11 AMOUNT DUE TO HEAD OFFICE
2004 2003RM RM
At 1 January 193,248,541 175,196,624Net profit for the financial year 34,141,182 29,051,917Transfer to Head Office (15,000,000) (11,000,000)
–––––––––––––– ––––––––––––––At 31 December 212,389,723 193,248,541–––––––––––––– ––––––––––––––
12 OPERATING REVENUE
2004Shareholders’ General
fund fund TotalRM RM RM
Gross premium - 441,129,921 441,129,921Investment income (Note 13) 1,664,374 20,195,209 21,859,583
–––––––––––––– –––––––––––––– ––––––––––––––1,664,374 461,325,130 462,989,504–––––––––––––– –––––––––––––– ––––––––––––––
2003Shareholders’ General
fund fund TotalRM RM RM
Gross premium - 401,540,794 401,540,794Investment income (Note 13) 2,042,772 17,650,877 19,693,649
–––––––––––––– –––––––––––––– ––––––––––––––2,042,772 419,191,671 421,234,443–––––––––––––– –––––––––––––– ––––––––––––––
25
FINANCIAL STATEMENTS

NOTES TO THE FINANCIAL STATEMENTS (CONTINUED)
13 INVESTMENT INCOME
2004 2003RM RM
General fundInterest from:
Fixed deposits 5,536,260 4,166,102Malaysian Government securities 13,272,365 14,468,998Cagamas papers 436,415 -Unquoted corporate debt securities 4,895,890 3,582,320Bank guaranteed loans 1,050,949 1,104,001
Amortisation of premiums, net of accretion of discounts (5,653,484) (6,148,941)Gross dividends from quoted equity securities in Malaysia 656,814 478,397
–––––––––––––– ––––––––––––––20,195,209 17,650,877–––––––––––––– ––––––––––––––
Shareholders’ fundInterest from:
Fixed deposits 30,902 31,576Malaysian Government securities 1,882,631 997,039Cagamas papers 728,179 650,600
(Amortisation of premiums)/accretion of discounts-net (977,338) 363,557–––––––––––––– ––––––––––––––
1,664,374 2,042,772–––––––––––––– ––––––––––––––14 OTHER OPERATING INCOME - NET
General fundGain/(loss) on disposal of property, plant and equipment 23,000 (92,781)Gain on disposal of investments 2,462,499 324,226Write-back of allowance for diminution in value of investments - 280,978Sundry income 323,530 566,489Sundry expenses (39,292) (21,105)
–––––––––––––– ––––––––––––––2,769,737 1,057,807–––––––––––––– ––––––––––––––
26
FINANCIAL STATEMENTS

NOTES TO THE FINANCIAL STATEMENTS (CONTINUED)
14 OTHER OPERATING INCOME - NET (Continued)
2004 2003RM RM
Shareholders’ fund
Gain on disposal of investments 261,435 2,663–––––––––––––– ––––––––––––––15 TAXATION
2004 2003RM RM
Current taxCurrent financial year 15,132,000 15,801,000Overprovision of tax in prior financial year (1,023,899) (2,132,459)
–––––––––––––– ––––––––––––––14,108,101 13,668,541
Deferred taxOrigination and reversal of temporary differences (Note 7) 1,808,000 (2,206,000)
–––––––––––––– ––––––––––––––Tax expense 15,916,101 11,462,541–––––––––––––– ––––––––––––––The explanation of the relationship between tax expense and profit before taxation is as follows:
2004 2003RM RM
Numerical reconciliation between tax expense and the productof accounting profit multiplied by the Malaysian tax rate:
Profit before taxation 50,057,283 40,515,458–––––––––––––– ––––––––––––––Tax calculated at the Malaysian tax rate of 28% (2003: 28%) 14,016,039 11,344,328Overprovision of tax for prior financial year (1,023,899) (2,132,459)Tax effects of expenses not deductible for tax purposes 2,923,961 2,250,672
–––––––––––––– ––––––––––––––Tax expense 15,916,101 11,462,541–––––––––––––– ––––––––––––––
27
FINANCIAL STATEMENTS
NOTES TO THE FINANCIAL STATEMENTS (CONTINUED)
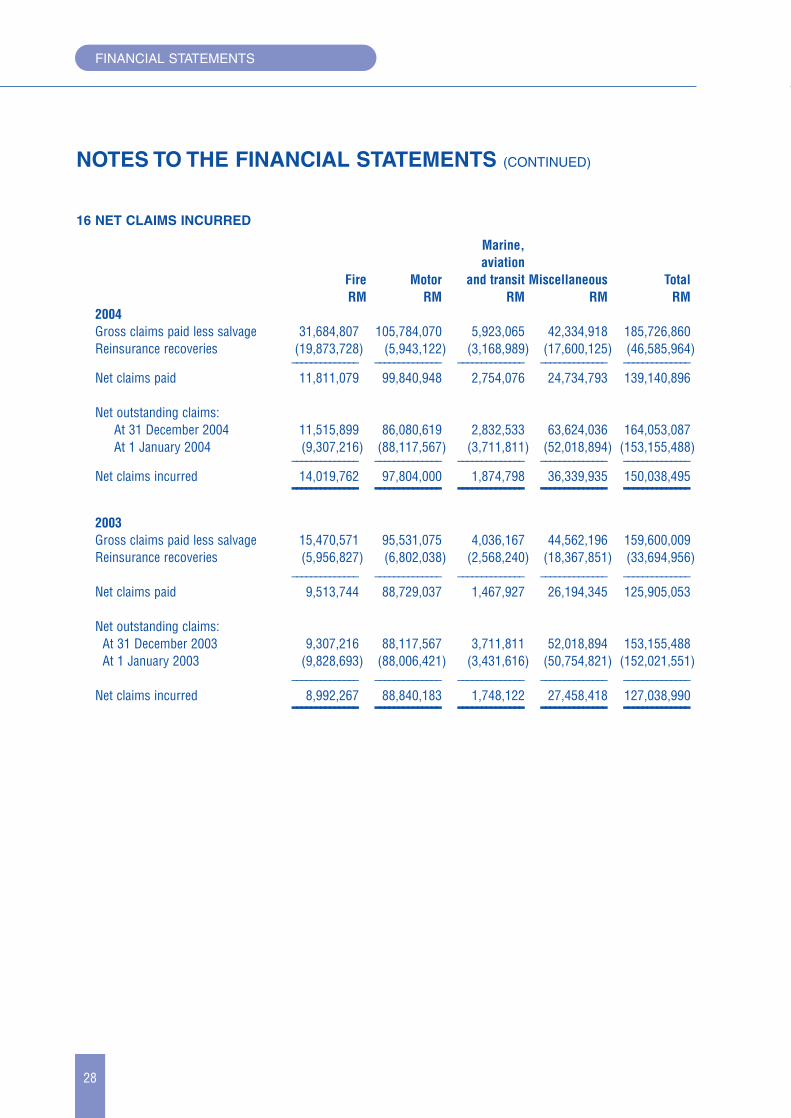
16 NET CLAIMS INCURRED
Marine,aviation
Fire Motor and transit Miscellaneous TotalRM RM RM RM RM
2004Gross claims paid less salvage 31,684,807 105,784,070 5,923,065 42,334,918 185,726,860Reinsurance recoveries (19,873,728) (5,943,122) (3,168,989) (17,600,125) (46,585,964)
–––––––––––––– –––––––––––––– –––––––––––––– –––––––––––––– ––––––––––––––Net claims paid 11,811,079 99,840,948 2,754,076 24,734,793 139,140,896
Net outstanding claims:At 31 December 2004 11,515,899 86,080,619 2,832,533 63,624,036 164,053,087At 1 January 2004 (9,307,216) (88,117,567) (3,711,811) (52,018,894) (153,155,488)
–––––––––––––– –––––––––––––– –––––––––––––– –––––––––––––– ––––––––––––––Net claims incurred 14,019,762 97,804,000 1,874,798 36,339,935 150,038,495–––––––––––––– –––––––––––––– –––––––––––––– –––––––––––––– ––––––––––––––2003Gross claims paid less salvage 15,470,571 95,531,075 4,036,167 44,562,196 159,600,009Reinsurance recoveries (5,956,827) (6,802,038) (2,568,240) (18,367,851) (33,694,956)
–––––––––––––– –––––––––––––– –––––––––––––– –––––––––––––– ––––––––––––––Net claims paid 9,513,744 88,729,037 1,467,927 26,194,345 125,905,053
Net outstanding claims:At 31 December 2003 9,307,216 88,117,567 3,711,811 52,018,894 153,155,488At 1 January 2003 (9,828,693) (88,006,421) (3,431,616) (50,754,821) (152,021,551)
–––––––––––––– –––––––––––––– –––––––––––––– –––––––––––––– ––––––––––––––Net claims incurred 8,992,267 88,840,183 1,748,122 27,458,418 127,038,990–––––––––––––– –––––––––––––– –––––––––––––– –––––––––––––– ––––––––––––––
28
FINANCIAL STATEMENTS

NOTES TO THE FINANCIAL STATEMENTS (CONTINUED)
17 MANAGEMENT EXPENSES
2004 2003RM RM
General fund
Staff salaries and bonus 22,009,458 19,266,215Staff benefits 4,772,254 4,204,537
–––––––––––––– ––––––––––––––Staff costs 26,781,712 23,470,752Auditors’ remuneration:
Statutory audit 83,000 79,200Fees for other services 25,429 15,682
Travelling expenses 588,541 605,207Motor vehicle expenses 818,545 620,466Legal expenses 82,510 74,045Advertising 5,082,165 3,560,871Printing and stationery 3,542,738 2,571,672Rent and rates 4,571,768 2,330,467Electricity and water 560,213 380,788Postage, telephone, telex and telefax 6,195,338 3,575,518Office maintenance 315,539 341,615Entertainment 1,377,527 1,033,102Depreciation of property, plant and equipment 3,333,069 2,128,813Training expenses 1,075,414 1,544,776Insurance Guarantee Scheme Fund levy 736,468 793,766EDP expenses 6,055,725 5,275,675Bad debts written off 444,739 340,634Bad debts recovered (56,391) (77,653)(Decrease)/increase in allowance for doubtful debts (3,308,693) 3,302,451Other expenses 4,711,064 3,919,353
–––––––––––––– ––––––––––––––63,016,420 55,887,200–––––––––––––– ––––––––––––––
The charge to the income statement for the financial year ended 31 December 2004 in respect of contributions tothe Employees’ Provident Fund is RM3,119,810 (2003: RM2,698,788).
The remuneration, including benefits-in-kind, attributable to the Chief Executive Officer of the Branch during thefinancial year amounted to RM447,181 (2003: RM539,742).
29
FINANCIAL STATEMENTS

NOTES TO THE FINANCIAL STATEMENTS (CONTINUED)
18 CASH FLOW SEGMENT INFORMATION
Shareholders’ Generalfund fund TotalRM RM RM
2004Cash flows from:
Operating activities 14,916,067 (29,149,285) (14,233,218)Investing activities - (1,980,279) (1,980,279)Financing activities (15,000,000) - (15,000,000)
–––––––––––––– –––––––––––––– ––––––––––––––(83,933) (31,129,564) (31,213,497)–––––––––––––– –––––––––––––– ––––––––––––––
Net decrease in cash and cash equivalents (83,933) (31,129,564) (31,213,497)
Cash and cash equivalents:At 1 January 2004 90,863 38,595,667 38,686,530
–––––––––––––– –––––––––––––– ––––––––––––––At 31 December 2004 6,930 7,466,103 7,473,033–––––––––––––– –––––––––––––– ––––––––––––––
2003Cash flows from:
Operating activities 10,746,172 32,787,920 43,534,092Investing activities - (13,060,865) (13,060,865)Financing activities (11,000,000) - (11,000,000)
–––––––––––––– –––––––––––––– ––––––––––––––(253,828) 19,727,055 19,473,227–––––––––––––– –––––––––––––– ––––––––––––––
Net (decrease)/increase in cash and cash equivalents (253,828) 19,727,055 19,473,227
Cash and cash equivalents:At 1 January 2003 344,691 18,868,612 19,213,303
–––––––––––––– –––––––––––––– ––––––––––––––At 31 December 2003 90,863 38,595,667 38,686,530–––––––––––––– –––––––––––––– ––––––––––––––
30
FINANCIAL STATEMENTS
NOTES TO THE FINANCIAL STATEMENTS (CONTINUED)
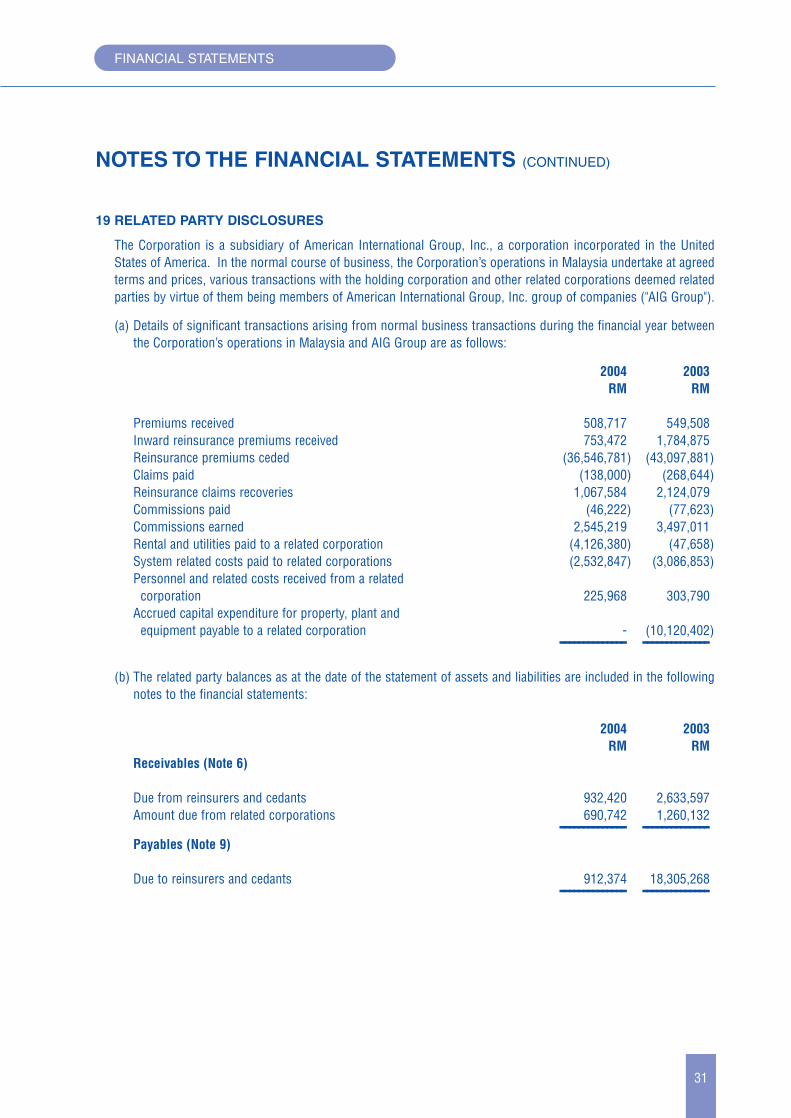
19 RELATED PARTY DISCLOSURES
The Corporation is a subsidiary of American International Group, Inc., a corporation incorporated in the UnitedStates of America. In the normal course of business, the Corporation’s operations in Malaysia undertake at agreedterms and prices, various transactions with the holding corporation and other related corporations deemed relatedparties by virtue of them being members of American International Group, Inc. group of companies ("AIG Group").
(a) Details of significant transactions arising from normal business transactions during the financial year betweenthe Corporation’s operations in Malaysia and AIG Group are as follows:
2004 2003RM RM
Premiums received 508,717 549,508Inward reinsurance premiums received 753,472 1,784,875Reinsurance premiums ceded (36,546,781) (43,097,881)Claims paid (138,000) (268,644)Reinsurance claims recoveries 1,067,584 2,124,079Commissions paid (46,222) (77,623)Commissions earned 2,545,219 3,497,011Rental and utilities paid to a related corporation (4,126,380) (47,658)System related costs paid to related corporations (2,532,847) (3,086,853)Personnel and related costs received from a related
corporation 225,968 303,790Accrued capital expenditure for property, plant and
equipment payable to a related corporation - (10,120,402)–––––––––––––– ––––––––––––––(b) The related party balances as at the date of the statement of assets and liabilities are included in the following
notes to the financial statements:
2004 2003RM RM
Receivables (Note 6)
Due from reinsurers and cedants 932,420 2,633,597Amount due from related corporations 690,742 1,260,132–––––––––––––– ––––––––––––––Payables (Note 9)
Due to reinsurers and cedants 912,374 18,305,268–––––––––––––– ––––––––––––––
31
FINANCIAL STATEMENTS

NOTES TO THE FINANCIAL STATEMENTS (CONTINUED)
20 FINANCIAL INSTRUMENTS
Financial risk management objectives and policies
Investment risk
Generally, insurance regulations restrict the types of assets in which an insurance company may invest. Investmentrisk represents the exposure to loss resulting from the cash flows from the invested assets, primarily long-termfixed rate investments, being less than the cash flows required to meet the obligations of the expected policy andcontract liabilities and the necessary returns on investments.
The Branch makes moderate to long-term investments primarily in Malaysian Government Securities andinvestment graded corporate bonds to support the general insurance policy liabilities.
To minimise its exposure to investment risk, the Branch adopts fundamental research and active management toseek a balanced portfolio to meet the investment objectives for income, security of principal and diversification interms of size, issuers and types of industry.
Equity price risk
The Branch currently maintains low exposure to listed equity securities at less than 10% of its total portfolio to limitits equity price risk.
Interest rate risk
The Branch’s investment activities are inherently exposed to interest rate risk which arises principally fromdifferences in maturity or re-pricing of invested assets. In dealing with this risk, the Branch adopts an approach offocusing on achieving a desired overall interest rate profile, which may change over time, based on management’slonger term view of interest rates and economic conditions.
Liquidity risk
Liquidity risk is the risk that the Branch cannot meet its financial liabilities when due. Liquidity risk is managed bothat corporate level and local level. The Branch’s liquidity is primarily derived from the operating cash flows which arederived from two sources i.e. underwriting operations and investment operations.
AIG’s strong capital position is integral to managing this liquidity, as it enables AIG to raise funds in diverse marketsworldwide. Management believes that AIG’s liquid assets, its net cash provided by operations and access to thecapital markets will enable it to meet any foreseeable cash requirements.
32
FINANCIAL STATEMENTS

NOTES TO THE FINANCIAL STATEMENTS (CONTINUED)
20 FINANCIAL INSTRUMENTS (Continued)
Business and operational risk
Operational risks include legal, tax, political, regulatory, market conduct and business continuity risks.
These risks arise from the uncertainty of the enforceability through legal or judicial processes, of the obligations ofthe Branch’s clients and counterparts. Internal Audit, supported by Legal and Compliance departments, review theeffectiveness of internal controls on a regular basis.
Underwriting and credit risk
The Branch as part of AIG is a major purchaser of reinsurance. AIG is cognisant of the need to exercise goodjudgement in the selection and approval of companies participating in its reinsurance programs.
AIG’s Reinsurance Security department, consisting of members of AIG’s senior management, conducts ongoingdetailed assessments of the reinsurance markets and current and potential reinsurers. Such assessments include,but are not limited to, identifying if a reinsurer is appropriately licensed, and has sufficient financial capacity, andthe local economic environment. This department also reviews the nature of the risks ceded and the need forcollateral. In addition, AIG’s Credit Risk Committee reviews the credit limits and concentrations with any onereinsurer. No single reinsurer is a material reinsurer on AIG nor is AIG’s business substantially dependent upon anyreinsurance contract.
In the ordinary course of business, the Branch cedes reinsurance to other insurance companies in order to providegreater diversification of its business and limit the potential losses arising from large risks.
The Branch’s reinsurance arrangements do not relieve it from its direct obligations to its insureds. Thus, a creditexposure exists with respect to general reinsurance ceded to the extent that any reinsurer is unable to meet theobligations assumed under the reinsurance agreements. The Branch manages its credit risk in its reinsurancerelationships by transacting with reinsurers that it considers financially sound.
33
FINANCIAL STATEMENTS

NOTES TO THE FINANCIAL STATEMENTS (CONTINUED)
20 FINANCIAL INSTRUMENTS (Continued)
Weighted average effective interest rates and maturity dates
The following table summarises the composition of the Branch’s weighted average effective interest rate and thematurity date for each class of interest-bearing financial instrument in the statement of assets and liabilities:
Interest-bearing/maturity date––––––––––––––––––––––––––––––––––
WeightedTotal average
Non-interest 1 year or 1 to 5 More than carrying effectivebearing less years 5 years value interest rate
2004 RM RM RM RM RM %Financial assets:Investments- Malaysia
Government Securities - - 198,141,738 42,478,097 240,619,835 3.50
- Cagamas papers - - 70,492,378 - 70,492,378 3.08- Corporate debt
securities - - 10,193,724 70,169,895 80,363,619 5.47- Equity securities
of corporations 22,692,963 - - - 22,692,963 -- Fixed deposits - 9,200,000 40,135,450 76,511,092 125,846,542 4.26- Other investments 220,000 - - - 220,000 -Bank guaranteed
loans - 454,544 2,272,720 6,022,736 8,750,000 8.25Unsecured staff
loans 13,607 625,057 1,752,175 4,034,038 6,424,877 4.91Other receivables 13,126,411 - - - 13,126,411 -Cash and bank
balances 7,473,033 - - - 7,473,033 -–––––––––––––– –––––––––––––– –––––––––––––– –––––––––––––– ––––––––––––––
Total financial assets 43,526,014 10,279,601 322,988,185 199,215,858 576,009,658
–––––––––––––– –––––––––––––– –––––––––––––– ––––––––––––––Other financial
assets* 47,670,100––––––––––––––
Total financial assets 623,679,758Non-financial assets:
Property, plant and equipment 16,214,913
Deferred tax assets 2,385,000Total assets
per statement of assets and liabilities 642,279,671––––––––––––––
34
FINANCIAL STATEMENTS
NOTES TO THE FINANCIAL STATEMENTS (CONTINUED)
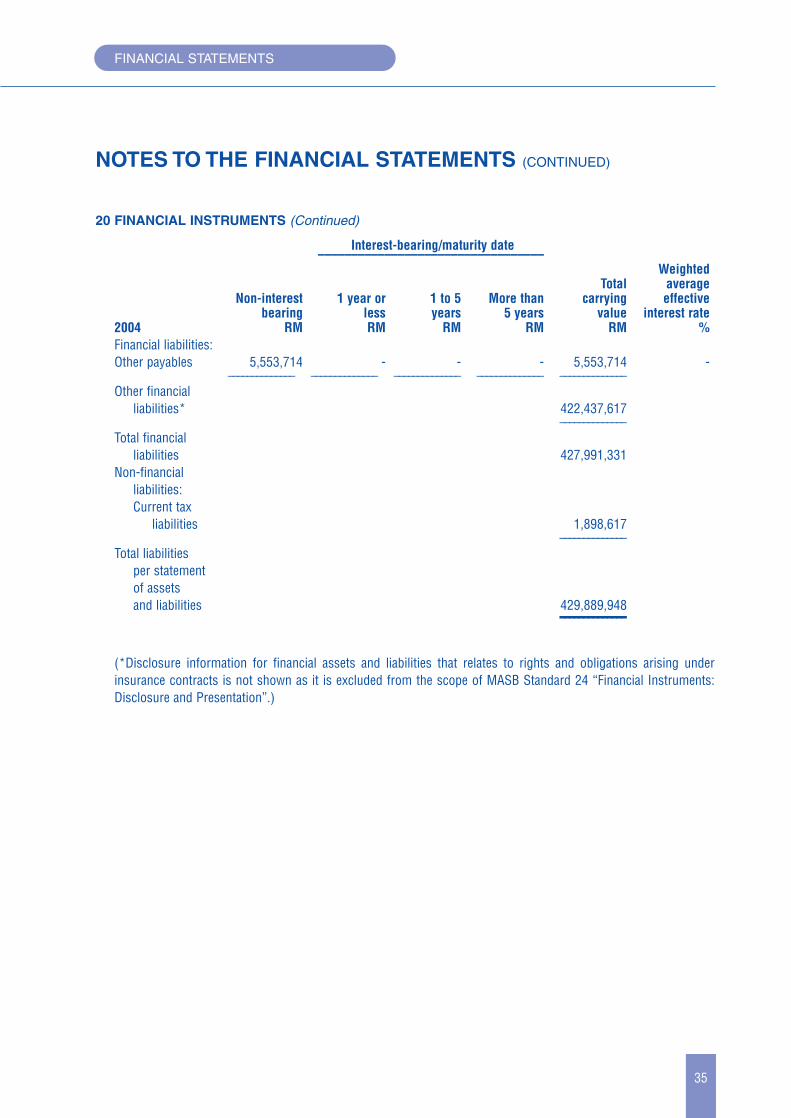
20 FINANCIAL INSTRUMENTS (Continued)
Interest-bearing/maturity date––––––––––––––––––––––––––––––––––
WeightedTotal average
Non-interest 1 year or 1 to 5 More than carrying effectivebearing less years 5 years value interest rate
2004 RM RM RM RM RM %Financial liabilities:Other payables 5,553,714 - - - 5,553,714 -
–––––––––––––– –––––––––––––– –––––––––––––– –––––––––––––– ––––––––––––––Other financial
liabilities* 422,437,617––––––––––––––
Total financial liabilities 427,991,331
Non-financial liabilities:Current tax
liabilities 1,898,617––––––––––––––
Total liabilities per statement of assets and liabilities 429,889,948––––––––––––––
(*Disclosure information for financial assets and liabilities that relates to rights and obligations arising underinsurance contracts is not shown as it is excluded from the scope of MASB Standard 24 “Financial Instruments:Disclosure and Presentation”.)
35
FINANCIAL STATEMENTS

NOTES TO THE FINANCIAL STATEMENTS (CONTINUED)
20 FINANCIAL INSTRUMENTS (Continued)
The following table summarises the composition of the Branch’s weighted average effective interest rate and thematurity date for each class of interest-bearing financial instrument in the statement of assets and liabilities:
Interest-bearing/maturity date––––––––––––––––––––––––––––––––––
WeightedTotal average
Non-interest 1 year or 1 to 5 More than carrying effectivebearing less years 5 years value interest rate
2003 RM RM RM RM RM %Financial assets:Investments- Malaysia
Government Securities - - 248,515,014 43,134,819 291,649,833 3.25
- Cagamas papers - - - 19,998,641 19,998,641 3.25- Corporate debt
securities - 5,002,226 10,250,747 65,808,670 81,061,643 5.61 - Equity securities
of corporations 10,663,786 - - - 10,663,786 -- Fixed deposits - 16,087,384 11,000,000 56,435,404 83,522,788 4.78- Other investments 220,000 - - - 220,000 -Bank guaranteed
loans - 454,544 2,272,720 6,408,420 9,135,684 8.25 Unsecured staff
loans 17,873 665,760 2,121,508 4,316,425 7,121,566 4.90 Other receivables 15,391,041 - - - 15,391,041 -Cash and bank
balances 38,686,530 - - - 38,686,530 -–––––––––––––– –––––––––––––– –––––––––––––– –––––––––––––– ––––––––––––––
Total financial assets 64,979,230 22,209,914 274,159,989 196,102,379 557,451,512
–––––––––––––– –––––––––––––– –––––––––––––– ––––––––––––––Other financial
assets* 25,689,699––––––––––––––
Total financial assets 583,141,211Non-financial assets:
Property, plant and equipment 17,544,703
Tax recoverable 906,517Deferred tax assets 4,193,000
––––––––––––––Total assets per statement
of assets and liabilities 605,785,431––––––––––––––
36
FINANCIAL STATEMENTS

NOTES TO THE FINANCIAL STATEMENTS (CONTINUED)
20 FINANCIAL INSTRUMENTS (Continued)
Interest-bearing/maturity date––––––––––––––––––––––––––––––––––
WeightedTotal average
Non-interest 1 year or 1 to 5 More than carrying effectivebearing less years 5 years value interest rate
2003 RM RM RM RM RM %Financial liabilities:Other payables 18,138,577 - - - 18,138,577 -
–––––––––––––– –––––––––––––– –––––––––––––– ––––––––––––––Other financial
liabilities* 393,621,379––––––––––––––
Total financial liabilities 411,759,956
Non-financial liabilities:Current tax
liabilities 776,934––––––––––––––
Total liabilities per statement of assetsand liabilities 412,536,890––––––––––––––
(* Disclosure information for financial assets and liabilities that relates to rights and obligations arising underinsurance contracts is not shown as it is excluded from the scope of MASB Standard 24 “Financial Instruments:Disclosure and Presentation”.)
37
FINANCIAL STATEMENTS

NOTES TO THE FINANCIAL STATEMENTS (CONTINUED)
Fair values
The carrying values of financial assets and liabilities of the Branch as at 31 December approximated their fair values,except for the following:
Carrying values Fair values2004 2004
RM RMInvestments:
- Malaysian Government Securities 240,619,835 241,672,000- Cagamas papers 70,492,378 70,306,000- Quoted equity securities of corporations 22,692,963 25,336,028- Unquoted debt securities 80,363,619 81,893,200 –––––––––––––– ––––––––––––––
Carrying values Fair values2003 2003
RM RMInvestments:
- Malaysian Government Securities 291,649,833 287,089,800- Cagamas papers 19,998,641 19,266,000- Quoted equity securities of corporations 10,663,786 12,615,520- Unquoted debt securities 81,061,643 82,020,300–––––––––––––– ––––––––––––––
The carrying value of investments in Cagamas papers at the balance sheet date have not been written down to theirfair value as the Management is of the opinion that these investments will be held for long-term purposes.
38
FINANCIAL STATEMENTS


