OPERATIONALIZING A MULTI-SECTORAL APPROACH FOR...
102
AN APPLICATION USING THE 2007 AND 2013 RISKESDAS OPERATIONALIZING A MULTI-SECTORAL APPROACH FOR THE REDUCTION OF STUNTING IN INDONESIA Public Disclosure Authorized Public Disclosure Authorized Public Disclosure Authorized Public Disclosure Authorized
Transcript of OPERATIONALIZING A MULTI-SECTORAL APPROACH FOR...

AN APPLICATION USINGTHE 2007 AND 2013 RISKESDAS
OPERATIONALIZING A MULTI-SECTORAL APPROACHFOR THE REDUCTION OF STUNTING IN INDONESIA
Pub
lic D
iscl
osur
e A
utho
rized
Pub
lic D
iscl
osur
e A
utho
rized
Pub
lic D
iscl
osur
e A
utho
rized
Pub
lic D
iscl
osur
e A
utho
rized


FEBRUARY 2017
AN APPLICATION USING THE 2007 AND 2013 RISKESDAS
OPERATIONALIZING A MULTI-SECTORAL APPROACHFOR THE REDUCTION OF STUNTING IN INDONESIA

iv
Operationalizing a Multi-Sectoral Approach for the Reduction of Stunting

v
Acknowledgement
The analysis in this report was carried out as part of the Cooperation Agreement between a team in the World Bank and the National Institute of Health Research and Development (NIHRD) of the Ministry of Health of the Republic of Indonesia. The Task Team Leader (TTL) was Emmanuel Skoufias, Lead Economist, Poverty and Equity Global Practice. The World Bank team included: Dr. Eko Setyo Pambudi (Health Analyst), Indira Maulani Hapsari (Research Analyst), Ratih Dwi Rahmadanti (Research Analyst) from the Bank’s Jakarta office, Dr. Katja Vinha (International Consultant), and Dr. Atmarita (International Consultant). The NIHRD team consisted of the following: Dr. Ni Ketut Aryastami (chairman of the NIHRD’s Team), Dr. Ingan Ukur Tarigan (member), Nunik Kusumawardani, PhD (member), Siti Isfandari, MA (member), Prisca Petty Arfines, MPH (member), Olwin Nainggolan, MKM (member), Djunaedi, SKM (member). The teams are grateful to Dr. Siswanto (Head of the NIHRD) for his support throughout the process of this report and to the Bank’s Health and Water teams in Jakarta for useful comments. This report was also was funded by the Water Global Practice and the Research Support Budget (RSB) of the Development Economics Vice Presidency of the World Bank.

vi
Operationalizing a Multi-Sectoral Approach for the Reduction of Stunting
ExecutiveSummary
vii
Executive Summary
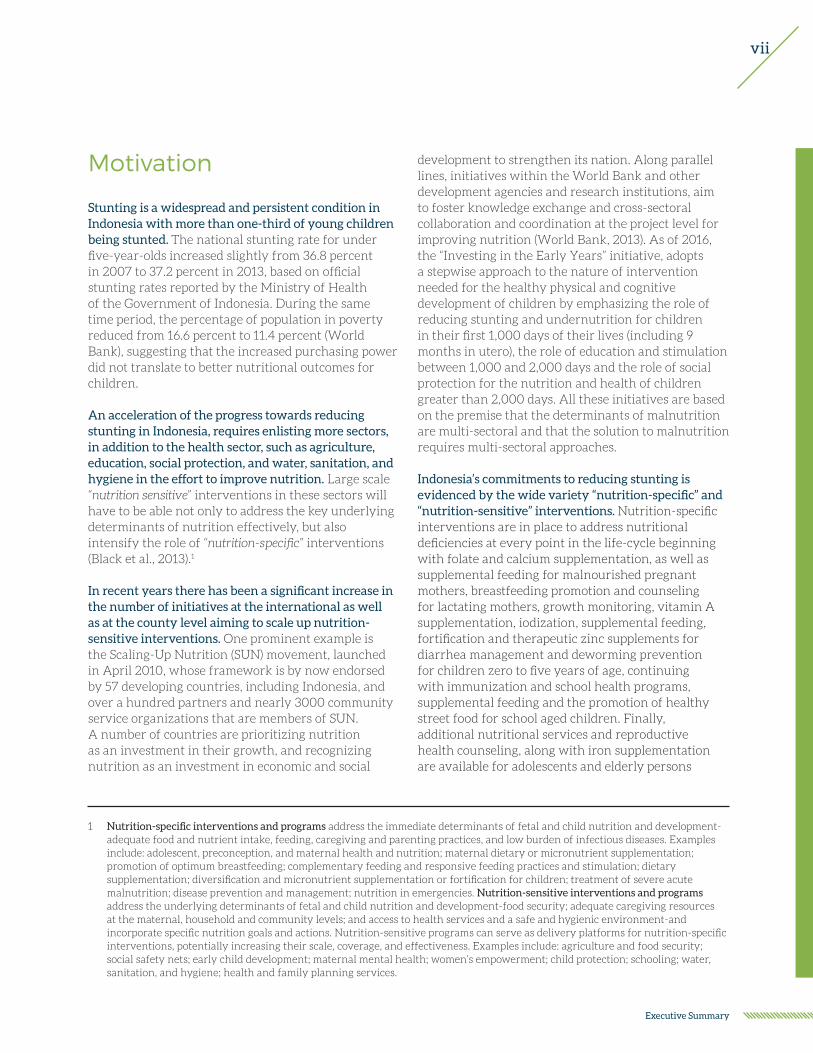
Motivation
Stunting is a widespread and persistent condition in Indonesia with more than one-third of young children being stunted. The national stunting rate for under five-year-olds increased slightly from 36.8 percent in 2007 to 37.2 percent in 2013, based on official stunting rates reported by the Ministry of Health of the Government of Indonesia. During the same time period, the percentage of population in poverty reduced from 16.6 percent to 11.4 percent (World Bank), suggesting that the increased purchasing power did not translate to better nutritional outcomes for children.
An acceleration of the progress towards reducing stunting in Indonesia, requires enlisting more sectors, in addition to the health sector, such as agriculture, education, social protection, and water, sanitation, and hygiene in the effort to improve nutrition. Large scale “nutrition sensitive” interventions in these sectors will have to be able not only to address the key underlying determinants of nutrition effectively, but also intensify the role of “nutrition-specific” interventions (Black et al., 2013).1
In recent years there has been a significant increase in the number of initiatives at the international as well as at the county level aiming to scale up nutrition-sensitive interventions. One prominent example is the Scaling-Up Nutrition (SUN) movement, launched in April 2010, whose framework is by now endorsed by 57 developing countries, including Indonesia, and over a hundred partners and nearly 3000 community service organizations that are members of SUN. A number of countries are prioritizing nutrition as an investment in their growth, and recognizing nutrition as an investment in economic and social
development to strengthen its nation. Along parallel lines, initiatives within the World Bank and other development agencies and research institutions, aim to foster knowledge exchange and cross-sectoral collaboration and coordination at the project level for improving nutrition (World Bank, 2013). As of 2016, the “Investing in the Early Years” initiative, adopts a stepwise approach to the nature of intervention needed for the healthy physical and cognitive development of children by emphasizing the role of reducing stunting and undernutrition for children in their first 1,000 days of their lives (including 9 months in utero), the role of education and stimulation between 1,000 and 2,000 days and the role of social protection for the nutrition and health of children greater than 2,000 days. All these initiatives are based on the premise that the determinants of malnutrition are multi-sectoral and that the solution to malnutrition requires multi-sectoral approaches.
Indonesia’s commitments to reducing stunting is evidenced by the wide variety “nutrition-specific” and “nutrition-sensitive” interventions. Nutrition-specific interventions are in place to address nutritional deficiencies at every point in the life-cycle beginning with folate and calcium supplementation, as well as supplemental feeding for malnourished pregnant mothers, breastfeeding promotion and counseling for lactating mothers, growth monitoring, vitamin A supplementation, iodization, supplemental feeding, fortification and therapeutic zinc supplements for diarrhea management and deworming prevention for children zero to five years of age, continuing with immunization and school health programs, supplemental feeding and the promotion of healthy street food for school aged children. Finally, additional nutritional services and reproductive health counseling, along with iron supplementation are available for adolescents and elderly persons
1 Nutrition-specific interventions and programs address the immediate determinants of fetal and child nutrition and development- adequate food and nutrient intake, feeding, caregiving and parenting practices, and low burden of infectious diseases. Examples include: adolescent, preconception, and maternal health and nutrition; maternal dietary or micronutrient supplementation; promotion of optimum breastfeeding; complementary feeding and responsive feeding practices and stimulation; dietary supplementation; diversification and micronutrient supplementation or fortification for children; treatment of severe acute malnutrition; disease prevention and management; nutrition in emergencies. Nutrition-sensitive interventions and programs address the underlying determinants of fetal and child nutrition and development-food security; adequate caregiving resources at the maternal, household and community levels; and access to health services and a safe and hygienic environment-and incorporate specific nutrition goals and actions. Nutrition-sensitive programs can serve as delivery platforms for nutrition-specific interventions, potentially increasing their scale, coverage, and effectiveness. Examples include: agriculture and food security; social safety nets; early child development; maternal mental health; women’s empowerment; child protection; schooling; water, sanitation, and hygiene; health and family planning services.

viii
Operationalizing a Multi-Sectoral Approach for the Reduction of Stunting
(Trihono et al. 2015). In parallel, Indonesia has a number of nutrition-sensitive programs in different sectors that are in the process of being scaled-up. For example, in the social protection sector, the PNPM Generasi (National Program for Community Empowerment), and the conditional cash transfer program PKH Prestasi, target the most vulnerable children and women. At the same time the National Health Insurance program (JKN) aims to extend health insurance coverage to the poor and the near poor, the self-employed, as well as those employed in the informal sector, consequently, allowing for better access to healthcare.
The effectiveness and ultimate success of such multi-sectoral approaches towards reducing stunting depends on having a more holistic view of the inequities and gaps in access to adequate levels of the underlying determinants of nutrition: Care, Health, Environment (or WASH), and Food Security (C H E F). The interdependencies among the underlying determinants of nutrition are usually beyond the scope or the control of any given sector. The integration of nutritional considerations in the agricultural sector, for example, is unlikely to take into account the fact that water, sanitation and hygiene (WASH) services and facilities may be poor and inadequate in some communities. As a consequence, the nutritional impacts of such nutrition-sensitive interventions on key nutrition outcomes could be impeded considerably by the absence of adequate WASH facilities. On the other hand, the impacts of the same nutrition-sensitive agricultural interventions could be enhanced considerably if they were to be accompanied by simultaneous improvements in the water and sanitation facilities in the same communities. Thus, a more holistic approach to sector-specific “nutrition-sensitive” interventions is likely to be better able to address the key underlying determinants of nutrition effectively, as well as reinforce the impacts of nutrition-specific interventions.
Design & Methods
This report lays the groundwork for more effective multi-sectoral action on reducing stunting in Indonesia, by operationalizing the UNICEF conceptual framework.2 The UNICEF framework, first proposed in 1990 (UNICEF, 1990), was one of the first attempts at emphasizing food security, environment, health, and child care practices as the four main underlying determinants of child malnutrition in developing countries. A fundamental premise of this conceptual framework, is that increases in access to adequate services in one or all of the four drivers of malnutrition, say for example, food security alone, cannot substitute for inadequate levels of access to the other determinants. While there is widespread acknowledgment of the four key underlying determinants of nutrition there is limited quantitative information on the size and direction of the interdependence among adequate (or inadequate) access to food security, environment, health, and child care in child nutrition.
Indicators for care, for health, for environment, and for food security are constructed using the 2007 and 2013 RISKEDAS surveys. Each indicator is comprised of various components based on availability in the survey, with the definition of “adequacy” based on national and/or accepted international standards. In consideration of the complexity of the linkages between the underlying determinants of malnutrition and the economic situation of the family, the analysis is also carried out separately for urban and rural households, for resource-rich (top 60 per cent) and resource-poor (bottom 40 per cent) households as well as for districts with high stunting rates and those with low stunting rates. A more holistic view is provided to the extent to which adequate levels of the four key underlying determinants of nutrition— food security; adequate caregiving resources at the maternal, household and community levels; access to health services; and a safe and hygienic environment—on their own as well as in combination are associated with better nutrition as measured by height-for-age z-scores (HAZ) and stunting rates.
2 The same conceptual framework also underpins the IPKM index (Indeks Pembangunan Kesehatan Masyarakat) of the Ministry of Health of the Republic of Indonesia. (IPKM, 2014). The IPKM essentially summarizes all the components of the underlying drivers of nutrition into one index using statistical methods.

ix
Executive Summary
Results
In spite of the considerable constraints imposed by data comparability issues across survey years, the analysis of the trends in access to the four drivers of malnutrition reveals that access to most of the comparable components of care, health, environment and food security has improved between 2007 and 2013 (Figure I).
In spite of the improvements over time, substantial inequalities in access between rural and urban areas, between districts with high and low stunting rates and between poorer and wealthier households continue to
persist (Figures II through V). For For example, in 2013 the use of health care facilities was in general greater by wealthier households than poorer households. Slightly less than two-thirds of the mothers of children in the poorest households were seen in prenatal visits (64 percent), 63 per cent of the children were delivered by a health care professional or had a post-natal checkup (63 percent), whereas among children in the wealthiest households, 90 percent were seen in prenatal visits, 98 percent were delivered by a health care professional and 88 percent had a post-natal checkup (See Figure III). Along similar lines, in 2013 children living in rural areas were less likely to have access to adequate environment than children living in urban areas. The differences were greater for sanitation measures than for drinking water.
FIGURE I. CHANGES IN ACCESS TO THE COMPONENTS OF ADEQUATE, CARE, HEALTH, ENVIRONMENT, AND FOOD SECURITY BETWEEN 2007 AND 2013
Source: Authors’ calculations based on the 2007 and 2013 RISKESDAS.
Environment
Components of Adequacy in Environment - SanitationNational, children less than 60 months
Source: Author estimates based on 2010 and 2013 RISKESDAS.
Perc
enta
ge o
f chi
ldre
n w
ho m
eet c
rite
ria
53 60
2007 2013
Improved
Improved
Food
Components of Adequacy in FoodNational, children less than 60 months
Source: Author estimates based on 2007 and 2013 RISKESDAS.
Exclusive breastfeeding
Mom fruit/vegetable intake
Perc
enta
ge o
f chi
ldre
n w
ho m
eet c
rite
ria
12
44
2007
15
64
2013
Source: Author estimates based on 2007 and 2013 RISKESDAS.
Care
Components of Adequacy in CareNational, children less than 60 months
3827
2013
67
30
Perc
enta
ge o
f chi
ldre
n w
ho m
eet c
rite
ria
2007
Mother's handwashing
No smoking
Health
Components of adequacy in healthNational, children less than 60 months
Source: Author estimates based on 2007, 2010 and 2013 RISKESDAS.Note: *Only for children 7 months or older
72
25
2007
5570
2010
62
76
2013
Immunizations
Vitamin A*
Perc
enta
ge o
f chi
ldre
n w
ho m
eet c
rite
ria

x
Operationalizing a Multi-Sectoral Approach for the Reduction of Stunting
In rural areas, 47 percent of children had access to basic sanitation whereas in urban areas 74 percent had such access (see Figure IV). Also, urban children as a whole had better access to basic sanitation with 62 percent of children living in communities where at least 75 percent of the households had access to basic sanitation, versus only 27 percent of rural children. Access to improved and basic water was relatively high in both areas, with about 79 percent of rural children having such access and 94 percent of urban children having access to improved and basic water. However, far fewer children had access to safely managed water (effectively piped water to the
premises), with about 11 percent of rural children having access to safely managed water and 30 percent of urban children having such access. Finally, in 2007, the year in which this information is available, the consumption of calories and protein per adult equivalent in the poorest households less than in households at the fifth quintile of the wealth distribution. Also, only six percent of the mothers in the poorest households consumed both fruits and vegetables at least five days of the week, whereas 23 percent of the mothers in the highest wealth quintile did so (Figure V).
FIGURE II. DIFFERENCES IN ACCESS TO THE COMPONENTS OF ADEQUATE, CARE BETWEEN RURAL AND URBAN AREAS AND ACROSS WEALTH QUINTILES IN 2013
Source: Authors’ calculations based on the 2007 and 2013 RISKESDAS.Notes: Wealth quintiles calculated by the NIHRD using polychoric prinipal components analysis (pp. 61-62 of 2013 report).
Care by Rural vs. Urban
Components of Adequacy in Care, 2013By urban/rural, children less than 36 months
36
72
4940
26
Rural
38
66
5345
33
Urban
Perc
enta
ge o
f chi
ldre
n w
ho m
eet c
rite
ria
Early breastfeeding* Appropriate breastfeeding* Complementary** Handwashing Smoke-free
Care by Wealth Quintile
Components of Adequacy in Care, 2013By wealth quantile, children less than 36 months
35
74
46
3223
36
73
4939
24
38
71
5344
2737
6654
45
3238
62
505038
1 2 3 4 5
Perc
enta
ge o
f chi
ldre
n w
ho m
eet c
rite
ria
Source: Authors’ calculations based on the 2007 and 2013 RISKESDAS.Notes: Wealth quintiles calculated by the NIHRD using polychoric prinipal components analysis (pp. 61-62 of 2013 report)
Health by Rural vs. Urban
Components of Adequacy in Health, 2013By urban/rural, children less than 36 months
77 81 77
56
76
8994
86
67
78
Perc
enta
ge o
f chi
ldre
n w
ho m
eet c
rite
ria
Rural Urban
Prenatals Assisted Growth Immunizations Vitamin A*
6463 63
40
67
7981 78
57
7787
9284
66
7989
9587
68
8090
9888
7077
Perc
enta
ge o
f chi
ldre
n w
ho m
eet c
rite
ria
1 2 3 4 5
Health by Wealth Quintile
Components of Adequacy in Health, 2013By wealth quantile, children less than 36 months
FIGURE III. DIFFERENCES IN ACCESS TO THE COMPONENTS OF ADEQUATE HEALTH BETWEEN RURAL AND URBAN AREAS AND ACROSS WEALTH QUINTILES IN 2013

xi
Executive Summary
A move away from an analysis of the individual components of the four drivers of malnutrition towards a more aggregate analysis of differences in access to adequate levels in the four drivers of malnutrition, care, health, environment and food security involves a variety of options. In this report, adequate access to care or health or environment or food security is defined as a child having adequate access to all of the components of each of the four drivers of nutrition. Although this is admittedly a very strict criterion, it is in line with the UNICEF conceptual framework that assumes that increases in access to adequate levels in
one of the four determinants alone cannot substitute for inadequacies in the other three underlying determinants. Nevertheless, it is important to bear in mind that alternative criteria could be employed. For example, adequate access to care or health or environment or food security could be defined as a child having adequate access to at least one or at least two of the components of each of the four drivers of nutrition. Alternatively, different weights could be applied to the distinct components of each nutrition driver, reflecting the preferences, values and/or information of the policy making authority.
Source: Authors’ calculations based on the 2007 and 2013 RISKESDAS.Notes: Wealth quintiles calculated by the NIHRD using polychoric prinipal components analysis (pp. 61-62 of 2013 report).
Sanitation Basic Community Drinking water Improved Basic Safely managed
1 2 3 4 5
2 4
6462
7
2619
81 80
13
68
46
9090
18
86
63
9493
26
95
74
9796
35
Perc
enta
ge o
f chi
ldre
n w
ho m
eet c
rite
ria
Environment by Wealth Quintile
Components of Adequacy in EnvironmentBy wealth quantile, in 2013
47
27
79 78
11
74
62
94 94
30
Perc
enta
ge o
f chi
ldre
n w
ho m
eet c
rite
ria
Rural Urban
Environment by Rural vs. Urban
Components of Adequacy in Environment, 2013By urban/rural, children less than 36 months
FIGURE IV. DIFFERENCES IN ACCESS TO THE COMPONENTS OF ADEQUATE ENVIRONMENT BETWEEN RURAL AND URBAN AREAS AND ACROSS WEALTH QUINTILES IN 2013
Source: Authors’ calculations based on the 2007 RISKESDAS.
Household calories Household protein Exclusively breastfed* Mom fruit/vegetable intake
Food Security by Wealth Quintile
Components of Adequacy in FoodBy wealth quintile, children less than 60 months, in 2007
33
5847
6
37
62
45
9
37
65
41
12
40
69
42
16
43
75
39
23
Perc
enta
ge o
f chi
ldre
n w
ho m
eet c
rite
ria
1 2 3 4 5
Food Security by Rural vs. Urban
Components of Adequacy in FoodBy Urban/Rural, children less than 60 months, in 2007
37
62
46
7
36
67
40
19
Perc
enta
ge o
f chi
ldre
n w
ho m
eet c
rite
ria
Rural Urban
FIGURE V. DIFFERENCES IN ACCESS TO THE COMPONENTS OF ADEQUATE FOOD SECURITY BETWEEN RURAL AND URBAN AREAS AND ACROSS WEALTH QUINTILES IN 2013

xii
Operationalizing a Multi-Sectoral Approach for the Reduction of Stunting
Application of the above mentioned definition for adequate access leads to more stark differences in access to adequate access to the four drivers of nutrition. At the national level, access to adequate care was the driver with the lowest prevalence rate and access to adequate environment was the driver with the highest prevalence rate. Nationally only seven percent of the children had access to adequate care (Figure VI)3. Similarly, very few children had access to adequate food, with only 14 percent having such access nationally.4 About 56 percent of the children had access to adequate environment or basic drinking water and improved sanitation simultaneously. The access to adequate health was also relatively high, at
46 percent.5 In 2013 children living in rural areas were less likely to have access to all of the four drivers of nutrition than urban children. The largest discrepancy was in the access to adequate environment with only around 40 percent of those in rural areas having access and around 70 percent of those in urban areas having access (Figure VI). Adequate access to environment is also the nutrition driver with the largest differences by wealth quintiles. Only one percent of the children in the lowest wealth quintile had access to adequate environment whereas in the highest quintile 92 percent of the children had access to an adequate environment (Figure VI).
Source: Authors’ calculations based on the 2013 RISKESDAS.Notes: Wealth quintiles calculated by the NIHRD using polychoric prinipal components analysis (pp. 61-62 of 2013 report).
Food
Care
Environment
Health
Perc
enta
ge o
f chi
ldre
n w
ho m
eet c
rite
ria
147
56
46
National
Adequacy status in 2013, by National0 to 36 month olds
Rural vs. Urban
Adequacy status in 2013, by Urban/Rural0 to 36 month olds
Perc
enta
ge o
f chi
ldre
n w
ho m
eet c
rite
ria
10 6
41 41
Rural
188
71
51
Urban
5 4 1
26
8 6
21
39
11 7
62
49
178
81
53
27
10
92
53
Perc
enta
ge o
f chi
ldre
n w
ho m
eet c
rite
ria
1 2 3 4 5
Wealth Quintile
Adequacy met in 2013, by Wealth Quantile0 to 36 month olds
FIGURE VI. ACCESS TO ADEQUATE, CARE, HEALTH, ENVIRONMENT AND FOOD SECURITY IN 2013
3 Adequate care is defined as mother’s hand washing practices, and whether household is smoke free. For children zero to 23 months of age it also includes immediate breastfeeding after birth, and age appropriate breastfeeding at the time of survey. For children six to eight month of age the additional component of the child receiving complementary feedings is also included
4 Adequate food is based on mother’s fruit and vegetable consumption. For children zero to five months of age it also includes exclusive breast feeding.
5 Access to adequate health is defined by mother having had at least four prenatal checkups, the birth was assisted by a skilled professional, the child was seen at a post-natal checkup, and the child’s immunizations are up to date. For children 7 to 35 months of age the additional condition of having received vitamin A supplementation is added.

xiii
Executive Summary
A more austere picture emerges through an analysis of the extent to which children have simultaneous access to two or more of the four underlying determinants of nutrition. In 2013, 23 per cent of the children between 0 and 3 years of age did not have access to adequate level in any of the four determinants of nutrition. In 2007, this fraction was 39 per cent. On the other end, less than 1 per cent of children had access simultaneously to all four key underlying determinants of nutrition (see Figure VII). These differences in simultaneous access to two or more drivers become larger between rural and urban areas and by quantile of wealth).
The low proportions of children with simultaneous access to more than one of the drivers of nutrition suggests that the integration of nutritional considerations in any given sector may have nutritional impacts that are limited primarily by inadequate access to the underlying drivers of nutrition. The recent emphasis on sector-specific nutrition sensitive interventions (World Bank, 2013) rightly emphasizes the synergies that can be exploited within specific sectors such agriculture, water and sanitation, or social protection. These findings suggest that the success of uncoordinated or
isolated sector-specific nutrition-sensitive initiatives may be constrained by inadequate access to the four underlying determinants of malnutrition: food security, child care, environment, and health.
The preceding argument is reinforced by the result that simultaneous access to two or more of the four key determinants of nutrition is associated with a decrease in the likelihood of a child being stunted (see Figures VIII and IX). The likelihood that children between 0 and 36 months of age are stunted is lower when children have simultaneous access to adequate levels to two of the four drivers of nutrition and even lower among children with simultaneous access to adequate levels to three of the four drivers of nutrition (Figure VIII). More importantly, the same pattern appears to hold separately in rural and urban areas as well as for children in households at the top 60 percent of the wealth distribution (Figure IX). All in all, these results validate the importance of coordinated multi-sectoral policies and suggest that the success of “sector-specific nutrition-sensitive” initiatives can be enhanced by better coordination and integration of multi-sectoral interventions that address effectively the four underlying determinants of nutrition.
Source: Authors’ calculations based on the 2013 RISKESDAS.Notes: Wealth quintiles calculated by the NIHRD using polychoric prinipal components analysis (pp. 61-62 of 2013 report).
Rural vs. Urban
Number of adequacies met in 2013, By urban/rural0 to 36 month olds
34 37
23
50
13
38 36
121
Rural Urban
Perc
enta
ge o
f chi
ldre
n w
ho m
eet c
rite
ria
Wealth Quintile
Number of adequacies met in 2013, By wealth quantile0 to 36 month olds
68
29
4 0 0
42 42
14
2 0
16
4433
6 8
39 42
111 3
3343
18
2
1 2 3 4 5
Perc
enta
ge o
f chi
ldre
n w
ho m
eet c
rite
ria
1
Adequate in none
Adequate in 1 of 4
Adequate in 3 of 4
Adequate in 2 of 4
Adequate in all 4
National
Adequacies status in 2013, National0 to 36 month olds
23
3830
81Pe
rcen
tage
of c
hild
ren
who
mee
t cri
teri
a
FIGURE VII. SIMULTANEOUS ACCESS TO ADEQUATE LEVELS OF TWO OR MORE OF THE FOUR DRIVES OF MALNUTRITION IN 2013

xiv
Operationalizing a Multi-Sectoral Approach for the Reduction of Stunting
Source: Authors’ calculations based on the 2013 RISKESDAS.Note: Showing point estimates and 95% CI. Reference group: Children with access to none, p=.414
FIGURE VIII. SIMULTANEOUS ACCESS TO DRIVERS OF NUTIRITION AND THE PROBABILITY OF BEING STUNTED: 2013
Difference in Probability of Being Stunted, 2013
National, Relative to the Reference Group
-0.109
-0.134
-0.089
-0.052
-0.200
One
Three
-0.150
Two
Four
Nut
riti
on D
rive
rs
-0.100 -0.050 0.000
Percentage point difference in stunting rate
FIGURE IX. SIMULTANEOUS ACCESS TO DRIVERS OF NUTIRITION AND THE PROBABILITY OF BEING STUNTED: 2013
Source: Authors’ calculations based on the 2013 RISKESDAS.Note: Showing point estimates and 95% CI. Reference group: Children with access to none, p=.414
Rural, Relative to the Reference Group
-0.070
-0.104
-0.073
-0.052
-0.200
One
Three
Two
Four
Nut
riti
on D
rive
rs
-0.100 0.000 0.100
Urban, Relative to the Reference Group
-0.071
-0.096
-0.056
-0.015
-0.200
One
Three
-0.150
Two
Four
Nut
riti
on D
rive
rs
-0.100 -0.050 0.050
Children in B40, Relative to the Reference Group
-0.083
-0.047
-0.017
-0.029
-0.400
One
Three
-0.200
Two
Four
Nut
riti
on D
rive
rs
0.000 0.200 0.400
Children in T60, Relative to the Reference Group
-0.051
-0.081
-0.041
-0.012One
Three
-0.150
Two
Four
Nut
riti
on D
rive
rs
-0.100 -0.050 0.000
Percentage point difference in stunting rate Percentage point difference in stunting rate
Percentage point difference in stunting ratePercentage point difference in stunting rate
0.000
0.050

xv
Executive Summary
Policy ConsiderationsThe operationalization of the UNICEF conceptual framework in this report offers the opportunity of serving as a basis for a more systematic monitoring of the progress in access to the four main drivers of child malnutrition. It also serves as a practical diagnostic framework for identifying potential “binding constraints” in the Indonesian context towards the effort to reduce child stunting and malnutrition.
Measurement drives diagnosis and response: The analysis carried out highlights numerous critical data gaps in key components of the four underlying determinants of child malnutrition. For example, the 2013 RISKESDAS survey, the one and only survey containing anthropometric measures for children and adults at the national as well as at the district level does not include variables useful for quantifying key components of food security, such as dietary diversity and consumption or availability of calories and proteins. On the other hand, the annual SUSENAS survey which collects these important variables but only at the household level, contains no information on child anthropometric measures and is relatively weaker in measures of child care. A more coordinated approach to data collection that closes the gaps in information collected by nutrition-related and other socio-economic surveys in Indonesia can have substantial benefits for efforts aimed at reducing child stunting through a more informed and better coordinated multi-sectoral approach.
Context matters: The probability of being stunted with simultaneous access to two or more of the four underlying determinants of nutrition, varies by the wealth status of the household, and rural and urban areas.
Targeting and tailoring: The above also suggests that “one size fits all” multi-sectoral programs are not likely to be as effective as multi-sectoral programs that are tailored and targeted to specific age groups, specific locations and/or low wealth groups. Investments in nutrition-specific and nutrition-sensitive interventions should focus on areas where access to adequate levels in the four drivers of nutrition is relatively less prevalent.
Better coordination and integration: Progress towards reducing stunting in Indonesia can be enhanced by coordinated multi-sectoral interventions that address effectively the four key underlying determinants of nutrition. The poor performance of multi-sectoral projects in nutrition and health across the world provides the opportunity to learn a lot from the failures of the past, especially when it comes to setting the clarity of objectives and the role and responsibility of each sector involved in the renewed effort to reduce stunting Indonesia. Clarity and prior agreement on the common yardstick to be used among the different sectors involved can lead to significant improvements in the efficiency and efficacy of policies against child undernutrition.

xvi
Operationalizing a Multi-Sectoral Approach for the Reduction of Stunting

xvii
EXECUTIVE SUMMARYiii Motivation
iv Design & Methods
v Results
xi Policy Considerations
1.Introduction
2.Stunting and Fiscal Resource
Allocation in Indonesia6 Stunting, Fiscal Transfers to Districts,
and District Expenditures
3.9 Methodological Framework
4.Measures of Adequate Access to
the Determinants of Nutrition Based on the RISKESDAS
13 Adequate Food Security
17 Adequate Care
21 Adequate Health
25 Adequate Environmental Services
Contents
5.Synergies
The Underlying Determinants of Nutrition and Height-for-age in 2013 31In Search of Synergies 34
6.Summary of Findings 43
7.Policy Considerations 47
REFERENCES 49
APPENDIXES 51

xviii
Operationalizing a Multi-Sectoral Approach for the Reduction of Stunting

1
Chapter 1.
Chapter 1.
Introduction
Stunting is a widespread and persistent condition in Indonesia with more than one-third of young children being stunted. The national stunting rate for under five-year-olds increased slightly from 36.8 percent in 2007 to 37.2 percent in 2013, based on official stunting rates reported by the Ministry of Health of the Government of Indonesia. During the same time period, the percentage of population in poverty reduced from 16.6 percent to 11.4 percent (World Bank), suggesting that although a smaller share of households was below the poverty-line, the increased purchasing power did not translate to better nutritional outcomes for children.
By now, there is a wide consensus that economic growth is not sufficient for improving nutrition outcomes. An acceleration of the progress towards reducing stunting in Indonesia, requires enlisting more sectors, in addition to the health sector, such as agriculture, education, social protection, and water, sanitation, and hygiene in the effort to improve nutrition. Large scale “nutrition sensitive” interventions in these sectors will have to be able not only to address the key underlying determinants of nutrition effectively, but also intensify the role of “nutrition-specific” interventions (Lancet 2013).6
In recent years there has been a significant increase in the number of initiatives at the international as well
as at the county level aiming to scale up nutrition-sensitive interventions. One prominent example is the Scaling-Up Nutrition (SUN) movement, whose framework is endorsed by 30 developing countries. Indonesia, together with a number of other countries, is prioritizing nutrition as an investment in its growth, and recognizing nutrition as an investment in economic and social development to strengthen its nation. Along parallel lines, initiatives within the World Bank and other development agencies and research institutions, aim to foster knowledge exchange and cross-sectoral collaboration and coordination at the project level for improving nutrition (Shekar et al., 2013). All these initiatives are based on the premise that the determinants of malnutrition are multi-sectoral and that the solution to malnutrition requires multi-sectoral approaches.
Indonesia’s commitments to reducing stunting is evidenced by the wide variety of “nutrition-specific” and “nutrition-sensitive” interventions. Nutrition-specific interventions are in place to address nutritional deficiencies at every point in the life-cycle beginning with folate and calcium supplementation, as well as supplemental feeding for malnourished pregnant mothers, breastfeeding promotion and counseling for lactating mothers, growth monitoring, vitamin A supplementation, iodization, supplemental feeding, fortification and therapeutic zinc supplements
6 Nutrition-specific interventions and programs address the immediate determinants of fetal and child nutrition and development—adequate food and nutrient intake, feeding, caregiving and parenting practices, and low burden of infectious diseases. Examples include: adolescent, preconception, and maternal health and nutrition; maternal dietary or micronutrient supplementation; promotion of optimum breastfeeding; complementary feeding and responsive feeding practices and stimulation; dietary supplementation; diversification and micronutrient supplementation or fortification for children; treatment of severe acute malnutrition; disease prevention and management; nutrition in emergencies. Nutrition-sensitive interventions and programs address the underlying determinants of fetal and child nutrition and development— food security; adequate caregiving resources at the maternal, household and community levels; and access to health services and a safe and hygienic environment—and incorporate specific nutrition goals and actions. Nutrition-sensitive programs can serve as delivery platforms for nutrition-specific interventions, potentially increasing their scale, coverage, and effectiveness. Examples include: agriculture and food security; social safety nets; early child development; maternal mental health; women’s empowerment; child protection; schooling; water, sanitation, and hygiene; health and family planning services.

2
Operationalizing a Multi-Sectoral Approach for the Reduction of Stunting
for diarrhea management and deworming prevention for children zero to five years of age, continuing with immunization and school health programs, supplemental feeding and the promotion of healthy street food for school aged children. Finally, additional nutritional services and reproductive health counseling, along with iron supplementation are available for adolescents and elderly persons (Trihono et al. 2015). In parallel, Indonesia has a number of nutrition-sensitive programs in different sectors that are in the process of being scaled-up. For example, in the social protection sector, the PNPM Generasi (National Program for Community Empowerment), and the conditional cash transfer program PKH Prestasi, target the most vulnerable children and women. At the same time the National Health Insurance program (JKN) aims to extend health insurance coverage to the poor and the near poor, the self-employed, as well as those employed in the informal sector, consequently, allowing for better access to healthcare.
The effectiveness and ultimate success of such multi-sectoral approaches towards reducing stunting depends on having a more holistic view of the inequities and gaps in access to adequate levels of the underlying determinants of nutrition: Care, Health, Environment (or WASH), and Food Security (C H E F). The interdependencies among the underlying determinants of nutrition are usually beyond the scope or the control of any given sector. The integration of nutritional considerations in the agricultural sector, for example, is unlikely to take into account the fact that water, sanitation and hygiene (WASH) services and facilities may be poor and inadequate in some communities. As a consequence, the nutritional impacts of such nutrition-sensitive interventions on key nutrition outcomes could be impeded considerably by the absence of adequate WASH facilities. On the other hand, the impacts of the same nutrition-sensitive agricultural interventions could be enhanced considerably if they were to be accompanied by simultaneous improvements in the water and sanitation facilities in the same communities. Thus, a more holistic approach to sector-specific “nutrition-sensitive” interventions is likely to be better able to address the key underlying determinants of nutrition effectively, as well as reinforce the impacts of nutrition-specific interventions.

3
Chapter 2.
Chapter 2.
Stunting and Fiscal Resources Allocation in Indonesia
Stunting is distributed across the archipelago with most provinces having districts with stunting rates both above and below the national average--the exception being Yogyakarta with all five districts having stunting rates below the national average both in 2007 and in 2013. The maps in Figure 1 below show the prevalence of stunting across districts both in 2007 and 2013.7
Between 2007 and 2013 stunting rates changed rather erratically across districts. In the maps (Figure 2), the upper panel shows changes in stunting rates for those districts where the stunting rate in 2007 was above the national stunting rate of 36.8 percent and the lower panel shows changes in stunting rates for those districts where the stunting rate in 2007 was below the national stunting rate of 36.8 percent. In both panels, districts in green saw a more than four percentage point decrease in stunting between 2007 and 2013 and those in red saw a more than four percentage point increase in stunting. Many of the districts with stunting rates above the national average in 2007 had lower stunting rates in 2013, and many of the districts with stunting rates below the national average in 2007 had higher a prevalence of stunting in 2013. Only a few districts that had stunting rates lower than the national average
were able to decrease stunting by more than four percentage points, whereas a number of districts with stunting rates above the national average saw an increase in stunting.
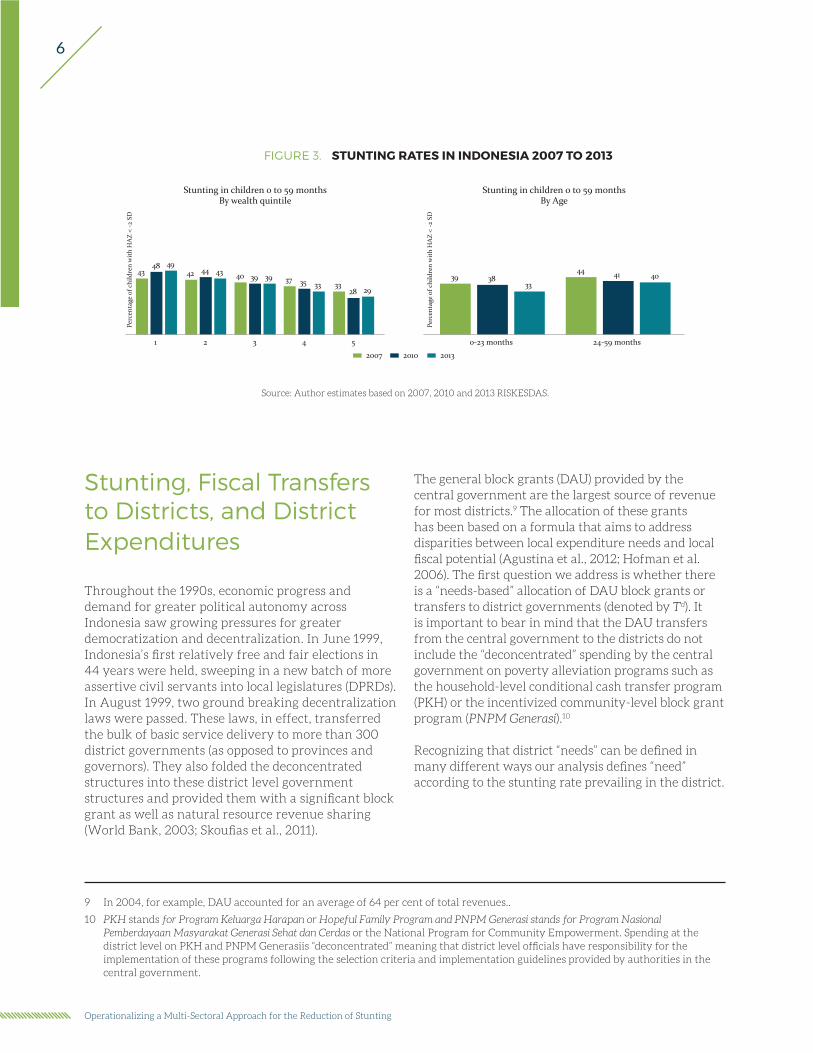
Furthermore, more children in the poorest households were stunted in 2013 than in 2007 rising from 43 percent in 2007 to 49 percent in 2013.8 Children in wealthier households were five percentage points less likely to be stunted in 2013 than in 2007. Therefore, whereas in 2007 the difference in stunting rates between children under 60 months from the poorest households and the wealthiest households was 10 percentage points, in 2013 it had increased to 20 percentage points. That is, even though for children from certain households the likelihood of being stunted decreased, children from the most vulnerable households, those with fewer resources, the likelihood increased.
Between 2007 and 2013, the stunting rate decreased for both older children and younger children. The prevalence of stunting decreased by six percentage points in the younger age cohort and four percentage points in the older age cohort (Figure 3). The prevalence of stunting is higher in older children than in younger ones in each year.
7 The 2013 stunting rates are projected onto 2007 district boundaries. That is, if a district split between 2007 and 2013, we take the weighted average of the stunting rates in all the areas covered by the 2007 “mother” district.
8 These analyses,and all that follow,are based on theofficial HAZ scores calculated by theIndonesianMinistry of Health.

4
Operationalizing a Multi-Sectoral Approach for the Reduction of Stunting
FIGURE 1: PREVALENCE OF STUNTING BY DISTRICT, 2007 AND 2013
Source: Authors’ calculations based on the 2013 RISKESDAS
STUNTING RATE IN INDONESIA, 200716.7 – 36.836.8 – 67.4
STUNTING RATE IN INDONESIA, 201311.1 – 37.237.2 – 70.4

5
Chapter 2.
FIGURE 2: CHANGES IN DISTRICT STUNTING RATES, 2007 TO 2013
DISTRICT WITH STUNTING RATES BELOW NATIONAL AVERAGE (36.8%) IN 2007Stunting decreased (41.6 to 4.0 percentage points)Stunting remained constant (less than 4.0 percentage point change)Stunting increased (4.0 to 34.5 percentage points)Stunting in 2007 above 36.8%
DISTRICT WITH STUNTING RATES ABOVE NATIONAL AVERAGE (36.8%) IN 2007Stunting decreased (41.6 to 4.0 percentage points)Stunting remained constant (less than 4.0 percentage point change)Stunting increased (4.0 to 34.5 percentage points)Stunting in 2007 below 36.8%
6
Operationalizing a Multi-Sectoral Approach for the Reduction of Stunting
Stunting, Fiscal Transfers to Districts, and District Expenditures
Throughout the 1990s, economic progress and demand for greater political autonomy across Indonesia saw growing pressures for greater democratization and decentralization. In June 1999, Indonesia’s first relatively free and fair elections in 44 years were held, sweeping in a new batch of more assertive civil servants into local legislatures (DPRDs). In August 1999, two ground breaking decentralization laws were passed. These laws, in effect, transferred the bulk of basic service delivery to more than 300 district governments (as opposed to provinces and governors). They also folded the deconcentrated structures into these district level government structures and provided them with a significant block grant as well as natural resource revenue sharing (World Bank, 2003; Skoufias et al., 2011).
The general block grants (DAU) provided by the central government are the largest source of revenue for most districts.9 The allocation of these grants has been based on a formula that aims to address disparities between local expenditure needs and local fiscal potential (Agustina et al., 2012; Hofman et al. 2006). The first question we address is whether there is a “needs-based” allocation of DAU block grants or transfers to district governments (denoted by Td). It is important to bear in mind that the DAU transfers from the central government to the districts do not include the “deconcentrated” spending by the central government on poverty alleviation programs such as the household-level conditional cash transfer program (PKH) or the incentivized community-level block grant program (PNPM Generasi).10
Recognizing that district “needs” can be defined in many different ways our analysis defines “need” according to the stunting rate prevailing in the district.
FIGURE 3. STUNTING RATES IN INDONESIA 2007 TO 2013
4348 49
42 44 43 40 39 39 37 35 33 3328 29
Perc
enta
ge o
f chi
ldre
n w
ith
HA
Z <
-2 S
D
1 2 3 4 5
Stunting in children 0 to 59 monthsBy wealth quintile
39 3833
44 41 40
Perc
enta
ge o
f chi
ldre
n w
ith
HA
Z <
-2 S
D
0-23 months 24-59 months
Stunting in children 0 to 59 monthsBy Age
2007 2010 2013
Source: Author estimates based on 2007, 2010 and 2013 RISKESDAS.
9 In 2004, for example, DAU accounted for an average of 64 per cent of total revenues..
10 PKH stands for Program Keluarga Harapan or Hopeful Family Program and PNPM Generasi stands for Program Nasional Pemberdayaan Masyarakat Generasi Sehat dan Cerdas or the National Program for Community Empowerment. Spending at the district level on PKH and PNPM Generasiis “deconcentrated” meaning that district level officials have responsibility for the implementation of these programs following the selection criteria and implementation guidelines provided by authorities in the central government.
7
Chapter 2.
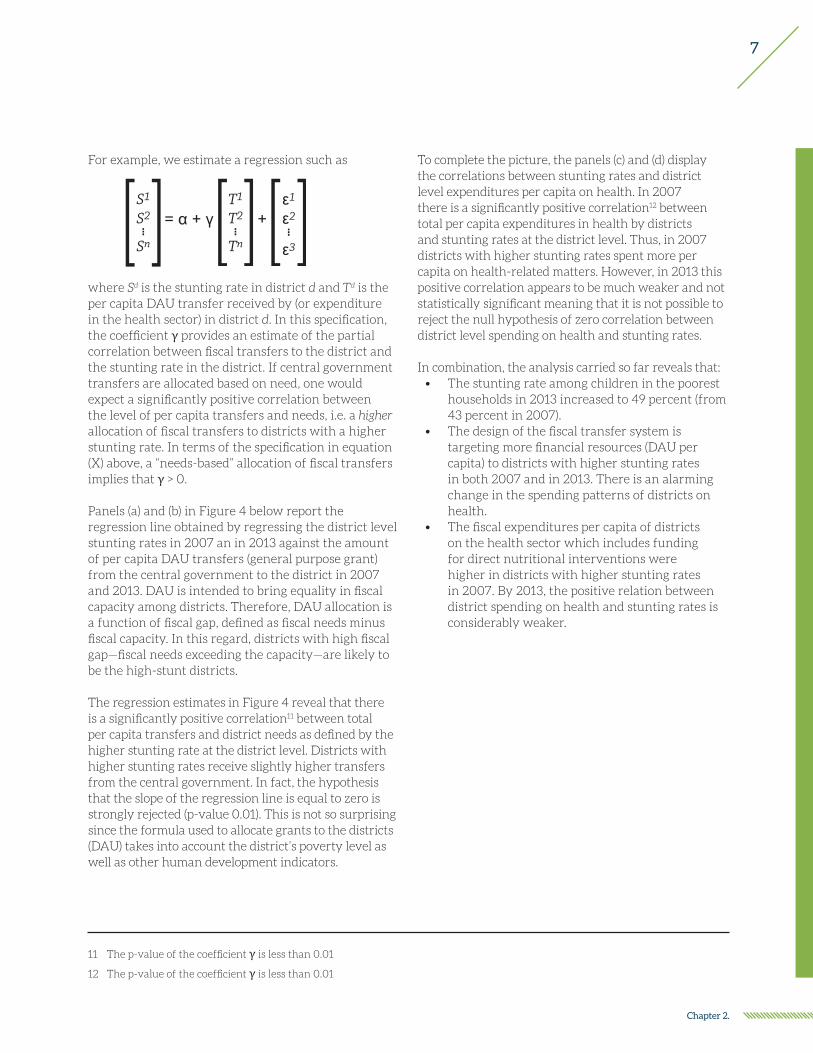
For example, we estimate a regression such as
where Sd is the stunting rate in district d and Td is the per capita DAU transfer received by (or expenditure in the health sector) in district d. In this specification, the coefficient γ provides an estimate of the partial correlation between fiscal transfers to the district and the stunting rate in the district. If central government transfers are allocated based on need, one would expect a significantly positive correlation between the level of per capita transfers and needs, i.e. a higher allocation of fiscal transfers to districts with a higher stunting rate. In terms of the specification in equation (X) above, a “needs-based” allocation of fiscal transfers implies that γ > 0.
Panels (a) and (b) in Figure 4 below report the regression line obtained by regressing the district level stunting rates in 2007 an in 2013 against the amount of per capita DAU transfers (general purpose grant) from the central government to the district in 2007 and 2013. DAU is intended to bring equality in fiscal capacity among districts. Therefore, DAU allocation is a function of fiscal gap, defined as fiscal needs minus fiscal capacity. In this regard, districts with high fiscal gap—fiscal needs exceeding the capacity—are likely to be the high-stunt districts.
The regression estimates in Figure 4 reveal that there is a significantly positive correlation11 between total per capita transfers and district needs as defined by the higher stunting rate at the district level. Districts with higher stunting rates receive slightly higher transfers from the central government. In fact, the hypothesis that the slope of the regression line is equal to zero is strongly rejected (p-value 0.01). This is not so surprising since the formula used to allocate grants to the districts (DAU) takes into account the district’s poverty level as well as other human development indicators.
To complete the picture, the panels (c) and (d) display the correlations between stunting rates and district level expenditures per capita on health. In 2007 there is a significantly positive correlation12 between total per capita expenditures in health by districts and stunting rates at the district level. Thus, in 2007 districts with higher stunting rates spent more per capita on health-related matters. However, in 2013 this positive correlation appears to be much weaker and not statistically significant meaning that it is not possible to reject the null hypothesis of zero correlation between district level spending on health and stunting rates.
In combination, the analysis carried so far reveals that:• The stunting rate among children in the poorest
households in 2013 increased to 49 percent (from 43 percent in 2007).
• The design of the fiscal transfer system is targeting more financial resources (DAU per capita) to districts with higher stunting rates in both 2007 and in 2013. There is an alarming change in the spending patterns of districts on health.
• The fiscal expenditures per capita of districts on the health sector which includes funding for direct nutritional interventions were higher in districts with higher stunting rates in 2007. By 2013, the positive relation between district spending on health and stunting rates is considerably weaker.
11 The p-value of the coefficient γ is less than 0.01
12 The p-value of the coefficient γ is less than 0.01

8
Operationalizing a Multi-Sectoral Approach for the Reduction of Stunting
FIGURE 4. DISTRICT FINANCES AND DISTRICT STUNTING RATES
Source: District-level Stunting Rates for 2007 and 2013 published by NIHRD. District level DAU transfers and health expenditures in 2007 and 2013 obtained from the DAPOER data base The World Bank
(a): District-level DAU Transfer (per capita) and District Stuntingin 2007
(b): District-level DAU Transfer (per capita) and District Stuntingin 2013
(c): District-level Expenditure (per capita) on Health and District Stunting Rates in 2007
(d): District-level Expenditure (per capita) on Health and District Stunting Rates in 2013
2040
6080
Stun
ting
Rat
e fr
om R
iske
sdas
Dat
a
12 13 14 15 16 17Log of Per capita DAU
n = 432 RMSE = 8.7828774
stunt_data = -10.608 + 3.3358 lrpc_DAU R2 = 7.4%
020
4060
80st
unti
ng8 10 12 14 16 18
Log of Per capita DAUn = 463 RMSE = 8.849954
stunting = .38347 + 2.7302 lrpc_DAU R2 = 6.3%
2030
4050
60
Stun
ting
Rat
e fr
om R
iske
sdas
Dat
a
9 10 11 12 13 14
Log of Per capita Health Function Expendituren = 295 RMSE = 8.7366433
stunt_data = 4.4239 + 2.6362 lrpc_hea~h R2 = 5.0%
020
4060
80st
unti
ng
8 10 12 14 16Log of Per capita Health Function Expenditure
n = 414 RMSE = 9.0539997
stunting = 32.602 + .51988 lrpc_hea~h R2 = 0.2%

9
Chapter 3.
MATERNAL AND CHILDUNDERNUTRITION
Inadequate healthservices
Unhealthy householdenvironment
Inadequate care andfeeding practices
Household foodinsecurity
UNDERLYINGcauses
Intergenerationalconsequences
Long-term consequences:Adult height, cognitive ability, economicproductivity, reproductive performance,overweight and obesity, metabolic and
cardiovascular diseases
Short-term consequences:Mortality, morbidity, disability
BASICcauses
Household access to adequate quantity and quality of resources:Land, education, employment, income, technology
Inadequate financial, human, physical and social capital
Social cultural, economic and political context
IMMEDIATEcauses DiseasesInadequate dietary intake
Chapter 3.
Methodological FrameworkThe conceptual framework summarized in Figure 5 views malnutrition as the consequence of a variety of interlinked and interrelated events. The causes of malnutrition are classified into three hierarchical categories: the immediate causes, the underlying causes, and the basic causes of malnutrition. In any given context identification of the immediate causes of malnutrition (disease or inadequate dietary intake) is useful for guiding policy actions especially in situations of crises. However, disease and inadequate dietary intake are typically consequences of a variety of underlying drivers that are interrelated. For conceptual simplicity the underlying causes of malnutrition are themselves grouped into the four
clusters: (a) inadequate household food security, (b) inadequate care and feeding practices, (c) unhealthy household environment, and (d) inadequate health services. The basic causes of malnutrition summarize the social, cultural, economic and political context and the prevailing inequalities in the distribution of resources in the society. In combination these contextual or structural factors play a fundamental role in the extent to which there are inequalities among households and their members in having adequate food security, care and feeding practices, healthy environment and adequate health services (i.e., the underlying causes of malnutrition).
FIGURE 5. DETERMINANTS OF CHILD NUTRITION
Source: An adaptation of the UNICEF (1990) “Strategy for Improved Nutrition of Children and Women in Developing Countries”

10
Operationalizing a Multi-Sectoral Approach for the Reduction of Stunting
Since its conception this conceptual framework has been revised and extended in various dimensions. Various international organizations have adopted as well as adapted this framework. For example, FAO (2011) discusses adaptation of this framework for FAO’s nutrition analysis. USAID - FANTA (Food and Nutrition Technical Assistance) also adapted this framework (Riely et al., 1999). World Food Program (WFP) refers to it as the Food and Nutrition Security Conceptual Framework in its Emergency Food Security Assessment Handbook (WFP, 2009, pg. 25). However, regardless of the adaptations and the extensions to the original framework, the fundamental ideas regarding the critical interactions, interrelations and synergies among food security, environment and health, and care have remained at the core. This is also very transparent in the framework for actions to achieve optimum fetal and child nutrition and development extracted from the 2013 Lancet Maternal and Child Nutrition Series (see Figure 6).
The first underlying driver of nutrition is access to adequate food security. A child is food secure when at all times, they have physical, social and economic access to sufficient, safe and nutritious food that meets their dietary needs and food preferences for an active and healthy life (FAO). The ideal measure encompasses three broad factors. First, a comprehensive measure takes into account the availability of food. In general, this component measures the supply of food at the national (or regional) level and is based on agricultural production and food trade balance relative to the country’s size. Second, the measure captures the household specific and individual specific access to the available food. That is, given household’s income and the prices of food at local markets, what range of food choices does the household have available for them. And within the household, how does the food get distributed. Third, the measure captures the quality of the actual food choices made by the household. That is, it measures whether or not the diet and cooking methods provide all the necessary micro and macronutrients needed for healthy growth.
The second underlying driver of nutrition is access to adequate care. This driver measures the ability of the primary caregiver to provide a safe and appropriate environment for the child to grow and develop. Ideally the measure is based on the child’s caregivers’ (1) knowledge, practices and beliefs regarding childcare, (2) health and nutritional status, (3) mental health,
stress level, and self-confidence, (4) autonomy and control of resources, (5) workload and time constraints, (6) social support received from family and community.
The third underlying driver of nutrition is access to a healthy environment. The driver measures the child’s exposure to pathogens in the physical environment where they live. The measure is based on the definitions adopted by WHO / UNICEF Joint Monitoring Program (JMP) and as part of monitoring the Sustainable Development Goals and include components on (1) access to improved drinking water (2) access to improved sanitation, (3) adequate hand washing practices, (4) adequate disposal of child’s feces. Given that it is not only the child’s immediate environment, i.e. the facilities at the dwelling unit, but also those in the immediate neighborhood which affect the degree of exposure to pathogens, especially community-wide access to improved sanitation is a fundamental component.
The fourth underlying driver of nutrition is access to adequate healthcare. This driver measures the child’s access to skilled medical care to minimize the effects of illness and preventively address health issues, especially those linked with malnutrition, such as diarrheal diseases. The measure encompasses the availability and use of healthcare services for pre-natal, birth and post-natal care.
Although the framework is a holistic way of conceptualizing nutrition it is also important to acknowledge some of its limitations. Prices, knowledge, education, and household income all influence components of the four clusters of the framework, resulting in some overlap in the measures. The methodology is informative in finding the overall relationships, from which more focused and detailed analyses can be carried out to determine more concretely the underlying causes. So for example, more detailed information would be needed to determine whether food inadequacies were due to the cost of food relative to income, to lack of information on the importance of diversified diet, or due to some other factor. The models estimated in this report are not reduced form models (taking into account budget constraints etc.) as done in Barrera (1990), but rather correlations between nutritional outcomes as measured by height-for-age Z-scores and having adequate access to the four drivers of nutrition.

11
Chapter 3.
FIGURE 6. FRAMEWORK FOR ACTIONS TO ACHIEVE OPTIMUM FETAL AND CHILD NUTRITION AND DEVELOPMENT
Nutrition sensitive programmers and approaches• Agriculture and food security
• Social safety nets
• Early child development
• Maternal mental health
• Women’s empowerment
• Child protection
• Classroom education
• Water and sanitation
• Health and family planning services
Building and enabling environment• Rigorous evaluations
• Advocacy strategies
• Horizontal and vertical coordination
• Accountability, incentives regulation, legislation
• Leadership programmes
• Capacity investments
• Domestics resource mobilisation
Optimum fetal and child nutrition and development
Benefits during the life course
Morbidity andmortality in childhood
Cognitive, motor,socioemotional development
School performanceand learning capacity
Adult stature
Obesity and NCDs
Work capacityand productivity
Nutrition specificinterventionsand programmers• Adolescent health and
preconception nutrition
• Maternal dietary supplementation
• Micronutrient supplementation or fortification
• Breastfeeding and complementary feeding
• Dietary supplementation for children
• Dietary diversification
• Feeding behaviours and stimulation
• Treatment of severe acute malnutrition
• Disease prevention and management
• Nutrition interventions in emergencies
Breastfeeding, nutrient-rich foods, and eating routine
Feeding and caregiving practices, parenting, stimulation
Low burden of infectious diseases
Food security, including availability, economic access and use of food
Feeding and caregiving resources (maternal, household and community levels
Access to and use of health services, a safe and hygienic environment
Knowledge and evidencePolitics and governance
Leadership, capacity and financial resourcesSocial, economic, political and environemntal context (national and global)
Source: the Executive Summary of “The Lancet Maternal and Child Nutrition Series 2013.”

12
Operationalizing a Multi-Sectoral Approach for the Reduction of Stunting

13
Chapter 4.
Chapter 4.
Measures of Adequate Access to the Determinants of Nutirition Based on the RISKESDAS
We use data from the RISKESDAS 2007 and 2013 surveys collected by the Ministry of Health (NIHRD) and which are representative at the district level. Not all the information collected in each round was similar and thus the adequacy measures developed also differ from 2007 to 2013 making it impossible to directly compare and contrast the measures themselves. However, if a particular component of an adequacy cluster is available in both surveys, the evolution of the components between 2007 and 2013 is analyzed. Furthermore, we also utilize data from the RISKESDAS 2010 for trends in the components common to 2010 and 2007 or 2013. However, the 2010 survey is only representative at the province level and is not analyzed further. Following are descriptions of the components for each of the four nutrition drivers developed for each year followed by a detailed discussion of the prevalence rates of the components. The prevalence rates are discussed at the national level as well as for urban and rural households, households in the bottom 20% of the wealth distribution (B20) and in the top 20% of the wealth distribution (T20), and high-stunt and low-stunt districts, as well as for two age cohorts zero to 23-month olds and 24- to 59-month olds. The wealth index used is that given by the Ministry of Health in each of the datasets. Similarly, the height-for-age Z-scores used are those calculated by the NIHRD. High- and low-stunt districts are assigned based on the distribution of stunting rates across districts and based on the official NIHRD district stunting rates. Those districts with stunting rates in the bottom
25 percent are categorized as low-stunt districts and those in the top 25 percent are categorized as high-stunt districts. The list of high- and low-stunt districts for 2007 and 2013 are given in Appendix A.
Adequate Food SecurityThe Food and Agricultural Organization (FAO) defines food security as “a situation that exists when all people, at all times, have physical, social and economic access to sufficient, safe and nutritious food that meets their dietary needs and food preferences for an active and healthy life”. This definition is a significant departure from previous conceptualizations of food security which focused inordinately on the availability of food at the national or local level. But, in being broad and all encompassing, this definition is also a difficult one to operationalize, as it emphasizes the importance of access and utilization of food just as much as availability (Barrett, 2009).
What constitutes availability, access and utilization – the three dimensions of the current thinking on food security? Availability is associated with the supply side of food, measured most often by the extent of agricultural production and food trade balance relative to the size of consumption for any given country. Access, on the other hand, brings in the demand element to the equation: conditional on what is available in the local market and the price at which it is available, what is the range of food choices that are

14
Operationalizing a Multi-Sectoral Approach for the Reduction of Stunting
open to households given their incomes? Conceptually, it is this dimension of food security that has the strongest resonance with poverty and vulnerability not only because of its direct relationship with income, but also because of its links to broader issues of social and political enfranchisement. Food security of individual household members, for example hinges on their social standing within the household almost as much as it does on the household’s overall ability to procure enough food (vulnerable groups within the household may include children, daughters, daughter-in-law, or the elderly). Finally, the utilization dimension brings to bear the quality dimension of the accessed food. Do household’s make good use of the food they are able to access? Are diets diverse enough to provide all the micro and macronutrients necessary for healthy physiological and cognitive growth? Are cooking methods sanitary and healthy enough to preserve the nutritional attributes of the eaten food?
Of the three dimensions of adequate food security (availability, access, and utilization) we only have variables that allow us to explore the utilization of food either at the household or at the individual level. There are various measures adopted by international organizations that measure the quality of food consumed. For children younger than 24 months the most commonly used measure is the minimum acceptable diet based on a child’s dietary diversity score and number of feedings (WHO, 2008). The measure is based on a 24-hour recall period of all food items consumed which are then categorized into seven different food groups. However, such detailed information was not provided in the Riskesdas surveys and alternative measures of food consumption are used here.
The 2007 RISKESDAS provides information on average caloric and protein intake of the household but not detailed information on child specific food consumption, besides breastfeeding. The first component considered is the average caloric intake per person in the household. The total caloric consumption in the household is divided by the number of adult equivalents living in the household. In order for the household to be considered consuming sufficient quantity of calories, the average has to be at least 84 percent of the 2,100 kcal threshold, or 1,760 kcal. The second component assesses the household’s protein consumption. Again, total protein consumption is divided by adult equivalents and as long as the
average protein consumption is at least 80 percent of the 55-gram threshold (or 44 grams) the household is classified as having access to adequate protein consumption. As the third measure, we consider exclusive breastfeeding for children who are less than six months of age. For this age group it is possible to determine a child specific component, given the WHO recommendation for exclusive breastfeeding until six months of age. The fourth component is constructed so as to be able to compare across the two years. For this measure we use information on the child’s mother’s consumption of fruits and vegetables as a proxy for the dietary diversity of the household and the child. Specifically we assess whether or not the child’s mother has consumed fruits and vegetables five out of seven days of the recall period. This variable is not used in the construction of the adequacy measure for 2007, but presented when comparing the dietary conditions in 2007 and 2013.
The 2013 survey lacks information on detailed food consumption by the household or the child but does have information on breastfeeding practices. The 2013 survey provides far less information on the food consumption than the 2007 survey. The only child specific variable available is breastfeeding. We construct a variable for the children younger than six months of age to indicate whether the young infant was exclusively breastfed. Furthermore, for all children we use information on their mother’s consumption of fruits and vegetables during the seven day recall period to construct a proxy measure of dietary diversity. The diet is considered diverse if the mother consumed fruits at least five of the seven days and vegetables at least five of the seven days.
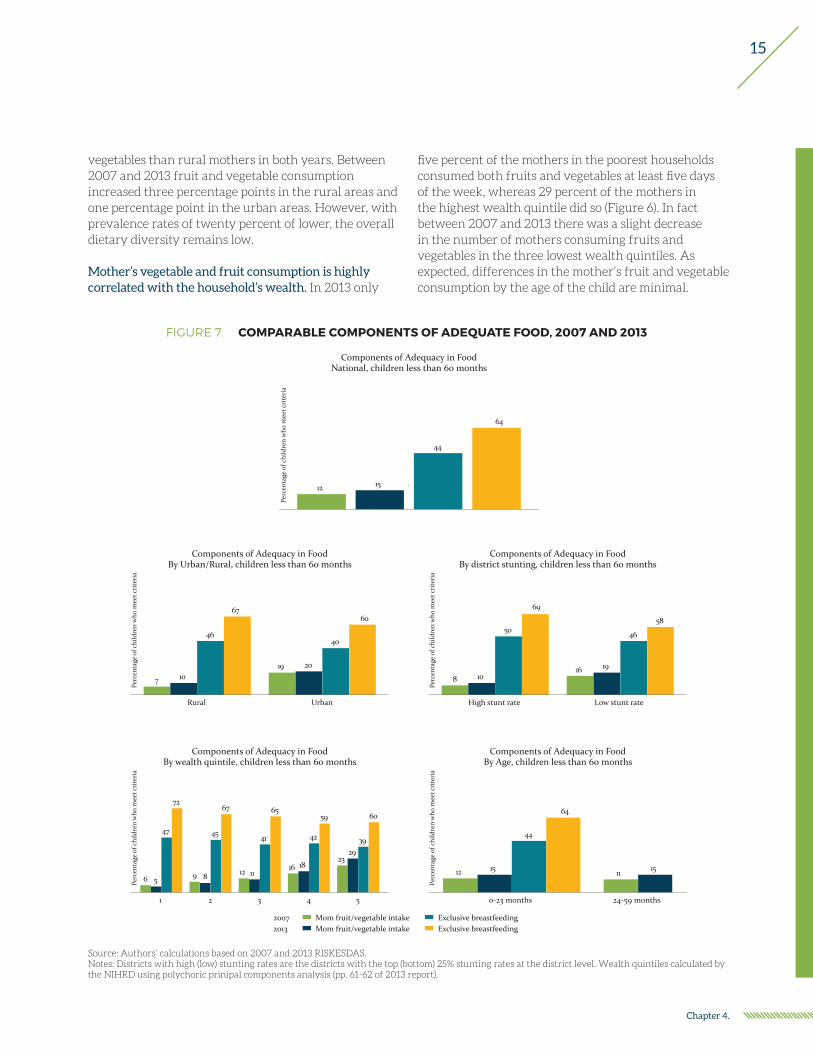
Access to adequate food improved from 2007 to 2013. It is possible to compare exclusive breastfeeding for children younger than six months of age and the mother’s consumption of fruits and vegetables (Figure 6). Nationally from 2007 to 2013, mothers’ fruit and vegetable consumption at least five days of the week increased from 12 percent to 15 percent. In both years, the mother’s fruit and vegetable consumption was higher in the low-stunt districts (the 25% of districts in that particular year with the lowest stunting rates) than in the high-stunt districts (the 25% of districts in that particular year with the highest stunting rates). In the low- and high-stunt districts the measure improved from 2007 to 2013, by two and three percentage points, respectively. Urban mothers consumed more fruits and
15
Chapter 4.
vegetables than rural mothers in both years. Between 2007 and 2013 fruit and vegetable consumption increased three percentage points in the rural areas and one percentage point in the urban areas. However, with prevalence rates of twenty percent of lower, the overall dietary diversity remains low.
Mother’s vegetable and fruit consumption is highly correlated with the household’s wealth. In 2013 only
five percent of the mothers in the poorest households consumed both fruits and vegetables at least five days of the week, whereas 29 percent of the mothers in the highest wealth quintile did so (Figure 6). In fact between 2007 and 2013 there was a slight decrease in the number of mothers consuming fruits and vegetables in the three lowest wealth quintiles. As expected, differences in the mother’s fruit and vegetable consumption by the age of the child are minimal.
FIGURE 7. COMPARABLE COMPONENTS OF ADEQUATE FOOD, 2007 AND 2013
2007 Mom fruit/vegetable intake Exclusive breastfeeding2013 Mom fruit/vegetable intake Exclusive breastfeeding
44
64
12 15
Perc
enta
ge o
f chi
ldre
n w
ho m
eet c
rite
ria
Components of Adequacy in FoodNational, children less than 60 months
69
64
6760
7 10
46
19 20
40
Perc
enta
ge o
f chi
ldre
n w
ho m
eet c
rite
ria
Rural Urban
Components of Adequacy in FoodBy Urban/Rural, children less than 60 months
8 10
50
16 19
46
58
Perc
enta
ge o
f chi
ldre
n w
ho m
eet c
rite
ria
High stunt rate Low stunt rate
Components of Adequacy in FoodBy district stunting, children less than 60 months
6 5
47
72
9 8
45
67
12 11
41
65
16 18
42
59
2329
39
60
Perc
enta
ge o
f chi
ldre
n w
ho m
eet c
rite
ria
1 2 3 4 5
Components of Adequacy in FoodBy wealth quintile, children less than 60 months
12 15
44
11 15
Perc
enta
ge o
f chi
ldre
n w
ho m
eet c
rite
ria
0-23 months 24-59 months
Components of Adequacy in FoodBy Age, children less than 60 months
Source: Authors’ calculations based on 2007 and 2013 RISKESDAS.Notes: Districts with high (low) stunting rates are the districts with the top (bottom) 25% stunting rates at the district level. Wealth quintiles calculated by the NIHRD using polychoric prinipal components analysis (pp. 61-62 of 2013 report).
16
Operationalizing a Multi-Sectoral Approach for the Reduction of Stunting
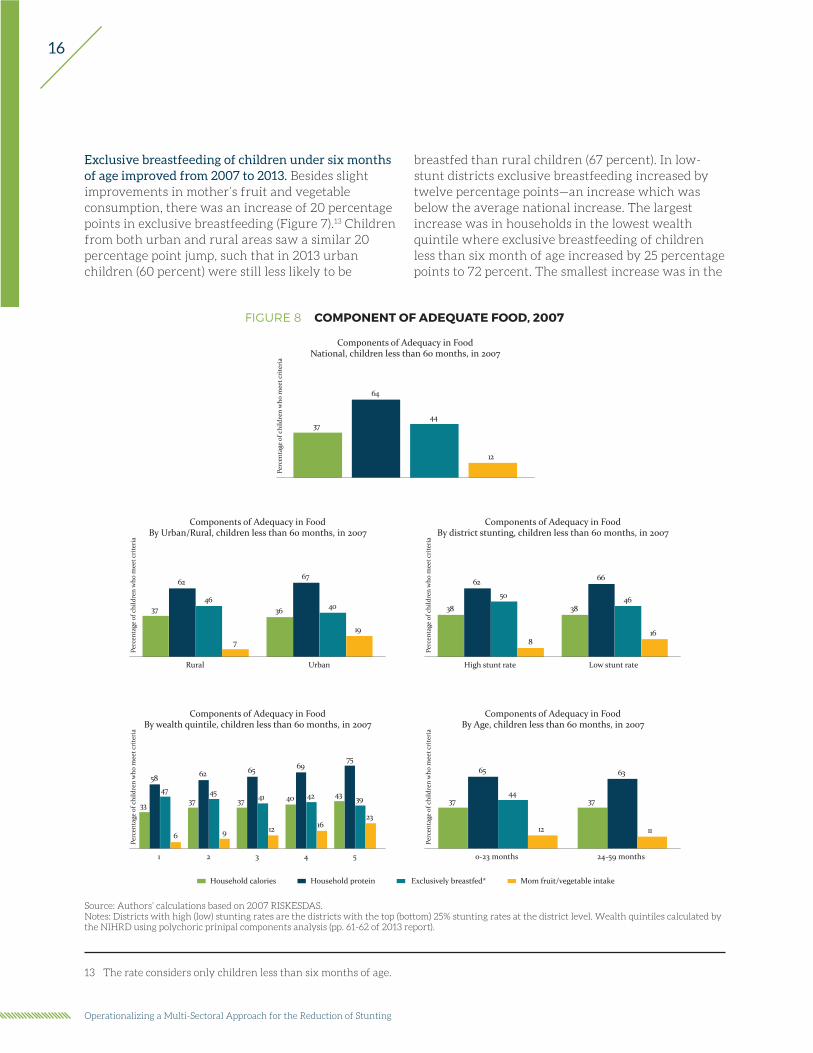
Exclusive breastfeeding of children under six months of age improved from 2007 to 2013. Besides slight improvements in mother’s fruit and vegetable consumption, there was an increase of 20 percentage points in exclusive breastfeeding (Figure 7).13 Children from both urban and rural areas saw a similar 20 percentage point jump, such that in 2013 urban children (60 percent) were still less likely to be
breastfed than rural children (67 percent). In low-stunt districts exclusive breastfeeding increased by twelve percentage points—an increase which was below the average national increase. The largest increase was in households in the lowest wealth quintile where exclusive breastfeeding of children less than six month of age increased by 25 percentage points to 72 percent. The smallest increase was in the
FIGURE 8 COMPONENT OF ADEQUATE FOOD, 2007
Household calories Household protein Exclusively breastfed* Mom fruit/vegetable intake
37
64
44
12
Perc
enta
ge o
f chi
ldre
n w
ho m
eet c
rite
ria
National, children less than 60 months, in 2007Components of Adequacy in Food
37
62
46
7
36
67
40
19
Perc
enta
ge o
f chi
ldre
n w
ho m
eet c
rite
ria
Rural Urban
By Urban/Rural, children less than 60 months, in 2007Components of Adequacy in Food
38
62
50
8
38
66
46
16
Perc
enta
ge o
f chi
ldre
n w
ho m
eet c
rite
ria
High stunt rate Low stunt rate
By district stunting, children less than 60 months, in 2007Components of Adequacy in Food
75
33
5847
6
37
62
45
9
37
65
41
12
40
69
42
16
43 39
23
Perc
enta
ge o
f chi
ldre
n w
ho m
eet c
rite
ria
1 2 3 4 5
By wealth quintile, children less than 60 months, in 2007Components of Adequacy in Food
37
65
44
12
37
63
11
Perc
enta
ge o
f chi
ldre
n w
ho m
eet c
rite
ria
0-23 months 24-59 months
By Age, children less than 60 months, in 2007Components of Adequacy in Food
Source: Authors’ calculations based on 2007 RISKESDAS.Notes: Districts with high (low) stunting rates are the districts with the top (bottom) 25% stunting rates at the district level. Wealth quintiles calculated by the NIHRD using polychoric prinipal components analysis (pp. 61-62 of 2013 report).
13 The rate considers only children less than six months of age.
17
Chapter 4.
fourth wealth quintile where exclusive breastfeeding increased by 17 percentage point. The fourth wealth quintile also had the lowest exclusive breastfeeding rate in 2013 with 59 percent of children less than six months of age being breastfed. In 2007, about 37 percent of children lived in a household where per capita food consumption was adequate and 64 percent in household were protein consumption was adequate. That is, only about a third of household had access to sufficient calories and two-thirds to sufficient amounts of protein. There were no marked differences by location of household or by the age of the child for caloric intake but urban households and households in low-stunt districts are slightly more likely to consume sufficient quantities of protein than rural households or households in high-stunt districts (Figure 8). However, there were differences in both caloric and protein consumption by wealth. A household in the bottom wealth quintile was ten percentage points less likely to have access to adequate calories and 17 percentage points less likely to have access to adequate amount of protein than a household in the top wealth quintile. However, less than half of the households in the top wealth quintile consumed a sufficient amount of calories. Of all the components of adequate food considered access to adequate quantity of protein was most likely met among the Indonesian households. Least likely to be met was frequent consumption of vegetables and fruits, our proxy measure for dietary diversity.
Adequate CareFor adequate care we are able to construct measures of the mother’s (and household’s) knowledge, practices and beliefs regarding child care. Specifically, for both 2007 and 2013 we are able to construct a measure of breastfeeding practices, mother’s stated knowledge of proper hand washing practices, and smoking behaviors by the household head. In 2007 it is possible to determine breastfeeding behaviors for all children younger than 5 years of age. In 2013 the breastfeeding information is only collected for children less than 24 months of age. The other two components are available for all children under five years of age.
The first behavior considered is the mother breastfeeding practices until the child reaches 24 months of age. Based on the recommendations of the WHO (2008), a child should be breastfed for at
last 24 months and the first six months should be exclusive. That is, in the first six months the child should not receive any other food besides mother’s breastmilk. Furthermore the WHO (2008) recommends complementary feedings of solid or semi-solid foods for children six to eight months of age. This information is available for the 2013 survey. From the 2010 RISKESDAS we are also able to construct measures of age-appropriate breast feeding and these are presented for the national level to better gage the trends.
Another component explored is the early initiation of breastfeeding. That is, whether or not the child was put on the mother’s breast within one hour of birth. Namely, the early initiation of breast feeding ensures skin-to-skin contact which keeps the child warm (Moore, Anderson and Bergman, 2007). Furthermore, children who are put on the breast early are more likely to be successfully breastfed (Bramson et al., 2010, Moore et al., 2007). Edmond et al. (2006) find that initiating breastfeeding within one hour of birth is associated with better neonatal survival odds in Ghana, and Mullaney et al. (2008) find similar results for Nepal. Both studies also found smaller, but statistically significant, benefits from initiating breastfeeding within the first 24-hours versus a later initiation time. This information is only available for 2010 and 2013.
The hygienic behavior of the mother can be measured across the 2007 and 2013 RISKESDAS surveys. The measure is based on the mother’s self-reported hand washing actions for three different events: (1) before eating, (2) before preparing a meal, (3) after defecating or after anal cleansing of a baby. For the mother to be considered knowledgeable she must wash her hands with soap after each of these three events. In addition for 2007 specific analyses knowledge of proper hand washing techniques also includes mother’s actions after holding and touching animals. That is child is considered to receive adequate care if the mother washes hands after all four events. In turn for 2013, the hygienic component includes the mother’s hand washing behavior: (1) whenever her hands are dirty, (2) after defecation, (3) after using pesticides or insecticides and (4) before milk-feeding the baby as well as the three before mentioned events.
The smoking habits of the household are the last behavior considered. In comparing across 2007 and 2013 surveys we determine the smoking status of the head of the household. The head is considered a smoker if they currently smoke daily or sometimes. For 2013 we can

18
Operationalizing a Multi-Sectoral Approach for the Reduction of Stunting
ascertain if anyone in the household smokes and we also consider this measure in the year specific analyses.
Breastfeeding behaviors have improved from 2007 to 2013 with the majority of the improvement occurring before 2010. Nationally, age-appropriate breastfeeding—that is children younger than six months being exclusively breastfed and those six months to 23 months breastfed—went from 37 percent to 69 percent from 2007 to 2013 (Figure 9). However, the breastfeeding rate was even slightly higher in 2010 at 74 percent, suggesting a potential downward trend in this behavior. Breastfeeding rates were higher in rural areas in both 2007 and 2013. However, in 2007 breastfeeding was one percentage point higher in low-stunt districts than in high-stunt districts, but by 2013 breastfeeding had increased by 35 percentage points in the high-stunt districts and only by 28 percentage points in low-stunt districts such that in 2013 breastfeeding was more prevalent in high-
stunt districts than in low-stunt districts. In terms of wealth, consistently across the years the bottom wealth quintile has the highest breastfeeding rate and the highest wealth quintile the lowest. However, in 2007 the difference between the two quintiles was only eight percentage points but it had grown to 12 percentage points by 2013.
The early initiation of breastfeeding has also increased. In 2010, twenty-nine percent of children were put on the breast within the first hour of birth, whereas in 2013 the number had risen to 37 percent (Figure 9). The rates are similar in rural and urban settings and in high and low-stunt districts. In 2010 fewer children from wealthier households were put on the breast immediately than children from poorer households. However in 2013 the reverse was true, such that 38 percent of children from the top wealth quintiles were put on breast whereas 35 percent of children from the bottom quintile received breastmilk within the first hour of birth. All in all, the
2937 37
7469
51
Perc
enta
ge o
f chi
ldre
n w
ho m
eet c
rite
ria National, children less than 24 months
Components of Adequacy in Care
36 32
72
4938
23
66
53
Perc
enta
ge o
f chi
ldre
n w
ho m
eet c
rite
ria By Urban/Rural, children less than 24 monthsComponents of Adequacy in Care
3630
71
48
3630
6554
Perc
enta
ge o
f chi
ldre
n w
ho m
eet c
rite
ria
High stunt rate Low stunt rate
By district stunting, children less than 24 monthsComponents of Adequacy in Care
Source: Author estimates based on 2007, 2010 and 2013 RISKESDAS.Notes: *Appropriate fed: 0-5 month olds exclusive; **For 6-8 month olds.
Perc
enta
ge o
f chi
ldre
n w
ho m
eet c
rite
ria
323531
8074
46
3036
29
7973
49
2838
29
7371
53
2837
26
696654
2638
23
596250
1 2 3 4 5
By wealth quintile, children less than 24 monthsComponents of Adequacy in Care
2007 Breastfed*2010 Early breastfeeding Breastfed*2013 Early breastfeeding Breastfed* Complimentary**
Source: Authors’ calculations based on 2010 and 2013 RISKESDAS.Notes: Districts with high (low) stunting rates are the districts with the top (bottom) 25% stunting rates at the district level. Wealth quintiles calculated by the NIHRD using polychoric prinipal components analysis (pp. 61-62 of 2013 report).
FIGURE 9. COMPARISON OF FEEDING PRACTICES FOR ADEQUATE CARE, 2007, 2010 AND 2013
19
Chapter 4.
rate of early initiation of breastfeeding remains low and the improvements have been much smaller than for age-appropriate breastfeeding even though the action itself is of much shorter duration.
In 2013, about half of all children aged six to eight months received complementary solid or semi-solid foods. The rate was slightly higher among urban children and children from low-stunt districts (Figure 9). The highest rate of complementary feedings for six to eight month olds were in third and fourth wealth quintiles. Reliable complimentary feedings are only available for the 2013 sample so it is not possible to determine how rate has changed through time.
There were significant improvements in mother’s hygienic behavior between 2007 and 2013. Nationally, mother’s reported hand washing in the three common events increased from 38 percent to 67 percent (Figure 10). In both years, mothers in high-stunt districts were less likely to wash their hands than mothers in low-stunt districts. In both types of districts there was about 25 percent improvement in mothers’ hand washing behaviors between the two years. Furthermore, rural mothers were less likely to report handwashing than urban mothers but in both areas the reported hand washing practices improved 29 and 25 percentage points, respectively. Mothers living in households in the top wealth quintile were more likely to wash their hands than mothers living in households in the lowest wealth quintile in both 2007 and 2013 (Figure 10). In 2007 the gap was 13 percentage points and by 2013 the gap had grown to 27 percentage points. In 2013 mothers of younger children were slightly more likely to report washing hands with soap in the three comparison events than mothers of older children.
Between 2007 and 2013, smoking by the head of the household reduced by three percentage points. The national smoking rate in 2007 was 73 percent and in 2013 it was 70 percent (Figure 10). Household heads in rural areas or in a high-stunt rate districts were more likely to smoke than those in urban areas or in low-stunt districts. The rate of smoking decreases with wealth quintiles and for most subpopulations considered, smoking rates decreased between 2007 and 2013. However, there was a slight increase in smoking in the bottom two wealth quintiles.
For 2013 the adequate care component most lacking was living in a non-smoking household and most likely to be met was age-appropriate breast feeding. Nationally 29 percent of children younger than 36 months of age lived in a household where no one smoked, 37 percent were breastfed within an hour of birth, 43 percent had mothers who washed their hands after the six events considered,14 and 69 percent are age-appropriately breast fed (Figure 11). Of the six- to eight-month old children 51 percent received complementary feedings. Immediate breastfeeding was similar across rural and urban households. Rural mothers were more likely to appropriately breastfeed than urban mothers, but urban mothers were more likely to give complementary feedings to children aged six to eight months of age and to report proper hand washing practices. In high-stunt districts 71 percent of children zero to 24 months were breastfed whereas in low-stunt districts 65 percent were breastfed. In low-stunt districts 54 percent of six- to eight-month-olds received complementary feedings and 45 percent had mothers with adequate hygienic behaviors. For the high-stunt districts the percentages were lower at 48 percent and 36 percent, respectively. By wealth quintile, children in poorer households were more likely to be breastfed, and less likely to receive complementary feedings or have mothers who washed their hands than children in the wealthier households. That is, in the more vulnerable populations—children in high-stunt districts or children in poorer households—access to complementary feedings, handwashing and a smoke-free household were less likely than for children in low-stunt districts or from wealthier households.
Adequate HealthThe adequate health measure is composed of measures of capturing access and use of health services during the pre-natal, birth and post-natal periods. The WHO (2007) recommends that the mother be seen in at least four pre-natal visits prior to giving birth. For the 2007 RISKESDAS we can only ascertain whether or not the mother went to at least one pre-natal visit but for 2013 we are able to construct a measure based on the actual number of visits. For 2013 it is possible to determine if the child’s delivery was assisted by a health professional. Those considered as skilled health
14 For the 2013 analyses the hand washing behaviors are expanded to include hand washing prior to:(1) whenever her hands are dirty, (2) after using pesticides/insecticides, and (3) before milk-feeding the baby

20
Operationalizing a Multi-Sectoral Approach for the Reduction of Stunting
FIGURE 10. COMPARISON OF HOUSEHOLD CARE PRACTICES, 2007 AND 2013
Source: Authors’ calculations based on 2007 and 2013 RISKESDAS.Notes: Districts with high (low) stunting rates are the districts with the top (bottom) 25% stunting rates at the district level. Wealth quintiles calculated by the NIHRD using polychoric prinipal components analysis (pp. 61-62 of 2013 report).
2007 Mother's handwashing No smoking2013 Mother's handwashing No smoking
38
67
27 30Pe
rcen
tage
of c
hild
ren
who
mee
t cri
teri
a
National, children less than 60 monthsComponents of Adequacy in Care
33
62
24 27
48
73
31 33
Perc
enta
ge o
f chi
ldre
n w
ho m
eet c
rite
ria
Rural Urban
By Urban/Rural, children less than 60 monthsComponents of Adequacy in Care
31
57
26 27
46
73
2934
Perc
enta
ge o
f chi
ldre
n w
ho m
eet c
rite
ria
High stunt rate Low stunt rate
By district stunting, children less than 60 monthsComponents of Adequacy in Care
34
50
25 23
37
63
26 24
39
68
26 28
43
72
29 32
47
77
3140
Perc
enta
ge o
f chi
ldre
n w
ho m
eet c
rite
ria
1 2 3 4 5
By wealth quintile, children less than 60 monthsComponents of Adequacy in Care
39
69
27 3138
66
27 30
Perc
enta
ge o
f chi
ldre
n w
ho m
eet c
rite
ria
0-23 months 24-59 months
By Age, children less than 60 monthsComponents of Adequacy in Care

21
Chapter 4.
professionals are a doctor, a nurse or a midwife. For post-natal care there are several variables that are included. The first measure captures whether or not the child was seen for a neonatal checkup and it can be constructed for 2007 (for those under 12 months of age) and for 2013 (for those under 36 months of age). The second post-natal component measures adherence to the national immunization schedules for BCG, oral polio, DPT, and measles and is available for all three years. In the construction of this variable we follow the Immunization Guidelines by the Ministry of Health (1997). While immunizations themselves may not have a direct positive effect on a child’s height, the component is introduced as a proxy for the availability and use of health care services. The third post-natal component, available for all three years, measures whether or not a child older than six months of age has received a vitamin A supplement in the past six months, as recommended by the Health Ministry.
Between 2007 and 2013 there were large improvements in immunization rates. Of the adequate health components available for all children under 60 months of age it is possible to compare adherence to immunization schedules for all children and Vitamin A supplementation for those 7 months or older across the two survey years (Figure 12). Nationally up to date immunizations more than doubled from 25 percent of children to 62 percent of children, with the main improvement occurring between 2007 and 2010 with 55 percent of children immunized in 2010. Vitamin A supplementation also increased from 72 percent to 76 percent for children seven to 59 months of age. Vitamin A supplementation in 2010 was slightly lower, at 70 percent, than in 2007. As with many of the other measures analyzed, children living in high-stunt districts had lower levels of access to these health components than children living in low-stunt districts.
36
72
4940
26
38
66
5345
33
Perc
enta
ge o
f chi
ldre
n w
ho m
eet c
rite
ria
Rural Urban
By urban/rural, children less than 36 monthsComponents of Adequacy in Care, 2013
Source: Author estimates based on 2013 RISKESDAS.Note: *For 0- to 24-month-olds; **For 6- to 8-month-olds
36
71
48
3627
36
6554
4534
Perc
enta
ge o
f chi
ldre
n w
ho m
eet c
rite
ria
High stunt rate Low stunt rate
By district stunting, children less than 36 monthsComponents of Adequacy in Care, 2013
Early breastfeeding* Appropriate breastfeeding* Complementary**Handwashing Smoke-free
35
74
46
3223
36
73
4939
24
38
71
5344
2737
66
5445
3238
62
50 50
38
Perc
enta
ge o
f chi
ldre
n w
ho m
eet c
rite
ria
1 2 3 4 5
By wealth quantile, children less than 36 monthsComponents of Adequacy in Care, 2013
National, children less than 36 monthsComponents of Adequacy in Care, 2013
37
69
5143
29
Perc
enta
ge o
f chi
ldre
n w
ho m
eet c
rite
ria
FIGURE 11. COMPONENTS OF ADEQUATE CARE, 2013
Source: Authors’ calculations based on 2013 RISKESDAS.Notes: Districts with high (low) stunting rates are the districts with the top (bottom) 25% stunting rates at the district level. Wealth quintiles calculated by the NIHRD using polychoric prinipal components analysis (pp. 61-62 of 2013 report).
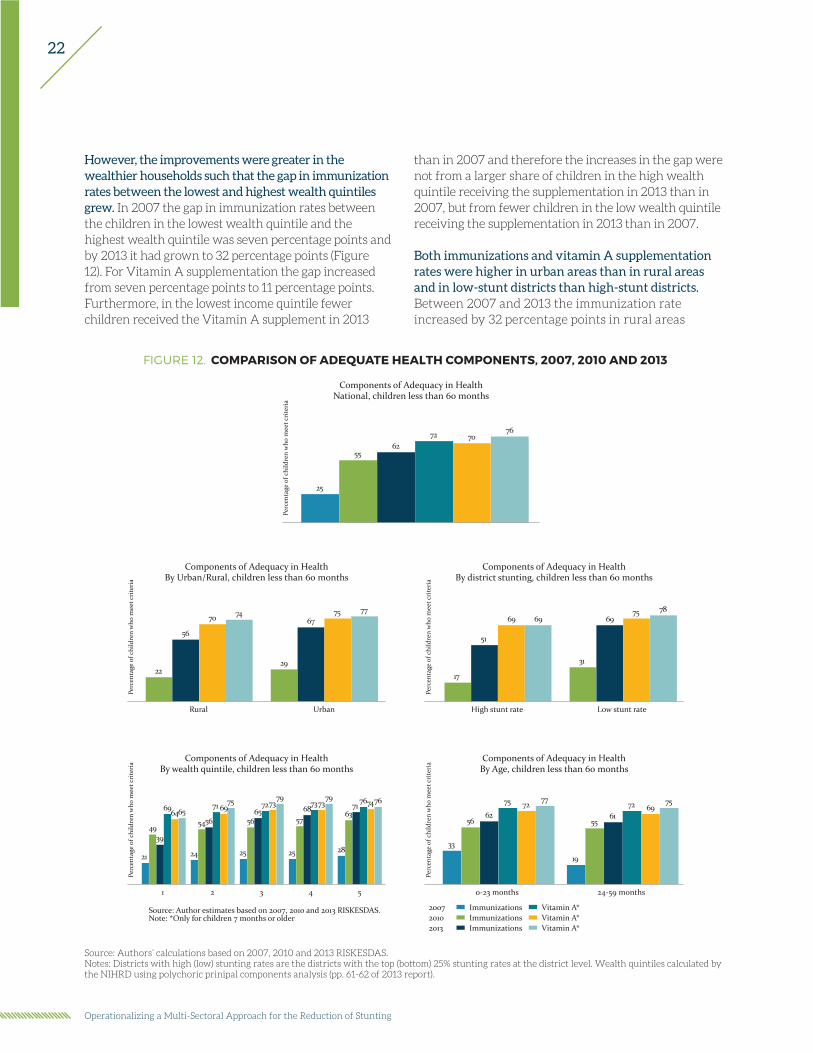
22
Operationalizing a Multi-Sectoral Approach for the Reduction of Stunting
However, the improvements were greater in the wealthier households such that the gap in immunization rates between the lowest and highest wealth quintiles grew. In 2007 the gap in immunization rates between the children in the lowest wealth quintile and the highest wealth quintile was seven percentage points and by 2013 it had grown to 32 percentage points (Figure 12). For Vitamin A supplementation the gap increased from seven percentage points to 11 percentage points. Furthermore, in the lowest income quintile fewer children received the Vitamin A supplement in 2013
than in 2007 and therefore the increases in the gap were not from a larger share of children in the high wealth quintile receiving the supplementation in 2013 than in 2007, but from fewer children in the low wealth quintile receiving the supplementation in 2013 than in 2007.
Both immunizations and vitamin A supplementation rates were higher in urban areas than in rural areas and in low-stunt districts than high-stunt districts. Between 2007 and 2013 the immunization rate increased by 32 percentage points in rural areas
Source: Author estimates based on 2007, 2010 and 2013 RISKESDAS.Note: *Only for children 7 months or older
2007 Immunizations Vitamin A*2010 Immunizations Vitamin A*2013 Immunizations Vitamin A*
25
5562
72 7076
Perc
enta
ge o
f chi
ldre
n w
ho m
eet c
rite
ria
National, children less than 60 monthsComponents of Adequacy in Health
22
56
70 74
29
6775 77
Perc
enta
ge o
f chi
ldre
n w
ho m
eet c
rite
ria
Rural Urban
By Urban/Rural, children less than 60 monthsComponents of Adequacy in Health
17
51
69 69
31
6975 78
Perc
enta
ge o
f chi
ldre
n w
ho m
eet c
rite
ria
High stunt rate Low stunt rate
By district stunting, children less than 60 monthsComponents of Adequacy in Health
21
4939
696465
24
5456
71 6975
25
5665
727379
25
5768
737379
28
6371
767476
Perc
enta
ge o
f chi
ldre
n w
ho m
eet c
rite
ria
1 2 3 4 5
By wealth quintile, children less than 60 monthsComponents of Adequacy in Health
33
5662
75 7277
19
5561
72 6975
Perc
enta
ge o
f chi
ldre
n w
ho m
eet c
rite
ria
0-23 months 24-59 months
By Age, children less than 60 monthsComponents of Adequacy in Health
Source: Authors’ calculations based on 2007, 2010 and 2013 RISKESDAS.Notes: Districts with high (low) stunting rates are the districts with the top (bottom) 25% stunting rates at the district level. Wealth quintiles calculated by the NIHRD using polychoric prinipal components analysis (pp. 61-62 of 2013 report).
FIGURE 12. COMPARISON OF ADEQUATE HEALTH COMPONENTS, 2007, 2010 AND 2013

23
Chapter 4.
and by 38 percentage points in urban areas, further widening the immunization gap (Figure 12). In the low-stunt districts the immunization rate improved by 38 percentage points, whereas in the high-stunt districts by slightly less, 34 percentage points.
In terms of the child’s age, the older children have seen greater improvements in both immunization status and vitamin A supplementation from 2007 to 2013. In 2007 only 19 percent of children 24 to 59 months of age were up to date on their vaccinations; in 2013 the percentage had risen to 61 percent (Figure 12), or in other words, the rate more than tripled. These are sizable improvements. However, still nearly 40 percent of children did not receive the complete set of immunizations.
For 2007 it is possible to also look at prenatal visits and post-natal checkup visits for children less than 12 months of age. In the high-stunt districts the prevalence of the health components was lower than in low-stunt
districts (Figure 13). In high-stunt districts 82 percent of mothers had gone to at least one prenatal visit whereas in low-stunt districts 90 percent of mothers had been seen by a medical professional prior to giving birth. Similarly, 62 percent of the infants had been seen by a doctor after birth in high-stunt districts whereas 70 percent had been seen by a doctor in low-stunt districts. These comparisons suggest that in 2007 the use of health care infrastructure was greater in the low-stunt districts. Furthermore, the use of health care increased with increased wealth such that 91 percent of mothers in the wealthiest quintile went to a prenatal checkup whereas only 80 of mothers in the poorest households did so. Similarly, 75 percent of children from wealthier households went to a post-natal checkup whereas only 59 percent of children from the poorest households were evaluated after birth. These differences in use may also reflect differences in access to health infrastructure. In 2013, more than four-fifths of children less than 36 months of age were seen at least 4 times prenatally
By Urban/Rural, children less than 60 months, in 2007Components of Adequacy in Health
Source: Author estimates based on 2007 RISKESDAS.Note: *Only for over 7-month-olds
Prenatals Growth Immunizations Vitamin A*
86
67
25
72
Perc
enta
ge o
f chi
ldre
n w
ho m
eet c
rite
ria
National, children less than 60 months, in 2007Components of Adequacy in Health
81
62
28
70
94
74
35
75
Perc
enta
ge o
f chi
ldre
n w
ho m
eet c
rite
ria
Rural Urban
82
62
17
69
90
70
31
75
Perc
enta
ge o
f chi
ldre
n w
ho m
eet c
rite
ria
High stunt rate Low stunt rate
By district stunting, children less than 60 months, in 2007Components of Adequacy in Health
80
59
21
69
84
65
24
71
87
67
25
72
89
70
25
73
91
75
28
76
Perc
enta
ge o
f chi
ldre
n w
ho m
eet c
rite
ria
1 2 3 4 5
By wealth quintile, children less than 60 months, in 2007Components of Adequacy in Health
Source: Authors’ calculations based on 2007 RISKESDAS.Notes: Districts with high (low) stunting rates are the districts with the top (bottom) 25% stunting rates at the district level. Wealth quintiles calculated by the NIHRD using polychoric prinipal components analysis (pp. 61-62 of 2013 report).
FIGURE 13. COMPONENTS OF ADEQUATE HEALTH, 2007
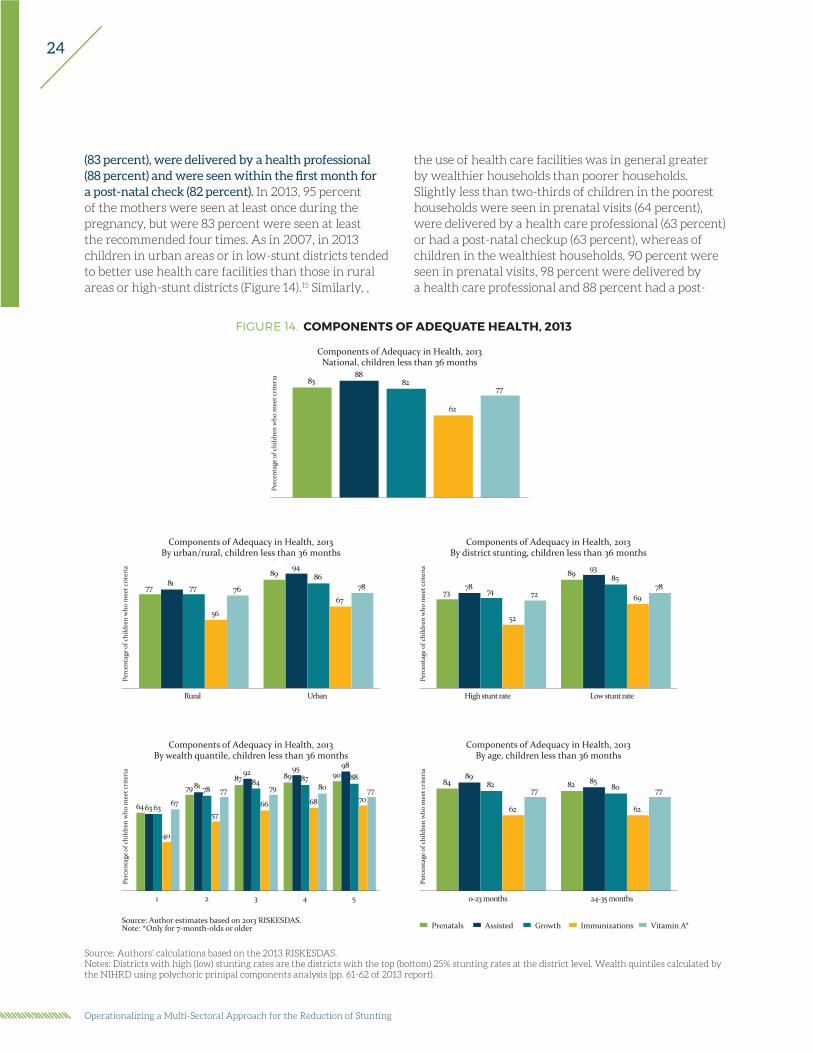
24
Operationalizing a Multi-Sectoral Approach for the Reduction of Stunting
(83 percent), were delivered by a health professional (88 percent) and were seen within the first month for a post-natal check (82 percent). In 2013, 95 percent of the mothers were seen at least once during the pregnancy, but were 83 percent were seen at least the recommended four times. As in 2007, in 2013 children in urban areas or in low-stunt districts tended to better use health care facilities than those in rural areas or high-stunt districts (Figure 14).15 Similarly, ,
the use of health care facilities was in general greater by wealthier households than poorer households. Slightly less than two-thirds of children in the poorest households were seen in prenatal visits (64 percent), were delivered by a health care professional (63 percent) or had a post-natal checkup (63 percent), whereas of children in the wealthiest households, 90 percent were seen in prenatal visits, 98 percent were delivered by a health care professional and 88 percent had a post-
Source: Author estimates based on 2013 RISKESDAS.Note: *Only for 7-month-olds or older Prenatals Assisted Growth Immunizations Vitamin A*
8388
82
62
77
Perc
enta
ge o
f chi
ldre
n w
ho m
eet c
rite
ria
National, children less than 36 monthsComponents of Adequacy in Health, 2013
77 81 77
56
76
8994
86
67
78
Perc
enta
ge o
f chi
ldre
n w
ho m
eet c
rite
ria
Rural Urban
By urban/rural, children less than 36 monthsComponents of Adequacy in Health, 2013
7378 74
52
72
89 9385
6978
Perc
enta
ge o
f chi
ldre
n w
ho m
eet c
rite
ria
High stunt rate Low stunt rate
By district stunting, children less than 36 monthsComponents of Adequacy in Health, 2013
6463 63
40
67
79 81 78
57
7787
9284
66
7989
9587
68
8090
9888
7077
Perc
enta
ge o
f chi
ldre
n w
ho m
eet c
rite
ria
1 2 3 4 5
By wealth quantile, children less than 36 monthsComponents of Adequacy in Health, 2013
8489
82
62
7782 85
80
62
77
Perc
enta
ge o
f chi
ldre
n w
ho m
eet c
rite
ria
0-23 months 24-35 months
By age, children less than 36 monthsComponents of Adequacy in Health, 2013
Source: Authors’ calculations based on the 2013 RISKESDAS.Notes: Districts with high (low) stunting rates are the districts with the top (bottom) 25% stunting rates at the district level. Wealth quintiles calculated by the NIHRD using polychoric prinipal components analysis (pp. 61-62 of 2013 report).
FIGURE 14. COMPONENTS OF ADEQUATE HEALTH, 2013

25
Chapter 4.
15 These figures may not only reflect the use of but also the availability of health services in the vicinity of the household.
16 We also consider the Government of Indonesia (GoI) definition but do not report the results here.
natal checkup. Based on the age cohorts, the younger cohort was slightly more likely to have benefitted from health facilities than the older cohort, suggesting some improvements in these through time. The fact that 88 percent of children were born with a skilled professional present suggests a potential avenue for promoting behaviors conducive for better nutrition, such as immediate breastfeeding, age-appropriate feeding practices, and handwashing practices.
AdequateEnvironmental Services
There is detailed information for 2010 and 2013 regarding the various components of adequate environment, but not for 2007. For adequate environmental, the two more recent surveys have sufficient information to construct variables in line with the Joint Monitoring Program for Water Supply and Sanitation (JMP) definitions as well as with the proposed components for evaluating progress towards the Sustainable Development Goal (SDG) 6. For 2007 the questions were worded differently and the sanitation and drinking water components are at best weak proxies for the JMP categorization.
For 2007, the components explored for an adequate environment indicator are a modified measure of improved sanitation, a modified measure of safely managed drinking water and a measure of community sanitation. Sanitation is considered improved if the mother’s usual place of defecation is a latrine and the waste water from the dwelling goes outside of the house into a closed area. This definition is not in line with the JMP classification as there is no detailed information on the type of sanitation facility used by the household. Community sanitation is defined as 75% of households in the kecamatan have access to improved sanitation. Safely managed drinking water is defined by the source being at most a 30 minute roundtrip from the dwelling, self-reported availability throughout the year, and self-reported lack of problems in the quality of the water. This definition is not in line with the JMP classification as there is no information on the source of the drinking water.
For 2010 and 2013, the available components to derive an adequate environment indicator are in better alignment with the measures also used to evaluate progress made towards SDGs. The JMP definition for improved sanitation is one “that effectively separates excreta from human contact, and ensure that excreta do not re-enter the immediate household environment” (WHO/UNICEF Joint Monitoring Program for Water Supply and Sanitation, 2015, pg. 20). Basic sanitation is defined as having access to a non-shared facility that is: (1) goose neck to sewage disposal facility (SPAL), (2) Pit/latrine with floor to SPAL, (3) Goose neck to septic tank, or (4) Pit/latrine with floor to septic tank.16 In order to capture the child’s exposure to pathogens in her larger surrounding environment we also consider a measure of community sanitation which is based on 75% of households in the child’s kecamatan having access to improved sanitation.
As per JMP classification, improved drinking water source is considered to be one that “protects drinking water from outside contamination, especially from fecal matter” (WHO/UNICEF Joint Monitoring Program for Water Supply and Sanitation, 2015, pg. 21). Effectively the source of drinking water is considered to be improved if it comes from one of the following: (1) piped water, (3) artesian well or pumped, (3) protected well or spring, or (4) rain water. Furthermore, bottled water is considered improved, but only if the main source of water for washing and cleaning is from an improved source. We consider additional, stricter, definitions of acceptable drinking water. For a household to have access to basic drinking water, in addition to coming from an improved source, as described above, the source must be within a 30 minute roundtrip (including any queuing) from the dwelling. An even more stringent condition is a modification of safely managed water requiring the water to be piped to premises, or if the drinking water is bottled, refill or retail piped water then the main source of water must be piped to premises.
In 2007, 20% of children less than 60 months lived in households with access to improved sanitation, 5% of children live in communities where at least 75% of the households had access to improved sanitation, and 62% lived in households with access to safely
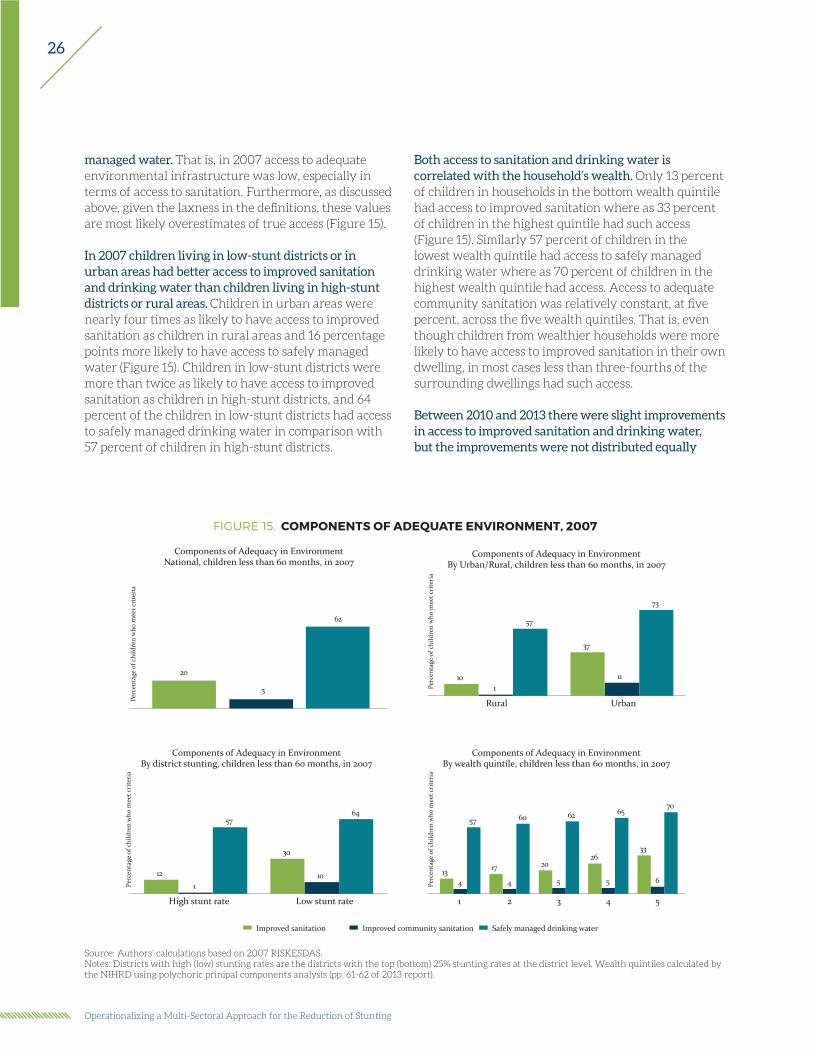
26
Operationalizing a Multi-Sectoral Approach for the Reduction of Stunting
managed water. That is, in 2007 access to adequate environmental infrastructure was low, especially in terms of access to sanitation. Furthermore, as discussed above, given the laxness in the definitions, these values are most likely overestimates of true access (Figure 15).
In 2007 children living in low-stunt districts or in urban areas had better access to improved sanitation and drinking water than children living in high-stunt districts or rural areas. Children in urban areas were nearly four times as likely to have access to improved sanitation as children in rural areas and 16 percentage points more likely to have access to safely managed water (Figure 15). Children in low-stunt districts were more than twice as likely to have access to improved sanitation as children in high-stunt districts, and 64 percent of the children in low-stunt districts had access to safely managed drinking water in comparison with 57 percent of children in high-stunt districts.
Both access to sanitation and drinking water is correlated with the household’s wealth. Only 13 percent of children in households in the bottom wealth quintile had access to improved sanitation where as 33 percent of children in the highest quintile had such access (Figure 15). Similarly 57 percent of children in the lowest wealth quintile had access to safely managed drinking water where as 70 percent of children in the highest wealth quintile had access. Access to adequate community sanitation was relatively constant, at five percent, across the five wealth quintiles. That is, even though children from wealthier households were more likely to have access to improved sanitation in their own dwelling, in most cases less than three-fourths of the surrounding dwellings had such access.
Between 2010 and 2013 there were slight improvements in access to improved sanitation and drinking water, but the improvements were not distributed equally
Source: Authors’ calculations based on 2007 RISKESDAS.Notes: Districts with high (low) stunting rates are the districts with the top (bottom) 25% stunting rates at the district level. Wealth quintiles calculated by the NIHRD using polychoric prinipal components analysis (pp. 61-62 of 2013 report).
Improved sanitation Improved community sanitation Safely managed drinking water
101
57
37
11
73
Perc
enta
ge o
f chi
ldre
n w
ho m
eet c
rite
ria
Rural Urban
By Urban/Rural, children less than 60 months, in 2007Components of Adequacy in Environment
12
1
57
30
10
64
Perc
enta
ge o
f chi
ldre
n w
ho m
eet c
rite
ria
High stunt rate Low stunt rate
By district stunting, children less than 60 months, in 2007Components of Adequacy in Environment
134
57
17
4
60
20
5
62
26
5
65
33
6
70
Perc
enta
ge o
f chi
ldre
n w
ho m
eet c
rite
ria
1 2 3 4 5
By wealth quintile, children less than 60 months, in 2007Components of Adequacy in Environment
20
5
62
Perc
enta
ge o
f chi
ldre
n w
ho m
eet c
rite
ria
National, children less than 60 months, in 2007Components of Adequacy in Environment
FIGURE 15. COMPONENTS OF ADEQUATE ENVIRONMENT, 2007

27
Chapter 4.
across income quintiles. For 2010 and 2013 it is possible to construct adequate environment variables that are more closely aligned with definitions used to assess the Sustainable Development Goals.
Nationally, access to improved sanitation increased from 53 percent to 60 percent (Figure 16). Access to improved drinking water improved from 83 percent to 87 percent and access to basic water improved from 82 percent to 86 percent. However, fewer households in the bottom two wealth quintiles had access to improved sanitation and fewer households in the bottom wealth quintile had access to improved and basic drinking water.17
In general, in 2013 children living in rural areas were less likely to have access to adequate environment than
children living in urban areas. The differences were greater for sanitation measures than for drinking water. In rural areas, 47 percent of children had access to basic sanitation whereas in urban areas 74 percent had such access (Figure 17). Also, urban children as a whole had better access to basic sanitation with 62 percent of children living in communities where at least 75 percent of the households had access to basic sanitation, versus only 27 percent of rural children. Access to improved and basic water was relatively high in both communities, with about 79 percent of rural children having such access and 94 percent of urban children having access to improved and basic water. However, far fewer children had access to safely managed water (effectively piped water to the premises), with about 11 percent of rural children had access to safely managed water and 30 percent of urban children having such access.
17 Given the poor overlap between the survey questions regarding sanitation and drinking water, it is not possible to look at changes between 2007 and 2013 in environmental service variables
Source: Authors’ calculations based on 2010 and 2013 RISKESDAS.Notes: Districts with high (low) stunting rates are the districts with the top (bottom) 25% stunting rates at the district level. Wealth quintiles calculated by the NIHRD using polychoric prinipal components analysis (pp. 61-62 of 2013 report).
30
2
45
26
57
68 69
86 82
95
Perc
enta
ge o
f chi
ldre
n w
ho m
eet c
rite
ria
1 2 3 4 5
By wealth quintile, children less than 60 monthsComponents of Adequacy in Environment - Sanitation
7364
7162
11 7
82818080
17 13
8590
8490
21 18
909488
93
2826
93979296
3635
Perc
enta
ge o
f chi
ldre
n w
ho m
eet c
rite
ria
1 2 3 4 5
By wealth quintile, children less than 60 monthsComponents of Adequacy in Environment - Drinking water
2010 Improved Basic Safely managed2013 Improved Basic Safely managed
2062
Perc
enta
ge o
f chi
ldre
n w
ho m
eet c
rite
ria
National, children less than 60 monthsComponents of Adequacy in Environment - Sanitation
National, children less than 60 monthsComponents of Adequacy in Environment - Drinking water
83 8782
86
21 21
Perc
enta
ge o
f chi
ldre
n w
ho m
eet c
rite
ria
FIGURE 16. COMPARISON OF ADEQUATE ENVIRONMENT COMPONENTS, 2010 AND 2013

28
Operationalizing a Multi-Sectoral Approach for the Reduction of Stunting
In general, in 2013 children living in high-stunt districts were less likely to have access to adequate environment than children living in low-stunt districts. In high-stunt districts, 45 percent of children had access to basic sanitation whereas in the low-stunt districts 72 percent had such access (Figure 17). Also, the communities in which the children in low-stunt districts live as a whole had better access to basic sanitation with 60 percent of children living in communities where at least 75 percent of the households had access to basic sanitation, versus only 28 percent of children in high-stunt districts living in such communities. Similarly, access to basic drinking water was higher in low-stunt districts at 91 percent than high-stunt districts at 77 percent.
In 2013 there were sizable disparities across wealth quintiles in terms of access to adequate environment components. Whereas only two percent of children
living in the poorest households had access to basic sanitation, 95 percent of the children living in the wealthiest households had access to basic sanitation (Figure 17). That is, almost no child in a poor household had access to basic sanitation, whereas nearly all children in the wealthiest households had access. As the wealth quintile increases so does the percentage of children who had access to basic sanitation. The wealthier the household the more likely it is that the child also had access to improved, basic or safely managed water. However, even in the lowest wealth quintile 64 percent of the children had access to an improved water source and 62 percent to basic drinking water. Thus access to the adequate environment components are the ones with most inequality in access in terms of wealth.
Source: Authors’ calculations based on 2013 RISKESDAS.Notes: Districts with high (low) stunting rates are the districts with the top (bottom) 25% stunting rates at the district level. Wealth quintiles calculated by the NIHRD using polychoric prinipal components analysis (pp. 61-62 of 2013 report).
National, children less than 36 monthsComponents of Adequacy in Environment, 2013
61
45
87 86
21
Perc
enta
ge o
f chi
ldre
n w
ho m
eet c
rite
ria
47
27
79 78
11
74
62
94 94
30
Perc
enta
ge o
f chi
ldre
n w
ho m
eet c
rite
ria
Rural Urban
By urban/rural, children less than 36 monthsComponents of Adequacy in Environment, 2013
45
28
79 77
17
72
60
92 91
26
Perc
enta
ge o
f chi
ldre
n w
ho m
eet c
rite
ria
High stunt rate Low stunt rate
By district stunting, children less than 60 months, in 2013Components of Adequacy in Environment
Sanitation Basic CommunityDrinking water Improved Basic Safely managed
2 4
6462
7
2619
81 80
13
68
46
9090
18
86
63
9493
26
95
74
9796
35
Perc
enta
ge o
f chi
ldre
n w
ho m
eet c
rite
ria
1 2 3 4 5
By wealth quantile, in 2013Components of Adequacy in Environment
FIGURE 17. COMPONENTS OF ADEQUATE ENVIRONMENT, 2013
29
Chapter 5.
Chapter 5.
SynergiesBy definition, synergies are present in the event that various elements are combined and interact to produce a total effect that is greater than the sum of individual elements. In this section, an effort is made to derive some quantitative estimates of the role of synergies associated with having simultaneous access to adequate levels in one or more of the clusters of food security, child care, and health and environment, on child nutrition.
The analysis is aimed at analyzing whether the mean height-for-age Z-scores of children with simultaneous access to adequate levels in two or more of the underlying determinants of nutrition is equal to or greater than the sum of the mean height-for-age Z-scores of children with access to adequate level in only one of the determinants at a time. To explore the potential synergies among the four determinants of nutrition outcomes, a simple regression model is used to summarize in a parsimonious way the differences in the mean height-for-age among children with access to only or more of the four drivers of the underlying determinants of nutrition. On purpose, no additional controls are used in these regressions since including such controls is likely to create the impression that an effort is made to minimize the influence of confounding factors in the relationship between the dependent and independent variables in the regression, a practice common to all studies aimed at estimating causal regressions within an econometric framework.
Each child is assigned into one of the fifteen exclusive groups each group distinguished by whether the household/child has access to an adequate level of only one or only two or only three or all four of the underlying determinants of nutrition. For this purpose, 15 binary variables are constructed by taking into consideration whether the child has access to adequate levels in the other determinants. Specifically, the binary variable B1 is equal to 1 if the households has adequate
food security only (and inadequate care, health and environment) and 0 otherwise. Similarly, B2 is 1 when the households is adequate in environment only (and inadequate care, food, and environment) and is 0 otherwise; B3 is 1 when the household is adequate in health (and inadequate care, food, and environment), and B4 is 1 when the households is addequate in care (and inadequate food, heatlh, and environment). In the same vein, B12 takes the value of 1 if the households has adequate food security and adequate in environment at the same time (and inadequate care and health), and B13 takes the value of 1 if the household has adequate food security and adequate health (and inadequate care and environment), and so on.
A comparison of the mean values of height-for-age Z-scores in each of these groups of children can shed light on the extent to which simultaneous access to adequate levels of two or more of the four clusters is associated with higher heights for age Z-scores of children. Estimates of the regression model A below can provide the answer to this question:
HAZi = α + β1B1 + β2B2 + β3B3 + β4B4 +
+ β12B12 + β13B13 + β14B14 + β23B23 + β24B24 +
+β123B123 + β124B124 + β234B234 + εi .
In this specification the constant term α provides an estimate of the mean value of HAZ scores for children without access to an adequate level for any of the four underlying determinants of nutrition: food security (B1=0), environment (B2=0), health (B3=0) and care (B4=0). With E ( HAZi | B =1 or 0) denoting the expected (or mean) value of height-for-age (outcome), conditional on having adequate access (B1=0) or inadequate access (B=0), the expected height-for-age for when the child does not have adequate access to any of the four determinants is:18
E ( HAZi | B1 = 1, B2 = 0, B3 = 0, B4 = 0 ) = α
18 It is also assumed that E (εi | B1, B2, ... , B1234 ) = 0.
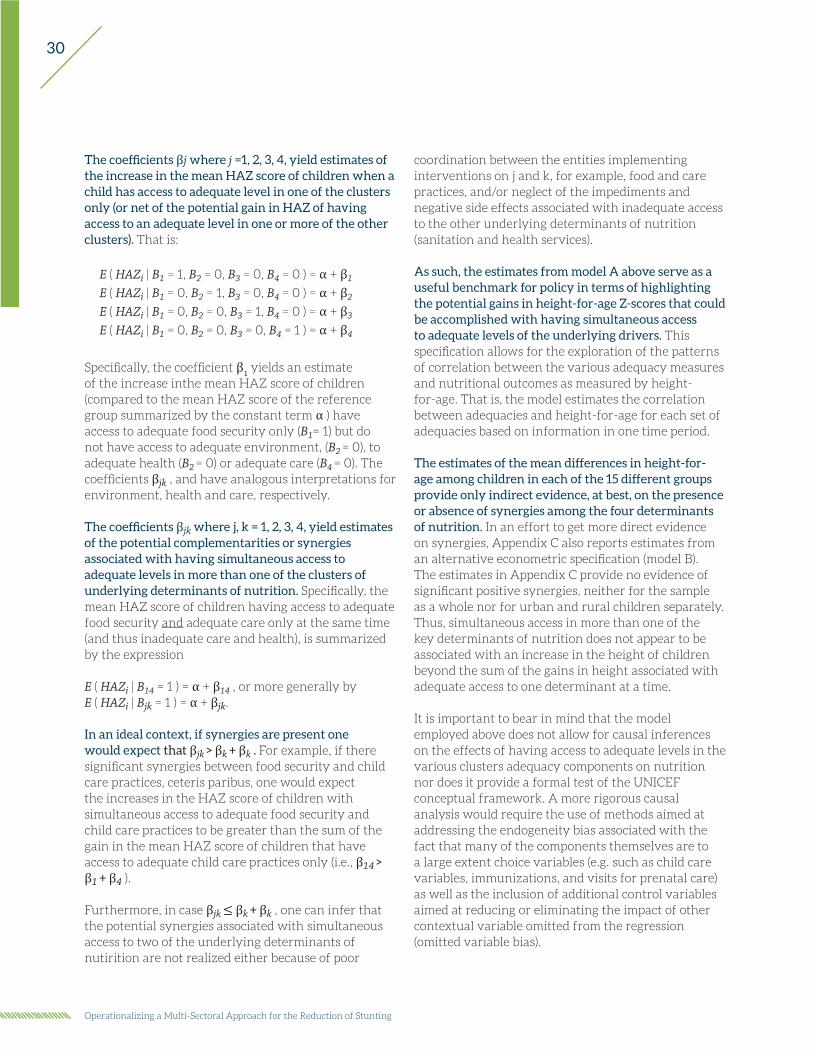
30
Operationalizing a Multi-Sectoral Approach for the Reduction of Stunting
The coefficients βj where j =1, 2, 3, 4, yield estimates of the increase in the mean HAZ score of children when a child has access to adequate level in one of the clusters only (or net of the potential gain in HAZ of having access to an adequate level in one or more of the other clusters). That is:
E ( HAZi | B1 = 1, B2 = 0, B3 = 0, B4 = 0 ) = α + β1
E ( HAZi | B1 = 0, B2 = 1, B3 = 0, B4 = 0 ) = α + β2
E ( HAZi | B1 = 0, B2 = 0, B3 = 1, B4 = 0 ) = α + β3
E ( HAZi | B1 = 0, B2 = 0, B3 = 0, B4 = 1 ) = α + β4
Specifically, the coefficient β1 yields an estimate of the increase inthe mean HAZ score of children (compared to the mean HAZ score of the reference group summarized by the constant term α ) have access to adequate food security only (B1= 1) but do not have access to adequate environment, (B2
= 0), to adequate health (B2
= 0) or adequate care (B4 = 0). The
coefficients βjk , and have analogous interpretations for environment, health and care, respectively.
The coefficients βjk where j, k = 1, 2, 3, 4, yield estimates of the potential complementarities or synergies associated with having simultaneous access to adequate levels in more than one of the clusters of underlying determinants of nutrition. Specifically, the mean HAZ score of children having access to adequate food security and adequate care only at the same time (and thus inadequate care and health), is summarized by the expression E ( HAZi | B14 = 1 ) = α + β14 , or more generally by E ( HAZi | Bjk = 1 ) = α + βjk.
In an ideal context, if synergies are present one would expect that βjk > βk + βk . For example, if there significant synergies between food security and child care practices, ceteris paribus, one would expect the increases in the HAZ score of children with simultaneous access to adequate food security and child care practices to be greater than the sum of the gain in the mean HAZ score of children that have access to adequate child care practices only (i.e., β14 > β1 + β4 ).
Furthermore, in case βjk ≤ βk + βk , one can infer that the potential synergies associated with simultaneous access to two of the underlying determinants of nutirition are not realized either because of poor
coordination between the entities implementing interventions on j and k, for example, food and care practices, and/or neglect of the impediments and negative side effects associated with inadequate access to the other underlying determinants of nutrition (sanitation and health services).
As such, the estimates from model A above serve as a useful benchmark for policy in terms of highlighting the potential gains in height-for-age Z-scores that could be accomplished with having simultaneous access to adequate levels of the underlying drivers. This specification allows for the exploration of the patterns of correlation between the various adequacy measures and nutritional outcomes as measured by height-for-age. That is, the model estimates the correlation between adequacies and height-for-age for each set of adequacies based on information in one time period.
The estimates of the mean differences in height-for-age among children in each of the 15 different groups provide only indirect evidence, at best, on the presence or absence of synergies among the four determinants of nutrition. In an effort to get more direct evidence on synergies, Appendix C also reports estimates from an alternative econometric specification (model B). The estimates in Appendix C provide no evidence of significant positive synergies, neither for the sample as a whole nor for urban and rural children separately. Thus, simultaneous access in more than one of the key determinants of nutrition does not appear to be associated with an increase in the height of children beyond the sum of the gains in height associated with adequate access to one determinant at a time.
It is important to bear in mind that the model employed above does not allow for causal inferences on the effects of having access to adequate levels in the various clusters adequacy components on nutrition nor does it provide a formal test of the UNICEF conceptual framework. A more rigorous causal analysis would require the use of methods aimed at addressing the endogeneity bias associated with the fact that many of the components themselves are to a large extent choice variables (e.g. such as child care variables, immunizations, and visits for prenatal care) as well as the inclusion of additional control variables aimed at reducing or eliminating the impact of other contextual variable omitted from the regression (omitted variable bias).
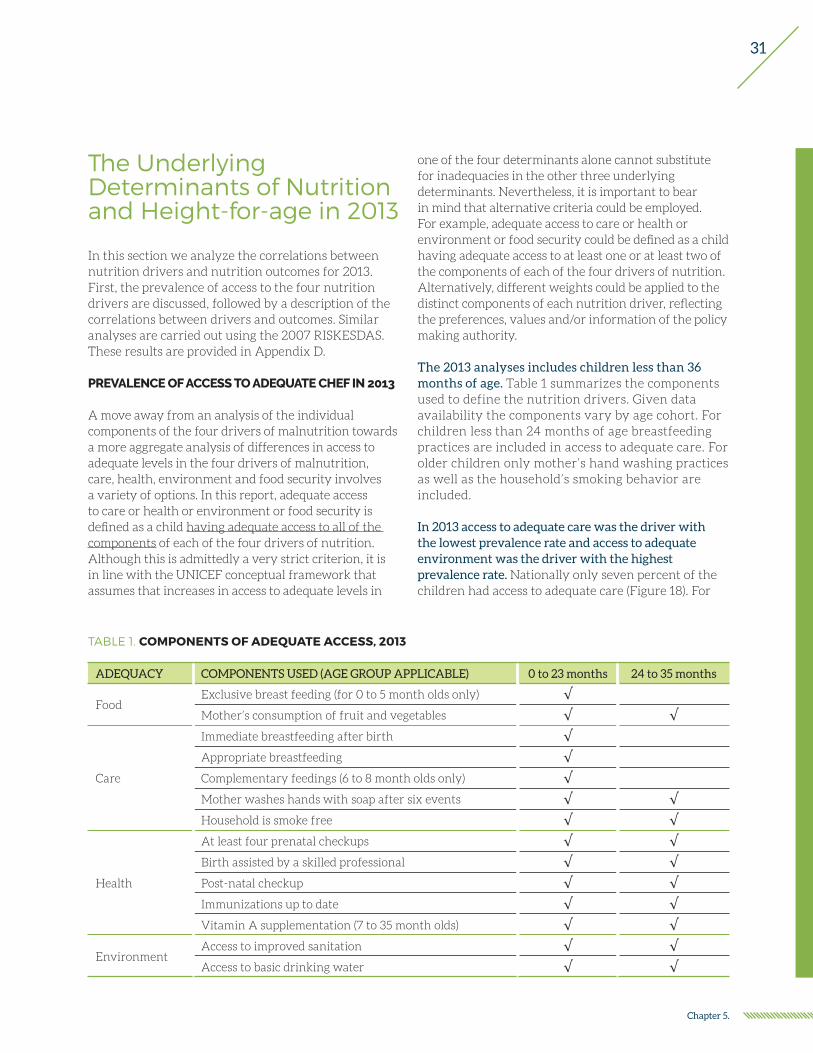
31
Chapter 5.
The Underlying Determinants of Nutrition and Height-for-age in 2013
In this section we analyze the correlations between nutrition drivers and nutrition outcomes for 2013. First, the prevalence of access to the four nutrition drivers are discussed, followed by a description of the correlations between drivers and outcomes. Similar analyses are carried out using the 2007 RISKESDAS. These results are provided in Appendix D.
PREVALENCE OF ACCESS TO ADEQUATE CHEF IN 2013
A move away from an analysis of the individual components of the four drivers of malnutrition towards a more aggregate analysis of differences in access to adequate levels in the four drivers of malnutrition, care, health, environment and food security involves a variety of options. In this report, adequate access to care or health or environment or food security is defined as a child having adequate access to all of the components of each of the four drivers of nutrition. Although this is admittedly a very strict criterion, it is in line with the UNICEF conceptual framework that assumes that increases in access to adequate levels in
one of the four determinants alone cannot substitute for inadequacies in the other three underlying determinants. Nevertheless, it is important to bear in mind that alternative criteria could be employed. For example, adequate access to care or health or environment or food security could be defined as a child having adequate access to at least one or at least two of the components of each of the four drivers of nutrition. Alternatively, different weights could be applied to the distinct components of each nutrition driver, reflecting the preferences, values and/or information of the policy making authority.
The 2013 analyses includes children less than 36 months of age. Table 1 summarizes the components used to define the nutrition drivers. Given data availability the components vary by age cohort. For children less than 24 months of age breastfeeding practices are included in access to adequate care. For older children only mother’s hand washing practices as well as the household’s smoking behavior are included.
In 2013 access to adequate care was the driver with the lowest prevalence rate and access to adequate environment was the driver with the highest prevalence rate. Nationally only seven percent of the children had access to adequate care (Figure 18). For
ADEQUACY COMPONENTS USED (AGE GROUP APPLICABLE) 0 to 23 months 24 to 35 months
FoodExclusive breast feeding (for 0 to 5 month olds only) √Mother’s consumption of fruit and vegetables √ √
Care
Immediate breastfeeding after birth √Appropriate breastfeeding √Complementary feedings (6 to 8 month olds only) √Mother washes hands with soap after six events √ √Household is smoke free √ √
Health
At least four prenatal checkups √ √Birth assisted by a skilled professional √ √Post-natal checkup √ √Immunizations up to date √ √Vitamin A supplementation (7 to 35 month olds) √ √
EnvironmentAccess to improved sanitation √ √Access to basic drinking water √ √
TABLE 1. COMPONENTS OF ADEQUATE ACCESS, 2013
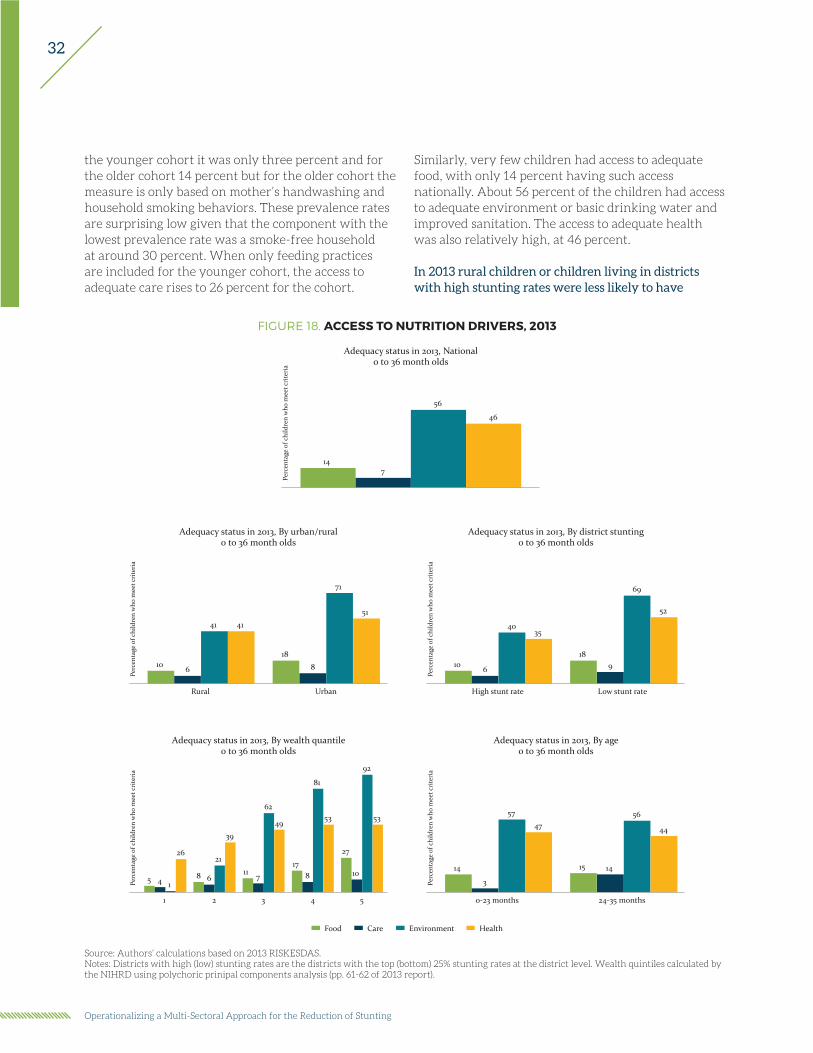
32
Operationalizing a Multi-Sectoral Approach for the Reduction of Stunting
the younger cohort it was only three percent and for the older cohort 14 percent but for the older cohort the measure is only based on mother’s handwashing and household smoking behaviors. These prevalence rates are surprising low given that the component with the lowest prevalence rate was a smoke-free household at around 30 percent. When only feeding practices are included for the younger cohort, the access to adequate care rises to 26 percent for the cohort.
Similarly, very few children had access to adequate food, with only 14 percent having such access nationally. About 56 percent of the children had access to adequate environment or basic drinking water and improved sanitation. The access to adequate health was also relatively high, at 46 percent.
In 2013 rural children or children living in districts with high stunting rates were less likely to have
FIGURE 18. ACCESS TO NUTRITION DRIVERS, 2013
Food Care Environment Health
147
56
46
Perc
enta
ge o
f chi
ldre
n w
ho m
eet c
rite
ria 0 to 36 month olds
Adequacy status in 2013, National
10 6
41 41
18
8
71
51
Perc
enta
ge o
f chi
ldre
n w
ho m
eet c
rite
ria
Rural Urban
0 to 36 month oldsAdequacy status in 2013, By urban/rural
10 6
4035
189
69
52
Perc
enta
ge o
f chi
ldre
n w
ho m
eet c
rite
ria
High stunt rate Low stunt rate
0 to 36 month oldsAdequacy status in 2013, By district stunting
5 4 1
26
8 6
21
39
117
62
49
178
81
53
27
10
92
53
Perc
enta
ge o
f chi
ldre
n w
ho m
eet c
rite
ria
1 2 3 4 5
0 to 36 month oldsAdequacy status in 2013, By wealth quantile
14
3
57
47
15 14
56
44
Perc
enta
ge o
f chi
ldre
n w
ho m
eet c
rite
ria
0-23 months 24-35 months
0 to 36 month oldsAdequacy status in 2013, By age
Source: Authors’ calculations based on 2013 RISKESDAS.Notes: Districts with high (low) stunting rates are the districts with the top (bottom) 25% stunting rates at the district level. Wealth quintiles calculated by the NIHRD using polychoric prinipal components analysis (pp. 61-62 of 2013 report).
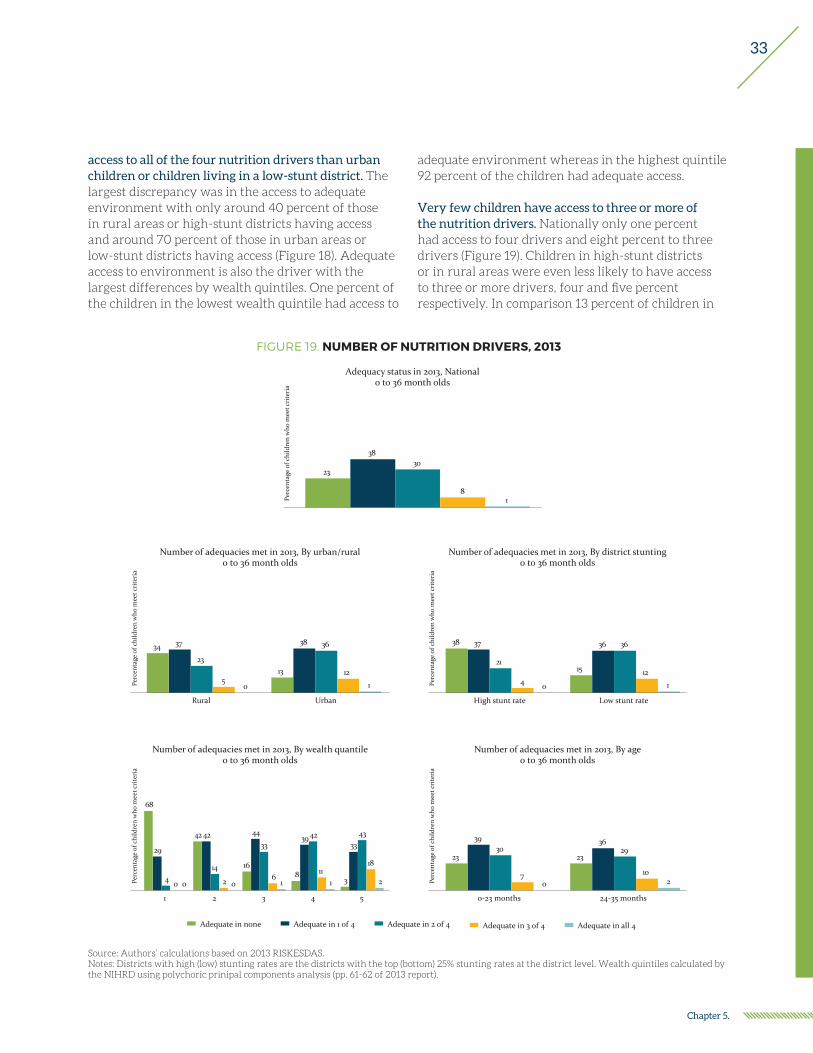
33
Chapter 5.
FIGURE 19. NUMBER OF NUTRITION DRIVERS, 2013
Adequate in none Adequate in 1 of 4 Adequate in 2 of 4 Adequate in 3 of 4 Adequate in all 4
23
3830
81Pe
rcen
tage
of c
hild
ren
who
mee
t cri
teri
a 0 to 36 month oldsAdequacy status in 2013, National
34 37
23
50
13
38 36
12
1Perc
enta
ge o
f chi
ldre
n w
ho m
eet c
rite
ria
Rural Urban
0 to 36 month oldsNumber of adequacies met in 2013, By urban/rural
38 37
21
4 0
15
36 36
12
1Perc
enta
ge o
f chi
ldre
n w
ho m
eet c
rite
ria
High stunt rate Low stunt rate
0 to 36 month oldsNumber of adequacies met in 2013, By district stunting
68
29
4 0 0
42 42
14
2 0
16
44
33
61
8
39 42
111 3
3343
18
2Perc
enta
ge o
f chi
ldre
n w
ho m
eet c
rite
ria
1 2 3 4 5
0 to 36 month oldsNumber of adequacies met in 2013, By wealth quantile
23
3930
70
23
3629
102Pe
rcen
tage
of c
hild
ren
who
mee
t cri
teri
a
0-23 months 24-35 months
0 to 36 month oldsNumber of adequacies met in 2013, By age
Source: Authors’ calculations based on 2013 RISKESDAS.Notes: Districts with high (low) stunting rates are the districts with the top (bottom) 25% stunting rates at the district level. Wealth quintiles calculated by the NIHRD using polychoric prinipal components analysis (pp. 61-62 of 2013 report).
access to all of the four nutrition drivers than urban children or children living in a low-stunt district. The largest discrepancy was in the access to adequate environment with only around 40 percent of those in rural areas or high-stunt districts having access and around 70 percent of those in urban areas or low-stunt districts having access (Figure 18). Adequate access to environment is also the driver with the largest differences by wealth quintiles. One percent of the children in the lowest wealth quintile had access to
adequate environment whereas in the highest quintile 92 percent of the children had adequate access.
Very few children have access to three or more of the nutrition drivers. Nationally only one percent had access to four drivers and eight percent to three drivers (Figure 19). Children in high-stunt districts or in rural areas were even less likely to have access to three or more drivers, four and five percent respectively. In comparison 13 percent of children in
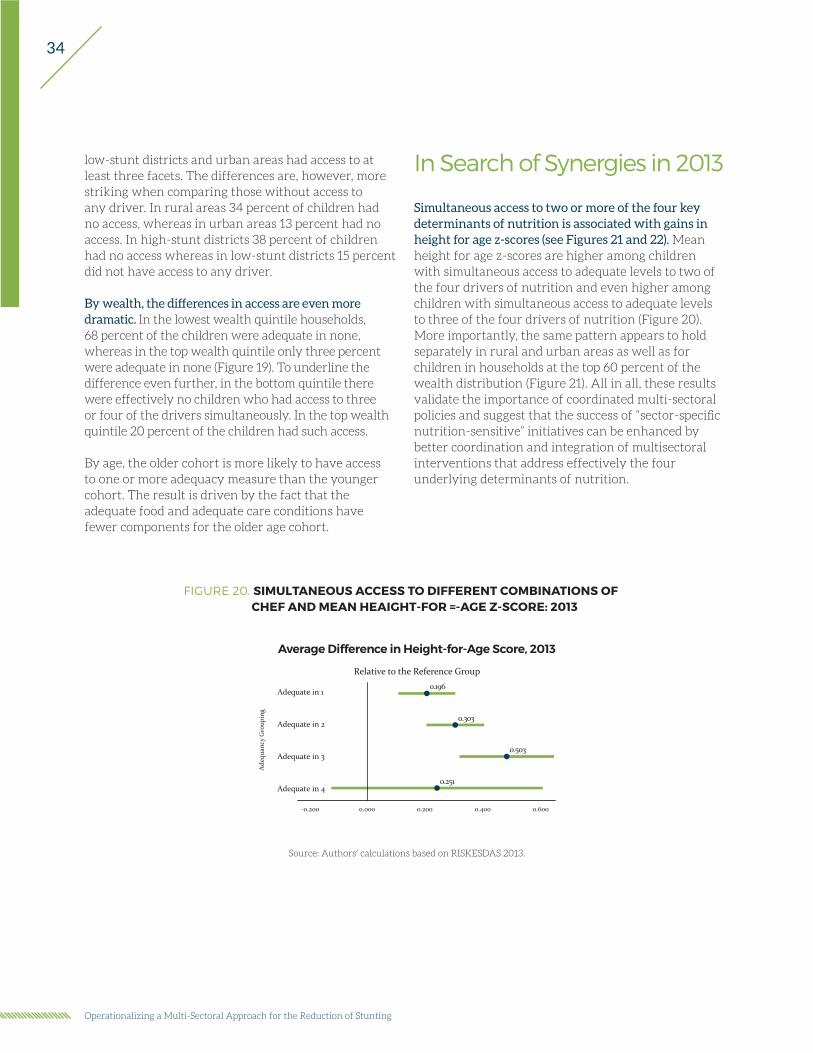
34
Operationalizing a Multi-Sectoral Approach for the Reduction of Stunting
low-stunt districts and urban areas had access to at least three facets. The differences are, however, more striking when comparing those without access to any driver. In rural areas 34 percent of children had no access, whereas in urban areas 13 percent had no access. In high-stunt districts 38 percent of children had no access whereas in low-stunt districts 15 percent did not have access to any driver.
By wealth, the differences in access are even more dramatic. In the lowest wealth quintile households, 68 percent of the children were adequate in none, whereas in the top wealth quintile only three percent were adequate in none (Figure 19). To underline the difference even further, in the bottom quintile there were effectively no children who had access to three or four of the drivers simultaneously. In the top wealth quintile 20 percent of the children had such access.
By age, the older cohort is more likely to have access to one or more adequacy measure than the younger cohort. The result is driven by the fact that the adequate food and adequate care conditions have fewer components for the older age cohort.
In Search of Synergies in 2013
Simultaneous access to two or more of the four key determinants of nutrition is associated with gains in height for age z-scores (see Figures 21 and 22). Mean height for age z-scores are higher among children with simultaneous access to adequate levels to two of the four drivers of nutrition and even higher among children with simultaneous access to adequate levels to three of the four drivers of nutrition (Figure 20). More importantly, the same pattern appears to hold separately in rural and urban areas as well as for children in households at the top 60 percent of the wealth distribution (Figure 21). All in all, these results validate the importance of coordinated multi-sectoral policies and suggest that the success of “sector-specific nutrition-sensitive” initiatives can be enhanced by better coordination and integration of multisectoral interventions that address effectively the four underlying determinants of nutrition.
FIGURE 20. SIMULTANEOUS ACCESS TO DIFFERENT COMBINATIONS OF CHEF AND MEAN HEAIGHT-FOR =-AGE Z-SCORE: 2013
Average Difference in Height-for-Age Score, 2013
Relative to the Reference Group
0.251
0.503
0.303
0.196
-0.200
Adequate in 1
Adequate in 3
0.000
Adequate in 2
Adequate in 4
Ade
quan
cy G
roup
ing
0.200 0.400 0.600
Source: Authors’ calculations based on RISKESDAS 2013.

35
Chapter 5.
FIGURE 21. SIMULTANEOUS ACCESS TO DIFFERENT COMBINATIONS OF CHEF AND MEAN HEAIGHT-FOR =-AGE Z-SCORE: 2013
Peeking Underneath the HoodThe analysis so far did not distinguish among the specific drivers of nutrition. A more detailed investigation of the distribution of children across the different combinations of the specific drivers of nutrition reveals that some combinations (categories) have very few children. Less than three percent of children are either adequate in food alone or in care alone (Figure 22). Furthermore, except for access to both health and environment, five percent or less of the sample are adequate in each of the specific two-access categories. These low percentages are reminders
that any observed correlations need to be interpreted with caution given the small percentage of children on which they are based. For example, there are only 53 children (from the sample total of 30,051 children) who are adequate in food and care only and who have valid height information. Furthermore, in this particular group, the children who have the lowest Z-scores are also the children who come from households who are weighted more, and thus the weighted average HAZ-score results very low. That is, when unweighted means are compared, those who are adequate in care and food are no statistically significantly different from those who are adequate in none, but once the sample is weighted, the average Z-score is 0.72 standard deviations lower. The estimate for the smaller
Rural areas
Average Difference in Height-for-Age Score, 2013Rural, Relative to the Reference Group
0.214
0.255
0.468
0.200
Adequate in 1
Adequate in 2
Adequate in 3
Adequate in 4
Ade
quac
y G
roup
ing
-0.500 0.000 0.500 1.000
Difference in Height-for-Age Z-score
Urban areas
Average Difference in Height-for-Age Score, 2013Urban, Relative to the Reference Group
0.072
0.202
0.364
0.113
Adequate in 1
Adequate in 2
Adequate in 3
Adequate in 4
Ade
quac
y G
roup
ing
-0.400 -0.200 0.000 0.200 0.400 0.600
Difference in Height-for-Age Z-score
B40 percent of the distribution
Average Difference in Height-for-Age Score, 2013Children in B40, Relative to the Reference Group
0.105
0.039
0.080
-0.078
Adequate in 1
Adequate in 2
Adequate in 3
Adequate in 4
Ade
quac
y G
roup
ing
-1.000 -0.500 0.000 0.500 1.000
Difference in Height-for-Age Z-score
T60 percent of the distribution
Average Difference in Height-for-Age Score, 2013Children in T60, Relative to the Reference Group
0.071
0.144
0.329
0.058
Adequate in 1
Adequate in 2
Adequate in 3
Adequate in 4
Ade
quac
y G
roup
ing
-0.400 -0.200 0.000 0.200 0.400 0.600
Difference in Height-for-Age Z-score
Source: Authors’ calculations based on RISKESDAS 2013.Note: Showing point estimates and 95% CI.
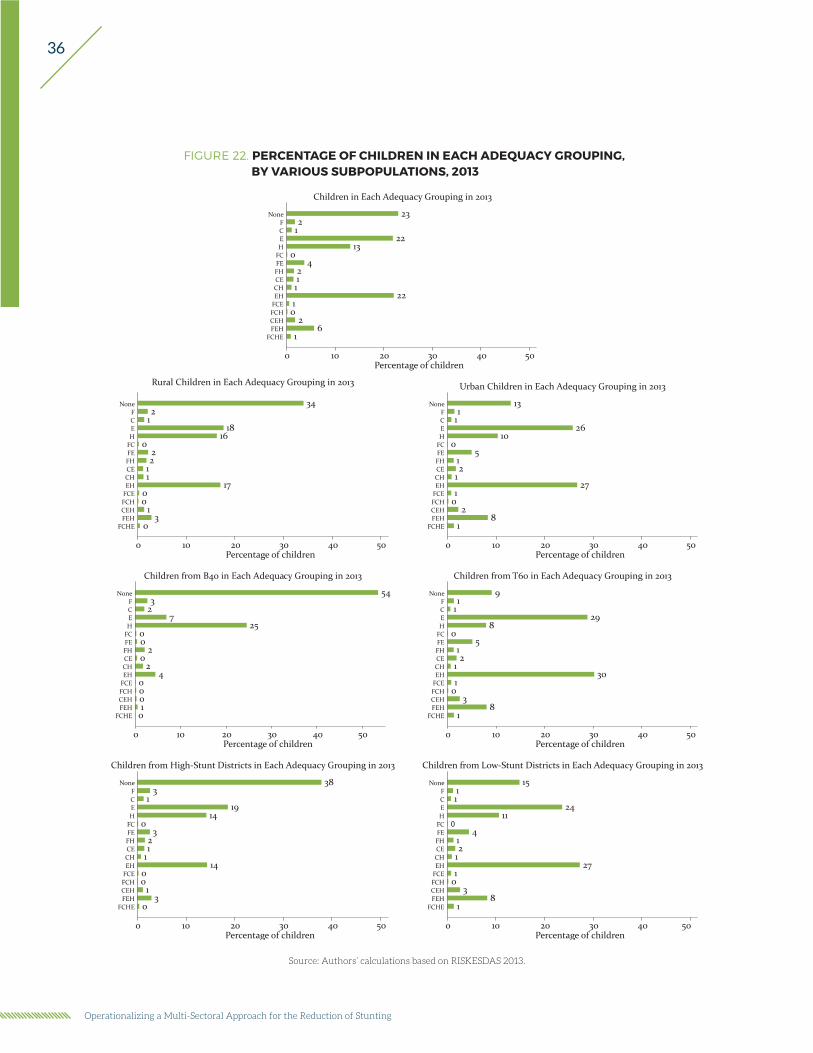
36
Operationalizing a Multi-Sectoral Approach for the Reduction of Stunting
FIGURE 22. PERCENTAGE OF CHILDREN IN EACH ADEQUACY GROUPING, BY VARIOUS SUBPOPULATIONS, 2013
Source: Authors’ calculations based on RISKESDAS 2013.
16
201
22112
40
1322
12
23
0 10 20 30 40 50Percentage of children
FCHEFEHCEHFCHFCEEHCHCEFHFEFCHECF
None
Children in Each Adequacy Grouping in 2013
03
100
171122
016
1812
34
0 10 20 30 40 50Percentage of children
FCHEFEHCEHFCHFCEEHCHCEFHFEFCHECF
None
Rural Children in Each Adequacy Grouping in 2013
18
201
27121
50
1026
11
13
0 10 20 30 40 50Percentage of children
FCHEFEHCEHFCHFCEEHCHCEFHFEFCHECF
None
Urban Children in Each Adequacy Grouping in 2013
01000
42
02
00
257
23
54
0 10 20 30 40 50Percentage of children
FCHEFEHCEHFCHFCEEHCHCEFHFEFCHECF
None
Children from B40 in Each Adequacy Grouping in 2013
18
301
301
21
50
829
11
9
0 10 20 30 40 50Percentage of children
FCHEFEHCEHFCHFCEEHCHCEFHFEFCHECF
None
Children from T60 in Each Adequacy Grouping in 2013
03
100
14112
30
1419
13
38
0 10 20 30 40 50Percentage of children
FCHEFEHCEHFCHFCEEHCHCEFHFEFCHECF
None
Children from High-Stunt Districts in Each Adequacy Grouping in 2013
18
301
27121
40
1124
11
15
0 10 20 30 40 50Percentage of children
FCHEFEHCEHFCHFCEEHCHCEFHFEFCHECF
None
Children from Low-Stunt Districts in Each Adequacy Grouping in 2013
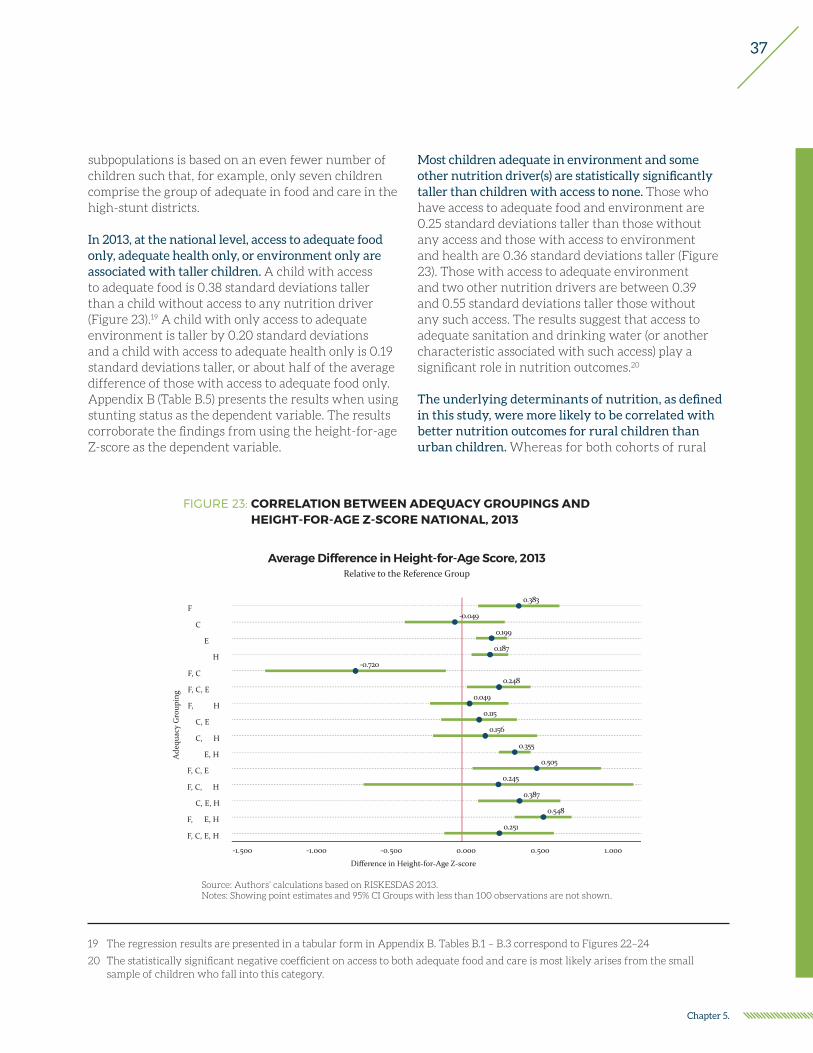
37
Chapter 5.
subpopulations is based on an even fewer number of children such that, for example, only seven children comprise the group of adequate in food and care in the high-stunt districts.
In 2013, at the national level, access to adequate food only, adequate health only, or environment only are associated with taller children. A child with access to adequate food is 0.38 standard deviations taller than a child without access to any nutrition driver (Figure 23).19 A child with only access to adequate environment is taller by 0.20 standard deviations and a child with access to adequate health only is 0.19 standard deviations taller, or about half of the average difference of those with access to adequate food only. Appendix B (Table B.5) presents the results when using stunting status as the dependent variable. The results corroborate the findings from using the height-for-age Z-score as the dependent variable.
Most children adequate in environment and some other nutrition driver(s) are statistically significantly taller than children with access to none. Those who have access to adequate food and environment are 0.25 standard deviations taller than those without any access and those with access to environment and health are 0.36 standard deviations taller (Figure 23). Those with access to adequate environment and two other nutrition drivers are between 0.39 and 0.55 standard deviations taller those without any such access. The results suggest that access to adequate sanitation and drinking water (or another characteristic associated with such access) play a significant role in nutrition outcomes.20
The underlying determinants of nutrition, as defined in this study, were more likely to be correlated with better nutrition outcomes for rural children than urban children. Whereas for both cohorts of rural
19 The regression results are presented in a tabular form in Appendix B. Tables B.1 – B.3 correspond to Figures 22–24
20 The statistically significant negative coefficient on access to both adequate food and care is most likely arises from the small sample of children who fall into this category.
Ade
quac
y G
roup
ing
0.383
-0.049
0.199
0.187
-0.720
0.248
0.049
0.115
0.156
0.355
0.505
0.245
0.387
0.548
0.251
F
C
E
H
F, C
F, C, E
F, C, E, H
C, E
C, E, H
E, H
F, C, E
F, C, E, H
C, E, H
F, C, E, H
F, C, E, H
-1.500 -1.000 -0.500 0.000 0.500 1.000
Difference in Height-for-Age Z-score
Relative to the Reference GroupAverage Difference in Height-for-Age Score, 2013
Source: Authors’ calculations based on RISKESDAS 2013.Notes: Showing point estimates and 95% CI Groups with less than 100 observations are not shown.
FIGURE 23: CORRELATION BETWEEN ADEQUACY GROUPINGS AND HEIGHT-FOR-AGE Z-SCORE NATIONAL, 2013
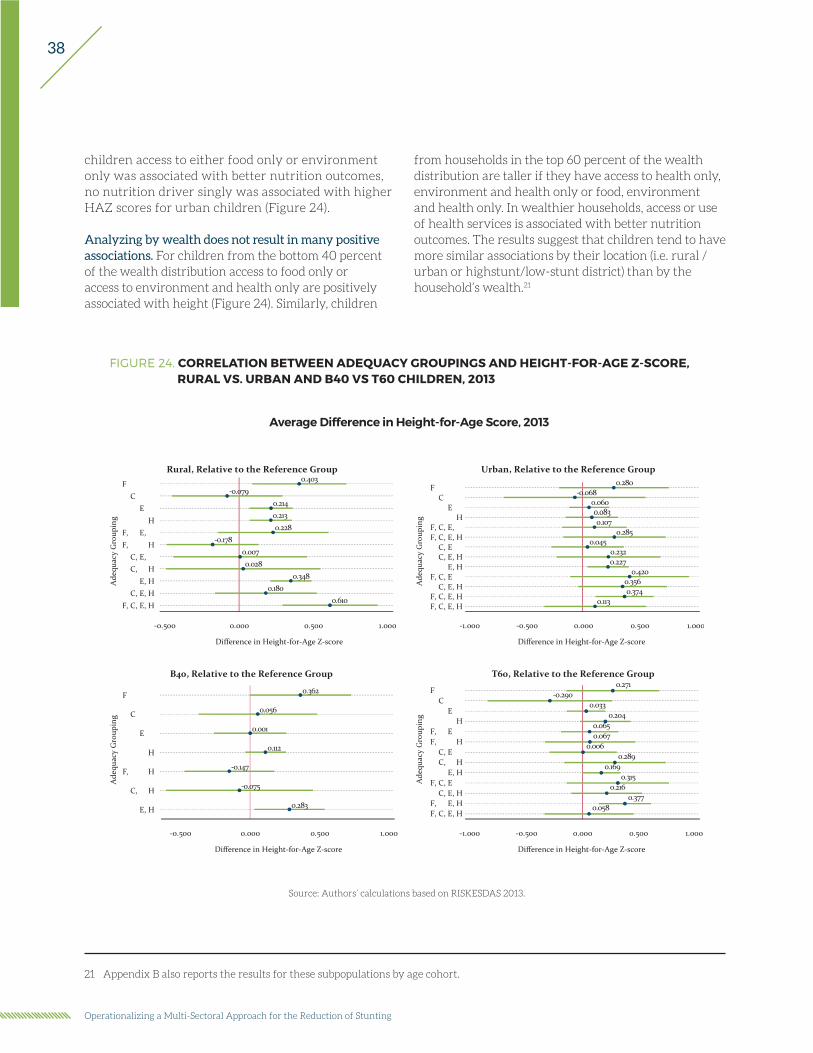
38
Operationalizing a Multi-Sectoral Approach for the Reduction of Stunting
children access to either food only or environment only was associated with better nutrition outcomes, no nutrition driver singly was associated with higher HAZ scores for urban children (Figure 24).
Analyzing by wealth does not result in many positive associations. For children from the bottom 40 percent of the wealth distribution access to food only or access to environment and health only are positively associated with height (Figure 24). Similarly, children
from households in the top 60 percent of the wealth distribution are taller if they have access to health only, environment and health only or food, environment and health only. In wealthier households, access or use of health services is associated with better nutrition outcomes. The results suggest that children tend to have more similar associations by their location (i.e. rural /urban or highstunt/low-stunt district) than by the household’s wealth.21
21 Appendix B also reports the results for these subpopulations by age cohort.
FIGURE 24. CORRELATION BETWEEN ADEQUACY GROUPINGS AND HEIGHT-FOR-AGE Z-SCORE, RURAL VS. URBAN AND B40 VS T60 CHILDREN, 2013
Source: Authors’ calculations based on RISKESDAS 2013.
F
C
E
H
F, C, E, H
C, E, H
E, H
Ade
quac
y G
roup
ing
0.362
0.056
0.001
0.112
-0.147
-0.075
0.283
-0.500 0.000 0.500 1.000
Difference in Height-for-Age Z-score
B40, Relative to the Reference Group
Ade
quac
y G
roup
ing
0.403-0.079
0.2140.2130.228
-0.1780.0070.028
0.3480.180
0.610
FC
EH
F, C, E, HF, C, E, H
C, E, HC, E, H
E, HC, E, H
F, C, E, H
-0.500 0.000 0.500 1.000
Difference in Height-for-Age Z-score
Rural, Relative to the Reference Group
Ade
quac
y G
roup
ing
FC
EH
F, C, EF, C, E, H
C, EC, E, H
E, HF, C, E
C, E, HF, C, E, HF, C, E, H
Difference in Height-for-Age Z-score
-1.000 -0.500 0.000 0.500 1.000
0.271-0.290
0.0330.204
0.0650.067
0.0060.289
0.1690.315
0.2160.377
0.058
T60, Relative to the Reference Group
0.280-0.068
0.0600.0830.107
0.2850.045
0.2320.227
0.4200.3560.374
0.113
FC
EH
F, C, E,F, C, E, H
C, EC, E, H
E, HF, C, E
C, E, HF, C, E, HF, C, E, H
Ade
quac
y G
roup
ing
-1.000 -0.500 0.000 0.500 1.000
Difference in Height-for-Age Z-score
Urban, Relative to the Reference Group
Average Difference in Height-for-Age Score, 2013

39
Chapter 5.
Estimating separately by age, suggests that the differences in height by adequacy category are stronger in the older cohort. Given that the definition of adequate care is quite different for zero- to 23- month olds and 24- to 35-month olds, it is useful to analyze by age cohorts. The first thing to note is that the average child without access to any nutrition driver in the 0 to 23 month old cohort had a HAZ score of -1.16 standard deviations whereas in the older cohort it was -1.85 standard deviations (Figure 25). This fact reflects the steady drop in the average HAZ score with age. Given that height-for-age is a reflection of chronic nutrition conditions, the older age cohort where the growth curves have stabilized better captures the ultimate long term associations between nutrition drivers and nutrition outcomes. However, the result depends on the degree to which their access to the nutrition drivers has changed since birth. As long as the access has remained similar since birth, the estimates for the older cohort reflect the accumulated associations. The analysis reveals that for the older cohort almost any combination of nutrition drivers was associated with better nutrition outcomes than having access to none (Figure 25). The only exceptions were access to adequate care only, access to adequate care and food only, and access to adequate food and health only. The coefficient estimates for having access to three or more nutrition drivers (Z-scores from 0.57 to 1.13 standard deviations) were greater than the coefficient estimates for those having access to one or two drivers (up to 0.41 standard deviations). That is, having access to the nutrition drivers is associated with nutrition outcomes and the greater number of drivers that a child has access to, the larger the average difference in height between the group and those without access to any driver.
Investigating potential differences in rural and urban areas depending on the age of the child, reveals that the average height difference in the older cohort is greater than in the younger cohort (Figure 26). In rural areas, access to adequate level in only one of the four drivers of nutrition among older children (24 to 35 months old) appears to be associated with better nutrition outcomes than the nutrition outcomes of younger children (0 to 23 months old) in rural areas. This difference between age groups may reflect the
Ade
quac
y G
roup
ing
F
C
E
H
F, C
F, C, E
F, C, E, H
C, E
C, E, H
E, H
F, C, E
F, C, E, H
C, E, H
F, C, E, H
F, C, E, H
-0.994
0.373
0.365
0.302
0.149
0.120
0.225
0.029
0.483
0.415
0.301
0.714
0.506
0.224
-1.053
0.393
0.169
0.290
0.282
-0.216
0.353
-0.104
0.314
0.353
0.407
0.814
1.129
0.742
0.572
0.615
-3.000 -2.000 -1.000 0.000 1.000 2.000
Difference in Height-for-Age Z-score
0 to 23 months 24 to 35 months
By age, Relative to the Reference GroupAverage Difference in Height-for-Age Score, 2013
Source: Authors’ calculations based on RISKESDAS 2013.Notes: Showing point estimates and 95% CI
FIGURE 25. CORRELATION BETWEEN ADEQUACY GROUPINGS AND HEIGHT-FOR-AGE Z-SCORE, BY AGE, 2013
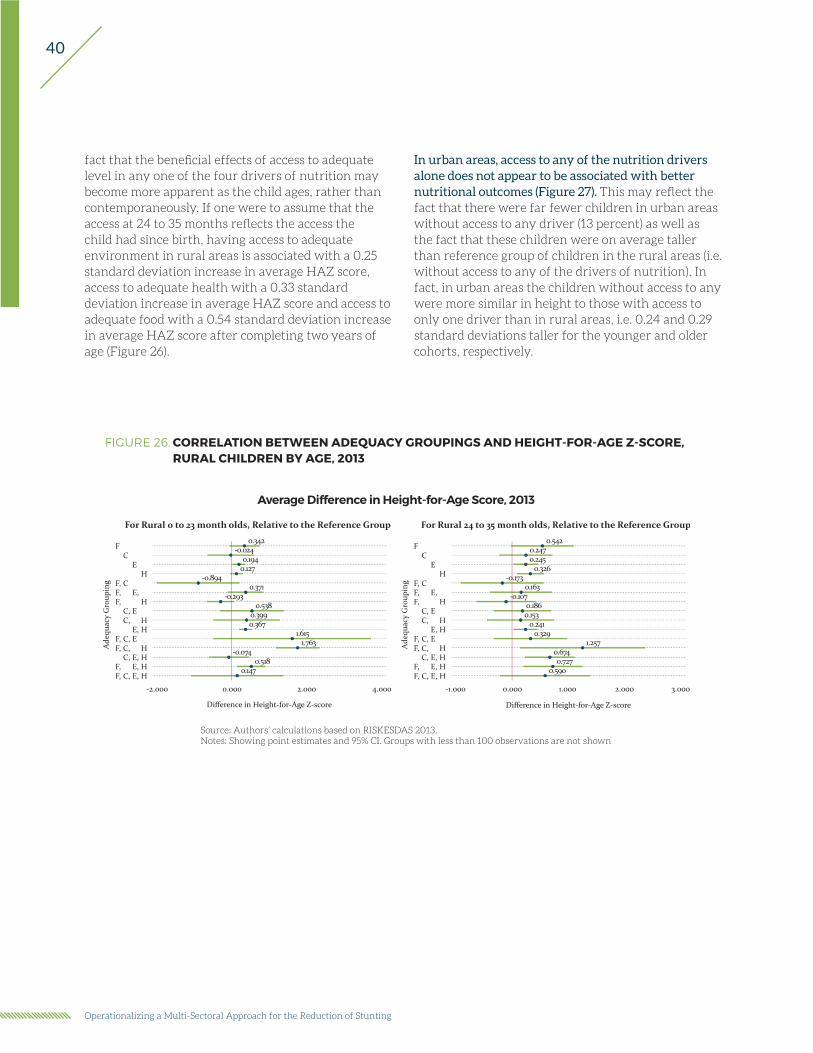
40
Operationalizing a Multi-Sectoral Approach for the Reduction of Stunting
fact that the beneficial effects of access to adequate level in any one of the four drivers of nutrition may become more apparent as the child ages, rather than contemporaneously. If one were to assume that the access at 24 to 35 months reflects the access the child had since birth, having access to adequate environment in rural areas is associated with a 0.25 standard deviation increase in average HAZ score, access to adequate health with a 0.33 standard deviation increase in average HAZ score and access to adequate food with a 0.54 standard deviation increase in average HAZ score after completing two years of age (Figure 26).
FIGURE 26. CORRELATION BETWEEN ADEQUACY GROUPINGS AND HEIGHT-FOR-AGE Z-SCORE, RURAL CHILDREN BY AGE, 2013
Source: Authors’ calculations based on RISKESDAS 2013.Notes: Showing point estimates and 95% CI. Groups with less than 100 observations are not shown
Average Difference in Height-for-Age Score, 2013
For Rural 0 to 23 month olds, Relative to the Reference Group For Rural 24 to 35 month olds, Relative to the Reference Group
Ade
quac
y G
roup
ing
Difference in Height-for-Age Z-score
FC
EH
F, CF, C, E,F, C, E, H
C, EC, E, H
E, HF, C, EF, C, E, H
C, E, HF, C, E, HF, C, E, H
0.342-0.024
0.1940.127
-0.8940.371
-0.2930.538
0.3990.367
1.6151.763
-0.0740.518
0.147
-2.000 0.000 2.000 4.000
Ade
quac
y G
roup
ing
Difference in Height-for-Age Z-score
FC
EH
F, CF, C, E,F, C, E, H
C, EC, E, H
E, HF, C, EF, C, E, H
C, E, HF, C, E, HF, C, E, H
-1.000 0.000 1.000 2.000 3.000
0.5420.2470.245
0.326-0.173
0.163-0.107
0.1860.153
0.2410.329
1.2570.6740.727
0.590
In urban areas, access to any of the nutrition drivers alone does not appear to be associated with better nutritional outcomes (Figure 27). This may reflect the fact that there were far fewer children in urban areas without access to any driver (13 percent) as well as the fact that these children were on average taller than reference group of children in the rural areas (i.e. without access to any of the drivers of nutrition). In fact, in urban areas the children without access to any were more similar in height to those with access to only one driver than in rural areas, i.e. 0.24 and 0.29 standard deviations taller for the younger and older cohorts, respectively.
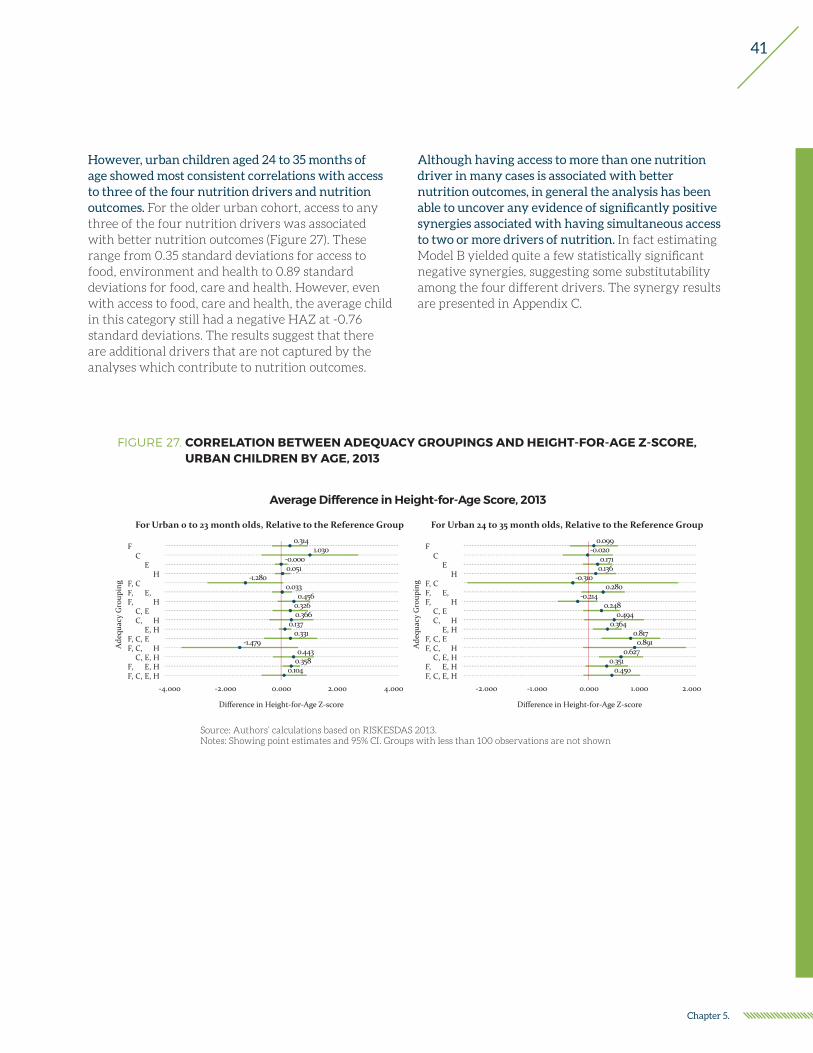
41
Chapter 5.
FIGURE 27. CORRELATION BETWEEN ADEQUACY GROUPINGS AND HEIGHT-FOR-AGE Z-SCORE, URBAN CHILDREN BY AGE, 2013
Average Difference in Height-for-Age Score, 2013
For Urban 0 to 23 month olds, Relative to the Reference Group For Urban 24 to 35 month olds, Relative to the Reference Group
Ade
quac
y G
roup
ing
Difference in Height-for-Age Z-score
FC
EH
F, CF, C, E,F, C, E, H
C, EC, E, H
E, HF, C, EF, C, E, H
C, E, HF, C, E, HF, C, E, H
0.3141.030
-0.0000.051
-1.2800.033
0.4560.3260.366
0.1370.331
-1.4790.443
0.3580.104
-4.000 -2.000 0.000 2.000 4.000
Ade
quac
y G
roup
ing
Difference in Height-for-Age Z-score
FC
EH
F, CF, C, E,F, C, E, H
C, EC, E, H
E, HF, C, EF, C, E, H
C, E, HF, C, E, HF, C, E, H
-2.000 -1.000 0.000 1.000 2.000
0.099-0.020
0.1710.136
-0.3100.280
-0.2140.248
0.4940.364
0.8170.891
0.6270.351
0.450
Source: Authors’ calculations based on RISKESDAS 2013.Notes: Showing point estimates and 95% CI. Groups with less than 100 observations are not shown
However, urban children aged 24 to 35 months of age showed most consistent correlations with access to three of the four nutrition drivers and nutrition outcomes. For the older urban cohort, access to any three of the four nutrition drivers was associated with better nutrition outcomes (Figure 27). These range from 0.35 standard deviations for access to food, environment and health to 0.89 standard deviations for food, care and health. However, even with access to food, care and health, the average child in this category still had a negative HAZ at -0.76 standard deviations. The results suggest that there are additional drivers that are not captured by the analyses which contribute to nutrition outcomes.
Although having access to more than one nutrition driver in many cases is associated with better nutrition outcomes, in general the analysis has been able to uncover any evidence of significantly positive synergies associated with having simultaneous access to two or more drivers of nutrition. In fact estimating Model B yielded quite a few statistically significant negative synergies, suggesting some substitutability among the four different drivers. The synergy results are presented in Appendix C.

42
Operationalizing a Multi-Sectoral Approach for the Reduction of Stunting

43
Chapter 6.
Chapter 6.
Summary of Findings1. Between 2007 and 2013, the mother’s fruit and
vegetable consumption as well as their self-reported hand washing practices improved nationally. Fruit and vegetable intake increased from 12 percent to 15 percent. These percentages are very low overall given the lax requirement of consuming both fruit and vegetables on five out of seven days. In 2013 the prevalence rates were higher in urban areas than rural areas, and in low-stunt districts than in high-stunt districts. Self-reported handwashing increased from 38 percent to 67 percent. In 2013, 62 percent of rural mother and 73 percent of urban mothers washed their hands. Also in high-stunt districts handwashing was less frequent (57 percent) than in low-stunt districts (73 percent).
2. Breastfeeding practices have improved between 2007 and 2013. Age-appropriate breastfeeding increased from 37 percent to 69 percent, although there has been a slight decline in breastfeeding between 2010 and 2013. However, early breastfeeding rates improved between 2010 and 2013, rising from 29 percent to 37 percent nationally. In 2013 breastfeeding was more prevalent in rural areas and in high-stunt districts than in urban areas and low-stunt districts. Early breastfeeding rates were similar across high- and low-stunt districts and rural and urban areas.
3. Immunization rates also improved substantially between 2007 and 2013, but vitamin A supplementation remained relatively constant. Nationally immunization rate rose from 25 percent to 62 percent, an improvement of 37 percentage points. In 2013 immunization rates were higher in urban areas and in low-stunt districts than in rural areas and high-stunt districts.
4. Smoking by the head of the household decreased between 2007 and 2013, but not in the lower wealth quintiles. In 2007, 73 percent of household heads smoked whereas in 2013 the percentage had dropped slightly to 70 percent. In 2013 smoking was more prevalent in rural areas and in high-stunt districts.
5. Between 2010 and 2013 access to improved sanitation drastically fell in the bottom two wealth quintiles. In the lowest wealth quintile it fell from 30 percent of households having access to improved sanitation in 2010 to only 2 percent having such access in 2013. In the second wealth quintile the drop was not as drastic, but nevertheless the access nearly halved from 45 percent to 26 percent. Also access to improved drinking water fell in the bottom wealth quintile from 73 percent to 64 percent. The survey questionnaires were similar, so it is not clear to what the decrease in the access to these environmental components is attributable.
6. While there has been in increase in the access to most of the components analyzed, for some components there has also been an increase in the inequality of access between children from poorer households and wealthier households. For example, although immunization rates rose for all wealth quintiles between 2007 and 2013, the gap between the first and fifth wealth quintile rose from seven percentage points to 32 percentage points. Furthermore between 2010 and 2013 the immunization rate in the bottom quintile fell 10 percentage points. Such a large drop in the span of three years is of concern. Similarly the gap between mother’s handwashing practices rose from 13 percentage points to 27 percentage points.
7. Even more worrisome is the fact that some pro-nutrition behaviors decreased in the lowest wealth quintile. For example, the gap in household head smoking was six percentage points in 2007 but it rose to 17 percentage points with a two percentage point increase is smoking in the bottom quintile between the years. Similarly, the gap in vitamin A supplementation was only six points in 2007 but rose to 10 percentage points in 2013 with a four percentage point decrease in vitamin A supplementation in the poorest wealth quintile. The gap in the mother’s fruit and vegetable consumption increased from 17 percentage points

44
Operationalizing a Multi-Sectoral Approach for the Reduction of Stunting
to 24 percentage points with one percentage point decrease in fruit and vegetable consumption by mothers in the lowest quintile.
8. The only driver where the poorer households had more gains than the wealthier household was age-appropriate breastfeeding. In the bottom wealth quintile age-appropriate breastfeeding rose from 31 percent to 74 percent, a 43 percentage point increase, whereas in the top wealth quintile it rose from 23 percent to 62 percent, a 39 percentage point increase. However, the gap in age-appropriate breastfeeding is closing. The most recent trend, from 2010 to 2013, was a six percentage point drop in breastfeeding in the bottom quintile and a three percentage point increase in the top quintile.
9. Even though in both years, those with access to a single nutrition driver were the largest group, in both years there was a sizable number of children without access to any of the nutrition drivers. In 2007 thirty-nine percent and in 2013 twenty-three percent of children did not have access to any nutrition dimension.22 In 2007 forty-three percent had access to one driver and in 2013 thirty-eight percent. Given that the definitions are based on different sets of components, the two numbers are not comparable, and we cannot estimate by how much the “no access” group has shrunk. Nonetheless the percentages do indicate a widespread lack of access to the underlying determinants of nutrition.
10. In general, only a small percentage of the children have access to the each of the specific combinations of nutrition drivers. For many combination of nutrition drivers there are only few children fitting each description. Of children with access to multiple drivers, in 2007 the largest group was composed of children with access to both food and health only, at five percent. The percentage of children with access to each of the categories with three or four drivers was one percent or less. In 2013 the multiple nutrition driver categories had slightly larger shares. The largest share was that of children with access to environment and health only at 22 percent and the second largest, at six percent, were children
with access to food, environment and health. The rest were composed of four percent or less.
11. In both years in the national sample, having access to an adequate level to adequate food only or adequate environment only is associated with taller children. In 2007 the gains were about 0.10 standard deviations for adequate food and 0.36 standard deviations for adequate environment. Adequate in care was associated with an increase of 0.13 standard deviations in the average height-for-age Z-score. In 2013 the correlations were 0.38 standard deviations for either adequate food and 0.20 for adequate in environment and 0.19 for adequate in health. Also, in both years access to both food and environment was associated with higher Z-score. In 2007 the difference was 0.37 standard deviations and in 2013 it was 0.25 standard deviations.23 At the national level access to these two drivers seems to be consistently associated with better nutrition outcomes.
12. However, the results regarding adequate food and adequate environment are not consistent across different subpopulations. Namely, in 2007, adequate food is only correlated with HAZ scores in urban areas, where those with access to adequate food were 0.21 standard deviations taller. Access to adequate food was not correlated with height in rural areas, in high-stunt districts or for children from households in the bottom 40% of the wealth distribution. The lack of correlation may arise from the fact that the food adequacy measure is based on a per capita measure and is not child specific. Especially if the allocation of food within the family is not equitable, then the measure may not reflect the child’s true food availability. In rural areas, access to adequate environment was associated with a 0.51 standard deviation increase in the Z-score whereas in urban areas it was only 0.21 standard deviations. In fact rural children with access to adequate environment were on average slightly taller than urban children with access to adequate environment, -1.028 and -1.161 standard deviations, respectively. Furthermore, access to adequate environment was not correlated with height in low-stunt districts. In 2013, neither food nor environment was associated with better
22 Both the 2007 and 2013 values are based on definition 2, the definitions used for most of the analyses.
23 However, the gain or increases in child HAZ scores are not directly comparable across years given the different subcomponents and wording in the survey for the four nutrition factors in the different years.

45
Chapter 6.
nutrition outcomes in urban areas or for children in low-stunt districts or children from the wealthier households. That is, access to adequate food only was correlated with height for rural children, for children from high-stunt districts (0.72 standard deviations) and from the bottom 40% of wealth distribution (0.36 standard deviations). Given that adequate food in 2013 was based on the mother’s consumption of fruits and vegetables, it may be that while in the more vulnerable populations it is correlated with the quantity and quality of the child’s food intake, in the better off areas or households the relationship may not hold and thus we do not observe any statistically significant correlations. Access to adequate environment was associated with better nutrition outcomes in rural areas and for children from high-stunt districts (0.29 standard deviations).
13. Access to adequate care alone was rarely associated with better nutritional outcomes. Only for the national sample in 2007 was there a statistically significant correlation between access adequate care only and nutrition outcome. For none of the subpopulations was the correlation statistically significant. In 2013 the coefficient estimate was never statistically significant.
14. In 2013, the adequacy measures were more significantly correlated with nutrition outcomes for older children (24 months to 35 months) than for younger children (0 to 23 months). If the adequacy status of the older cohort has remained constant since birth, the older cohort results reflect the cumulative associations. The correlation coefficient is of similar magnitude for food only in the two cohorts (0.37 standard deviations for the younger cohort and 0.39 for the older cohort), but for adequate environment only it was about twice as large in the older cohort (0.29 standard deviations) than in the younger cohort (0.15 standard deviations). In the younger cohort, access to adequate health was not statistically significantly correlated with nutrition outcomes. However, in the 24- to 35-month cohort there was a positive correlation (0.28 standard deviations) between access to adequate health and nutrition outcomes. In the older cohort, having access to three or four of the adequacies was always associated with taller children ranging from 0.57 standard deviations to 1.13 standard deviations.
It is of interest to note that in the older cohort all sets of nutrition drivers, except for adequate in food, care and health only, yielded average height-for-age scores more than one standard deviation below zero. That is, even with many of the pro-nutrition components present, the distribution of heights was to the left of the expected distribution by one standard deviation.
15. In 2013, across the samples studied, access adequate environment and health only was consistently associated with taller children. Nationally children with access to both environment and health were 0.36 standard deviations taller where the younger cohort had a slightly smaller point estimate (0.30 standard deviations) than the older cohort (0.41 standard deviations). For the subpopulations analyzed, the correlation ranged from 0.17 standard deviations in low-stunt or in wealthier households to 0.37 standard deviations in the younger cohort of rural children. The only subpopulation where it was not statistically significantly different from zero is in the younger cohort of urban children.
16. The results for location based subpopulations showed stronger correlations between nutrition drivers and nutrition outcomes than for subpopulations based on wealth. This finding suggests that policies based on location, such as the district, are probably better than those based on wealth as the drivers associated with outcomes in location based populations are similar.
17. There is no systematic evidence of the presence of pairwise synergies among the four underlying determinants of nutrition. That is, in estimating Model B, we do not find any statistically significant positive correlations. These findings have numerous interpretations. It may be that such synergies are not present as having access to each component singly is already associated with sizable gains in the average Z-score. In fact, it could be that there is some degree of substitutability among the drivers. However, it is also possible that for the synergies to become apparent the adequacy measures need to be more finely defined or that there are synergies among certain components of different measures that a more comprehensive measure such as the ones used here are not able to detect.

46
Operationalizing a Multi-Sectoral Approach for the Reduction of Stunting

47
Chapter 7.
Chapter 7.
Policy ConsiderationsThe operationalization of the UNICEF conceptual framework in this report offers the opportunity of serving as a basis for a more systematic monitoring of the progress in access to the four main drivers of child malnutrition. It also serves as a practical diagnostic framework for identifying potential “binding constraints” in the Indonesian context towards the effort to reduce child stunting and malnutrition.
Measurement drives diagnosis and response: The analysis carried out highlights numerous critical data gaps in key components of the four underlying determinants of child malnutrition. For example, the 2013 RISKESDAS survey, the one and only survey containing anthropometric measures for children and adults at the national as well as at the district level does not include variables useful for quantifying key components of food security, such as dietary diversity and consumption or availability of calories and proteins. On the other hand, the annual SUSENAS survey which contains these important variables only at the household level but not at the individual level, contains no information on child anthropometric measures and is relatively weaker in measures of child care. Undoubtedly, the costs of collecting all the necessary information in one national survey that is representative at the district level in a country such as Indonesia, are prohibitively high. However, the costs of a more systematic approach to data collection that closes the gaps in data collected by nutrition-related and other socio-economic surveys need to be carefully weighed against the benefits that could accrue to Indonesia’s efforts towards reducing child malnutrition based on more informed and thus better coordinated multisectoral approaches.
Context matters: The gain in height for age z-scores associated with simultaneous access to two or more of the four underlying determinants of nutrition, varies by the wealth status of the household, and rural and urban areas.
Targeting and tailoring: The above also suggests that “one size fits all” multi-sectoral programs are not likely to be as effective as multi-sectoral programs that are tailored and targeted to specific age groups, specific locations and/or low wealth groups. Investments in nutrition-specific and nutrition-sensitive interventions should focus on areas where access to adequate levels in the four drivers of nutrition is relatively less prevalent.
Better coordination and integration: Progress towards reducing stunting in Indonesia can be enhanced by coordinated multi-sectoral interventions that address effectively the four key underlying determinants of nutrition. The poor performance of multi-sectoral projects in nutrition and health across the world provides the opportunity to learn a lot from the failures of the past, especially when it comes to setting the clarity of objectives and the role and responsibility of each sector involved in the renewed effort to reduce stunting Indonesia. Clarity and prior agreement on the common yardstick to be used among the different sectors involved can lead to significant improvements in the efficiency and efficacy of policies against child undernutrition.

48
Operationalizing a Multi-Sectoral Approach for the Reduction of Stunting

49
References
Alderman, H., Hoogeveen, H., & Rossi, M. (2005). “Reducing child malnutrition in Tanzania – combined effects of income growth and program interventions,” World Bank Policy Research Working Paper 3567. The World Bank, Washington, DC.
Barrera, A. (1990): “The Role of Maternal Schooling and Its Interaction with Public Health Programs in Child Health Production,” Journal of Development Economics 32: 69–91.
Barrett, C. B. (2009): “Measuring Food Insecurity”, Science, 327, 825(2010)
Behrman, J., Deolalikar, A., (1987). “Will developing country nutrition improve with income? A case study for rural south India,” Journal of Political Economy, 95, 492–507.
Black, R.E., C.G. Victora, S.P. Walker, Z.A. Bhutta, P. Christian, M. de Onis, M. Ezzati, S. Grantham-McGegor, J. Katz, R. Martorell, R. Uauy, and the Maternal and Child Nutrition Study Group, (2013) “Maternal and Child Undernutrition and Overweight in Low-Income and Middle-Income Countries, The Lancet, 382 (Issue 9890): 427-51. http://dx.doi.org/10.1016/S0140-6736(13)60937-X
Bramson, Leslie, Jerry W. Lee, Elizabeth Moore, Susanne Montgomery, Christine Neish, Khaled Bahjri, and Carolyn Lopez Melcher (2010). “Effect of Early Skin-to-Skin Mother—Infant Contact During the First 3 Hours Following Birth on Exclusive Breastfeeding During the Maternity Hospital Stay,” Journal of Human Lactation, 26(2), 130-137.
Christiaensen, L., and Alderman, H. (2004). “Child malnutrition in Ethiopia: Can maternal knowledge augment the role of income?” Economic Development and Cultural Change, 52(2), 287–312.
Deolalikar, A. (2008). “Malnutrition and hunger.” Copenhagen consensus 2008 perspective paper. Copenhagen: Copenhagen Consensus Centre.
Edmond, KM, et al. (2006). “Delayed breastfeeding initiation increases risk of neonatal mortality,” Pediatrics 117 (3), e380-3386.
Elfindri and Gouranga Lal Dasvarma (1996). ‘Child Malnutrition in Indonesia’, Bulletin of Indonesian Economic Studies 31 (1): 97–111.
FAO (2004). “Human energy requirements. Report of Joint FAO/WHO/UNU Expert Consultation,” Food and Nutrition Technical Report Series, No. 1. Accessed February 2016 from ftp://ftp.fao.org/docrep/fao/007/y5686e/y5686e00.pdf.
FAO, (2011): Developing A Response Analysis Framework For Food Security Emergencies, Discussion Paper FAO. Accessed June 6, 2013 from http://www.fao.org/fileadmin/templates/tc/tce/pdf/Response_Analysis_Framework_Discussion_Papers.pdf .
Haddad, L., Alderman, H., Appleton, S., Song, L., & Yohannes, Y. (2003). “Reducing Child Malnutrition: How Far Does Income Growth Take Us?” World Bank Economic Review, 17(1), 107–131.
Hoddinott, J., Rosegrant, M., & Torero, M. (2012). “Investments to reduce hunger and undernutrition.” Copenhagen Consensus Challenge Paper, prepared for 2012 Global Copenhagen Consensus Challenge, Copenhagen Consensus Centre, Copenhagen.
Horton S., Shekar M., McDonald C., Mahal A.; Krystene B. J. (2010): Scaling Up Nutrition: What Will it Cost?. Washington, DC: World Bank. Accessed June 6, 2013 from http://hdl.handle.net/10986/2685.
IPKM (2014) I ndeks Pembangunan Kesehatan Masyarakat 2013. –Jakarta : Badan Penelitian dan Pengembangan Kesehatan. 2014
Jann, B. (2013). coefplot: Stata module to plot regression
coefficients and other results. Available from http://ideas.repec.org/c/boc/bocode/s457686.html.
50
Operationalizing a Multi-Sectoral Approach for the Reduction of Stunting
Ministry of Health, Republic of Indonesia and JICA (1997). Buku Kesehatan Ibu dan Anak. Jakarta. Accessed from http://www.depkes.go.id/resources/download/info-terkini/BUKU%20KIA%2020_03%202016.pdf.
Moore, Elizabeth R., Gene C. Anderson, and Nils Bergman (2007). “Early skin-to-skin contact for mothers and their healthy newborn infants.” Cochrane Database Syst Rev 3.
Mullany, LC, Katz J, Li YM, Khartry SK, LeClerq SC, Darmstadt GL, Tielsch JM (2008). “Breast-feeding patterns, time to initiation, and mortality risk among newborns in southern Nepal,” Journal of Nutrition, 138 (3), 599-603.
Rajaram, S., Zottarelli, L. K., & Sunil, T. S. (2007). ”Individual, household, programme and community: Effects on childhood malnutrition in rural India,” Maternal and Child Nutrition, 2007(3), 129–140.
Riely, F., Mock, N., Cogill, B., Bailey, L. & Kenefick, E. (1999): “Food Security Indicators and Framework for Use in the Monitoring and Evaluation of Food Aid Programs”, Food Security and Nutrition Monitoring (IMPACT) Project for the U.S. Agency for International Development, Arlington, VA. Accessed on June 6, 2013 from http://www.fantaproject.org/downloads/pdfs/fsindctr.PDF .
Sahn, D. and Alderman H. (1997). “On the Determination of Nutrition in Mozambique: The Importance of Age-Specific Effects,” World Development, 25(4): 577-588.
Shekar M, Ruel-Bergeron J, Herforth A.(2013) Module A. Introduction. In: Improving Nutrition through Multisectoral Approaches. Washington, DC, International Bank for Reconstruction and Development, International Development Association of The World Bank, 2013.
Skoufias, E. (1999). “Parental Education and Child Nutrition in Indonesia,” Bulletin of Indonesian Economic Studies, Vol.35, No. 1, (April), pp. 99-119.
Skoufias et al (2015). “Synergies in Child Nutrition: Interactions of Food Security, Health and Environment, and Child Care.” Washington, DC, The World Bank.
Strauss, John, and Thomas D., (1995). “Empirical Modeling of Household and Family Decisions”, in J. Behrman and T.N. Srinivasan (eds), Handbook of Development Economics, 3A, North Holland, Amsterdam.
Trihono et al. (2015) “Pendek (Stunting) di Indonesia, Masalah dan Solusinya,” Jakarta: Badan Penelitian dan Pengembangan Kesehatan.
UNICEF (1990). “Strategy for Improved Nutrition of Children and Women in Developing Countries.”
WHO (2007). “Standards for Maternal and Neonatal Care.” Department of Making Pregnancy Safer. Accessed March 2016 from http://apps.who.int/iris/bitstream/10665/69735/1/a91272.pdf.
WHO (2008). “Indicators for assessing infant and young child feeding practices – part I: definition.” Accessed from March 2016 from http://www.who.int/maternal_child_adolescent/documents/9789241596664/en/.
WHO/UNICEF Joint Monitoring Program for Water Supply and Sanitation (2015). “JMP Green Paper: Global monitoring of water, sanitation and hygiene post-2025,” Draft, Updated October 2015. Accessed on March 24, 2016 from http://www.wssinfo.org/fileadmin/user_upload/resources/JMP-Green-Paper-15-Oct-2015.pdf.
World Bank (2013). “Improving Nutrition Through Multisectoral Approaches.” Washington, DC, The World Bank.
World Food Programme, (2009). “Emergency Food Security Assessment Handbook.” Rome, WFP, Accessed on June 24, 2013 from http://documents.wfp.org/stellent/groups/public/documents/manual_guide_proced/wfp203244.pdf.

51
Appendixes

52
Operationalizing a Multi-Sectoral Approach for the Reduction of Stunting
Appendix A. High and Low Stunting Districts
2007
LOW-STUNT DISTRICTS HIGH-STUNT DISTRICTS
1172120312171273127713011308131013111371137313751377140414051406
1407140815051571827117061771180518711872190321712172317131733174
3175320932113216327232733275327532753277327933013302330933113312
3315337233733401347135013503350335033506351435163525357135723573
3575357635773578367151025103510351035171610461716172620862126310
6372640264066471710471057172717271727209730473077311731373177322
73257372740374069107917194019401940194049411941994209471
1101110211031104110611101112111311161117117312011202120512101211
1213121412151216127113041309160116021610170117071802180418082102
2104320432783313331633173329352035273528360136045202520352035204
5206520752725301530453055306530753105312531453156101610261056108
6110620362046205620662106211630163036306630863116407640872037305
7306731473157316737174047407750276037604810281038104810581078171
82018202820382729103910591069108941094169417941894269427
2013
LOW-STUNT DISTRICTS HIGH-STUNT DISTRICTS
1104117111731174127413071308137213731374137513761405140614081507
1571161016111671167417071771180618071901190219041905190619712101
2105217121723171317231733175320132103216327132733274327532763277
3278330933103311331233133314332033713372337333743376340134023403
3404347135023504350535073515351635193520352135253572357335743575
3578360336713672367336745102510351055171520761036110617161726207
6208640164026403640464056410647164726474710471057106717271737312
7313740775058108817182719401941094159419942694269436
1101110611091112111311171175120112021203120412051208121312151216
1217121912201221122212241225127712781302130913101312140715011505
1506160316091702170418051809187232173315331633213327351135133524
3529520152025204520552085301530253035304530753085312531353145315
5316531753195320610161076109611162046209621062126302630363046306
6307630871077110720172037207730973157316731773187401740474087472
7504760176027604760581048105810681098172820182038204910591069108
9109917194029404940994149417941894299430943194349435
A district is considered to be a high-stunt district if in the particular year it had a stunting rate that was in the top 25 percent of the district stunting rates and a low-stunt district if in the particular year it had a stunting rate that was in the bottom 25% of the district stunting rates.
For the 2013 district stunting rates published by the Ministry of Health were used. For 2007 the district stunting rates were based on the HAZ calculated by the authors. Following are the district codes for the districts assigned to each category.

53
Appendix B. Additional models for RISKESDAS 2013: HAZ and stunting as measures of nutrition
Tables B.1 – B.3 presents the regression results depicted in Figures 22 -24.
TABLE B.1: Estimates of the marginal increase in mean HAZ score with access to each one of the four underlying determinants of nutrition separately and in combination, 2013. Model A
NATIONAL NATIONAL, DEFINITION 2Defn 1 Defn 2 0-23 month olds 24-35 month olds
Adequate in: Food only0.386* 0.383*** 0.365** 0.393**(0.212) (0.141) (0.184) (0.196)
Adequate in: Care only-0.059 -0.049 0.302 0.169(0.106) (0.172) (0.385) (0.172)
Adequate in: Environment only0.154** 0.199*** 0.149** 0.290***(0.078) (0.054) (0.068) (0.087)
Adequate in: Health only0.072 0.187*** 0.120 0.282**
(0.086) (0.063) (0.075) (0.111)
Adequate in Food and Care only0.072 -0.720** -0.994** -0.216(0.332) (0.311) (0.475) (0.403)
Adequate in Food and Environment only0.171 0.248** 0.225 0.353**
(0.155) (0.110) (0.139) (0.163)
Adequate in Food and Health only-0.069 0.049 0.029 -0.104(0.205) (0.136) (0.167) (0.164)
Adequate in Care and Environment only 0.083 0.115 0.483* 0.314**(0.111) (0.130) (0.255) (0.144)
Adequate in Care and Health only0.191 0.156 0.415 0.353*
(0.116) (0.179) (0.309) (0.214)
Adequate in Environment and Health only0.273*** 0.355*** 0.301*** 0.407***(0.074) (0.054) (0.065) (0.086)
Adequate in: Food, Care and Environment only 0.396 0.505** 0.714 0.814***
(0.244) (0.222) (0.437) (0.228)
Adequate in: Food, Care and Health only0.055 0.245 -1.053 1.129***
(0.282) (0.464) (1.044) (0.379)
Adequate in: Care, Environment and Health only0.310*** 0.387*** 0.373 0.742***(0.114) (0.142) (0.275) (0.155)
Adequate in: Food, Environment and Health 0.609*** 0.548*** 0.506*** 0.572***(0.140) (0.098) (0.118) (0.160)
Adequate in: All Four0.164 0.251 0.224 0.615***(0.171) (0.189) (0.341) (0.226)
Constant-1.143*** -1.383*** -1.164*** -1.852***(0.052) (0.038) (0.046) (0.055)
Observations 20,034 30,051 20,034 10,017R-squared 0.005 0.005 0.005 0.012F-Stat 2.651 5.113 2.973 4.208Prob>F 0.001 0 0 0
Source: Author calculations based on Riskesdas 2013.Notes: Standard errors in parenthesis. *** p<0.01, ** p<0.05, * p<0.1.
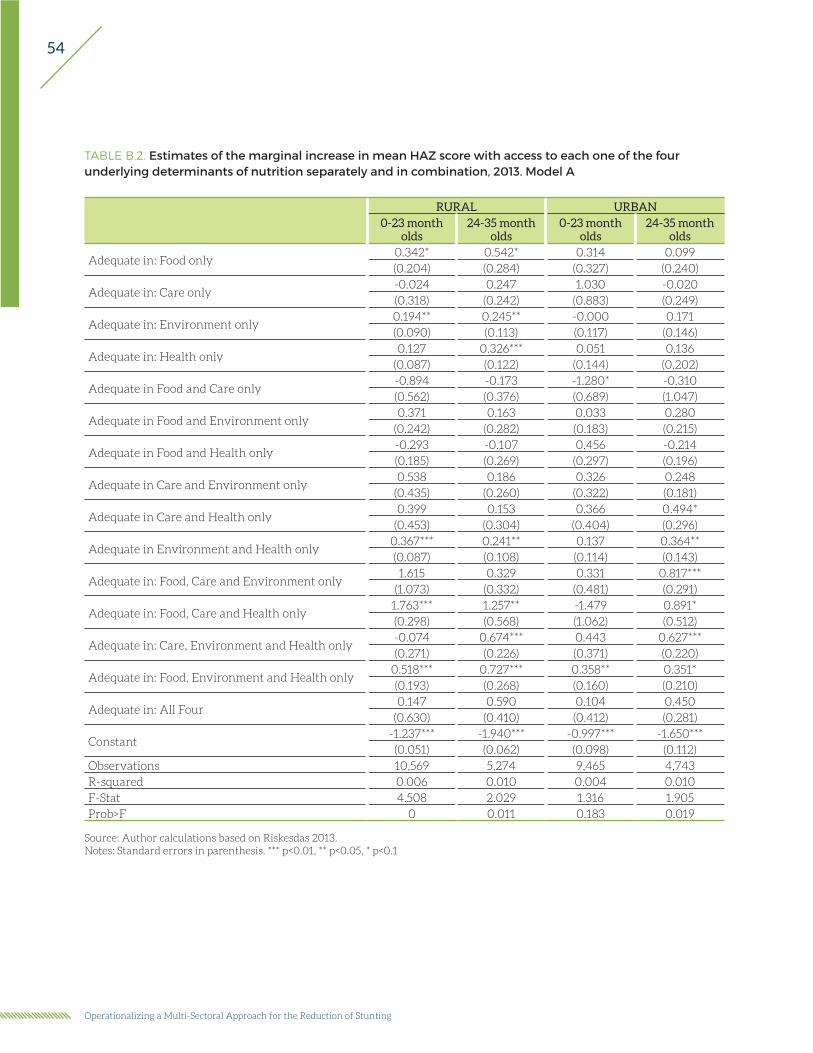
54
Operationalizing a Multi-Sectoral Approach for the Reduction of Stunting
TABLE B.2. Estimates of the marginal increase in mean HAZ score with access to each one of the four underlying determinants of nutrition separately and in combination, 2013. Model A
RURAL URBAN0-23 month
olds24-35 month
olds0-23 month
olds24-35 month
olds
Adequate in: Food only0.342* 0.542* 0.314 0.099(0.204) (0.284) (0.327) (0.240)
Adequate in: Care only-0.024 0.247 1.030 -0.020(0.318) (0.242) (0.883) (0.249)
Adequate in: Environment only0.194** 0.245** -0.000 0.171(0.090) (0.113) (0.117) (0.146)
Adequate in: Health only0.127 0.326*** 0.051 0.136
(0.087) (0.122) (0.144) (0.202)
Adequate in Food and Care only-0.894 -0.173 -1.280* -0.310(0.562) (0.376) (0.689) (1.047)
Adequate in Food and Environment only0.371 0.163 0.033 0.280
(0.242) (0.282) (0.183) (0.215)
Adequate in Food and Health only-0.293 -0.107 0.456 -0.214(0.185) (0.269) (0.297) (0.196)
Adequate in Care and Environment only 0.538 0.186 0.326 0.248
(0.435) (0.260) (0.322) (0.181)
Adequate in Care and Health only0.399 0.153 0.366 0.494*
(0.453) (0.304) (0.404) (0.296)
Adequate in Environment and Health only0.367*** 0.241** 0.137 0.364**(0.087) (0.108) (0.114) (0.143)
Adequate in: Food, Care and Environment only 1.615 0.329 0.331 0.817***
(1.073) (0.332) (0.481) (0.291)
Adequate in: Food, Care and Health only1.763*** 1.257** -1.479 0.891*(0.298) (0.568) (1.062) (0.512)
Adequate in: Care, Environment and Health only-0.074 0.674*** 0.443 0.627***(0.271) (0.226) (0.371) (0.220)
Adequate in: Food, Environment and Health only0.518*** 0.727*** 0.358** 0.351*(0.193) (0.268) (0.160) (0.210)
Adequate in: All Four0.147 0.590 0.104 0.450
(0.630) (0.410) (0.412) (0.281)
Constant-1.237*** -1.940*** -0.997*** -1.650***(0.051) (0.062) (0.098) (0.112)
Observations 10,569 5,274 9,465 4,743R-squared 0.006 0.010 0.004 0.010F-Stat 4.508 2.029 1.316 1.905Prob>F 0 0.011 0.183 0.019
Source: Author calculations based on Riskesdas 2013.Notes: Standard errors in parenthesis. *** p<0.01, ** p<0.05, * p<0.1
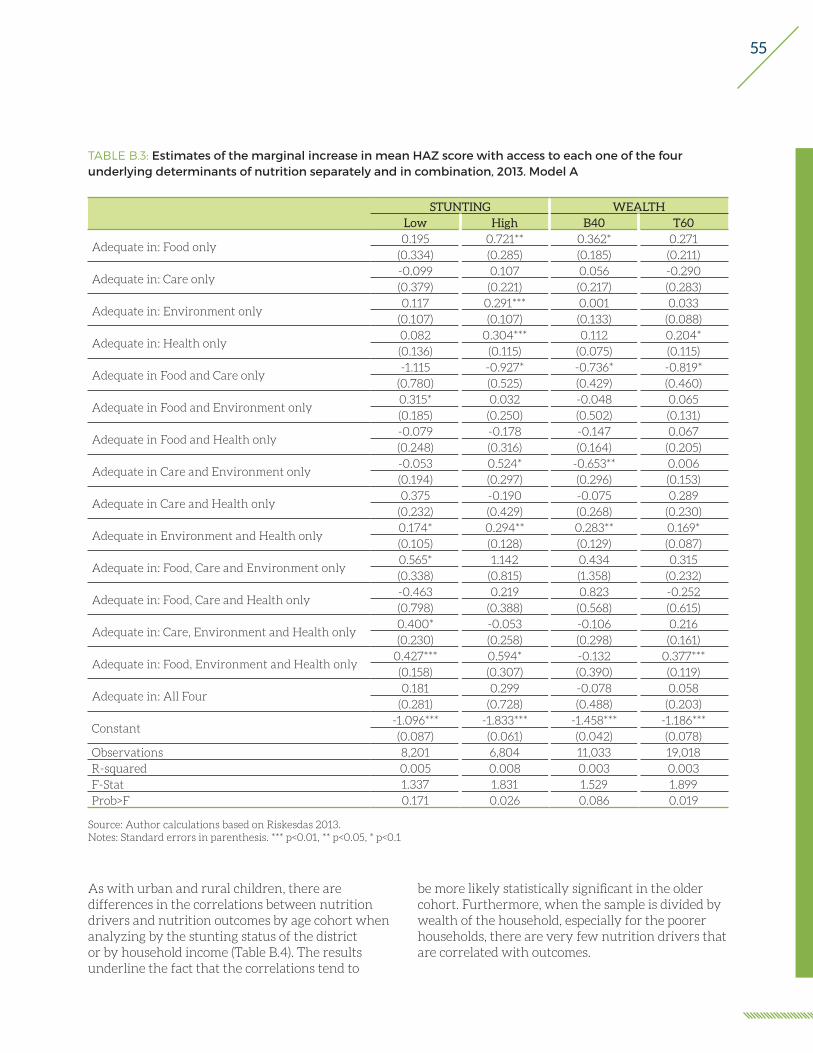
55
TABLE B.3: Estimates of the marginal increase in mean HAZ score with access to each one of the four underlying determinants of nutrition separately and in combination, 2013. Model A
STUNTING WEALTHLow High B40 T60
Adequate in: Food only0.195 0.721** 0.362* 0.271
(0.334) (0.285) (0.185) (0.211)
Adequate in: Care only-0.099 0.107 0.056 -0.290(0.379) (0.221) (0.217) (0.283)
Adequate in: Environment only0.117 0.291*** 0.001 0.033
(0.107) (0.107) (0.133) (0.088)
Adequate in: Health only0.082 0.304*** 0.112 0.204*(0.136) (0.115) (0.075) (0.115)
Adequate in Food and Care only-1.115 -0.927* -0.736* -0.819*
(0.780) (0.525) (0.429) (0.460)
Adequate in Food and Environment only0.315* 0.032 -0.048 0.065(0.185) (0.250) (0.502) (0.131)
Adequate in Food and Health only-0.079 -0.178 -0.147 0.067(0.248) (0.316) (0.164) (0.205)
Adequate in Care and Environment only -0.053 0.524* -0.653** 0.006(0.194) (0.297) (0.296) (0.153)
Adequate in Care and Health only0.375 -0.190 -0.075 0.289
(0.232) (0.429) (0.268) (0.230)
Adequate in Environment and Health only0.174* 0.294** 0.283** 0.169*(0.105) (0.128) (0.129) (0.087)
Adequate in: Food, Care and Environment only 0.565* 1.142 0.434 0.315(0.338) (0.815) (1.358) (0.232)
Adequate in: Food, Care and Health only-0.463 0.219 0.823 -0.252(0.798) (0.388) (0.568) (0.615)
Adequate in: Care, Environment and Health only0.400* -0.053 -0.106 0.216(0.230) (0.258) (0.298) (0.161)
Adequate in: Food, Environment and Health only0.427*** 0.594* -0.132 0.377***(0.158) (0.307) (0.390) (0.119)
Adequate in: All Four0.181 0.299 -0.078 0.058
(0.281) (0.728) (0.488) (0.203)
Constant-1.096*** -1.833*** -1.458*** -1.186***(0.087) (0.061) (0.042) (0.078)
Observations 8,201 6,804 11,033 19,018R-squared 0.005 0.008 0.003 0.003F-Stat 1.337 1.831 1.529 1.899Prob>F 0.171 0.026 0.086 0.019
Source: Author calculations based on Riskesdas 2013.Notes: Standard errors in parenthesis. *** p<0.01, ** p<0.05, * p<0.1
As with urban and rural children, there are differences in the correlations between nutrition drivers and nutrition outcomes by age cohort when analyzing by the stunting status of the district or by household income (Table B.4). The results underline the fact that the correlations tend to
be more likely statistically significant in the older cohort. Furthermore, when the sample is divided by wealth of the household, especially for the poorer households, there are very few nutrition drivers that are correlated with outcomes.

56
Operationalizing a Multi-Sectoral Approach for the Reduction of Stunting
TABLE B.4: Estimates of the marginal increase in mean HAZ score with access to each one of the four underlying determinants of nutrition separately and in combination, 2013. Model A
Low-stunt district High-stunt district Bottom 40% Top 60%0-23
months24-35
months0-23
months24-35
months0-23
months24-35
months0-23
months24-35
months
Adequate in: Food0.355 -0.075 0.684** 0.835 0.390 0.194 0.256 0.351
(0.481) (0.195) (0.331) (0.571) (0.238) (0.224) (0.279) (0.297)
Adequate in: Care0.654 0.067 -0.133 0.553** 0.331 0.251 0.230 -0.091(1.029) (0.331) (0.418) (0.259) (0.437) (0.217) (0.776) (0.252)
Adequate in: Environment 0.041 0.290* 0.281** 0.286* 0.078 -0.160 0.028 0.081
(0.140) (0.157) (0.133) (0.160) (0.171) (0.177) (0.113) (0.120)
Adequate in: Health0.003 0.285 0.212 0.389** 0.024 0.222* 0.197 0.223(0.165) (0.243) (0.139) (0.194) (0.089) (0.118) (0.140) (0.201)
Adequate in Food and Care -1.447** -0.613 -1.402*** 0.271 -0.882 -0.315 -1.197** -0.302(0.600) (1.084) (0.454) (0.831) (0.780) (0.485) (0.478) (0.646)
Adequate in Food and Environment
0.256 0.480** 0.113 -0.180 0.483 -0.652 0.084 0.125(0.240) (0.243) (0.318) (0.366) (0.489) (0.780) (0.166) (0.182)
Adequate in Food and Health 0.080 -0.345 -0.440 0.427 -0.227 -0.108 0.129 -0.289(0.324) (0.226) (0.384) (0.506) (0.201) (0.245) (0.253) (0.218)
Adequate in Care and Environment
0.340 0.130 -0.645 1.267*** -1.010* -0.102 0.531* 0.090(0.407) (0.204) (0.581) (0.316) (0.548) (0.296) (0.282) (0.170)
Adequate in Care and Health 0.199 0.802*** 0.277 -0.190 0.676 -0.259 -0.001 0.743**
(0.370) (0.293) (0.433) (0.625) (0.454) (0.183) (0.354) (0.291)
Adequate in Environment and Health
0.093 0.335** 0.376** -0.059 0.287* 0.188 0.170 0.156(0.133) (0.156) (0.159) (0.185) (0.161) (0.173) (0.109) (0.116)
Adequate in: Food, Care and Environment
1.050* 0.766** 1.720*** 1.371 4.052*** -0.394 0.440 0.602**(0.617) (0.343) (0.346) (0.877) (0.965) (0.790) (0.441) (0.239)
Adequate in: Food, Care and Health
-2.581*** 1.162* 0.767 0.435 0.655 1.296** -1.577 0.794*(0.841) (0.633) (0.893) (0.358) (0.564) (0.590) (1.157) (0.430)
Adequate in: Care, Environment and Health
0.534 0.663*** -0.553 0.562* -1.926*** 0.819*** 0.302 0.470***(0.458) (0.230) (0.454) (0.300) (0.355) (0.282) (0.293) (0.179)
Adequate in: Food, Environment and Health
0.386* 0.519** 0.738** 0.350 -0.170 -0.153 0.395*** 0.326*(0.204) (0.215) (0.357) (0.394) (0.335) (1.022) (0.147) (0.174)
Adequate in: All Four-0.142 0.680** 0.696 0.548 -0.028 0.215 0.092 0.347(0.618) (0.285) (1.036) (0.888) (1.303) (0.169) (0.356) (0.242)
Constant-0.905*** -1.533*** -1.617*** -2.268*** -1.219*** -1.943*** -1.028*** -1.579***
(0.115) (0.105) (0.076) (0.088) (0.051) (0.063) (0.099) (0.097)Observations 5,403 2,798 4,525 2,279 7,342 3,691 12,692 6,326R-squared 0.007 0.015 0.010 0.026 0.005 0.008 0.003 0.007F-Stat 1.809 2.610 3.650 1.924 4.316 1.841 1.759 1.862Prob>F 0.028 0.001 0 0.018 0 0.025 0.035 0.022
Source: Author calculations based on Riskesdas 2013.Notes: Standard errors in parenthesis. *** p<0.01, ** p<0.05, * p<0.1
Results using the child’s stunting status as the dependent variable, corroborates the findings when using HAZ as the dependent variable (Tables B.5and B.6). That is children with access to adequate environment only or adequate health only were less
likely to be stunted. In line with the results with HAZ score as the dependent variable, there were more statistically significant correlations in the older age cohort than in the younger cohort.
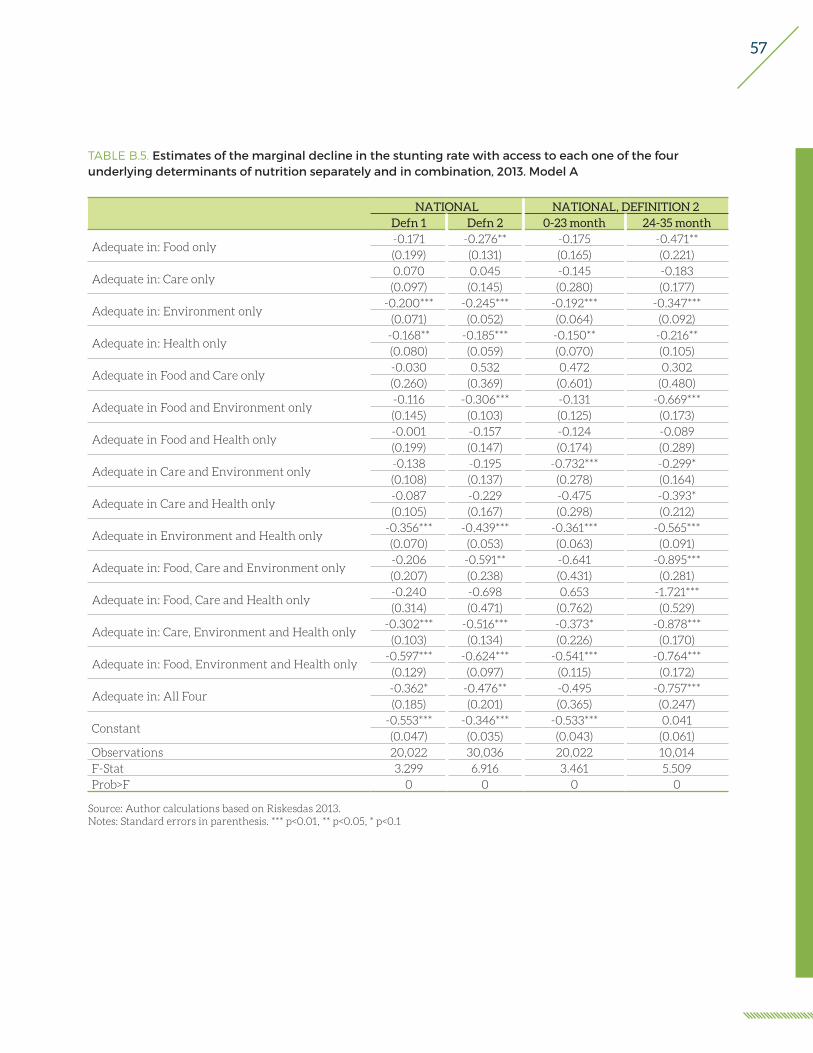
57
TABLE B.5. Estimates of the marginal decline in the stunting rate with access to each one of the four underlying determinants of nutrition separately and in combination, 2013. Model A
NATIONAL NATIONAL, DEFINITION 2Defn 1 Defn 2 0-23 month 24-35 month
Adequate in: Food only-0.171 -0.276** -0.175 -0.471**(0.199) (0.131) (0.165) (0.221)
Adequate in: Care only0.070 0.045 -0.145 -0.183(0.097) (0.145) (0.280) (0.177)
Adequate in: Environment only-0.200*** -0.245*** -0.192*** -0.347***
(0.071) (0.052) (0.064) (0.092)
Adequate in: Health only-0.168** -0.185*** -0.150** -0.216**(0.080) (0.059) (0.070) (0.105)
Adequate in Food and Care only-0.030 0.532 0.472 0.302(0.260) (0.369) (0.601) (0.480)
Adequate in Food and Environment only-0.116 -0.306*** -0.131 -0.669***(0.145) (0.103) (0.125) (0.173)
Adequate in Food and Health only-0.001 -0.157 -0.124 -0.089(0.199) (0.147) (0.174) (0.289)
Adequate in Care and Environment only -0.138 -0.195 -0.732*** -0.299*(0.108) (0.137) (0.278) (0.164)
Adequate in Care and Health only-0.087 -0.229 -0.475 -0.393*(0.105) (0.167) (0.298) (0.212)
Adequate in Environment and Health only-0.356*** -0.439*** -0.361*** -0.565***(0.070) (0.053) (0.063) (0.091)
Adequate in: Food, Care and Environment only -0.206 -0.591** -0.641 -0.895***(0.207) (0.238) (0.431) (0.281)
Adequate in: Food, Care and Health only-0.240 -0.698 0.653 -1.721***(0.314) (0.471) (0.762) (0.529)
Adequate in: Care, Environment and Health only-0.302*** -0.516*** -0.373* -0.878***
(0.103) (0.134) (0.226) (0.170)
Adequate in: Food, Environment and Health only-0.597*** -0.624*** -0.541*** -0.764***
(0.129) (0.097) (0.115) (0.172)
Adequate in: All Four-0.362* -0.476** -0.495 -0.757***(0.185) (0.201) (0.365) (0.247)
Constant-0.553*** -0.346*** -0.533*** 0.041(0.047) (0.035) (0.043) (0.061)
Observations 20,022 30,036 20,022 10,014F-Stat 3.299 6.916 3.461 5.509Prob>F 0 0 0 0
Source: Author calculations based on Riskesdas 2013.Notes: Standard errors in parenthesis. *** p<0.01, ** p<0.05, * p<0.1

58
Operationalizing a Multi-Sectoral Approach for the Reduction of Stunting
TABLE B.6. Estimates of the marginal decline in the stunting rate with access to each one of the four underlying determinants of nutrition separately and in combination, 2013. Model A
RURAL URBAN0 - 23 month 24 - 35 month 0 - 23 month 24 - 35 month
Adequate in: Food only-0.157 -0.418 -0.084 -0.474(0.198) (0.265) (0.287) (0.416)
Adequate in: Care only-0.268 -0.062 0.147 -0.218(0.337) (0.220) (0.508) (0.301)
Adequate in: Environment only-0.200** -0.197* -0.008 -0.255(0.083) (0.116) (0.113) (0.158)
Adequate in: Health only-0.175** -0.364*** -0.026 0.090(0.080) (0.121) (0.138) (0.194)
Adequate in Food and Care only0.269 0.387 1.165 0.104
(0.707) (0.628) (0.962) (0.792)
Adequate in Food and Environment only-0.250 -0.269 0.117 -0.669***(0.196) (0.267) (0.172) (0.245)
Adequate in Food and Health only0.065 0.030 -0.381 -0.061(0.211) (0.370) (0.307) (0.449)
Adequate in Care and Environment only -0.465 -0.181 -0.706** -0.184(0.472) (0.255) (0.331) (0.234)
Adequate in Care and Health only-0.467 -0.085 -0.386 -0.682**(0.382) (0.283) (0.481) (0.334)
Adequate in Environment and Health only-0.404*** -0.365*** -0.152 -0.510***
(0.084) (0.120) (0.113) (0.155)
Adequate in: Food, Care and Environment only -1.190 -0.625 -0.298 -0.783**(1.073) (0.415) (0.488) (0.376)
Adequate in: Food, Care and Health only -1.571** 1.097 -1.740** (0.680) (0.795) (0.839)
Adequate in: Care, Environment and Health only-0.080 -0.868*** -0.332 -0.686***(0.400) (0.243) (0.269) (0.246)
Adequate in: Food, Environment and Health only-0.299 -0.652** -0.416*** -0.565**(0.183) (0.285) (0.161) (0.230)
Adequate in: All Four-0.490 -0.500 -0.286 -0.621*(0.560) (0.391) (0.456) (0.318)
Constant-0.432*** 0.157** -0.775*** -0.224*(0.046) (0.068) (0.096) (0.125)
Observations 10,560 5,272 9,460 4,742F-Stat 2.001 2.313 1.517 2.276Prob>F 0.0144 0.00283 0.0901 0.00342
Source: Author calculations based on Riskesdas 2013.Notes: Standard errors in parenthesis. *** p<0.01, ** p<0.05, * p<0.1
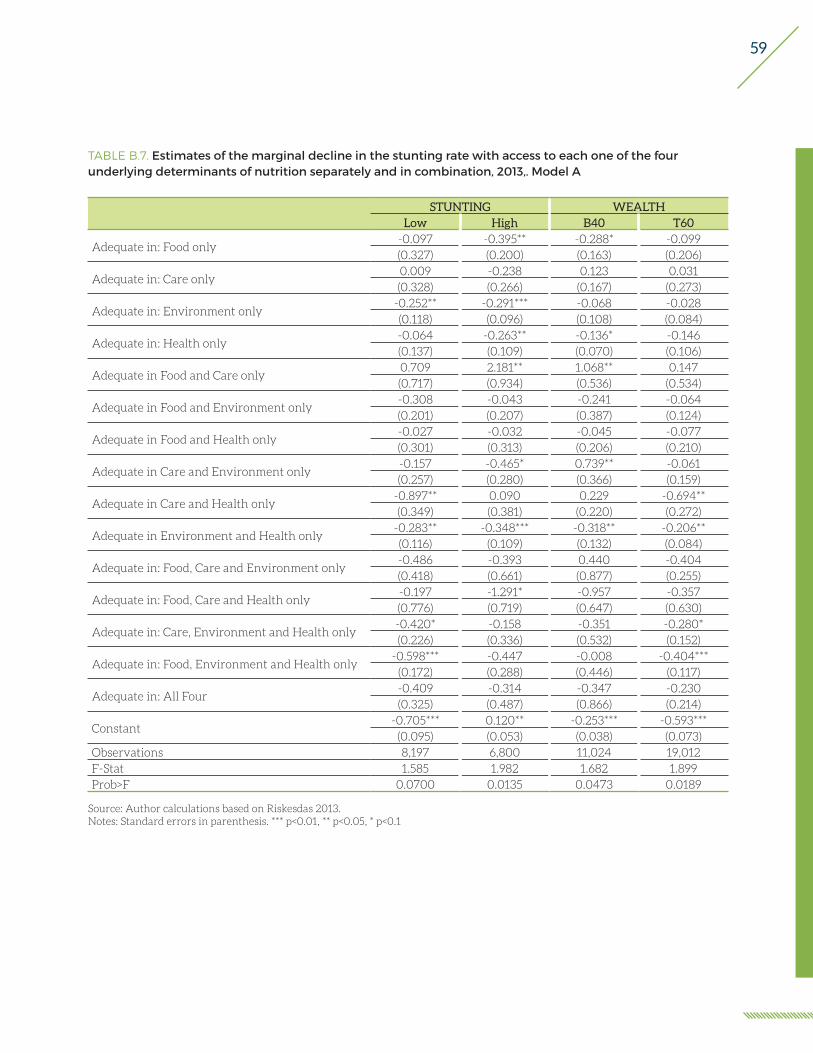
59
TABLE B.7. Estimates of the marginal decline in the stunting rate with access to each one of the four underlying determinants of nutrition separately and in combination, 2013,. Model A
STUNTING WEALTHLow High B40 T60
Adequate in: Food only-0.097 -0.395** -0.288* -0.099(0.327) (0.200) (0.163) (0.206)
Adequate in: Care only0.009 -0.238 0.123 0.031(0.328) (0.266) (0.167) (0.273)
Adequate in: Environment only-0.252** -0.291*** -0.068 -0.028(0.118) (0.096) (0.108) (0.084)
Adequate in: Health only-0.064 -0.263** -0.136* -0.146(0.137) (0.109) (0.070) (0.106)
Adequate in Food and Care only0.709 2.181** 1.068** 0.147(0.717) (0.934) (0.536) (0.534)
Adequate in Food and Environment only-0.308 -0.043 -0.241 -0.064(0.201) (0.207) (0.387) (0.124)
Adequate in Food and Health only-0.027 -0.032 -0.045 -0.077(0.301) (0.313) (0.206) (0.210)
Adequate in Care and Environment only -0.157 -0.465* 0.739** -0.061(0.257) (0.280) (0.366) (0.159)
Adequate in Care and Health only-0.897** 0.090 0.229 -0.694**(0.349) (0.381) (0.220) (0.272)
Adequate in Environment and Health only-0.283** -0.348*** -0.318** -0.206**(0.116) (0.109) (0.132) (0.084)
Adequate in: Food, Care and Environment only -0.486 -0.393 0.440 -0.404(0.418) (0.661) (0.877) (0.255)
Adequate in: Food, Care and Health only-0.197 -1.291* -0.957 -0.357(0.776) (0.719) (0.647) (0.630)
Adequate in: Care, Environment and Health only-0.420* -0.158 -0.351 -0.280*(0.226) (0.336) (0.532) (0.152)
Adequate in: Food, Environment and Health only-0.598*** -0.447 -0.008 -0.404***
(0.172) (0.288) (0.446) (0.117)
Adequate in: All Four-0.409 -0.314 -0.347 -0.230(0.325) (0.487) (0.866) (0.214)
Constant-0.705*** 0.120** -0.253*** -0.593***
(0.095) (0.053) (0.038) (0.073)Observations 8,197 6,800 11,024 19,012F-Stat 1.585 1.982 1.682 1.899Prob>F 0.0700 0.0135 0.0473 0.0189
Source: Author calculations based on Riskesdas 2013.Notes: Standard errors in parenthesis. *** p<0.01, ** p<0.05, * p<0.1
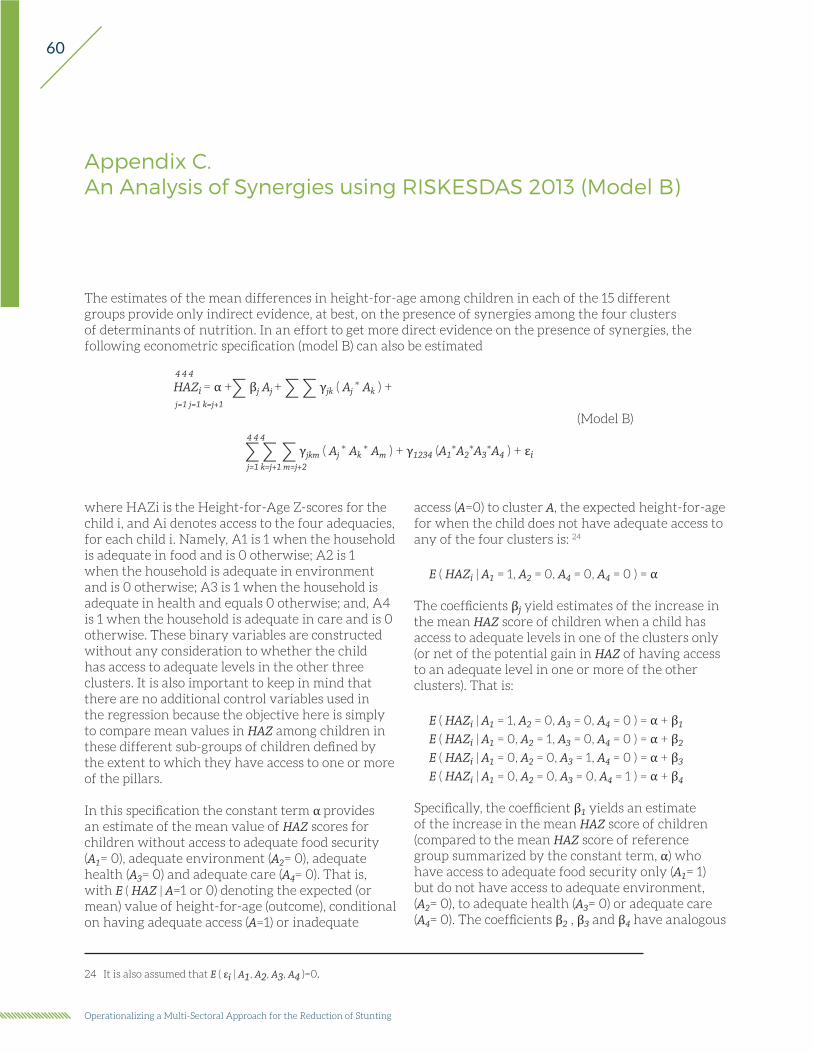
60
Operationalizing a Multi-Sectoral Approach for the Reduction of Stunting
Appendix C.An Analysis of Synergies using RISKESDAS 2013 (Model B)
The estimates of the mean differences in height-for-age among children in each of the 15 different groups provide only indirect evidence, at best, on the presence of synergies among the four clusters of determinants of nutrition. In an effort to get more direct evidence on the presence of synergies, the following econometric specification (model B) can also be estimated
access (A=0) to cluster A, the expected height-for-age for when the child does not have adequate access to any of the four clusters is: 24
E ( HAZi | A1 = 1, A2 = 0, A4 = 0, A4 = 0 ) = α
The coefficients βj yield estimates of the increase in the mean HAZ score of children when a child has access to adequate levels in one of the clusters only (or net of the potential gain in HAZ of having access to an adequate level in one or more of the other clusters). That is:
E ( HAZi | A1 = 1, A2 = 0, A3 = 0, A4 = 0 ) = α + β1
E ( HAZi | A1 = 0, A2 = 1, A3 = 0, A4 = 0 ) = α + β2
E ( HAZi | A1 = 0, A2 = 0, A3 = 1, A4 = 0 ) = α + β3
E ( HAZi | A1 = 0, A2 = 0, A3 = 0, A4 = 1 ) = α + β4
Specifically, the coefficient β1 yields an estimate of the increase in the mean HAZ score of children (compared to the mean HAZ score of reference group summarized by the constant term, α) who have access to adequate food security only (A1= 1) but do not have access to adequate environment, (A2= 0), to adequate health (A3= 0) or adequate care (A4= 0). The coefficients β2 , β3 and β4 have analogous
4 4 4
HAZi = α +∑ βj Aj + ∑ ∑ γjk ( Aj * Ak ) + j=1 j=1 k=j+1
(Model B) 4 4 4
∑ ∑ ∑ γjkm ( Aj * Ak * Am ) + γ1234 (A1*A2*A3*A4 ) + εi j=1 k=j+1 m=j+2
where HAZi is the Height-for-Age Z-scores for the child i, and Ai denotes access to the four adequacies, for each child i. Namely, A1 is 1 when the household is adequate in food and is 0 otherwise; A2 is 1 when the household is adequate in environment and is 0 otherwise; A3 is 1 when the household is adequate in health and equals 0 otherwise; and, A4 is 1 when the household is adequate in care and is 0 otherwise. These binary variables are constructed without any consideration to whether the child has access to adequate levels in the other three clusters. It is also important to keep in mind that there are no additional control variables used in the regression because the objective here is simply to compare mean values in HAZ among children in these different sub-groups of children defined by the extent to which they have access to one or more of the pillars.
In this specification the constant term α provides an estimate of the mean value of HAZ scores for children without access to adequate food security (A1= 0), adequate environment (A2= 0), adequate health (A3= 0) and adequate care (A4= 0). That is, with E ( HAZ | A=1 or 0) denoting the expected (or mean) value of height-for-age (outcome), conditional on having adequate access (A=1) or inadequate
24 It is also assumed that E ( εi | A1, A2, A3, A4 )=0.
61
interpretations for environment, health, and care, respectively.25
The coefficients γjk yield estimates of the synergies associated with having access to adequate levels in more than one of the cluster of underlying determinants of nutrition. Specifically, the mean HAZ score of children having access to adequate food security (A1= 1) and adequate environment (A2= 1) is summarized by the expression
E (HAZi | A1 = 1, A2 = 0, A3 = 0, A4 = 0) = α + β1 + β2 + γ12
The expression for the mean value of HAZ scores of children in households with access to adequate food security and adequate environment consists of the sum of three components: the first component is the increase in HAZ scores associated with children in households with adequate food security
only (i.e., β1); the second component (i.e., β2) is the increase in HAZ scores associated with children in households with adequate environment only, and the third component (i.e., γ12) is the increase in HAZ scores associated with children in households that have access to both adequate food security and adequate environment. Thus the coefficient γ12 yields information on whether there are additional (extra) gains in HAZ scores derived from having simultaneous access to adequate food and adequate environment. A significant and positive value of the coefficient γ12 implies synergies from the simultaneous access to adequate food security and adequate environment in the production of child nutrition. The mean HAZ of children from having access to other two adequacies (for example, food
and care, or food and health, or environment and care, etc.) are similarly defined.
The mean HAZ of children from having access to three components (i.e. adequate food security (Ai1 = 1) and adequate environment (Ai2 = 1) and adequate health (Ai3 = 1)) is given by the expression
E (HAZi | A1 = 1, A2 = 1, A3 = 1, A4 = 0) = α + β1 + β2 + β3 + γ12 + γ13 + γ23 + γ123
with the coefficient γ123 summarizing the potential synergies from simultaneous access to the three components. These are synergies in addition to any synergies from pairwise interactions. And similarly the mean HAZ of children from having access to all four components is given by the expression
E (HAZi | A1 = 1, A2 = 1, A3 = 1, A4 = 1)= α + β1 + β2 + β3 +β4 +γ12 + γ13 + γ14 + γ23 + γ24 + γ34 + γ123 + γ124 + γ134 + γ234 + γ1234
(Model B)
There were no systematic positive pairwise synergies in 2013 among the nutrition drivers in the populations considered. That is, although access to more than one nutrition driver can be associated with taller children than those with access to just one, there were no additional gains from access to two drivers. In fact the drivers tended to be substitutes to some degree. Table C.1 presents the results at the national level, Table C.2 for the urban and rural samples and Table C.3 for high/low-stunt districts and by household wealth.
25 It should be noted that the coefficient estimates from model A are linear combinations of the coefficient estimates in model B. However, if some interaction terms are grouped together, such as including an indicator variable of whether or not the child is adequate in any three clusters, instead of including separately all four 3-way interaction terms, γjkm, then the correspondence between the coefficients in model A and B no longer holds.

62
Operationalizing a Multi-Sectoral Approach for the Reduction of Stunting
TABLE C.1. Synergies associated with simultaneous access to two or more of the underlying determinants of nutrition, 2013, Model B
NATIONAL NATIONAL, DEFINITION 2
Defn 1 Defn 2 0-23 month 24-35 month
Adequate in Food and Care-0.255 -1.054*** -1.661*** -0.779
(0.403) (0.370) (0.630) (0.475)
Adequate in Food and Environment-0.370 -0.334* -0.289 -0.329
(0.270) (0.176) (0.227) (0.257)
Adequate in Food and Health-0.527* -0.522*** -0.455* -0.779***
(0.296) (0.198) (0.251) (0.269)
Adequate in Care and Environment-0.013 -0.035 0.032 -0.145
(0.161) (0.219) (0.466) (0.226)
Adequate in Care and Health0.178 0.017 -0.007 -0.099
(0.160) (0.248) (0.495) (0.275)
Adequate in Environment and Health0.047 -0.031 0.032 -0.165
(0.116) (0.085) (0.103) (0.147)
Adequate in: Food, Care and Environment0.552 1.395*** 1.815** 1.215**
(0.470) (0.457) (0.819) (0.557)
Adequate in: Food, Care and Health0.260 1.283** 0.283 1.940***
(0.533) (0.651) (1.261) (0.658)
Adequate in: Care, Environment and Health-0.069 0.099 -0.255 0.409
(0.231) (0.322) (0.618) (0.350)
Adequate in: Food, Environment and Health0.847** 0.666*** 0.584* 0.880**
(0.367) (0.246) (0.307) (0.358)
Adequate in: All Four-1.039 -1.952*** -0.791 -2.668***
(0.637) (0.748) (1.437) (0.785)
Source: Author calculations based on Riskesdas 2013.Notes: Standard errors in parenthesis. *** p<0.01, ** p<0.05, * p<0.1
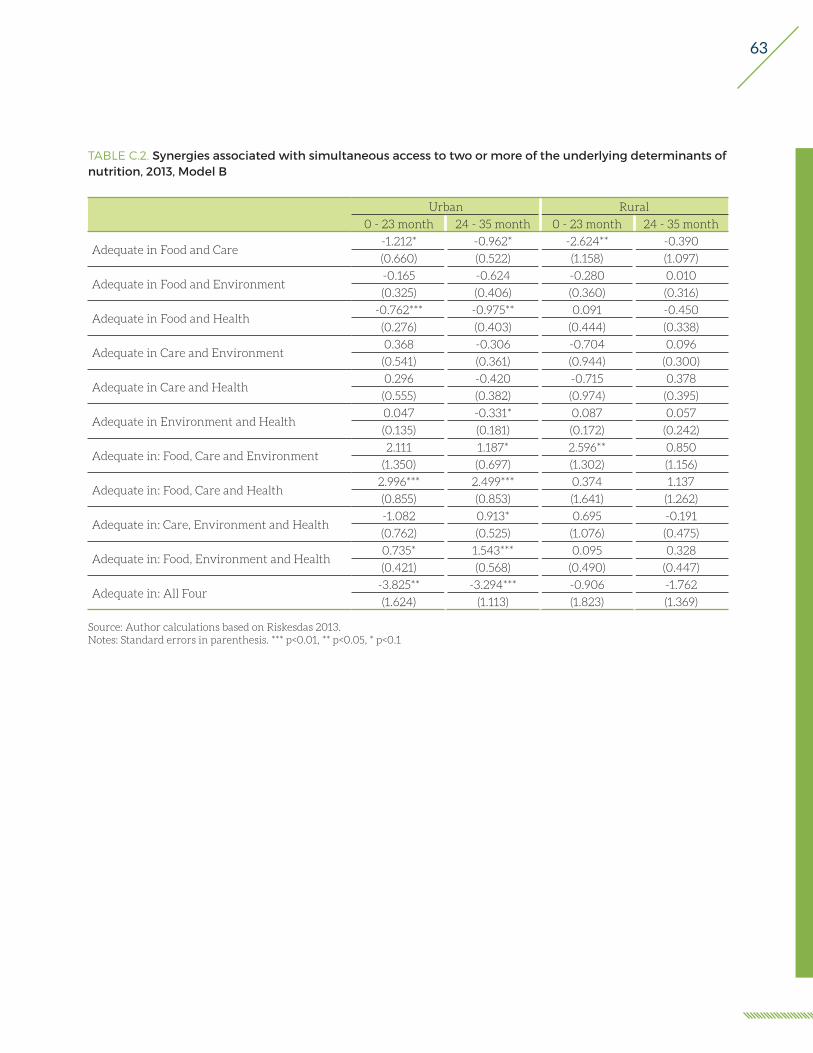
63
TABLE C.2. Synergies associated with simultaneous access to two or more of the underlying determinants of nutrition, 2013, Model B
Urban Rural
0 - 23 month 24 - 35 month 0 - 23 month 24 - 35 month
Adequate in Food and Care-1.212* -0.962* -2.624** -0.390
(0.660) (0.522) (1.158) (1.097)
Adequate in Food and Environment-0.165 -0.624 -0.280 0.010
(0.325) (0.406) (0.360) (0.316)
Adequate in Food and Health-0.762*** -0.975** 0.091 -0.450
(0.276) (0.403) (0.444) (0.338)
Adequate in Care and Environment0.368 -0.306 -0.704 0.096
(0.541) (0.361) (0.944) (0.300)
Adequate in Care and Health0.296 -0.420 -0.715 0.378
(0.555) (0.382) (0.974) (0.395)
Adequate in Environment and Health0.047 -0.331* 0.087 0.057
(0.135) (0.181) (0.172) (0.242)
Adequate in: Food, Care and Environment2.111 1.187* 2.596** 0.850
(1.350) (0.697) (1.302) (1.156)
Adequate in: Food, Care and Health2.996*** 2.499*** 0.374 1.137
(0.855) (0.853) (1.641) (1.262)
Adequate in: Care, Environment and Health-1.082 0.913* 0.695 -0.191
(0.762) (0.525) (1.076) (0.475)
Adequate in: Food, Environment and Health0.735* 1.543*** 0.095 0.328
(0.421) (0.568) (0.490) (0.447)
Adequate in: All Four-3.825** -3.294*** -0.906 -1.762
(1.624) (1.113) (1.823) (1.369)
Source: Author calculations based on Riskesdas 2013.Notes: Standard errors in parenthesis. *** p<0.01, ** p<0.05, * p<0.1

64
Operationalizing a Multi-Sectoral Approach for the Reduction of Stunting
TABLE C.3. Synergies associated with simultaneous access to two or more of the underlying determinants of nutrition, 2013, Model B
STUNTING WEALTH
Low High B40 T60
Adequate in Food and Care-1.211 -1.755*** -1.154** -0.800
(0.885) (0.631) (0.502) (0.547)
Adequate in Food and Environment0.003 -0.980** -0.411 -0.239
(0.368) (0.393) (0.549) (0.237)
Adequate in Food and Health-0.356 -1.203*** -0.621** -0.407
(0.427) (0.429) (0.250) (0.299)
Adequate in Care and Environment-0.071 0.125 -0.710* 0.262
(0.425) (0.367) (0.380) (0.316)
Adequate in Care and Health0.392 -0.601 -0.243 0.375
(0.445) (0.495) (0.342) (0.368)
Adequate in Environment and Health-0.026 -0.301* 0.170 -0.068
(0.167) (0.181) (0.187) (0.131)
Adequate in: Food, Care and Environment1.631* 2.633** 2.290 1.078*
(0.972) (1.106) (1.560) (0.613)
Adequate in: Food, Care and Health0.534 2.646*** 2.311*** 0.396
(1.291) (0.933) (0.817) (0.914)
Adequate in: Care, Environment and Health0.004 0.021 0.508 -0.300
(0.559) (0.635) (0.561) (0.433)
Adequate in: Food, Environment and Health0.411 1.761*** 0.255 0.584*
(0.479) (0.588) (0.712) (0.334)
Adequate in: All Four-1.426 -3.470** -3.004 -1.040
(1.408) (1.547) (1.839) (0.992)
Source: Author calculations based on Riskesdas 2013.Notes: Standard errors in parenthesis. *** p<0.01, ** p<0.05, * p<0.1
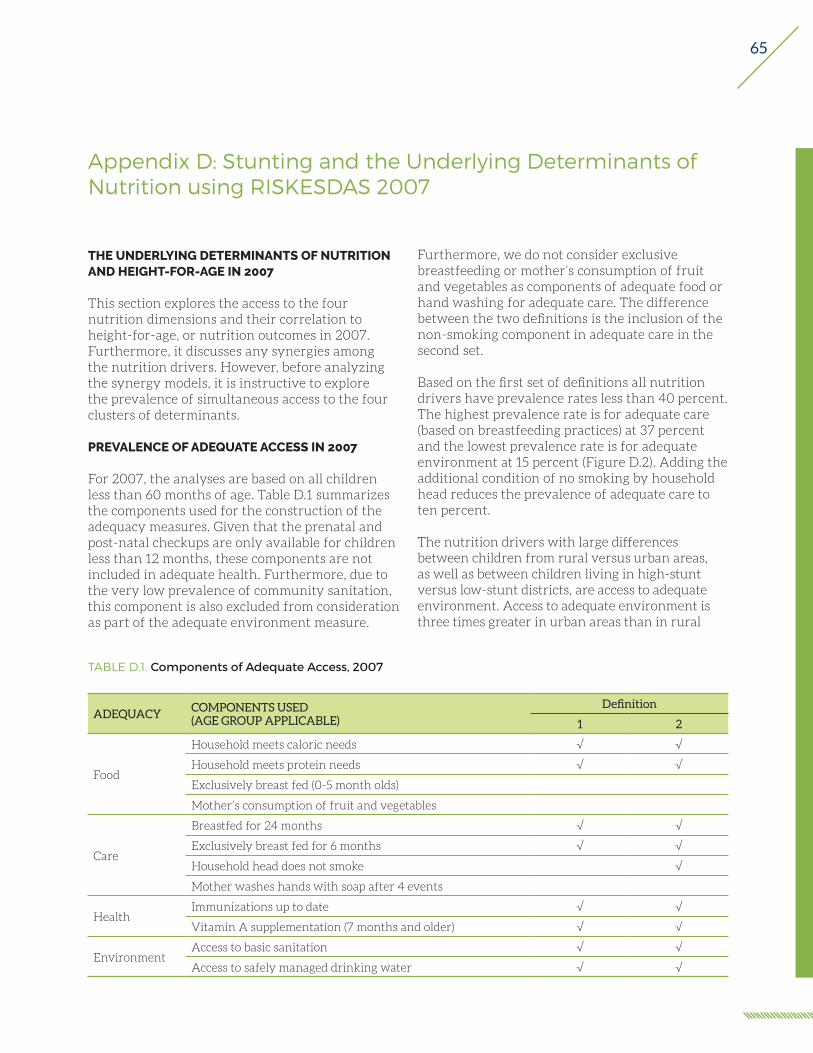
65
Appendix D: Stunting and the Underlying Determinants of Nutrition using RISKESDAS 2007
TABLE D.1. Components of Adequate Access, 2007
ADEQUACYCOMPONENTS USED(AGE GROUP APPLICABLE)
Definition
1 2
Food
Household meets caloric needs √ √
Household meets protein needs √ √
Exclusively breast fed (0-5 month olds)
Mother’s consumption of fruit and vegetables
Care
Breastfed for 24 months √ √
Exclusively breast fed for 6 months √ √
Household head does not smoke √
Mother washes hands with soap after 4 events
HealthImmunizations up to date √ √
Vitamin A supplementation (7 months and older) √ √
EnvironmentAccess to basic sanitation √ √
Access to safely managed drinking water √ √
THE UNDERLYING DETERMINANTS OF NUTRITION AND HEIGHT-FOR-AGE IN 2007
This section explores the access to the four nutrition dimensions and their correlation to height-for-age, or nutrition outcomes in 2007. Furthermore, it discusses any synergies among the nutrition drivers. However, before analyzing the synergy models, it is instructive to explore the prevalence of simultaneous access to the four clusters of determinants.
PREVALENCE OF ADEQUATE ACCESS IN 2007
For 2007, the analyses are based on all children less than 60 months of age. Table D.1 summarizes the components used for the construction of the adequacy measures. Given that the prenatal and post-natal checkups are only available for children less than 12 months, these components are not included in adequate health. Furthermore, due to the very low prevalence of community sanitation, this component is also excluded from consideration as part of the adequate environment measure.
Furthermore, we do not consider exclusive breastfeeding or mother’s consumption of fruit and vegetables as components of adequate food or hand washing for adequate care. The difference between the two definitions is the inclusion of the non-smoking component in adequate care in the second set.
Based on the first set of definitions all nutrition drivers have prevalence rates less than 40 percent. The highest prevalence rate is for adequate care (based on breastfeeding practices) at 37 percent and the lowest prevalence rate is for adequate environment at 15 percent (Figure D.2). Adding the additional condition of no smoking by household head reduces the prevalence of adequate care to ten percent.
The nutrition drivers with large differences between children from rural versus urban areas, as well as between children living in high-stunt versus low-stunt districts, are access to adequate environment. Access to adequate environment is three times greater in urban areas than in rural

66
Operationalizing a Multi-Sectoral Approach for the Reduction of Stunting
areas and two times greater in low-stunt districts than high-stunt districts (Figure D.2). Furthermore, in low-stunt districts children are almost twice as likely to have access to adequate health as children in high-stunt districts.
Except for adequate care, as the wealth quintile increases so does the percentage of children who are adequate in the underlying drivers of nutrition. Comparing those children in the lowest wealth quintile with those in the highest wealth quintile, there were six, ten, and sixteen percentage point differences in access to adequate health, food and environment, respectively (Figure D.2). For access to adequate care, those in the lowest wealth quintile
are three percentage points more likely to have access than those in the top wealth quintile. That is, with the exception of access to adequate care, wealth quintiles predict access to the underlying determinants of nutrition.
The younger cohort of children is more likely to have access to adequate health than the older cohort, but less likely to have access to adequate care. Although younger children have had less time to get their vaccinations, they are more likely to have their immunization up to date then older children. This result may signal improved outreach to get children vaccinated. The fact that the older cohort tends to have better access to adequate care may reflect
FIGURE D.2. Access to nutrition drivers, 2007
Source: Author estimates based on 2007 RISKESDAS. Food Care Environment Health
35 37
1522
Perc
enta
ge o
f chi
ldre
n w
ho m
eet c
rite
ria
National, children less than 60 monthsAdequacy definitions 1: Adequacy status in 2007
3539
6
20
35 3428 25
Perc
enta
ge o
f chi
ldre
n w
ho m
eet c
rite
ria
Rural Urban
By Urban/Rural, children less than 60 monthsAdequacy definitions 1: Adequacy status in 2007
35 36
915
36 37
2227
Perc
enta
ge o
f chi
ldre
n w
ho m
eet c
rite
ria
High stunt rate Low stunt rate
By district stunting, children less than 60 monthsAdequacy definitions 1: Adequacy status in 2007
3138
918
3438
1220
35 37
1522
38 36
20 22
4135
25 24
Perc
enta
ge o
f chi
ldre
n w
ho m
eet c
rite
ria
1 2 3 4 5
By wealth quintile, children less than 60 monthsAdequacy definitions 1: Adequacy status in 2007
3528
15
3035
41
14 16
Perc
enta
ge o
f chi
ldre
n w
ho m
eet c
rite
ria
0-23 months 24-59 months
By Age, children less than 60 monthsAdequacy definitions 1: Adequacy status in 2007
Notes: Districts with high (low) stunting rates are the districts with the top (bottom) 25% stunting rates at the district level. Wealth quintiles calculated by the NIHRD using polychoric prinipal components analysis (pp. 61-62 of 2013 report).
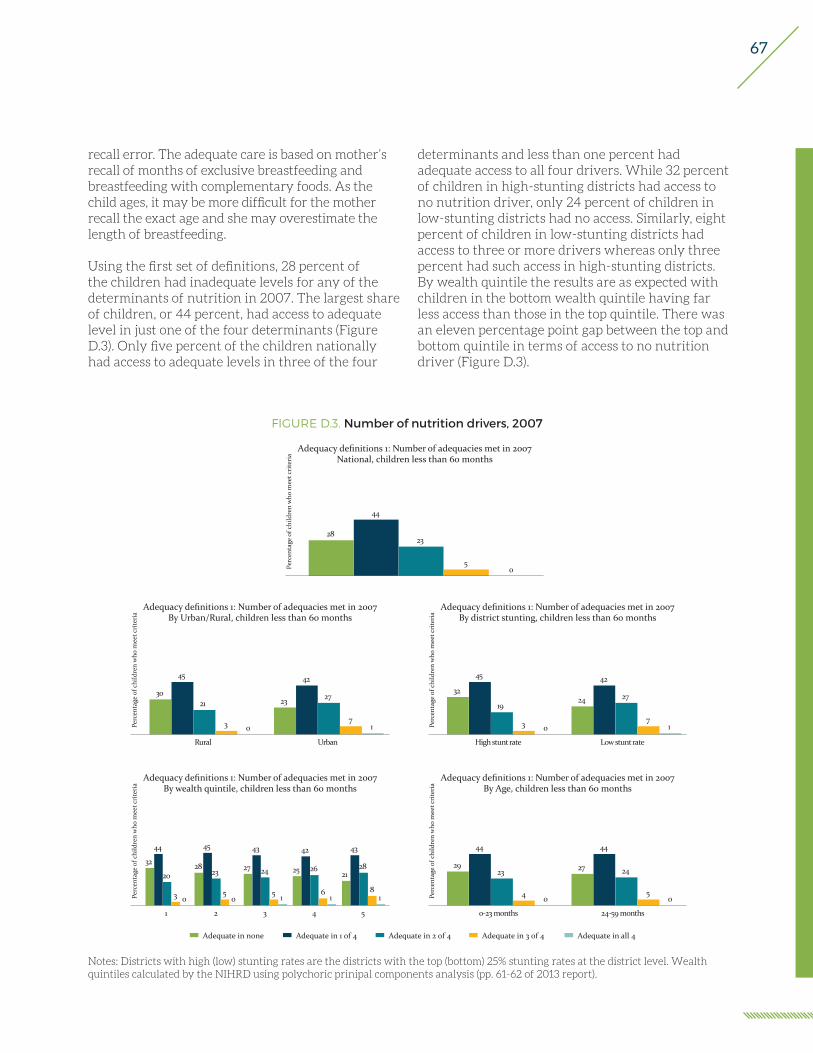
67
FIGURE D.3. Number of nutrition drivers, 2007
Adequate in none Adequate in 1 of 4 Adequate in 2 of 4 Adequate in 3 of 4 Adequate in all 4
28
44
23
50Pe
rcen
tage
of c
hild
ren
who
mee
t cri
teri
a National, children less than 60 monthsAdequacy definitions 1: Number of adequacies met in 2007
30
45
21
3 0
23
42
27
71Pe
rcen
tage
of c
hild
ren
who
mee
t cri
teri
a
Rural Urban
By Urban/Rural, children less than 60 monthsAdequacy definitions 1: Number of adequacies met in 2007
32
45
19
3 0
24
42
27
71Pe
rcen
tage
of c
hild
ren
who
mee
t cri
teri
a
High stunt rate Low stunt rate
By district stunting, children less than 60 monthsAdequacy definitions 1: Number of adequacies met in 2007
32
44
20
3 0
28
45
23
50
27
43
24
5 1
25
42
26
61
21
43
28
81Pe
rcen
tage
of c
hild
ren
who
mee
t cri
teri
a
1 2 3 4 5
By wealth quintile, children less than 60 monthsAdequacy definitions 1: Number of adequacies met in 2007
29
44
23
4 0
27
44
24
50Pe
rcen
tage
of c
hild
ren
who
mee
t cri
teri
a
0-23 months 24-59 months
By Age, children less than 60 monthsAdequacy definitions 1: Number of adequacies met in 2007
Notes: Districts with high (low) stunting rates are the districts with the top (bottom) 25% stunting rates at the district level. Wealth quintiles calculated by the NIHRD using polychoric prinipal components analysis (pp. 61-62 of 2013 report).
recall error. The adequate care is based on mother’s recall of months of exclusive breastfeeding and breastfeeding with complementary foods. As the child ages, it may be more difficult for the mother recall the exact age and she may overestimate the length of breastfeeding.
Using the first set of definitions, 28 percent of the children had inadequate levels for any of the determinants of nutrition in 2007. The largest share of children, or 44 percent, had access to adequate level in just one of the four determinants (Figure D.3). Only five percent of the children nationally had access to adequate levels in three of the four
determinants and less than one percent had adequate access to all four drivers. While 32 percent of children in high-stunting districts had access to no nutrition driver, only 24 percent of children in low-stunting districts had no access. Similarly, eight percent of children in low-stunting districts had access to three or more drivers whereas only three percent had such access in high-stunting districts. By wealth quintile the results are as expected with children in the bottom wealth quintile having far less access than those in the top quintile. There was an eleven percentage point gap between the top and bottom quintile in terms of access to no nutrition driver (Figure D.3).

68
Operationalizing a Multi-Sectoral Approach for the Reduction of Stunting
MULTIVARIATE ANALYSIS OF NUTRITION DRIVERS IN 2007
A more detailed analysis of the distribution of children into the different categories with access to adequate level reveals that some of the categories have very few children (Table D.2). Without the smoking condition in adequate care (Definition 1) three (out of sixteen) categories have less than two percent of children. With the inclusion of household head’s smoking behavior in the adequate care definition the number of categories with less the two percent of the children rises to seven. It is important to keep in mind this uneven distribution of children in the various categories when interpreting the correlations between adequacy categories and children’s nutritional outcomes. We present results at the national level using both sets of definitions, but present results using the second set of definitions for all subpopulation analyses given the importance of smoking in Indonesia. In terms of the subpopulations, the low-stunt and rural populations appear to be similar in terms of the percentage of children with access to the sixteen adequacy categories. About 44 percent of children from high-stunt districts, from poorer households, or bottom 40 percent of the wealth distribution, and rural children do not have access
TABLE D.2. Distribution of children for Model A, 2007
DEFN 1 DEFN 2 DEFINITION 2
NationalLow-stunt
High-stunt
B40 T60 Rural Urban
NONE 28% 39% 44% 33% 43% 35% 44% 32%
Food 16% 22% 26% 19% 22% 22% 25% 17%
Care 16% 4% 5% 3% 4% 4% 5% 3%
Environment 5% 7% 3% 10% 5% 8% 3% 12%
Health 7% 10% 8% 11% 10% 9% 10% 10%
Food and Care 9% 2% 2% 2% 2% 2% 3% 2%
Food and Environment 3% 4% 3% 6% 3% 5% 2% 8%
Food and Health 4% 5% 4% 6% 5% 6% 5% 5%
Care and Environment 2% 1% 0% 1% 1% 1% 0% 1%
Care and Health 3% 1% 1% 1% 1% 1% 1% 1%
Environment and Health 2% 2% 1% 4% 1% 3% 1% 4%
Food, Care and Environment 2% 1% 0% 1% 0% 1% 0% 1%
Food, Care and Health 2% 1% 0% 1% 0% 1% 1% 0%
Care, Environment and Health 1% 0% 0% 0% 0% 0% 0% 1%
Food, Environment and Health 1% 1% 1% 2% 1% 2% 1% 2%
In all 4 0% 0% 0% 0% 0% 0% 0% 0%
to any nutrition driver. About ten percentages points fewer children have no access to even one nutrition driver if they are from a low-stunt district, from a non-poor household (top 60 percent of the wealth distribution) or from an urban area.
In describing the results we first present the total differences in the average height-for-age Z-scores for the children in the fifteen different adequacy groups in comparison to those children who are not adequate in any nutrition driver. That is, we present the results from Model A, where the categorization of children is exclusive, such that they are identified in only group. For example, a child adequate in food and care would only be identified in the “adequate in food and care” category.
At the national level having access to adequate food, adequate care, or adequate environment was associated with taller children. The correlation between the nutrition drivers and the nutritional outcome is stable across the two definitions of adequate care considered. The strongest correlation between a nutrition driver and height is with access to adequate environment. Children with access to adequate environment were on average 0.35 standard deviations taller than the 39 percent of children who did not have access to any nutrition
69
driver. Those children who had access to adequate food only or adequate care only were about 0.11 standard deviations taller than children without access to any driver. Appendix B presents the results when instead of HAZ, an indicator for stunting is used as the dependent variable. The results underline the strong positive correlation between access to adequate environment and better nutrition outcomes.
In rural areas the correlation between malnutrition and adequate environment was greater than in urban areas and the correlation between adequate food and malnutrition was present only in the urban areas. Analyzing the sample separately for rural and urban children suggests that although on average child without access to any nutrition driver in rural areas was shorter than the average child in urban areas, with HAZ scores 1.53 and 1.37, respectively, an average child in rural area with access to adequate environment was slightly taller than an average child in urban area, with HAZ scores of 1.03 and 1.16, respectively. In fact in urban areas, access to adequate food as associated with a similar positive difference in HAZ than access to adequate environment. In rural areas access to adequate food alone was not associated with taller children. That is, even if on average each adult equivalent household member is consuming at least 1,760 kcal and 44 grams of protein, the children were no taller than children in households where the threshold was not met.
Under the first set of definitions, children adequate in environment and at least one other driver were taller than children without access to any driver. An average child was at least 0.26 standard deviations taller than a child without access to any nutrition driver if they were adequate in environment and one or two other drivers. A child not adequate in environment but in a combination of food, health and care was not statistically significantly taller than those without access to any dimension. The only exception was access to only food and care simultaneously where the average child was 0.17 standard deviations taller than a child without access to any dimension. This difference was slightly greater if the child was adequate in food only or care only. Changing the definition of adequate care to include the smoking behavior of the household’s head alters which groups of children are statistically
significantly different from those without access to any nutrition driver. The categories with two or three nutrition drivers that include both care and environment no longer are statistically significantly different. That is, once the household head’s smoking habits are included there are no statistically significant differences in height of those adequate in both care and environment, or in food, care and environment or in care, environment and health and those not adequate in any nutrition driver. However, those who had access to all four nutrition drivers were on average 0.56 standard deviations taller than those without any access. It is important to note that for most of the coefficient estimates the statistical significance of the correlations needs to be taken with caution, given the small percentage of children in any of these categories.
For children in high-stunt districts, only access to adequate environment alone was associated with better nutritional outcomes. The average child without access to any nutrition driver in a high-stunt district was 1.06 standard deviations shorter than the average child without access from a low-stunt district (Table D.4). The only nutrition dimension associated with better nutrition outcomes in high-stunt districts was adequate environment which is associated with a 0.44 standard deviation increase in the mean height-for-age. It is not clear which are the associated drivers with having access to both care and environment (only) that make the group on average 1.23 standard deviations shorter than those without access to any nutrition driver. Although the majority of the point estimates for groups with access to two or more drivers are positive, they are not statistically significant. Again this may be due to the limited number of children in each of these categories.
As above, for children living in a household in the bottom 40 percent of the wealth distribution, access to adequate environment was associated with better nutrition outcomes. The difference in the height of child without access to any driver in the bottom 40 percent of the wealth distribution and the top 60 percent of the wealth distribution was 0.21 standard deviations. Children from poorer households with access to adequate environment were 0.34 standard deviations taller than children from poorer household without such access. This difference is quite similar for children from the wealthier

70
Operationalizing a Multi-Sectoral Approach for the Reduction of Stunting
TABLE D.3. Estimates of the marginal increase in mean HAZ score with access to each one of the four underlying determinants of nutrition separately and in combination, 2007. Model A
NATIONAL URBAN RURALDefn 1 Defn 2 Definitions 2
Adequate Food0.110** 0.104** 0.213*** 0.054(0.048) (0.041) (0.071) (0.050)
Adequate Care0.110** 0.130* 0.202 0.093(0.043) (0.079) (0.127) (0.099)
Adequate Environment0.344*** 0.356*** 0.212*** 0.506***(0.070) (0.062) (0.077) (0.117)
Adequate Health-0.011 -0.027 0.045 -0.090(0.055) (0.049) (0.079) (0.061)
Adequate in Food and Care0.166*** 0.280** 0.227 0.303**(0.056) (0.115) (0.195) (0.143)
Adequate in Food and Environment0.341*** 0.370*** 0.348*** 0.187(0.092) (0.081) (0.102) (0.130)
Adequate in Food and Health0.077 -0.017 0.003 -0.049(0.069) (0.061) (0.092) (0.081)
Adequate in Care and Environment0.260*** 0.107 -0.031 0.210(0.099) (0.174) (0.212) (0.306)
Adequate in Care and Health-0.060 -0.079 0.032 -0.150(0.073) (0.137) (0.262) (0.153)
Adequate in Environment and Health0.398*** 0.399*** 0.335** 0.334**(0.110) (0.104) (0.131) (0.165)
Adequate in: Food, Care and Environment0.431*** 0.214 -0.021 0.555**(0.111) (0.166) (0.205) (0.272)
Adequate in: Food, Care and Health-0.092 0.142 -0.206 0.321(0.087) (0.167) (0.249) (0.216)
Adequate in: Care, Environment and Health0.421** 0.388 0.312 0.344(0.164) (0.253) (0.293) (0.509)
Adequate in: Food, Environment and Health0.255** 0.212* 0.179 0.057(0.124) (0.117) (0.138) (0.232)
Adequate in: All Four0.216 0.559* 0.357 0.876(0.191) (0.286) (0.320) (0.607)
Constant-1.506*** -1.482*** -1.373*** -1.534***(0.028) (0.024) (0.039) (0.031)
Observations 34,006 31,698 12,346 19,352R-squared 0.003 0.003 0.004 0.003F-Stat 4.954 4.978 2.000 2.826Prob>F 0 0 0.012 0
Source: Author calculations based on Riskesdas 2007.

71
TABLE D.4. Estimates of the marginal increase in mean HAZ score with access to each one of the four underlying determinants of nutrition separately and in combination, 2007. Model A
DISTRICT STUNTING WEALTHLow High B40 T60
Adequate Food0.157* 0.027 0.091 0.096*(0.082) (0.079) (0.056) (0.058)
Adequate Care0.136 -0.143 0.173 0.068
(0.197) (0.139) (0.107) (0.116)
Adequate Environment-0.068 0.442*** 0.344*** 0.303***-0.113 (0.147) (0.089) (0.085)
Adequate Health-0.193** -0.113 -0.010 -0.060(0.095) (0.109) (0.065) (0.071)
Adequate in Food and Care0.346* -0.054 0.322** 0.208(0.196) (0.224) (0.151) (0.172)
Adequate in Food and Environment0.217 0.196 0.228* 0.380***(0.139) (0.168) (0.126) (0.104)
Adequate in Food and Health-0.187 0.037 0.012 -0.085(0.118) (0.148) (0.088) (0.082)
Adequate in Care and Environment0.113 -1.236** -0.073 0.136
(0.345) (0.489) (0.319) (0.201)
Adequate in Care and Health0.214 0.272 -0.198 0.031
(0.347) (0.270) (0.166) (0.213)
Adequate in Environment and Health0.224 0.379 0.263 0.407***
(0.191) (0.321) (0.182) (0.126)
Adequate in: Food, Care and Environment-0.250 0.505 0.633** -0.107(0.256) (0.526) (0.314) (0.203)
Adequate in: Food, Care and Health-0.321 0.164 -0.084 0.273(0.310) (0.364) (0.249) (0.220)
Adequate in: Care, Environment and Health-0.213 0.489 0.261 0.401(0.482) (0.329) (0.416) (0.316)
Adequate in: Food, Environment and Health-0.178 0.119 0.173 0.140(0.179) (0.388) (0.211) (0.141)
Adequate in: All Four0.326 0.715 0.811 0.357
(0.387) (1.005) (0.533) (0.332)
Constant-0.873*** -1.935*** -1.573*** -1.360***(0.049) (0.048) (0.032) (0.035)
Observations 7,526 7,553 16,424 15,274R-squared 0.005 0.004 0.003 0.004F-Stat 1.819 1.713 2.175 2.874Prob>F 0.027 0.042 0.005 0
Source: Author calculations based on Riskesdas 2007.

72
Operationalizing a Multi-Sectoral Approach for the Reduction of Stunting
TABLE D.5. Synergies associated with simultaneous access to two or more of the underlying determinants of nutrition, 2007. Model B
NATIONAL URBAN RURAL
Defn 1 Defn 2 Definitions 2
Adequate in Food and Care -0.053 0.046 -0.188 0.156
(0.076) (0.140) (0.240) (0.172)
Adequate in Food and Environment -0.113 -0.090 -0.077 -0.373**
(0.115) (0.101) (0.133) (0.171)
Adequate in Food and Health -0.022 -0.094 -0.255* -0.013
(0.092) (0.080) (0.130) (0.103)
Adequate in Care and Environment -0.194 -0.379* -0.445* -0.389
(0.119) (0.195) (0.252) (0.327)
Adequate in Care and Health -0.159* -0.181 -0.215 -0.152
(0.094) (0.163) (0.300) (0.188)
Adequate in Environment and Health 0.065 0.070 0.078 -0.082
(0.134) (0.125) (0.160) (0.206)
Adequate in: Food, Care and Environment 0.228 0.046 0.062 0.508
(0.191) (0.290) (0.397) (0.455)
Adequate in: Food, Care and Health -0.066 0.165 -0.008 0.274
(0.152) (0.264) (0.451) (0.322)
Adequate in: Care, Environment and Health 0.266 0.419 0.435 0.458
(0.230) (0.344) (0.468) (0.601)
Adequate in: Food, Environment and Health -0.117 -0.107 -0.037 0.056
(0.211) (0.197) (0.252) (0.344)
Adequate in: All Four-0.171 0.101 0.336 -0.130
(0.364) (0.535) (0.704) (0.969)
Source: Author calculations based on Riskesdas 2007
households where the difference was 0.30 standard deviations. However, unlike for the subsample of children from high-stunt districts, children from households in the bottom 40 percent of the wealth distribution are taller if they have simultaneous access to adequate food and care (0.32 standard deviations), or food and environment (0.23 standard deviations), or food, care and environment (0.63 standard deviations). Access to health care alone or with other nutrition drivers was not associated with taller children.
The estimates provide no evidence of positive synergies amongst the nutrition drivers, neither for the sample as a whole nor for urban and rural
children separately. Although access to some combinations of two or more nutrition drivers are associated with taller children there are no significant positive synergies among the nutrition drivers. That is, in evaluating Model B we do not find any positive synergies between nutrition drivers. These results are presented in Table D.5.
That is, being adequate in more than one nutrition driver is not associated with taller children beyond any additive differences from being adequate in more than one driver. In fact there are some negative correlations in the synergy variables, indicating that being adequate in both care and health (under the first set of adequacy definitions)

73
or in care and environment (under adequacy definitions 2) children are not as tall as expected if contributions from each driver were additive. In fact one can think of these drivers as being complementary to some degree.
Although for the considered sub-groups of children, some adequacies are positively correlated with height-for-age, there are no systematic synergies among the four drivers of nutrition. Homogenizing the groups by district characteristics yields some
positive synergies. For children in high-stunt districts access to both care and health was associated with positive synergies but the synergy just countered the negative correlations between access to adequate care only and access to adequate health only such that a child with access to both was as tall as a child without access to any nutrition driver. Similarly the synergies on food care and environment, and care, environment and health counter some of the negative coefficients and lower level synergies.
TABLE D.6. Synergies associated with simultaneous access to two or more of the underlying determinants of nutrition, 2007. Definition 2
STUNTING WEALTH
Low High B40 T60
Adequate in Food and Care 0.053 0.062 0.058 0.044(0.283) (0.274) (0.191) (0.202)
Adequate in Food and Environment 0.128 -0.272 -0.207 -0.020
(0.178) (0.217) (0.156) (0.132)
Adequate in Food and Health -0.152 0.123 -0.069 -0.121(0.160) (0.187) (0.114) (0.114)
Adequate in Care and Environment 0.045 -1.535*** -0.589* -0.235
(0.406) (0.521) (0.346) (0.240)
Adequate in Care and Health 0.271 0.529* -0.361* 0.022
(0.412) (0.316) (0.204) (0.250)
Adequate in Environment and Health 0.485** 0.051 -0.071 0.163(0.231) (0.359) (0.204) (0.158)
Adequate in: Food, Care and Environment -0.701 1.924** 0.764 -0.363(0.522) (0.774) (0.510) (0.372)
Adequate in: Food, Care and Health -0.595 -0.321 0.034 0.223(0.573) (0.538) (0.362) (0.376)
Adequate in: Care, Environment and Health -0.890 1.259* 0.776 0.139(0.705) (0.741) (0.581) (0.471)
Adequate in: Food, Environment and Health -0.537 -0.138 0.095 -0.222(0.336) (0.566) (0.320) (0.249)
Adequate in: All Four2.185** -1.179 -0.216 0.318(0.941) (1.475) (0.936) (0.695)
Source: Author calculations based on Riskesdas 2007.

74
Operationalizing a Multi-Sectoral Approach for the Reduction of Stunting
TABLE D.7. Estimates of the marginal decline in the stunting rate with access to each one of the four underlying determinants of nutrition separately and in combination, 2007. Model A
NATIONAL URBAN RURALDefn 1 Defn 2 Definitions 2
Adequate Food-0.026 -0.048 -0.145** -0.007(0.042) (0.036) (0.068) (0.042)
Adequate Care-0.055 -0.070 -0.180 -0.018(0.040) (0.068) (0.127) (0.082)
Adequate Environment-0.426*** -0.457*** -0.246*** -0.625***
(0.066) (0.059) (0.077) (0.105)
Adequate Health0.004 -0.006 -0.016 0.028(0.052) (0.047) (0.079) (0.058)
Adequate in Food and Care-0.112** -0.140 -0.172 -0.114(0.050) (0.094) (0.171) (0.113)
Adequate in Food and Environment-0.345*** -0.337*** -0.199** -0.307**(0.088) (0.075) (0.097) (0.123)
Adequate in Food and Health-0.124* -0.077 -0.098 -0.032(0.066) (0.060) (0.105) (0.074)
Adequate in Care and Environment-0.281*** -0.169 0.040 -0.304(0.091) (0.158) (0.201) (0.259)
Adequate in Care and Health-0.007 -0.032 0.156 -0.121(0.072) (0.132) (0.225) (0.163)
Adequate in Environment and Health-0.309*** -0.355*** -0.214* -0.336**
(0.108) (0.099) (0.125) (0.165)
Adequate in: Food, Care and Environment-0.463*** -0.364** -0.101 -0.644**
(0.106) (0.172) (0.210) (0.307)
Adequate in: Food, Care and Health-0.033 -0.285* -0.006 -0.423**(0.096) (0.172) (0.292) (0.213)
Adequate in: Care, Environment and Health-0.453*** -0.438* -0.187 -0.736
(0.155) (0.252) (0.294) (0.500)
Adequate in: Food, Environment and Health-0.489*** -0.427*** -0.339** -0.267
(0.134) (0.126) (0.155) (0.221)
Adequate in: All Four-0.321 -0.719** -0.512 -0.873(0.199) (0.316) (0.372) (0.604)
Constant-0.237*** -0.243*** -0.425*** -0.157***
(0.025) (0.022) (0.041) (0.027)Observations 33,953 31,649 12,329 19,320F-Stat 6.496 6.707 1.486 3.815Prob>F 0 0 0.101 0
Source: Author calculations based on Riskesdas 2007
MULTIVARIATE ANALYSIS OF NUTRITION DRIVERS IN 2007 – STUNTING AS DEPENDENT VARIABLE
When stunting is used as the dependent variable, instead of height-for-age Z-scores, the results are similar (Table D.7). There is a strong positive correlation between access to adequate environment and non-stunting. Again under the first set of definitions access to environment and
another nutrition driver is associated with better nutrition outcomes. With the inclusion of the non-smoking household head condition, access to both care and environment no longer is statistically significantly associated with stunting. However, with the second set of definitions, access to any three or all four are all associated with lower probability of stunting.

75
Appendix E: An Analysis of Synergies using SUSENAS 2007 and 2013
For the following components (Food, Care, Health, and Environment) of adequacy, the individual dummies are collapsed at district level. Then the threshold is set at median value of all districts. District adequacy dummy equals 1 if mean of that particular district is above the median.
DISTRICT ADEQUACY DUMMY DEFINITION
Adequate in: Food
Children who are:1. Under 6 months: are exclusively breastfed2. Between 6-23 months: are breastfed or formula-fed and having a Dietary
Diversity Score (DDS)* of 4 or greater (see below for DDS definition)3. Between 24-59 months: having a DDS of 3 and above
However, the downside of this measure is: this measure only uses total consumption data, instead of calories intake (because SUSENAS 2007 and 2013 do not provide such data).
*See below for definition of Dietary Diversity Score
Adequate in: Care
Children who are:1. Under 6 months: are exclusively breastfed2. Above 6 months up to 59 months: are continued breastfed up to 24 months
Adequate care excludes requirement for complementary feedings (solid/soft food) in this definition since the consumption of food data is HH consumption data and hence assuming all HH member gets the same amount of consumption. This will then overestimate the number of children who are adequate in food and in care (as food consumption is part of each definition).
In the end, all children will be assumed to have consumed solid food in the HH since there must have been some food eaten in the household by someone. Therefore, there will be no variation in the indicator.
Adequate in: Health
Children under 59 months who get complete vaccination* as required schedule and their births were assisted by health professionals.
*See below for complete vaccination schedule
Adequate in: Environment (GoI - Including Community Sanitation)
Children in a HH who have access to safe water and safe sanitation and 75% HH in the community have access to adequate safe sanitation. The definition of safe water and safe sanitation are based on GoI definition*.
*See below for definition of access to safe water and sanitation
Adequate in: Environment (JMP - Including Community Sanitation)
Children in a HH who have access to safe water and safe sanitation and 75% HH in the community have access to adequate safe sanitation. The definition of safe water and safe sanitation are based on JMP definition*.
*See below for definition of access to safe water and sanitation

76
Operationalizing a Multi-Sectoral Approach for the Reduction of Stunting
VARIABLE DEFINITION
Adequate in: Food and CareDistricts with both Food and Care adequacy mean are above median, irrespective of their mean value in Health and Environment adequacy.
Adequate in: Food and Environment
Districts with both Food and Environment adequacy mean are above median, irrespective of their mean value in Health and Environment adequacy.
Adequate in: Food and HealthDistricts with both Food and Health adequacy mean are above median, irrespective of their mean value in Care and Environment) adequacy.
Adequate in: Care and Environment
Districts with both Care and Environment adequacy mean are above median, irrespective of their mean value in Food and Health adequacy.
Adequate in: Care and HealthDistricts with both Care and Health adequacy mean are above median, irrespective of their mean value in Food and Environment adequacy.
Adequate in: Environment and Health
Districts with both Environment and Health adequacy mean are above median, irrespective of their mean value in Food and Care adequacy.
Adequate in: Food, Care and Environment
Districts with Food, Care and Environment adequacy mean are above median, irrespective of their mean value in Health adequacy.
Adequate in: Food, Environment and Health
Districts with Food, Environment and Health adequacy mean are above median, irrespective of their mean value in Care adequacy.
Adequate in: Food, Care and Health
Districts with Food, Care and Health adequacy mean are above median, irrespective of their mean value in Environment adequacy.
Adequate in: Care, Environment and Health
Districts with Care, Environment and Health adequacy mean are above median, irrespective of their mean value in Food adequacy.
Adequate in: Food onlyDistricts with only Food adequacy mean that is above median; while their Care, Health, and Environment adequacy mean should not be above median value.
Adequate in: Care onlyDistricts with only Care adequacy mean that is above median; while their Food, Health and Environment adequacy mean should not be above median value.
Adequate in: Environment onlyDistricts with only Environment adequacy mean that is above median; while their Care, Health and Food adequacy mean should not be above median value.
Adequate in: Health onlyDistricts with only Health adequacy mean that is above median; while their Care, Food and Environment adequacy mean should not be above median value.
Adequate in: Food and Care onlyDistricts with both Food and Care adequacy mean are above median; while their Health and Environment adequacy mean should not be above median value.
Adequate in: Food and Environment only
Districts with both Food and Environment adequacy mean are above median; while their Health and Care adequacy mean should not be above median value.
Adequate in: Food and Health only
Districts with both Food and Health adequacy mean are above median; while their Care and Environment adequacy mean should not be above median value.
Adequate in: Care and Environment only
Districts with both Care and Environment adequacy mean are above median; while their Food and Health adequacy mean should not be above median value.
Adequate in: Care and Health onlyDistricts with both Care and Health adequacy mean are above median; while their Food and Environment adequacy mean should not be above median value.
Adequate in: Environment and Health only
Districts with both Environment and Health adequacy mean are above median; while their Food and Care adequacy mean should not be above median value.
Adequate in: Food, Care and Environment only
Districts with Food, Care and Environment adequacy mean are above median; while their Health adequacy mean should not be above median value.
Adequate in: Food, Environment and Health only
Districts with Food, Environment and Health adequacy mean are above median; while their Care adequacy mean should not be above median value.
Adequate in: Food, Care and Health only
Districts with Food, Care and Health adequacy mean are above median; while their Environment adequacy mean should not be above median value.
Adequate in: Care, Environment and Health only
Districts with Care, Environment and Health adequacy mean are above median; while their Food adequacy mean should not be above median value.
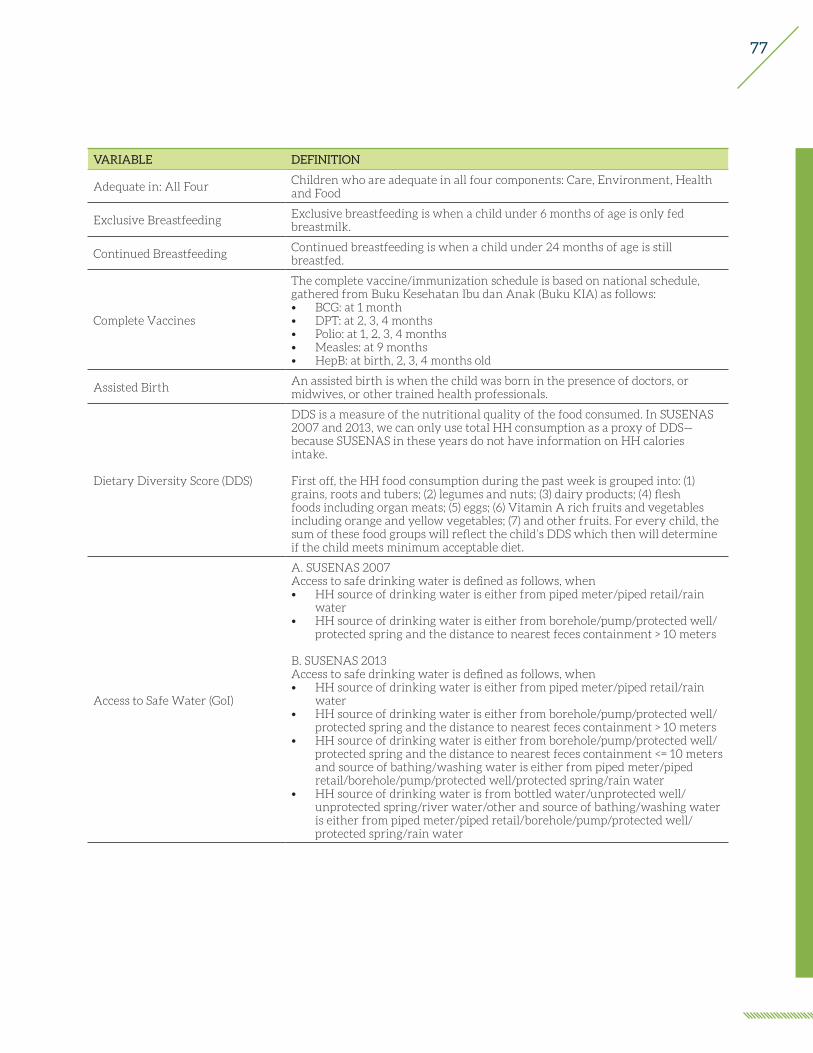
77
VARIABLE DEFINITION
Adequate in: All FourChildren who are adequate in all four components: Care, Environment, Health and Food
Exclusive BreastfeedingExclusive breastfeeding is when a child under 6 months of age is only fed breastmilk.
Continued BreastfeedingContinued breastfeeding is when a child under 24 months of age is still breastfed.
Complete Vaccines
The complete vaccine/immunization schedule is based on national schedule, gathered from Buku Kesehatan Ibu dan Anak (Buku KIA) as follows:• BCG: at 1 month• DPT: at 2, 3, 4 months• Polio: at 1, 2, 3, 4 months• Measles: at 9 months• HepB: at birth, 2, 3, 4 months old
Assisted BirthAn assisted birth is when the child was born in the presence of doctors, or midwives, or other trained health professionals.
Dietary Diversity Score (DDS)
DDS is a measure of the nutritional quality of the food consumed. In SUSENAS 2007 and 2013, we can only use total HH consumption as a proxy of DDS—because SUSENAS in these years do not have information on HH calories intake.
First off, the HH food consumption during the past week is grouped into: (1) grains, roots and tubers; (2) legumes and nuts; (3) dairy products; (4) flesh foods including organ meats; (5) eggs; (6) Vitamin A rich fruits and vegetables including orange and yellow vegetables; (7) and other fruits. For every child, the sum of these food groups will reflect the child’s DDS which then will determine if the child meets minimum acceptable diet.
Access to Safe Water (GoI)
A. SUSENAS 2007Access to safe drinking water is defined as follows, when• HH source of drinking water is either from piped meter/piped retail/rain
water• HH source of drinking water is either from borehole/pump/protected well/
protected spring and the distance to nearest feces containment > 10 meters
B. SUSENAS 2013Access to safe drinking water is defined as follows, when• HH source of drinking water is either from piped meter/piped retail/rain
water• HH source of drinking water is either from borehole/pump/protected well/
protected spring and the distance to nearest feces containment > 10 meters• HH source of drinking water is either from borehole/pump/protected well/
protected spring and the distance to nearest feces containment <= 10 meters and source of bathing/washing water is either from piped meter/piped retail/borehole/pump/protected well/protected spring/rain water
• HH source of drinking water is from bottled water/unprotected well/unprotected spring/river water/other and source of bathing/washing water is either from piped meter/piped retail/borehole/pump/protected well/protected spring/rain water
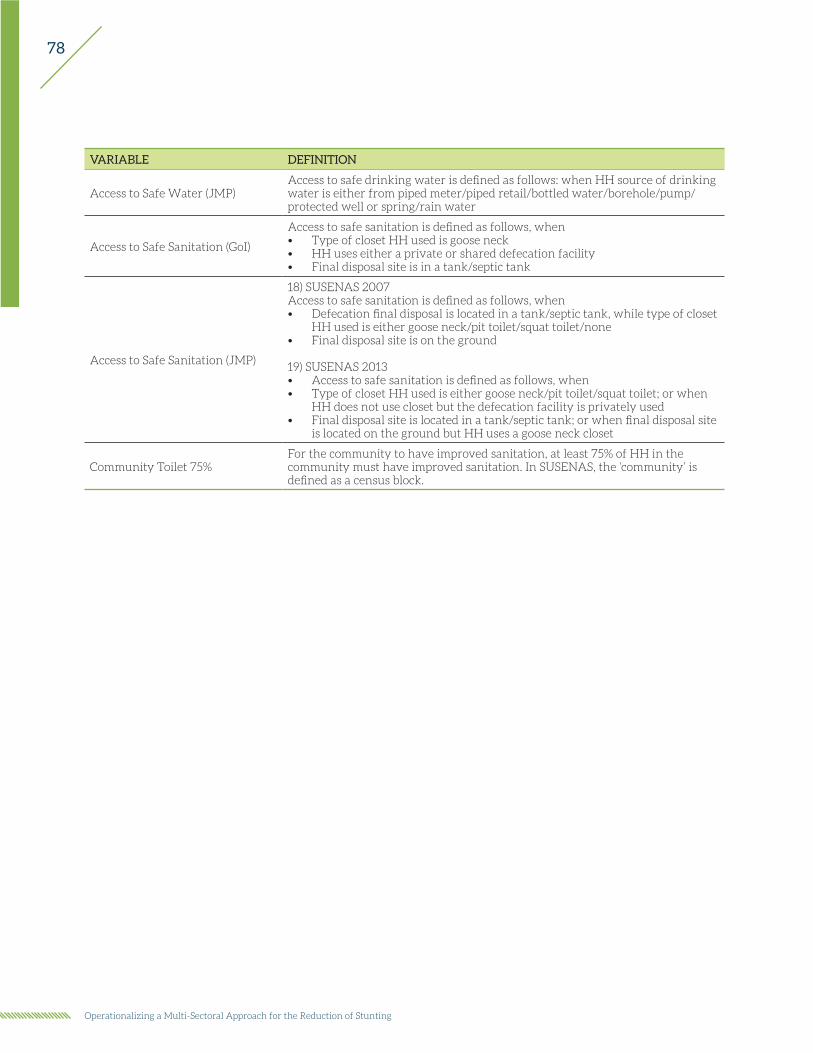
78
Operationalizing a Multi-Sectoral Approach for the Reduction of Stunting
VARIABLE DEFINITION
Access to Safe Water (JMP)Access to safe drinking water is defined as follows: when HH source of drinking water is either from piped meter/piped retail/bottled water/borehole/pump/protected well or spring/rain water
Access to Safe Sanitation (GoI)
Access to safe sanitation is defined as follows, when• Type of closet HH used is goose neck• HH uses either a private or shared defecation facility • Final disposal site is in a tank/septic tank
Access to Safe Sanitation (JMP)
18) SUSENAS 2007Access to safe sanitation is defined as follows, when• Defecation final disposal is located in a tank/septic tank, while type of closet
HH used is either goose neck/pit toilet/squat toilet/none• Final disposal site is on the ground
19) SUSENAS 2013• Access to safe sanitation is defined as follows, when• Type of closet HH used is either goose neck/pit toilet/squat toilet; or when
HH does not use closet but the defecation facility is privately used• Final disposal site is located in a tank/septic tank; or when final disposal site
is located on the ground but HH uses a goose neck closet
Community Toilet 75%For the community to have improved sanitation, at least 75% of HH in the community must have improved sanitation. In SUSENAS, the ‘community’ is defined as a census block.
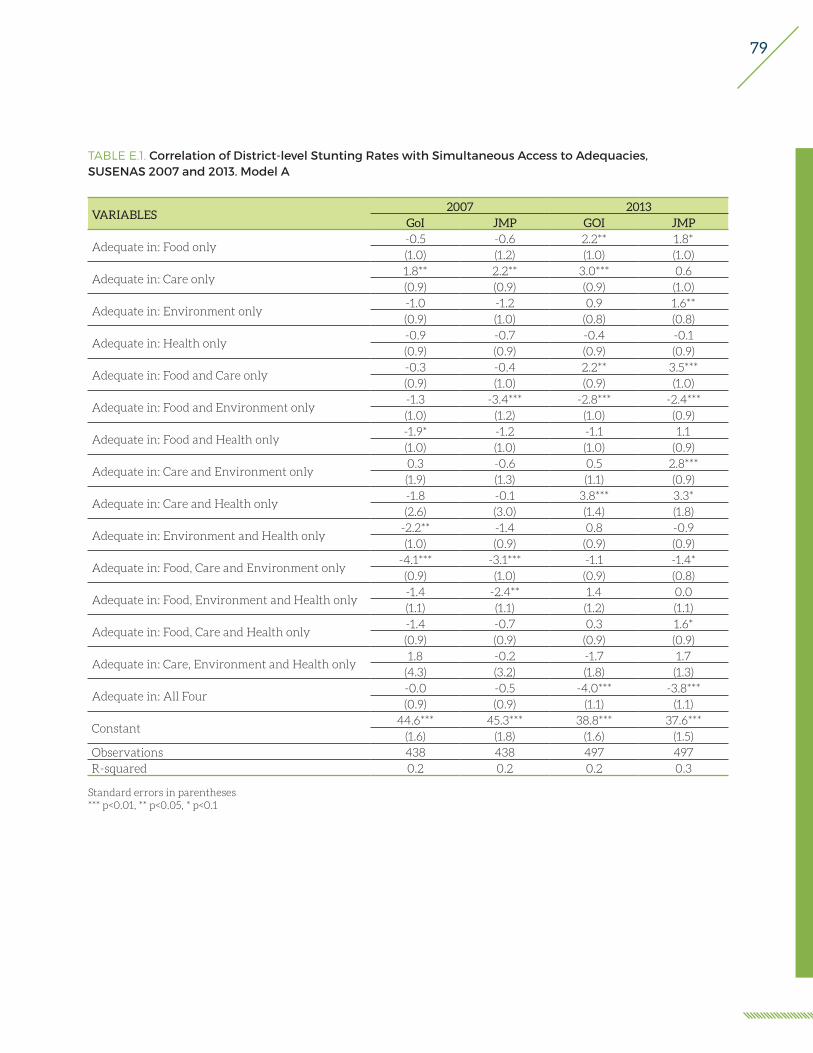
79
TABLE E.1. Correlation of District-level Stunting Rates with Simultaneous Access to Adequacies,SUSENAS 2007 and 2013. Model A
VARIABLES2007 2013
GoI JMP GOI JMP
Adequate in: Food only-0.5 -0.6 2.2** 1.8*(1.0) (1.2) (1.0) (1.0)
Adequate in: Care only1.8** 2.2** 3.0*** 0.6(0.9) (0.9) (0.9) (1.0)
Adequate in: Environment only-1.0 -1.2 0.9 1.6**(0.9) (1.0) (0.8) (0.8)
Adequate in: Health only-0.9 -0.7 -0.4 -0.1(0.9) (0.9) (0.9) (0.9)
Adequate in: Food and Care only-0.3 -0.4 2.2** 3.5***(0.9) (1.0) (0.9) (1.0)
Adequate in: Food and Environment only-1.3 -3.4*** -2.8*** -2.4***(1.0) (1.2) (1.0) (0.9)
Adequate in: Food and Health only-1.9* -1.2 -1.1 1.1(1.0) (1.0) (1.0) (0.9)
Adequate in: Care and Environment only0.3 -0.6 0.5 2.8***(1.9) (1.3) (1.1) (0.9)
Adequate in: Care and Health only-1.8 -0.1 3.8*** 3.3*(2.6) (3.0) (1.4) (1.8)
Adequate in: Environment and Health only-2.2** -1.4 0.8 -0.9(1.0) (0.9) (0.9) (0.9)
Adequate in: Food, Care and Environment only-4.1*** -3.1*** -1.1 -1.4*(0.9) (1.0) (0.9) (0.8)
Adequate in: Food, Environment and Health only-1.4 -2.4** 1.4 0.0(1.1) (1.1) (1.2) (1.1)
Adequate in: Food, Care and Health only-1.4 -0.7 0.3 1.6*(0.9) (0.9) (0.9) (0.9)
Adequate in: Care, Environment and Health only1.8 -0.2 -1.7 1.7
(4.3) (3.2) (1.8) (1.3)
Adequate in: All Four-0.0 -0.5 -4.0*** -3.8***(0.9) (0.9) (1.1) (1.1)
Constant44.6*** 45.3*** 38.8*** 37.6***
(1.6) (1.8) (1.6) (1.5)Observations 438 438 497 497R-squared 0.2 0.2 0.2 0.3
Standard errors in parentheses*** p<0.01, ** p<0.05, * p<0.1
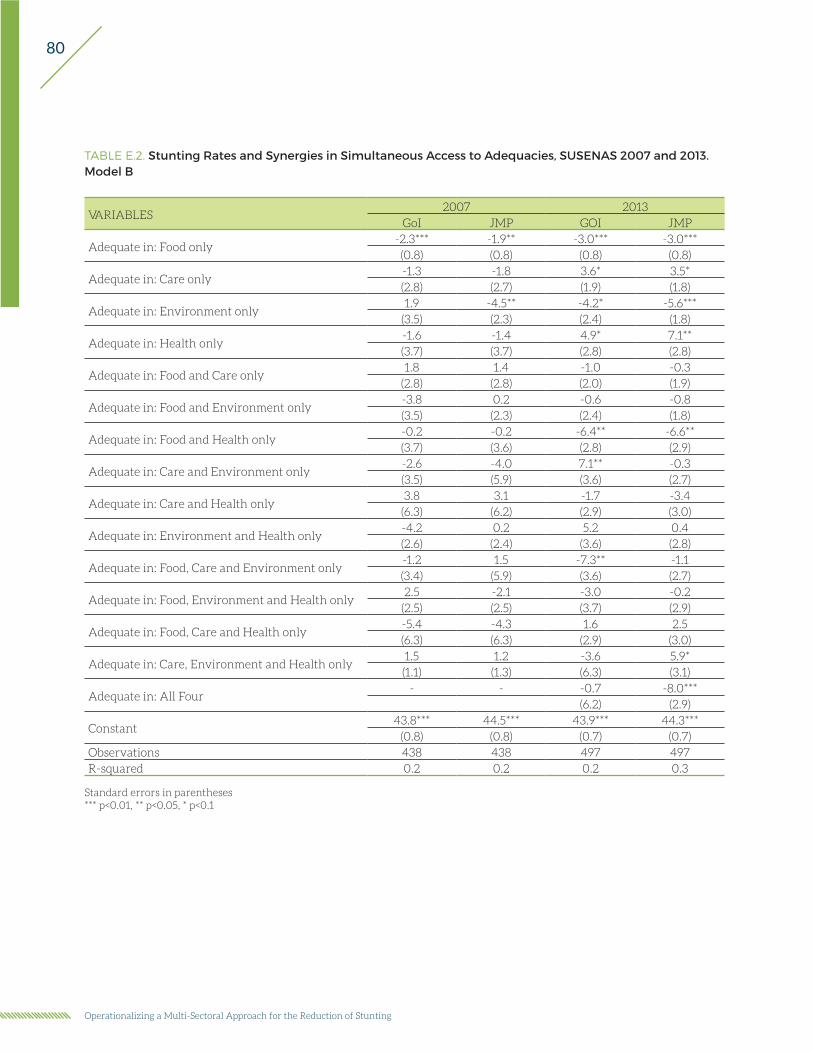
80
Operationalizing a Multi-Sectoral Approach for the Reduction of Stunting
TABLE E.2. Stunting Rates and Synergies in Simultaneous Access to Adequacies, SUSENAS 2007 and 2013. Model B
VARIABLES2007 2013
GoI JMP GOI JMP
Adequate in: Food only-2.3*** -1.9** -3.0*** -3.0***(0.8) (0.8) (0.8) (0.8)
Adequate in: Care only-1.3 -1.8 3.6* 3.5*(2.8) (2.7) (1.9) (1.8)
Adequate in: Environment only1.9 -4.5** -4.2* -5.6***
(3.5) (2.3) (2.4) (1.8)
Adequate in: Health only-1.6 -1.4 4.9* 7.1**(3.7) (3.7) (2.8) (2.8)
Adequate in: Food and Care only1.8 1.4 -1.0 -0.3
(2.8) (2.8) (2.0) (1.9)
Adequate in: Food and Environment only-3.8 0.2 -0.6 -0.8(3.5) (2.3) (2.4) (1.8)
Adequate in: Food and Health only-0.2 -0.2 -6.4** -6.6**(3.7) (3.6) (2.8) (2.9)
Adequate in: Care and Environment only-2.6 -4.0 7.1** -0.3(3.5) (5.9) (3.6) (2.7)
Adequate in: Care and Health only3.8 3.1 -1.7 -3.4
(6.3) (6.2) (2.9) (3.0)
Adequate in: Environment and Health only-4.2 0.2 5.2 0.4(2.6) (2.4) (3.6) (2.8)
Adequate in: Food, Care and Environment only-1.2 1.5 -7.3** -1.1(3.4) (5.9) (3.6) (2.7)
Adequate in: Food, Environment and Health only2.5 -2.1 -3.0 -0.2
(2.5) (2.5) (3.7) (2.9)
Adequate in: Food, Care and Health only-5.4 -4.3 1.6 2.5(6.3) (6.3) (2.9) (3.0)
Adequate in: Care, Environment and Health only1.5 1.2 -3.6 5.9*(1.1) (1.3) (6.3) (3.1)
Adequate in: All Four- - -0.7 -8.0***
(6.2) (2.9)
Constant43.8*** 44.5*** 43.9*** 44.3***
(0.8) (0.8) (0.7) (0.7)Observations 438 438 497 497R-squared 0.2 0.2 0.2 0.3
Standard errors in parentheses*** p<0.01, ** p<0.05, * p<0.1

81