Operational Value of Anthropometric Surveillance in Famine Early Warning and Relief: Wollo Region,...
8
Operational Value of Anthropometric Surveillance in Famine Early Warning and Relief: Wollo Region, Ethiopia, 1987 - 88 MARION KELLY In this article I examine the operational implications of the findings reported in ‘Entitlements, Coping Mechanisms and Zndicators of Access to Food: Wollo Region, Ethiopia, 1987-88‘ (Kelly, 1992). The usefulness of anthropometric and other indicators for early warning and relief planning in Wollo is assessed by comparing the findings of Save the Children Fund’s nutritional surveillance programme with those of the Early Warning and Planning Service of the Ethiopian government’s Relief and Rehabilitation Commission. Case studies are used to illustrate the value of anthropometric and other indicators for targeting relief food and monitoring its effects. The costs of monitoring various indicators are then considered, and the cost of the Save the Children Fund programme is compared with that of other programmes. It is argued that in Wollo, anthropometric surveillance is a cost-effective means of improving early warning, planning, targeting and monitoring. During 1987 and 1988, the Nutrition Field WorkerlNutritional SurveillanceProgramme (NFWlNSP)of the Save the Children Fund (SCF) carried out longitudinal and cross- sectional anthropometric surveys in nine of the twelve uwrujus (districts) of Wollo Region, Ethiopia. In addition, NFWlNSP personnel monitored grain and livestock market indicators, and used questionnaires to collect information on crop yields, relief distribution, population movements and mortality (Kelly, 1992). The Early Warning and Planning Service of the Ethiopian government’s Relief and Rehabilitation Commission and the NFWlNSP were the Region‘s only sources of systematically collected data on food security. In Wollo, failure of the main rains in mid-1987 was followed by a period of acute food insecurity in 1988. A recent analysis of the anthropometric and socio-economic data collected by the NFWlNSP during 1987-88 led to two conclusions: first, the mean Weight for Length (WFL) of children under five was a valid indicator of access to food, which responded earlier than live- stock market trends, migration or mortality; and second, the movements of different indicators were not strongly correlated with one another (Kelly, 1992). In this paper I consider the practical implications of these findings, including the question of whether the operational value of the anthropometric information gathered by the programme justified the expense involved in obtaining it. 0 Basil Blackwell Ltd. 1993, 108 Cowley Road, Oxford OX4 IJF, UK and 238 Main Street, Cambridge, MA 02142, USA. DISASTERS VOLUME 17 NUMBER 1
-
Upload
marion-kelly -
Category
Documents
-
view
220 -
download
3
Transcript of Operational Value of Anthropometric Surveillance in Famine Early Warning and Relief: Wollo Region,...
Operational Value of Anthropometric Surveillance in Famine Early Warning and Relief: Wollo Region, Ethiopia, 1987 - 88
MARION KELLY
In this article I examine the operational implications of the findings reported in ‘Entitlements, Coping Mechanisms and Zndicators of Access to Food: Wollo Region, Ethiopia, 1987-88‘ (Kelly, 1992). The usefulness of anthropometric and other indicators for early warning and relief planning in Wollo is assessed by comparing the findings of Save the Children Fund’s nutritional surveillance programme with those of the Early Warning and Planning Service of the Ethiopian government’s Relief and Rehabilitation Commission. Case studies are used to illustrate the value of anthropometric and other indicators for targeting relief food and monitoring its effects. The costs of monitoring various indicators are then considered, and the cost of the Save the Children Fund programme is compared with that of other programmes. It is argued that in Wollo, anthropometric surveillance is a cost-effective means of improving early warning, planning, targeting and monitoring.
During 1987 and 1988, the Nutrition Field WorkerlNutritional Surveillance Programme (NFWlNSP) of the Save the Children Fund (SCF) carried out longitudinal and cross- sectional anthropometric surveys in nine of the twelve uwrujus (districts) of Wollo Region, Ethiopia. In addition, NFWlNSP personnel monitored grain and livestock market indicators, and used questionnaires to collect information on crop yields, relief distribution, population movements and mortality (Kelly, 1992). The Early Warning and Planning Service of the Ethiopian government’s Relief and Rehabilitation Commission and the NFWlNSP were the Region‘s only sources of systematically collected data on food security.
In Wollo, failure of the main rains in
mid-1987 was followed by a period of acute food insecurity in 1988. A recent analysis of the anthropometric and socio-economic data collected by the NFWlNSP during 1987-88 led to two conclusions: first, the mean Weight for Length (WFL) of children under five was a valid indicator of access to food, which responded earlier than live- stock market trends, migration or mortality; and second, the movements of different indicators were not strongly correlated with one another (Kelly, 1992). In this paper I consider the practical implications of these findings, including the question of whether the operational value of the anthropometric information gathered by the programme justified the expense involved in obtaining it.
0 Basil Blackwell Ltd. 1993, 108 Cowley Road, Oxford OX4 IJF, UK and 238 Main Street, Cambridge, MA 02142, USA.
DISASTERS VOLUME 17 NUMBER 1
Anthropometric Surveillance in Famine Early Warning and Relief 49
EARLY WARNING AND PLANNING
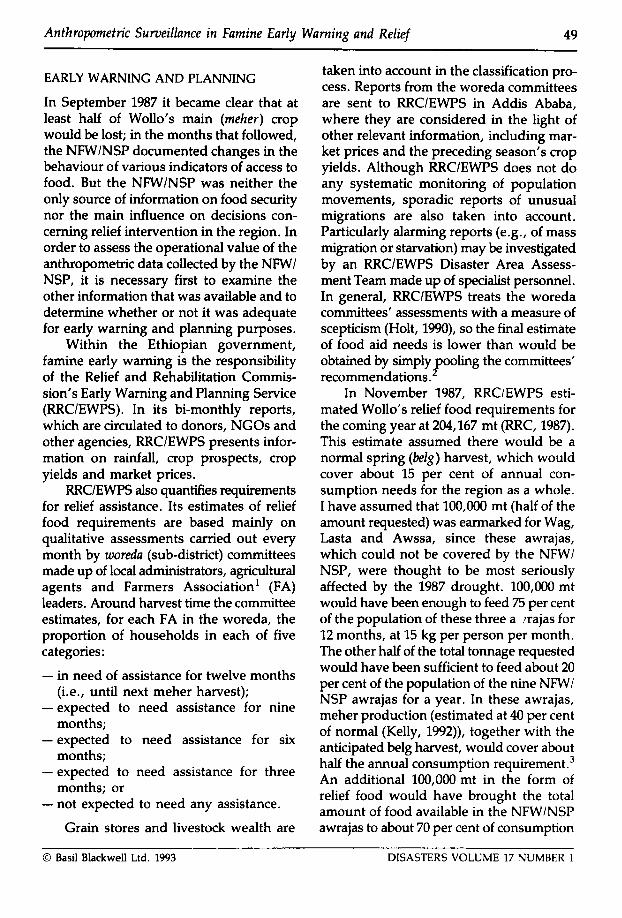
In September 1987 it became clear that at least half of Wollo’s main (meher) crop would be lost; in the months that followed, the NFWlNSP documented changes in the behaviour of various indicators of access to food. But the NFWlNSP was neither the only source of information on food security nor the main influence on decisions con- cerning relief intervention in the region. In order to assess the operational value of the anthropometric data collected by the NFWl NSP, it is necessary first to examine the other information that was available and to determine whether or not it was adequate for early warning and planning purposes.
Within the Ethiopian government, famine early warning is the responsibility of the Relief and Rehabilitation Commis- sion’s Early Warning and Planning Service (RRClEWPS). In its bi-monthly reports, which are circulated to donors, NGOs and other agencies, RRClEWPS presents infor- mation on rainfall, crop prospects, crop yields and market prices.
RRClEWPS also quantifies requirements for relief assistance. Its estimates of relief food requirements are based mainly on qualitative assessments carried out every month by woreda (sub-district) committees made up of local administrators, agricultural agents and Farmers Association’ (FA) leaders. Around harvest time the committee estimates, for each FA in the woreda, the proportion of households in each of five categories:
- in need of assistance for twelve months
- expected to need assistance for nine
- expected to need assistance for six
- expected to need assistance for three
- not expected to need any assistance.
(i.e., until next meher harvest);
months;
months;
months; or
Grain stores and livestock wealth are
taken into account in the classification pro- cess. Reports from the woreda committees are sent to RRClEWPS in Addis Ababa, where they are considered in the light of other relevant information, including mar- ket prices and the preceding season’s crop yields. Although RRClEWPS does not do any systematic monitoring of population movements, sporadic reports of unusual migrations are also taken into account. Particularly alarming reports ( e g , of mass migration or starvation) may be investigated by an RRClEWPS Disaster Area Assess- ment Team made up of specialist personnel. In general, RRClEWPS treats the woreda committees‘ assessments with a measure of scepticism (Holt, 1990), so the final estimate of food aid needs is lower than would be obtained by simply ooling the committees’ recommendations.
In November 1987, RRClEWPS esti- mated Wollo’s relief food requirements for the coming year at 204,167 mt (RRC, 1987). This estimate assumed there would be a normal spring (belg) harvest, which would cover about 15 per cent of annual con- sumption needs for the region as a whole. I have assumed that 100,OOO mt (half of the amount requested) was earmarked for Wag, Lasta and Awssa, since these awrajas, which could not be covered by the NFWl NSP, were thought to be most seriously affected by the 1987 drought. 100,OOO mt would have been enough to feed 75 per cent of the population of these three a !rajas for 12 months, at 15 kg per person per month. The other half of the total tonnage requested would have been sufficient to feed about 20 per cent of the population of the nine NFWl NSP awrajas for a year. In these awrajas, meher production (estimated at 40 per cent of normal (Kelly, 1992)), together with the anticipated belg harvest, would cover about half the annual consumption req~irement.~ An additional 100,000 mt in the form of relief food would have brought the total amount of food available in the NFWlNSP awrajas to about 70 per cent of consumption
4
0 Basil Blackwell Ltd. 1993 DISASTERS VOLUME 17 NUMBER 1
50 Marion Kelly
needs, leaving 30 per cent to be obtained from other sources.
In January 1988, RRClEWPS revised its assistance requirement upward to a total of 276,725 mt. Assuming that 85 per cent of the people of Wag, Lasta and Awssa were now expected to need full rations for the entire year, the revised relief requirement for the NFWlNSP awrajas would be enough to cover 25 per cent of the coming year’s consumption requirement.
The accuracy of these estimates can be gauged by comparing them with the amount of relief food actually provided, and assess- ing its effectiveness in mitigating the food insecurity experienced by the recipients. During 1988 the NFWlNSP awrajas actually received relief food equivalent to about 15 per cent of total consumption requirement, and the 1988 belg harvest proved dis- appointing (less than 50 per cent of normal, according to NFWlNSP questionnaire res- ponses). Thus total food available (through farmers’ own production plus relief distri- bution) would have covered about 55 per cent of total consumption needs, leaving the remainder to be made up through borrowing or purchases.
For a household with four members, each consuming 15 kg food per month, this leaves a deficit of 3.25 quintals (325 kg) for the year. One way of narrowing this gap would be to reduce consumption, and there is every reason to believe that people did exactly that (Kelly, 1992); however, the scope for compensating by means of dietary austerity measures is obviously limited. Even if no reduction in food intakes is assumed, a deficit of 3.25 quintals, at an average cost of 75 birr per quintal (the approximate cost of a basic mixed diet in early 1988), could be made up at a cost of around 250 birr. This amount could be raised by selling four to five sheep or goats at prevailing market prices, which would cause considerable hardship to the average household, but not leave it destitute.
Based as they are on awraja-level
averages, these calculations are no more than a crude indication of the magnitude of the problem faced by people in the NFWlNSP awrajas. Many poorer-than- average households would, of course, have become destitute if relief had been distri- buted uniformly, but in general this was not the case: although the vast majority of the households in an FA received a ration whenever food was distributed in their FA, the number of distributions made to each FA varied according to the priority assigned it by the woreda committee. In other words, although the poorest households within an FA received no more than their better-off neighbours, the socioeconomic inequalities between households within an FA were not enorm~us ,~ and the most food-insecure FAs tended to receive more than those with better access to food.
Had the NFWlNSP awrajas received even the amount of food aid recommended by RRClEWPS in November 1987, the signs of stress that were detected would almost certainly have been less pronounced. In other words, grain price rises (caused by diminished supply and increased demand) would not have been as sharp, and anthro- pometric deficits (caused by voluntary reduc- tions in food intake) would not have been as deep. Even if the amount of relief food requested in January 1988 had been pro- vided and the belg harvest had been much better, the average household would still have been left with a deficit of nearly two quintals. Although it is impossible to say what would have happened to market prices and anthropometric status in these hypo- thetical circumstances, it seems highly un- likely that there would have been serious adverse side-effects, such as disincentives to producers through depression of food prices.
If the preservation of assets (including good nutritional status, which can be classed as a health asset) is accepted as a legitimate goal of relief, then even the amount of food aid requested by the RRClEWPS in January
DISASTERS VOLUME 17 NUMBER 1 0 Basil Blackwell Ltd. 1993

Anthropometric Surveillance in Famine Early Warning and Relief 51
1988 was not an overestimate. On the other hand, for purposes of simply preventing excess mortality, the original (November 1987) recommendation appears to have been roughly correct. Hence it seems that the information collected by the NFWlNSP was neither used nor needed for early warning and planning purposes as of late 1987learly 1988. However, this analysis has not yet touched on the vital link between early warning and response, wherein the question of credibility is of central import- ance. Donors feel that the RRClEWPS habitually overestimates needs for assist- ance, and are often reluctant to accept its assessments (Cutler, 1985; Holt, 1990). Yet in late 1987 some of the NGOs operating in Ethiopia felt that the amount of aid reques- ted by the RRClEWPS for 1988 was too low (Sarah Atkinson, personal communication).
Lack of consensus on the validity of an assessment leaves a potential ‘escape hatch’ for decision-makers (Schaffer and Clay, 1984), who can delay taking action indef- initely while calling for more and better information. The NFWlNSP helped to narrow that escape hatch by providing inde- pendent confirmation of the severity of food insecurity. Essentially, the NFWlNSP’s information came from a source that was seen as having an objective point of view as well as a great deal of technical expertise. Hence, where the activities of the NFWl NSP and the RRCI EWPS overlapped, such as in the collection of market data, agree- ment between the two data sets helped to dispel doubts concerning the accuracy of the information supplied by RRCIEWPS. More- over, by increasing the amount and variety of relevant information available, the NFWI NSP provided support for the RRClEWPS’s interpretation of the present and likely future situation. After the first quarter of 1988, for example, when it became clear that child- ren’s mean WFL was declining unusually early and unusually rapidly, the NFWl NSP’s anthropometric data could have been adduced to argue for a more vigorous relief
response. Although it is impossible to say what would have happened in the absence of the NFWlNSP, the information it gen- erated probably improved donor and NGO confidence in RRClEWPS’s assessment and helped to ensure a timely response.
TARGETING AND MONITORING
The information collected by the NWlNSP could also have been used to target assist- ance within the region and to monitor the effects of the aid provided. In practice, the allocation of relief food within Wollo during 1988 was determined jointly by RRClEWPS and other implementing agencies, and was based mainly on the priorities established by the woreda committees. Information provided by the NFWlNSP was not a major factor in this process, although some felt that it should have been. In this section the usefulness of different NFWlNSP indicators for targeting food aid is explored by means of two case studies.
The first comes from Rayana Kobo awraja. RRClEWPS said that Rayana Kobo, with over 90 per cent harvest failure, would need full rations during 1988, but the food aid actually distributed there amounted to only 35 per cent of the full ration level. Mean WFL, which had been ‘goodt5 in early 1987, declined in the middle of the year. But it levelled off in 1988, and remained well with,in the ‘satisfactory’ range through- out the year, despite the apparently poor availability of food. Grain prices remained at twice normal levels (higher than in any other NFWlNSP awraja) until the middle of 1988, and the number of livestock sold rose by 50 per cent. However, prices for livestock fell by only 7 per cent, and fewer than 5 people per 100 households left their villages in search of work or assistance.
Crop yields, grain prices and livestock sales show Rayana Kobo to have been more seriously affected than other NFWlNSP awrajas. It ranked somewhere in the mid- dle, however, in terms of livestock prices
0 Basil Blackwell Ltd. 1993 DISASTERS VOLUME 17 NUMBER 1
52 Marion Kelly
and migration, and as one of the least affected in terms of anthropometric status.
Borena awraja provides a second case study. Although it normally produces a surplus of food, Borena suffered poor harvests (ranging from 30 to 45 per cent of ’normal’) for four consecutive seasons beginning with meher in 1986. The amount of relief food distributed in Borena during 1988 was equivalent to 11 per cent of con- sumption requirements. During the period February-August 1988, grain prices rose to levels almost 60 per cent higher than those recorded in the same months of the previous year. Prices for livestock fell by 10 per cent during the same period, while the number of livestock sold during 1988 was somewhat lower than in 1987. Over the period October 1987-September 1988, an average of six people per 100 households left their villages. Mean WFL fell by more than 3 percentage points during 1988, reach- ing 90 per cent (the borderline between ’satisfactory’ and ’poor’) in mid-year.
Compared to the other NFWlNSP awrajas, Borena was a little above average in terms of 1987 meher crop production, and average with respect to grain price. However, migration, livestock prices and anthropometric status would put it among the worst affected.
The various indicators appear to behave inconsistently in both Rayana Kobo and Borena, but if local conditions are taken into account the discrepancies can be reconciled. The grain prices and livestock sales for Rayana Kobo are rather alarming, but to some extent they were probably influenced by traders coming from nearby Wag and Lasta awrajas, or from neighbouring Rayana Azebo awraja in Tigray Region. All of these awrajas were at least as seriously drought-affected as Rayana Kobo, and all of them suffered from civil conflict, which further jeopardised access to food. The relatively good anthropometric status of children in Rayana Kobo might reflect the availability of both locally-produced and
donated supplementary foods, since cattle holdings (which help determine the avail- ability of meat, milk and butter) are higher in Rayana Kobo than in any other NFWl NSP awraja, and Rayana Kobo received more relief food per capita during 1988 than any other NFWlNSP awraja.
Because of their proximity to the adja- cent surplus-producing region of Gojjam, farmers in Borena have better access to paid work than others elsewhere in Wollo. This alone could explain the relatively high rate of migration from Borena (although sampling error makes it difficult to know whether it was really any higher than that of many other awrajas). The rather low mean WFL recorded in Borena suggests that although crop failure there was not as severe as it was elsewhere in 1987, this awraja’s needs for relief food in 1988 were not met in full, perhaps because the cumulative effects of several years of poor to indifferent production had been under- estimated, andlor because coping capacity had been overestimated.
These case studies illustrate the ways in which local differences influence the behaviour of indicators, and help to explain why different indicators can appear to give contradictory messages. Paradoxically, despite the outward simplicity of produc- tion methods, food sources in Wollo are diverse, and they become even more varied when food security is threatened. The same is true of factors that affect demand for food, such as asset holdings and income sources. The ability of indicators to predict or sum- marise the behaviour of other indicators is limited (Kelly, 1992). The reasons for this are that each indicator reflects one or more different aspects of the overall food security picture, and that communities respond to food insecurity in different ways.
The case studies presented above suggest that the targeting of relief during 1988 was based too much on 1987 yield esti- mates and grain prices, without taking suffi- cient account of demand factors and other
DISASTERS VOLUME 17 NUMBER 1 0 Basil Blackwell Ltd. 1993
Anthropometric Surveillance in Famine Early Warning and Relief 53
aspects of coping capacity. It follows that targeting could have been improved by con- sidering all available indicators, including anthropometric status. This is not just a matter of assigning a fixed weighting to each of several indicators and calculating an overall score, but of understanding the local differences that account for the apparent discrepancies.
COST Ideally, a food security information network would make use of all potentially available indicators of food supply and access to food; in practice, however, resource constraints can make this difficult to just@. It is there- fore worth examining the usefulness of dif- ferent indicators in relation to the cost of monitoring them.
Arguably, the earliest indicators of food insecurity are crop yields and the price of grain. Of all the indicators considered here, grain prices are probably the easiest to use, for three reasons: accurate recording of grain prices does not require much educa- tion or training; personnel can be recruited locally so very little travel is involved; and it is relatively easy for the data analyst to distinguish trends from ‘noise’. The first and second features minimise the cost of data collection and the third facilitates detection of meaningful changes. By contrast, accurate estimation of crop yields is neither cheap nor easy, but since most countries attempt to quantify production at regional and district level for general planning purposes, monitoring of this indicator need not involve additional manpower or cost.
Although crop yield helps to predict change in grain price, neither is a good predictor of the behaviour of the other indicators that help to complete the food security picture (Kelly, 1992). Where grain prices are already being collected, the duties of the grain price recorder can fairly easily be extended to include the recording of live- stock prices and livestock sales volumes. Anthropometric surveillance, on the other
hand, is generally less easy to incorporate into existing systems of information collec- tion, because it demands specialised skills and a considerable amount of field work. The same is true, however, of non-market socioeconomic data (e.g., migration rates, mortality rates, household food stocks) if reliable and representative results are to be obtained.
It is difficult to disaggregate the cost of the NFWlNSP into its anthropometric and non-anthropometric components, but to collect only the non-anthropometric data from the same sites would probably cost about half as much as it does to collect both kinds of data. Elimination of the anthropo- metric surveillance component would make it possible to reduce staff numbers con- siderably, but a disproportionate number of the staff who could be spared would be those with fewer skills, who cost less to employ in the first place. To continue collecting representative quantitative socio- economic data, skilled interviewers would need to be retained; they would need to travel to survey sites, and to receive super- vision and administrative support. In a place like Wollo, the regular collection of accurate, up-to-date and representative socioeconomic data would still be a skilled labour-intensive undertaking necessitating considerable expenditure.6
Having compared the costs of various individual components of the NFWINSP, I now consider the costs of the NFWINSP as a whole in relation to those of other pro- grammes. In 1987-88, SCF spent about a third of a million dollars a year on the Wollo NFWINSP, . making it considerably more expensive than the average NGO develop- ment project. The cost of the NFWINSP is also high in relation to the Ethiopian government’s budget for early warning, which is half a million dollars a year for the entire country.
Relative to the cost of relief operations, however, the NFWINSP is actually quite cheap. The relief food originally requested
0 Basil Blackwell Ltd. 1993 DISASTERS VOLUME 17 NUMBER 1

54 Marion Kelly
for Wollo in 1988 (i.e., just over 200,000 mt which clearly was not an inflated estimate) would have cost US$% million, assuming an average cost of $450 per mt, including external and internal transport (Andrew Jowett, personal communication). This amount of food is not needed every year in Wollo, but it seems reasonable to assume that on average 50,000 mt are needed annually, at a total cost of $22.5 million. If these estimates are accurate, the cost of the entire NFWlNSP is equal to only 1.5 per cent of the average annual cost of providing relief, while the anthropometric surveillance component adds less than 1 per cent to the total bill for early warning and relief. Ex- penditure on anthropometric surveillance in Wollo can therefore be justified as long as the information it produces makes it pos- sible to improve the cost-effectiveness of relief operations by even a few percent.
The benefits of the NFWlNSP per unit cost are, moreover, likely to increase with time. The longer the programme remains in operation, the more it will accumulate information, field experience, and insight into the dynamics of rural communities. The accumulation of field experience should lead to refinements in the organisation of the programme, which will reduce the cost of data collection. The interpretation of data should become easier and more accurate as data from good and bad years accumulate, and as understanding of the cultures and the economies of the region increases.
The main drawback of the NFWlNSP is not its cost, which is tiny in comparison to what is spent on relief operations, but the fact that, owing to civil conflict, the pro- gramme has rarely been able to cover Wag and Lasta, the awrajas where food insecur- ity is greatest. This barrier has recently been lifted, however, by political developments which have made these awrajas accessible.
CONCLUSION
I have shown elsewhere that for Wollo
Region, anthropometric status is a valid and timely indicator of access to food, which has a potential role in famine early warning as well as in the planning, targeting and monitoring of relief operations (Kelly, 1992). The task of this paper has been to assess the practical utility of the anthropometric com- ponent of the NFWlNSP for all of these activities under the conditions prevailing in Wollo during 1987-88.
Toward the end of 1987, the Ethiopian government’s RRClEWPS predicted that a substantial proportion of people in Wollo would experience food insecurity during 1988. The amount of food aid needed to avert this threat was estimated from the qualitative reports of local communities. In these early warning and planning activities, RRClEWPS used neither the anthropo- metric nor the socioeconomic data collected by the NFWlNSP. Nonetheless, the NEW/ NSP probably helped elicit an international response by independently verifying some of the data collected by RRClEWPS, and by providing additional information which supported RRCIEWPS’s assessment. The additional information provided by the NFWlNSP could also have been used to improve the accuracy of relief targeting.
The practical value of anthropometric surveillance for targeting relief and monitor- ing its impact is apparent from case studies of two Wollo awrajas. These show that, owing to local differences, indicators often behave inconsistently and thus no single indicator can adequately summarise the complex conditions prevailing in vulnerable rural communities. In these circumstances, the accuracy of targeting can be maximised by using a variety of indicators, including anthropometric status, and by interpreting their behaviour in the fullest possible light.
The cost of the NFWlNSP is high in relation to those of many other NGO pro- grammes and to the national RRClEWPS budget for early warning, but quite low in relation to the cost of relief operations. Provided the information it produces enables
DISASTERS VOLUME 17 NUMBER 1 0 Basil Blackwell Ltd. 1993
Anthropometric Suroeillance in Famine Early Warning and Relief 55
relief to assist vulnerable people more cost- effectively, expenditure on the NFWlNSP is worthwhile.
Notes
This article is an offshoot of a research project funded by the Health and Population Division of the British Government’s Overseas Develop- ment Administration, and carried out at the Centre for Human Nutrition, Departments of Public Health and Policy and Clinical Sciences, London School of Hygiene and Tropical Medi- cine. The data were collected by Save the Children Fund’s Wollo Nutrition Field Workers and Supervisors: Addis Eshete, Atkilt Betre, Berhanu Mamo, Engedaw Baye, Eyassu Gebre Meskel, Fekadeselassie Awoke, Fikremariam Engeda, Hailu Sitotaw, Kahassay Shumye, Kebebush Kebede, Kedir Ebrahim, Mekonnen Yimer, Melash Reda, Mohammed Yimam, Tarekegne Alemu, Tesfaye Kebede, Yabibal Getaneh, Solomon Berhe, Zemedkun Zeleke, Shewaye Seifu, Solomon Lebassie, Hailu Alemu, Ayalew Ali, Gebeyehu Lemma, Mesfin Hailu, Semerab Berhie, Wondwossen Abebe and Zerihun Gelagaye. All deserve much credit for their diligence and hard work in the field, as does Julie Pearce, who was Programme Head during 1988-89. Other SCF staff who helped make this project possible are Anna Mukkejee, Marta Mulugeta, Molla Asnake, Chris Thomton, Mike Twine, Louisa Gosling and John Seaman. Tony Nash, Tom Marshall, Jeremy Shoham, Jane Corbett, Liz Dowler, Judith Appleton, Erica Wheeler, Philip Payne, Celia Petty, Julius Holt and Sarah Atkinson also provided advice and support at various stages. The project would not have been possible without the contributions of all of the above, to whom I would like to express my gratitude.
1. Each woreda is made up of between a dozen and a hundred FAs. Each FA is made up of several hundred households whose main source of livelihood is farming.
2. In northern Shoa region, for example, at the end of 1987, the local committees’ estimate of relief assistance requirements was about three times higher than RRCIEWPS’s final figure for the area (Sarah Atkinson, personal communication).
Meher production (Le., 0.4 x 0.85) + belg production (i.e., 0.15) = 0.49. The extremes of wealth and poverty seen in certain other societies are not found in rural Ethiopia, where land is allocated according to family size and cannot be bought or sold. RRClEWPS (1990) uses the following classifi- cation scheme for mean WFL: good = at least 95 per cent of NCHS median value; satisfactory = 90-94 per cent; poor = 85-89 per cent; serious = less than 85 per cent. There may, however, be some scope for reducing costs by avoiding duplication of data collection in the areas where RRClEWPS and NFWlNSP overlap (i.e., production estimates and grain prices).
References Cutler, P. (1985) The use of economic and social
information in famine prediction and response. Research Scheme No. R3779. Overseas Development Administration, London.
Holt, J. (1990) Ethiopia: review of the S C F W K ) Nutritional Surveillance Programme. Mimeo. Save the Children Fund, London.
Kelly, M. (1992) Entitlements, coping mechan- isms and indicators of access to food: Wollo Region, Ethiopia, 1987-88. Disasters 16,
Relief and Rehabilitation Commission, People’s Democratic Republic of Ethiopia (1987) Assistance requirement of 1988. Relief and Rehabilitation Commission, Addis Ababa.
Relief and Rehabilitation CommissionlEarly Warning and Planning Service (1990) Guidelines on nutritional status data and food relief. Relief and Rehabilitation Commission, Addis Ababa.
Schaffer, B.B. and Clay, E.J. (eds) (1984) Room for Manoeuvre: an exploration of public policy planning in agricultural and rural development. Heinemann Educational Books, London.
322-38.
~~
Marion Kelly Joint Centre for Public Health Studies University of Wales College of
Heath Park, Cardiff CF4 4XN UK
Medicine
0 Basil Blackwell Ltd. 1993 DISASTERS VOLUME 17 NUMBER 1


![[PPT]Images of the Irish Famine - Irish Literary Studiesireland.wlu.edu/lecture/famine/Images of the Irish Famine... · Web viewImages of the Irish Famine Washington and Lee University](https://static.fdocuments.in/doc/165x107/5b30862e7f8b9a91438dbcfc/pptimages-of-the-irish-famine-irish-literary-of-the-irish-famine-web.jpg)