Operational Review and Recommendations For City of San ...
179
Operational Review and Recommendations For City of San Francisco Golf Operations San Francisco, California Prepared For: San Francisco Nonprofit Golf Foundation Five Palo Alto Square 3000 El Camino Real Palo Alto, CA 94306-2155 Prepared By: 1150 South U.S. Highway One, Suite 401 Jupiter, Florida 33477 (561) 744-6006 February 2007
Transcript of Operational Review and Recommendations For City of San ...

Operational Review and Recommendations For City of San Francisco Golf Operations
San Francisco, California
Prepared For: San Francisco Nonprofit Golf Foundation
Five Palo Alto Square 3000 El Camino Real
Palo Alto, CA 94306-2155
Prepared By:
1150 South U.S. Highway One, Suite 401
Jupiter, Florida 33477 (561) 744-6006
February 2007

Operational Review and Recommendations For City of San Francisco Golf Operations

Table of Contents
Introduction ................................................................................................................... 1
Executive Summary ...................................................................................................... 3 Organization of City Golf System...........................................................................................3 How the System Evolved to its Present State........................................................................4
Golf System Expenses ..................................................................................................................4 Management Issues...............................................................................................................6 Recent Municipal Golf Success Stories .................................................................................6 Possible Solutions for San Francisco Municipal Golf System................................................7
Continue As Is ...............................................................................................................................7 Close Course(s).............................................................................................................................7 NGF Consulting Management Recommendation .........................................................................8 Funding Options for Improvements and Working Capital .............................................................9 Business Model .............................................................................................................................9
Revenue Enhancement Opportunities .................................................................................10 Enhanced Marketing....................................................................................................................11 NGF Financial Projections...........................................................................................................11
Summary Statement ............................................................................................................12
Market Environment.................................................................................................... 13 Market Area Overview .........................................................................................................13
Demographics Summary.............................................................................................................13 Economic Overview.....................................................................................................................14
Golf Market Overview ..........................................................................................................15 National Trends in Golf Demand and Supply..............................................................................15 National Trends in Municipal Golf ...............................................................................................16 Public Golf Operational Norms....................................................................................................17 Estimated San Francisco Area Golf Demand 2006-2011 ...........................................................21 San Francisco Area Golf Supply Inventory .................................................................................23 Golf Market Summary..................................................................................................................24
Market Environment Summary ............................................................................................25
Competitive Golf Market ............................................................................................. 27 Golf Market Dynamics..........................................................................................................27
Local/Regional Municipal Golf Market.........................................................................................27 Daily Fee Market .........................................................................................................................31 Alternative Length Facilities ........................................................................................................34 National Premier Municipal Golf Courses ...................................................................................35
Regional Case Studies ........................................................................................................38 Regional Municipal Golf...............................................................................................................38

Public Utilities Commission (PUC) Golf Courses ........................................................................38 Regional Case Study Summary and Observations.....................................................................43
Other California / National Case Studies .............................................................................45 Summary Observations...............................................................................................................45 Summary Table ...........................................................................................................................47
Competitive Golf Market Summary ......................................................................................48
City of San Francisco Municipal Golf Operations Review....................................... 50 Overview Of Golf Operations ...............................................................................................50
Administration..............................................................................................................................50 Golf Enterprise Fund ...................................................................................................................51 Golf Course Maintenance and Staffing .......................................................................................51 Capital Improvement Program ....................................................................................................53 Harding Park Renovation ............................................................................................................53 Agreement with PGA TOUR........................................................................................................55 Summary of System-wide Historical Performance......................................................................57 Marketing.....................................................................................................................................59 Golf Fees .....................................................................................................................................59 Labor Expenses and Issues ........................................................................................................59 Accounting...................................................................................................................................61
Individual Facility Analyses ....................................................................................... 62 Harding Park Golf Course....................................................................................................62
Harding Park GC Location and History .......................................................................................62 Inventory of Facilities...................................................................................................................63 Golf Course Physical Review ......................................................................................................64 Operations Overview...................................................................................................................68 Golfer Survey...............................................................................................................................73 Facility Performance and Data Analysis......................................................................................76 Other Issues at Harding Park ......................................................................................................81 Harding Park Best Case “As-Is” Financial Projections................................................................81
Sharp Park Golf Course.......................................................................................................84 Sharp Park GC Location and History ..........................................................................................84 Inventory of Facilities...................................................................................................................85 Physical Review ..........................................................................................................................87 Operations Overview...................................................................................................................90 Sharp Park Golf Course - Golfer Survey.....................................................................................92 Golf Facility Performance and Data Analysis..............................................................................94 Other Issues at Sharp Park .........................................................................................................98 Sharp Park Best Case “As –Is” Financial Projections .................................................................99
Lincoln Park Golf Course ...................................................................................................101 Lincoln Park GC Location and History ......................................................................................101 Inventory of Facilities.................................................................................................................102 Physical Review ........................................................................................................................103

Operations Overview.................................................................................................................105 Lincoln Park – Golfer Survey.....................................................................................................106 Golf Facility Performance and Data Analysis............................................................................108 Other Issues at Lincoln Park .....................................................................................................112 Lincoln Park Best Case “As –Is” Financial Projections .............................................................113
Golden Gate Park Golf Course ..........................................................................................114 Inventory of Facilities.................................................................................................................114 Physical Review ........................................................................................................................115 Operations Overview.................................................................................................................116 Golden Gate Park GC – Golfer Survey .....................................................................................118 Golf Facility Performance and Data Analysis............................................................................119 Golden Gate Park Best Case “As –Is” Financial Projections ....................................................122
Gleneagles Golf Course (McLaren Park)...........................................................................124 Gleneagles GC Location and History ........................................................................................124 Inventory of Facilities.................................................................................................................125 Physical Review ........................................................................................................................125 Operations Overview.................................................................................................................126 Gleneagles GC – Golfer Survey................................................................................................128 Golf Facility Performance and Data Analysis............................................................................129 Gleneagles “As–Is” Financial Projections..................................................................................131
System-Wide Best Case ‘As-Is’ Financial Projections .......................................................132 Full System Rounds Played Projections ...................................................................................132 Full System Revenue and Expense Projections .......................................................................133
Recommendations .................................................................................................... 134 Management Options.........................................................................................................134
Continue As-Is (Status Quo) .....................................................................................................134 City Manages.............................................................................................................................135 Closure of Golf Course(s)..........................................................................................................136 Full Service Management Contract ...........................................................................................136 Leasing ......................................................................................................................................138 New Non-Profit 501(c)3 Corporation .........................................................................................140
NGF Consulting Management Recommendation ..............................................................141 New York City Example.............................................................................................................141 City of Baltimore Example .........................................................................................................142 San Francisco Public Utilities Commission Golf Courses .........................................................145 Recommendation for the City of San Francisco Municipal Golf System...................................145
Other System-Wide Recommendations.............................................................................147 Yield Management.....................................................................................................................147 Pace of Play ..............................................................................................................................147 Record Keeping / Accounting....................................................................................................148 Marketing Plan...........................................................................................................................149
Individual Facility Recommendations.................................................................................150 Harding Park / Fleming GC Recommendations ........................................................................150

Sharp Park GC Recommendations ...........................................................................................150 Lincoln Park GC Recommendations .........................................................................................151 Golden Gate Park GC Recommendations ................................................................................152 Gleneagles GC Recommendations...........................................................................................152 Projected Cost of Individual Facility Recommendations ...........................................................153
Projected Economic Performance for the 501(c)3 Corporation ............................ 155 Key Assumptions ...............................................................................................................155
Justifications for Projections......................................................................................................157 Golf Operations Performance by Facility ...........................................................................158 Harding / Fleming GC Projected Financial Performance (FY2008-12)..............................158
Harding / Fleming GC Revenue Assumptions (FY2008-12) .....................................................158 Harding / Fleming GC Expense Assumptions (FY2008-12)......................................................158 Harding / Fleming GC Projected Financial Performance (FY2008-12).....................................160
Sharp Park GC Projected Financial Performance (FY2008-12) ........................................161 Sharp Park GC Revenue Assumptions (FY2008-12)................................................................161 Sharp Park GC Expense Assumptions (FY2008-12) ................................................................161 Sharp Park GC Projected Financial Performance (FY2008-12) ...............................................163
Lincoln Park GC Projected Financial Performance (FY2008-12) ......................................164 Lincoln Park GC Revenue Assumptions (FY2008-12)..............................................................164 Lincoln Park GC Expense Assumptions (FY2008-12) ..............................................................164 Lincoln Park GC Projected Financial Performance (FY2008-12)..............................................166
Golden Gate Park GC Projected Financial Performance (FY2008-12) .............................167 Golden Gate Park GC Revenue Assumptions (FY2008-12).....................................................167 Golden Gate Park GC Expense Assumptions (FY2008-12) .....................................................167 Golden Gate Park GC Projected Financial Performance (FY2008-12) ....................................169
Gleneagles (McLaren Park) GC Projected Financial Performance (FY2008-12) ..............169 Gleneagles GC Revenue Assumptions (FY2008-12) ...............................................................169 Gleneagles (McLaren Park) GC Projected Financial Performance (FY2008-12) .....................170
System-Wide Golf Operations Performance......................................................................171 Financial Projections Summary .........................................................................................172
Summary Statement.................................................................................................. 173

National Golf Foundation Consulting, Inc. – City of San Francisco, California – 1
Introduction National Golf Foundation Consulting, Inc., a subsidiary of the National Golf Foundation, was retained by the San Francisco Nonprofit Golf Foundation to perform a comprehensive review of the City of San Francisco’s golf system. The City Department of Parks and Recreation’s five golf complexes – Harding Park, Gleneagles (at McLaren Park), Golden Gate Park, Lincoln Park, and Sharp Park, were to be examined as to operations, management, and physical condition. The purpose of this examination was to identify opportunities for improving the performance of the Golf Fund that has been struggling in the face of growing operating expenses, and has also been burdened by the substantial yearly debt service tied to the $23+ million renovation of Harding Park.
In response, the Department, in partnership with the new nonprofit established to help the City explore best practice alternatives to managing the courses, engaged NGF Consulting to complete a thorough assessment and evaluation of the City’s golf course operations and capital needs. The results of this study will help determine the most appropriate course of future action.
Throughout this report, we may refer to shortened names for: the City of San Francisco (“City”), the San Francisco Parks and Recreation Department (“RPD”), and National Golf Foundation Consulting, Inc. (“NGF Consulting” or “NGF”).
The primary goal of the study is to evaluate the overall golf system structure from the standpoint of revenue and performance optimization, and to help identify opportunities that can be exploited to increase the overall economic performance of the golf system, while preserving or improving the quality of the assets and ensuring affordable access for San Francisco residents. A necessary adjunct of this research effort is the evaluation of each of the system’s six golf courses (in five parks) individually from the standpoint of management, maintenance, pricing, operations, and adequacy of physical plant.
The results of this review will be used to assist the City and RPD officials in determining the appropriate courses of action for the future of these facilities with regard to management, operations and capital improvements. Activities conducted in completion of this report included: field research; statistical analysis; a series of meetings with key City, and RPD officials; meetings with golf operations personnel at the individual courses; a series of tours and agronomic inspections of the City golf courses; and, interviews with City of San Francisco golfers. Further, NGF staff consultants visited many of the area’s competing public golf facilities to gain an understanding of the market dynamics that help shape operating results at City courses.
The key consultants contributing to this study effort include Richard B. Singer, Director of Consulting Services at National Golf Foundation (NGF), and Ed Getherall, Senior Project Director at NGF, as well as Forrest Richardson and Rick Wesselman of Forrest Richardson & Associates.
NGF Consulting would like to thank the officials and staff members of the City of San Francisco Recreation and Parks Department, who contributed greatly to this study effort. Special thanks goes to Frank (“Sandy”) Tatum, Jr. of the San Francisco Nonprofit Golf Foundation, for helping us understand the history of San Francisco golf, and the importance of these City golf facilities

National Golf Foundation Consulting, Inc. – City of San Francisco, California – 2
and their relative place in the market. We would also like to thank managers and personnel at the City golf courses, as well as other market golf operators for their cooperation in providing timely and comprehensive data and other information. Following is the consultants’ report on the operation of the City of San Francisco municipal golf operation and our recommendations for its future.

National Golf Foundation Consulting, Inc. – City of San Francisco, California – 3
Executive Summary The following is a summary of the significant findings and recommendations made by National Golf Foundation Consulting, Inc. (NGF Consulting). The supporting text and tables are found in the body of the attached report and appendices.
The City of San Francisco’s municipal golf system comprises an impressive portfolio of golf course assets located in beautiful urban parkland or coastal settings. Nearly all have highly regarded layouts and character favored by golf traditionalists, and several have historical significance. Three of the five date to the early 1900s, and each has a classic design, including Alister Mackenzie’s Sharp Park. We have observed many municipal golf systems, and we feel the San Francisco municipal golf courses comprise a very valuable and diverse set of facilities that compare favorably to nearly all we’ve observed.
Harding Park, which also includes the 9-hole executive Fleming course, is the crown jewel of the system, and is widely respected again since its renovation. The scenic Lincoln Park offers a strong layout that is playable for golfers of all skill levels, and features the spectacular 17th hole, which has striking views of San Francisco Bay and the Golden Gate Bridge. Sharp Park has the classic Mackenzie design and hugs the Pacific Ocean. Golden Gate Park offers an excellent urban parkland venue that is great for children and beginners. Gleneagles features a very interesting and extremely challenging layout, with elevation changes and excellent vistas of the City; it appeals to the hard-core golfer.
ORGANIZATION OF CITY GOLF SYSTEM Oversight of the golf courses falls within the Department of Parks & Recreation (RPD), and the system is organized as an Enterprise Fund. The RPD and its Director oversee the municipal golf courses. The Department’s Golf Division oversees grounds maintenance, while the Property Management Department handles contracts for each golf course property, including those with the First Tee, PGA TOUR, and Kemper Sports Management. The basic chain-of-command for the Golf Division is as follows:
• General Manager, Recreation & Park Department • Director of Operations • Superintendent of City Wide Services • Golf Program Director
City oversight of the golf courses is restricted to grounds maintenance and contract oversight. This is extremely rare in municipal golf systems. Normally, even if the municipality’s owned golf courses are privately operated, there is someone in the Parks department that has business knowledge with respect to golf. In San Francisco, there are no positions, either staffed or vacant, that entail any expertise in the actual administration and management of municipal golf courses or golf system operations. NGF Consulting was told that creating such a position was discussed “four or five years ago” but it has never been budgeted for.
The individual golf facilities, with the exception of Gleneagles, are maintained by RPD personnel and are managed under a variety of agreements, with no uniformity. Gleneagles is operated via a ground lease, and contributes roughly $48,000 per year net to the Golf Fund. Two of the facilities – Lincoln and Sharp – have been on month-to-month lease agreements for several

National Golf Foundation Consulting, Inc. – City of San Francisco, California – 4
years. Harding Park and Golden Gate are operated under management agreements, though they differ greatly in nature.
HOW THE SYSTEM EVOLVED TO ITS PRESENT STATE NGF Consulting was told that the golf system was quite profitable for the City, right up through the early 2000s. However, even as profits were being made, capital improvements were apparently non-existent, as these funds were reportedly funneled to other RPD uses or back to the General Fund. The results of this pattern were predictable, as the once-proud jewel of the system, Harding Park, had fallen into a state of disrepair by the time the year 2000 came around. The City agreed that a total renovation of the facility was needed, and its original plan to finance the makeover was to raise private funds. That idea failed for many reasons and then the City’s golf operator, Arnold Palmer Golf Management Co., backed out of its deal with the city to oversee the renovation and manage the course.
Later that year, the city devised a plan to use $16 million of state grant funds, which were designated to improve or build recreational facilities for low-income and minority San Francisco residents, as a loan to Harding Park. Future golf course revenues were designated as a means to repay the loan with interest. In 2002, the Board of Supervisors authorized the Recreation and Park Department to use the state funds for Harding, provided that the money was repaid with interest from golf course funds within 25 years.
The creation of the Golf Fund was a component of the overall plan to renovate Harding Park. A RPD brief – “The Revised Plan for Renovating Harding Park” – from February 2002 stated “The fund could capture golf course revenues and use them to pay for operating and maintenance expenses and a capital improvement reserve, to repay the initial grant expenditure plus interest, and to help fund future improvements to other City courses including Lincoln Park. The Golf Fund would essentially function as a dedicated capital improvement reserve account for improving and maintaining the golf courses.” (Bold and italics by NGF Consulting).
The Harding renovation (which ran way over budget) had the desired effect on green fees and revenues, which are now among the highest in the nation for a municipal facility at more than $6 million. Average green fee revenue per round for the Harding Park championship course for the first two quarters of FY06-07 is nearly four times what they were in 99-00, a reflection of non-resident green fees that are about five times what they were prior to the renovation. System-wide revenues increased from about $5.1 million prior to the renovation, to $8.93 million (excluding General Fund transfer) in 05-06. Additionally, the relationship with the PGA TOUR that resulted from the renovation plan should have positive repercussions on the system for years to come, as it will help to add exposure and popularity to Harding Park and San Francisco golf, if not earning net profits for the Golf Fund.
Golf System Expenses However, expenses have also escalated dramatically, making Harding also one of the most expensive facilities to operate and maintain in the country. The Fiscal Year 2006-07 budget for the facility is a remarkable $8.6 million, including a $1.417 million dollar debt service payment to the Open Space Fund, related to the renovation. The line item for ‘Professional Services’ (includes $192,000 management fee and other operating expenses that pass through to the City) alone is at nearly $3.7 million, while maintenance labor and benefits account for $2.19

National Golf Foundation Consulting, Inc. – City of San Francisco, California – 5
million. The Harding budget accounts for about 70% of the system’s $12.36 million total budget, which is up from about $3.4 million as recently as FY 2000-01.
The cost of production per round in 05-06 was $49.56, up 500% from about $10 in FY 99-00. San Francisco’s cost of production per round in FY 2005-06 was the second highest among the regional municipalities surveyed in this report, at $45.24 per round. This figure will go up considerably for 2006-07, as the payment to the Open Space fund increases to $1.41 million and the budget at Harding Park increases significantly. Despite these budget increases, the average number of full-time equivalent maintenance staff is lower in San Francisco (on a staff per hole ratio) than at other regional municipal golf facilities profiled for this report. Labor as a percentage of the total expense budget averaged 44.8% among the municipalities reporting. For those golf systems that were completely self-operated by the municipality, the average was 49%. San Francisco is at 56.2%. San Francisco’s cost to produce each round of golf is also more than twice that of nearly all the national comparable municipal golf systems profiled in this report
These statistics would not be so telling if the San Francisco municipal golf courses were in better condition. However, based on the experience and industry expertise of the NGF Consulting team, the City courses (other than Harding Park), particularly Lincoln and Sharp, are in inferior maintenance condition, to the vast majority of regional (and national) golf systems we profiled. With the high expense structure, we would expect top-flight maintenance conditions at the subject facilities, but that is not the case. As NGF Consulting documents in this report and in Appendix G, the City’s municipal golf courses, with the exception of Harding/Fleming due to the recent renovation, have been neglected to various degrees.
The increasing operating expense and debt service payment at Harding Park came at a time when rounds played at the City courses were falling precipitously. System-wide (excluding Gleneagles) rounds fell by an extraordinary 125,598 between FY 1999-00 and 2005-06 – a decline of 37%. Although rounds were falling in most golf markets nationally during this time, as well as in the Bay Area (NGF Consulting research revealed an average per course decline of about 25% since the late 1990s), the decrease in San Francisco was more dramatic than in most markets we’ve studied.
The combined effect of decreased play levels, rapidly increasing expenses, and the debt service payment tied to the Harding renovation had a predictable effect on the Golf Fund’s economic performance. The Golf Fund cash flowed positively through FY 2003-04, when it netted $337,416. In FY 04-05, the Fund showed a $51,692 loss, excluding a transfer in from the General Fund of $536,372. Still, 04-05 showed a small operating profit before the initial repayment to the Open Space Fund was made in the amount of $329,080. Operating losses grew in FY 2005-06, to nearly $880,000 (excluding a transfer in from the General Fund of $1.57 million), despite revenues of more than $8.9 million. The repayment to Open Space of $935,420 brought total losses to $1.815 million.
It is certainly true that the market environment for golf has contributed to these problems, as a combination of factors has conspired to affect golf negatively both regionally and nationally. Though NGF demand modeling does not indicate an excess supply of golf courses in the region (and certainly not on the peninsula), there has been a considerable amount of new golf course development in the region, particularly in the East Bay and North Bay areas. Callippe Preserve in Pleasanton and Los Lagos in San Jose are the two most recent municipal market entrants, and both had immediate market impact. Other factors that have contributed to a decline in golf regionally and nationally include: an increase in the cost of living; the aftereffect of 9/11

National Golf Foundation Consulting, Inc. – City of San Francisco, California – 6
(emotionally as well as financially), especially in tourist markets; and, time and money constraints. Closer to home, despite the strength of high technology in the region, an industry downturn in the early 2000s led to much job displacement, which certainly had an affect on activity levels at area golf courses.
MANAGEMENT ISSUES Having noted this, NGF Consulting believes that the major factor contributing to the current situation that the Golf Fund and the individual courses find themselves in is neglect of the golf system by the City and the RPD. As noted, there is a lack of expertise and oversight within the RPD with respect to the business of golf; though there are undoubtedly talented people working here, none have the background in municipal golf course operations. The neglect of the golf assets is the result of the lack of oversight, and NGF Consulting believes that the condition of these courses, with the exception of Harding/Fleming Park, is the single greatest factor precluding meaningful revenue growth. The primary reason these courses fell into disrepair is that, even when the system was making money, profits were siphoned off and not re-invested in system. The lack of a formal master plan for improvements, which is extremely rare in municipal golf systems, can be a death knell for a golf system.
The City is experiencing a troubling combination of circumstances with its golf system. Our experience has been that we would normally observe municipal golf courses in poor condition when private lessees were neglecting them. When this occurs, at least the municipality has no exposure on costs and is collecting rent/concession payments without financial risk. In San Francisco’s case, as we have documented in this report, the municipality is maintaining the golf courses poorly, and at great expense – the worst of both worlds. Golf courses in poor condition will generally preclude most actionable solutions to improving revenue performance. San Francisco is essentially caught in a “Catch 22” situation: In order to increase revenues to support the high expense structure and debt payment, green fees and/or rounds played must increase significantly; however, in order to be able to increase fees and/or rounds, conditions must be improved. Therefore, either additional expense has to be incurred (further deepening the deficit) to improve the courses, or a more efficient solution to maintaining the golf courses must be arrived at.
Municipal golf systems in financial distress are not unique, and have become much more common since the present downturn in the national golf economy began around the turn of the century. In the body and appendix of this report we have detailed several regional municipalities that are actively seeking solutions to their golf enterprise fund problems. For instance, the City of Oakland currently has an RFQ issued for the management, maintenance, and capital upgrades of Lake Chabot Golf Course. Also, as a result of low revenues and growing maintenance costs, the City of Salinas currently has an RFP issued to privatize maintenance, with the stipulation that nobody that worked on maintenance will lose jobs, but will be relocated.
RECENT MUNICIPAL GOLF SUCCESS STORIES In this report, we also profiled a couple of national success stories – municipalities that were able to completely turn around failing golf systems through creative solutions. One was New York City, which operated and maintained its twelve golf courses with unionized labor up until 1983. Operating losses were in the multiple millions of dollars, and playing conditions were sub par. Recognizing that they did not have the expertise within the City to effectively manage the golf system, and that labor costs were growing out of control, the City decided to turn a few of the courses over to “licensees” to test the waters. City workers assigned to the golf courses

National Golf Foundation Consulting, Inc. – City of San Francisco, California – 7
were simply reassigned within Parks Department. The experiment was a success, and the City golf operation was eventually fully licensed. Not only does the City net more $6 million annually from the system, but playing conditions are immaculate, low resident green fees have been maintained, and the licensees have made multiple millions of dollars in capital improvements to the courses.
The second example is Baltimore, which faced a very similar situation to New York. Also, mismanagement and excessive political influence on the daily operations of the golf system were a huge problem. The city’s ultimate solution involved the creation of a tax-exempt, non-profit 501(c)3 corporation, which leased the golf courses from the city. The new 501 (c)3 Corporation, led by a Board of Directors, hired golf management and maintenance experts. Operating free of the reins of local government, the Baltimore Municipal Golf Corporation became a success story, rehabilitating the golf facilities and eventually turning enough profit to re-invest millions in the system, as well as contribute greatly to junior golf causes, while preserving very affordable resident green fees.
POSSIBLE SOLUTIONS FOR SAN FRANCISCO MUNICIPAL GOLF SYSTEM Though NGF Consulting has outlined the daunting situation facing the San Francisco municipal golf system, we have also illustrated in the body of this report that there are solutions if the City has the foresight and political will to seek them. We have made a series of recommendations in this report for the physical rehabilitation of the golf courses, which NGF Consulting feels is an absolute necessity in order for any solution to work. We have also made other general system-wide recommendations for continued operations. These are all detailed in the body of this report. However, the most important of our recommendations regards the future operation and stewardship of the City’s golf assets.
Continue As Is NGF Consulting has presented a detailed overview of the various alternatives the City should consider for the future operation of the golf system. These options include continuing with the status quo – growing losses subsidized by the General Fund, continued deterioration of the golf courses – or even closing one or more golf courses. Continued operation by City was quickly dismissed, due to the reasons cited earlier – lack of expertise, ever increasing expenses, political influence interfering with best business practices. In doing our financial modeling, we found that, even under the best case scenario, maintaining the status quo with the City overseeing the golf operation and performing the maintenance, operating losses continued to mount ($3 million by 2012), meaning higher subsidies and still no money left to be put into needed improvements, resulting in further deterioration of the assets.
Close Course(s) NGF Consulting was hired because of its vast experience and expertise in helping municipal golf systems improve their economic performance. The goal of the study was to identify the most viable option for the continued operations of the City’s golf courses. As such, analyzing the potential costs and benefits of potentially closing one or more courses was beyond the scope of this study. For the City to consider this option, it would obviously have to do much further study, identifying both its goals with respect to offering affordable golf to its residents, as well the expenses, revenues, and various other costs and benefits that would be eliminated with the closure of golf courses.

National Golf Foundation Consulting, Inc. – City of San Francisco, California – 8
NGF Consulting Management Recommendation Several other alternatives for continued operations are discussed at length in this report. However, based on the goals of continuing to offer affordable quality golf to residents, ridding the City of the current financial burden, and ensuring stewardship of the golf course assets into the future, NGF Consulting recommends that the golf system seek effective management expertise in order to rehabilitate the assets and ultimately make the system profitable once again. As we detail in the report, NGF Consulting believes that utilizing the non-profit tax-exempt 501(c)3 framework provides the best chance for the golf courses get the expert and efficient management and care that they require.
Of course, there are many details that will have to be worked out between the City and the new not-for-profit corporation. The basic framework, as we envision it, is:
• City leases, or even deeds, the golf courses to the 501(c)3 non-profit corporation (the “Corporation”). A long-term lease of 30+ years is recommended. Language is put into the lease regarding required capital improvements (and who owns them), maintenance standards (and how they are enforced), and green fee guidelines for residents, indexed somehow to market conditions.
• The Corporation is overseen by a volunteer Board of Directors, and the only managerial position is an Executive Director.
• Of the five golf facilities we recommend that Harding/Fleming, Sharp Park, and Lincoln Park be packaged together, and an RFQ (request for qualification and interest) be issued by the Corporation to solicit potential interest for the management, maintenance, and master planning (creation and implementation of short- and long-term capital improvement plan) of these three facilities. Of course, current operators will be encouraged to express their interest. Gleneagles will remain a ground lease to be absorbed by the new 501 (c)3.
• As we saw with the City of San Leandro, where American Golf Corporation invested more than $8 million of its own money in Monarch Bay, as well as with Oakland (language in their RFQ notes at least a $3 million investment required of interested parties) and New York City (AGC, again, has spent multiple millions of dollars because they know the golf facilities will throw off considerable positive cash flow), it is not unreasonable to expect a management entity to invest considerable money in needed capital improvements. Language in the initial RFQ should clearly spell out the expected requirements of the bidder with regard to capital investment.
• Based on our projections for these facilities, assuming our recommendations are enacted, we foresee considerable interest in operating these facilities if they fall under the Corporation umbrella. The ultimate operating structure should be with one operator for all three facilities, working under a sub-lease to the 501(c)3.
• Golden Gate should be handled differently within the Corporation. Due to the nature of the facility and the clientele it serves (the junior/beginner market), we believe the facility should not necessarily be managed/operated by the ultimate entity that manages Harding, Lincoln, and Sharp.

National Golf Foundation Consulting, Inc. – City of San Francisco, California – 9
• Because of the substantial capital improvements that are needed to make any solution plausible, the likely need to fund short-term operating losses while the courses are being improved and the transition is taking place, and the Corporation taking on the substantial debt owed to Open Space, it is essential that the City put no undue burden on the Corporation in the lease agreement. NGF Consulting believes that a nominal payment of $1 per course would not be an unreasonable agreement, as the City will be rid of the burden of its operating losses. In our model, we have also assumed that the revenue from resident ID cards, which is upwards of $300,000, will remain with the City, with little associated expense.
Funding Options for Improvements and Working Capital Perhaps the biggest issue to be dealt with should the City golf courses be turned over to the Corporation is the bridge funding for operations and the debt service payment, and the mechanism by which the needed capital improvements are to be paid for. This will not be an issue once the ultimate operator is in place. In the interim, an agreement must be worked out between the City and the Corporation as to how operations are to be funded during the transition period.
One thing that would help immensely would be a change in the repayment terms on the Open Space debt. Perhaps the annual payment could be deferred until the Corporation begins turning an operating profit. Another option for short-term operations and capital improvement financing is a loan from the General Fund to the Corporation. Of course, any funding scenario is expected to include some component of private donations and, at least as far as capital improvements are concerned, contributions from the ultimate manager of the properties. A creative example of raising private funds comes from the City of Houston, where private sector contributions in the amount of $1.2 million took the form of sponsorships for elegant granite hole markers that were placed at each hole of Memorial Park. The contributions went toward Memorial’s renovation in the mid 1990s.
Business Model Of course, for this model to work, the City must be content to rid itself of the financial burden, take a nominal payment in return, and allow people with knowledge and expertise to manage the golf system without political interference. The new Corporation must be free to enact best business practices while stewarding these assets for San Francisco residents. The basic business model for returning the system to financial health under a 501(c)3 is:
• Golf course assets are rehabilitated; moderately higher resident rates enacted (golfer survey overwhelmingly indicated resident golfers’ willingness to pay higher fees in exchange for better conditions).
• With other courses joining Harding as high quality venues, cooperative marketing campaign between City, Corporation, and Convention & Visitors Bureau begins (see below).
• With higher quality courses and effective marketing, much higher non-resident rates will be sustainable at Lincoln Park and Sharp Park.
• Higher fee non-resident rounds increase, essentially subsidizing the continued affordable rates for residents. Deficits ultimately turn into surpluses, allowing more

National Golf Foundation Consulting, Inc. – City of San Francisco, California – 10
money to be invested in the golf courses ensuring that they maintain higher quality levels.
REVENUE ENHANCEMENT OPPORTUNITIES Of course, no business model will work, short of unlimited subsidy, if the system is incapable of generating positive cash flow that can be returned back into the system for necessary upkeep and improvements. NGF has made financial projections for each golf course as well as the entire four-course system (excluding Gleneagles), assuming the 501(c)3 framework and the other recommendations made in this report. The justifications for the projections are listed below, and assume NGF Consulting recommendations are enacted:
• Potential high quality of the City’s golf assets once renovated.
• The city/peninsula is somewhat of an insular market, with few local golf courses (especially given that the state of some of the City courses) to service the dense population. NGF research confirms that the city has a higher-than-average number of households available to support each 18 holes of golf in the City, and the City is a large net exporter of rounds played to outlying areas such as the East, South, and North Bays. Improving the golf course will allow them to capture back market share, especially among S.F. residents.
• San Francisco golfers, as confirmed by the golfer survey results, are very passionate about the City’s golf courses. Respondents generally rated the subject facilities below average on key business drivers compared to national benchmarks established for public-access golf courses. It is NGF’s conclusion that many of these passionate customers would return to the City courses, or play more frequently, if they were better managed and in better condition.
• The golfer survey results also indicate, overwhelmingly, that residents would be willing to pay moderately higher green fees in exchange for better course conditions at Lincoln and Sharp.
• The golf courses, with the exception of Harding Park, are all currently operating at much less than capacity, and at much lower levels than the regional average for municipal golf courses. Additionally, they have all shown the potential in the recent past to achieve much higher activity levels.
• In addition to increased rounds that will result if the courses are improved as recommended in this study, the Corporation can re-position Lincoln and Sharp to significantly higher price points for non-residents, especially out-of-state tourists who are typically not price sensitive. The seeming inelasticity of Harding Park’s demand since the September 1, 2006 price increases is encouraging in this respect.
• In addition to the City and Bay Area resident populations, the municipal golf system has an enormous untapped supplemental market from which to draw play – San Francisco’s 15+ million annual tourists. NGF Consulting believes that this market shows enormous potential, once the maintenance conditions of the courses, especially Lincoln and Sharp, are improved. There seemingly has been no organized effort on anyone’s part to tap this market. Even if San Francisco cannot successfully

National Golf Foundation Consulting, Inc. – City of San Francisco, California – 11
be branded as a “golf destination”, tourists and business travelers will play the courses much more frequently when they are here
• In 2005, the San Francisco Convention & Visitors Bureau booked more than 2 million confirmed group room nights for future years. A direct selling effort to hotels for tournaments, as well as a cooperative marketing effort between the Corporation, the City, and the C&VB should be very successful in drawing high fee visitor rounds.
Enhanced Marketing In order for the golf system to succeed, direct selling must be accompanied by an organized marketing campaign centering on the quality of the golf courses, and must leverage and build upon the brand equity created at Harding Park due to its reformation, and its affiliation with the PGA TOUR. A marketing campaign should be a cooperative effort with the Convention & Visitors Bureau, and may focus on branding San Francisco as a golf destination. Even if the city is never truly thought of in those terms (it has so many other attributes attractive to visitors), these marketing efforts should succeed in creating awareness of the golf courses and getting golfers who are visiting anyway to play golf while they are there.
A second prong of the marketing campaign should be more oriented towards local golfers who may have given up on the City courses. “Under new ownership” is a marketing theme that often has little meaning, and gains little traction with consumers. However, because poor course conditioning and other negative factors that are key business drivers have driven golfers away from the City courses, marketing that emphasizes how the courses have been improved should be highly effective (“try us again for the first time”). Along these lines, a month-long “Grand Re-opening” event, featuring special promotions and tournaments, will build good will and awareness in the market and give the municipal golf courses a leg up on recovering market share.
Though the rehabilitation of Sharp Park and Lincoln Park are seen as necessary and critical to such a marketing push, NGFC has concluded that it is equally important that the relationship with the PGA TOUR be sustained, both for marketing purposes and so that the lucrative non-resident rates at Harding Park remain sustainable. In order to ensure this, the City/manager must be certain to maintain Harding Park to the standards required of the master agreement between the two parties. Issues covered in this report, such as the potential for increased problems with kikuyugrass, must be addressed.
Additionally, because of several factors, not the least of which is the $24 million that was spent renovating the golf course, it is essential that the City (or Corporation) ensures that the Superintendent (or Gardening Supervisor in San Francisco nomenclature) at Harding Park have the proper credentials, knowledge, and experience required to oversee a property of this quality. If this is not ensured, not only is the value of the asset compromised, but also the future relationship with the PGA TOUR is at risk. Losing this relationship could very well have reverberations throughout the system, in terms of the sustainability of the high rates at Harding, as well as the brand equity associated with the facility, which will be key to future marketing efforts.
NGF Financial Projections The results of NGF Consulting’s cash flow model for the municipal golf system under direction of the 501(c)3, assuming our recommendations are enacted, show the improved golf facilities with enhanced marketing and more efficient maintenance are capable of growing total revenues

National Golf Foundation Consulting, Inc. – City of San Francisco, California – 12
to $15 million with only slight increases in rounds activity and modest (40% three years after renovation) increases in average revenue per round. Additionally, modest savings (25%) in overall system expenses combined with more efficiency in operations should allow the whole five-course system to reach a profitability level of over $2.2 million within three years of 501(c)3 management. This level of surplus would be sufficient for the new 501(c)3 to take over the repayment to Open Space AND allow for excess revenues to be set aside for future capital improvements that will eventually become necessary.
SUMMARY STATEMENT In summary, NGF Consulting’s inspection of the City of San Francisco municipal golf courses, and our review of the golf system, has revealed an impressive portfolio of beautiful golf course assets that have been neglected and have fallen into disrepair. For a variety of reasons enumerated in this report, the golf system now suffers from large operating deficits, and ever-deteriorating assets, with the exception of the flagship Harding Park Golf Course.
However, we have also concluded that the system is salvageable, mainly due to the high quality and potential of these golf courses, which was cited by nearly every golfer and golf industry professional we came in contact with during the course of this study. In order for the assets to be rehabilitated and the system to return to profitability, the golf courses must be managed by people who have the experience and expertise to do so, free of political interference. We believe that the 501(c)3 organization provides the best means of achieving this goal. The non-profit organization will ensure that best business practices are implemented and followed, and that the golf courses will once again offer affordable quality golf for the residents of San Francisco. The Corporation will also be much better equipped to perform the stewardship role for these assets, assuring that they never again fall into the state of disrepair they are now in. However, in order for this to happen, the City must have the political will and foresight, as well as the desire, to preserve these urban jewels, which someday should again reflect well on this proud city.

National Golf Foundation Consulting, Inc. – City of San Francisco, California – 13
Market Environment In this section of the report, NGF Consulting will provide a summary of important factors that characterize the trade area in which the City of San Francisco golf courses operate. This overview will include an investigation of basic demographic and economic variables and an overview of the golf market. We will then provide a summary of these factors and how they relate to the continued operation of the City’s golf facilities.
MARKET AREA OVERVIEW Utilizing research materials provided by Applied Geographic Solutions, Inc. (a supplier of demographic research based on U.S. Census results), NGF Consulting has examined relevant characteristics of the local population. In the following table, NGF Consulting indicates the population, median age, and median household income trends for the overall San Francisco market (MSA) and each facility’s sub market (3-mile radius), plus the State of California and the total United States. More detailed demographics are provided in the tables of Appendix A.
Demographics Summary
Gleneagles Harding Lincoln G. Gate Sharp
San Francisco
MSA California U.S. Summary Demographics Population 1990 308,227 196,108 216,242 175,217 83,304 1,603,685 29,759,153 248,709,429 Population 2000 341,404 213,818 223,445 182,516 85,193 1,731,183 33,871,640 281,421,211 CAGR 1990-2000 1.03% 0.87% 0.33% 0.41% 0.22% 0.77% 1.30% 1.24% Population 2006 Estimate 321,118 199,203 206,597 168,119 83,054 1,673,939 36,861,522 296,459,203 CAGR 2000-2006 -1.22% -1.41% -1.56% -1.63% -0.51% -0.67% 1.71% 1.05% Population 2011 Projected 305,261 188,114 193,853 157,253 81,233 1,626,409 39,243,835 310,728,811 CAGR 2006-2011 -1.01% -1.14% -1.27% -1.33% -0.44% -0.57% 1.26% 0.94% Median HH Inc $69,765 $72,899 $73,607 $71,864 $83,618 $72,849 $54,444 $46,615 Median Age 39.6 41.6 40.9 41.9 39.9 40.6 34.6 36.3 Source: NGF Consulting 2006.
From the data collected for this study, NGF Consulting has made the following observations regarding the demographics of San Francisco and surrounding areas:
• The population bases in the subject markets are relatively dense, with 2006 estimates of between 175,000 (Golden Gate) and 308,000 (Gleneagles) people living within 3 miles of each San Francisco City golf facility. There are fewer people living within 3 miles of Sharp Park, located in Pacifica. The population of the San Francisco MSA has been declining moderately, losing about 57,000 residents between 2000 and 2006. This pattern is expected to continue through 2011. The implication for continued operation of public golf courses in the market is that the large and dense local populations surrounding each facility should help to maintain golf demand for the foreseeable future.

National Golf Foundation Consulting, Inc. – City of San Francisco, California – 14
• The Median Age in the subject market area is significantly higher than the national median age of 36.3 years and the State of California median age of 34.6 years. In general, the propensity to play golf with greater frequency increases with age, making relatively older markets more attractive to golf facility operators, all other factors being equal.
• Median Household Incomes in the San Francisco area are much higher than the national and California medians, indicating a higher proportion of upper-income residents. In general, higher income residents are more likely to participate in golf, and they play more frequently than lower income residents. This effect is mitigated somewhat in the Bay Area, due to the extremely high cost of living.
Economic Overview In addition to identifying demographic trends and characteristics of the area, we have examined certain economic indicators and other mitigating factors that have the potential to affect the performance of the City of San Francisco’s golf courses. Below are some key observations highlighting the City’s demographics, education, economic development and quality of life. All of these findings are generally viewed as positive for continued operations of municipal golf courses in San Francisco.
General Occupying just 47 square miles of land, the combined city, county, and port of San Francisco is located on a peninsula between the Pacific Ocean and San Francisco Bay. The county’s current population is close to 800,000, according to California’s Department of Finance. Despite its small physical size, San Francisco ranks as the eleventh most-populous county in the state.
Fast Facts • The region is the birthplace and worldwide center of high technology, and acclaimed
as the incubator of biotechnology (thanks to the talent at the University of California, San Francisco). The Bay Area has more pioneering high-tech and bio-tech firms than any other region, including Dolby Labs (audio), Salesforce.com (customer relationship software), Industrial Light and Magic (Entertainment), and Genentech (bioscience), to name just a few. Other high-tech highlights for the area:
78.8% of households on-line –Yahoo’s “Most Wired City in America. Also ranked 2nd most "unwired" city by Intel in 2005.
Largest Share of high-tech exports. Largest aggregation of research universities and federal research institutions.
Top 10 cities for high-speed connections. Area Universities produce more PhD. scientists & engineers (850) than any other area in U.S. Proximity to Silicon Valley and biotech bay.
• Despite the strength of high technology in the region, an industry downturn in the early 2000s led to much job displacement, which certainly had an affect on activity levels at area golf courses.
• San Francisco Convention & Visitors Bureau - In 2005, the Bureau booked more than 2 million confirmed group room nights for future years. Average occupancy for

National Golf Foundation Consulting, Inc. – City of San Francisco, California – 15
the year was at 76 percent at an average room rate of $153 and the city welcomed 15.7 million visitors who spent $7.3 billion in the city.
• San Francisco features the 11th largest airport in the U.S. and 21st largest in the world, with more than 2,000 daily arrivals and 50+ airlines served.
• In 2005, San Francisco’s labor force declined by 1,800, to total 420,500. The county’s 2005 unemployment rate (5.1 percent) was 0.9 percentage point lower than the 2004 rate, and significantly lower than the high of 7 percent recorded in 2002.
• In 2005, after four years of consecutive loss, industry employment in San Francisco gained 6,300 jobs to total 509,100. During the profiled years (2001-2005), two industries posted cumulative growth - educational and health services, and government.
• The Bay Area has a very high cost of living, and this is especially true with respect to housing. Despite a housing market that has cooled off, the median price of a house in San Francisco is an extremely high $760,000.
• San Francisco’s generally mild weather makes it a year-round golf market, with average temperatures in the 60s, and average annual rainfall of only 22 inches.
GOLF MARKET OVERVIEW NGF Consulting uses actual data from competing golf facilities to provide documentation of the local golf economy. NGF Consulting also utilizes predictive models as benchmarks for estimating potential market strength. The methodology for determining the relative strength of the subject market is described in the following section and associated appendices.
National Trends in Golf Demand and Supply Golf participation in the U.S. has grown from 3.5% of the population in the early 1960s to about 12.6% of the population today. NGF estimates that 36 million golfers reside in the U.S., with growth slowed to about 1.0% per year. Other surveys completed outside the golf industry show the number of people who “identify themselves as golfers” is as high as 45 million, indicating a large potential “latent” demand from very inactive golfers.
As rapidly as the demand for golf has grown, the supply has grown even faster, with an average increase of about 2.1% per year. With the increase in supply, we are seeing a marked increase in competition, and the supply is greater than the demand in some markets.
In addition to increased competition, four other factors have contributed to a decline in the number of rounds per course during the 2002 to 2005 period. These include: 1) an uneven economy; 2) the aftereffects of 9-11, which greatly reduced the traveling golfer market; 3) the increasing time pressure on individuals and families; and 4) abnormally poor weather conditions over the past few years in much of the U.S., including the Bay Area. The combination of these factors has caused many golf facilities to become distressed, particularly those that have a high debt load because of higher construction costs and the perceived need to build high-end courses. The level of golf course closings has quadrupled from an annual average of 24 courses per year in 1993 – 2001 to 48 courses in 2002-03, 63 courses in 2004 and more than 100 courses in 2005 (and projected for 2006).

National Golf Foundation Consulting, Inc. – City of San Francisco, California – 16
In terms of the total number of rounds produced, NGF estimates that rounds fell about 1.5% in 2003, after a 3% drop in 2002. End-year NGF research indicates a rebound of about 0.7 percent in 2004, and a very slight decline of 0.1% in 2005. The Pacific-Coast Region, which includes California, saw rounds decrease by about 1.5 percent in 2006, after a comparable decline from 2004 to 2005.
On the positive side, the growth in golf course development has slowed considerably nationally and in the majority of local markets, a trend that should help ease some of the competitive pressure. Another positive trend is the aging of America. Baby boomers are rapidly approaching retirement age when golf activity flourishes. The baby boomers represent not only the largest single demographic in the US, but they also approach retirement age with more disposable income than any previous generation.
National Trends in Municipal Golf Municipalities were largely responsible for helping bring golf to the masses by creating affordable golf courses for their citizens. The role of municipal golf has changed dramatically over the past 30 years, with fewer municipalities viewing golf in the same vein as other recreational opportunities offered – simply an amenity for its citizens. Still, many municipalities remain that are willing to subsidize municipal golf. Though these municipalities certainly prefer to earn a profit, they recognize the value of offering affordable golf to their residents with respect to quality of life and even longevity, due to health benefits.
Nearly all municipalities that own golf courses offer highly discounted, or even free, green fees and programs for juniors; many also do so for lower-income and/or at-risk youth. Though there may be no short-term financial benefit in doing this, the intangible benefits are obvious, as programs such as this have proven to help troubled kids by providing them with a healthy outlet that can become a lifelong interest or even passion. Additionally, there is likely to be long-term financial benefit to the City, as players are being cultivated as potential future customers.
One example of a formally organized youth golf program is The First Tee, whose main goal is to offer a venue for introducing people - primarily children - to the game of golf in an affordable, non-intimidating setting. The First Tee, an initiative of the World Golf Foundation, states as its mission: “To impact the lives of young people by providing learning facilities and educational programs that promote character-development and life-enhancing values through the game of golf”. San Francisco currently has an active youth golf program at Golden Gate Park, as well as through its First Tee Program at Harding Park.
Still, several factors have changed over the last few decades that have, at least temporarily, altered the golf course market and the role of the municipally owned golf course. The main factors are:
Increased Competition: In the last two decades the supply of public golf courses has increased dramatically, thus eliminating the near-monopoly on public golf that municipalities used to have. Now municipal courses are finding themselves competing head-to-head with private enterprises.
Growth in Golf: In 1950, there were an estimated 3.5 million golfers. By 1998, this had grown to over 26.4 million – a growth of 654%. However, since 1998 growth in golf activity has all but stopped but growth in the number of facilities has continued leading to saturation in many markets. Today, municipalities are finding that they are not only competing head-to-head with private enterprises, but that they are doing so in an increasingly competitive market.

National Golf Foundation Consulting, Inc. – City of San Francisco, California – 17
Unfortunately, few municipalities find they are equipped to handle this type of competitive environment.
There are several factors that typically inhibit municipalities in their ability to compete successfully with private enterprise. These include:
1. Slow response: By nature of the bureaucracy that is typically involved in making decisions, government-owned business are typically very slow to respond to market conditions – such as rates, promotions, etc.
2. Budget Constraints: Often budgetary problems in other departments can have an adverse affect on golf operations.
3. Personnel Policies: One of the most glaring areas separating municipal governments from private enterprise is in relation to personnel policies and costs. This is particularly true with regards to:
Benefits: Municipalities typically offer very rich benefit packages – far superior to what is normally the case within the golf industry. This results in the municipality paying far more for labor than competing private facilities.
Termination: With most private enterprises, if an employee is not productive, they are terminated – and often quickly. With governments, however, it can be extremely difficult to get unproductive employees terminated.
Marketing: Most municipalities lack marketing expertise that is critical to succeeding in a competitive business.
Procurement: When large items, especially capital improvements, are needed, municipalities are often constrained with lengthy procedures and mandated policies that slow the process down and can lead to situations where the best product or contractor is not selected. Another issue regarding procurement is getting funding, which can often take months longer than in private industry.
Incentive: With most municipal golf operations where all the employees are employees of the municipality, there are little or no incentives given to the managers for superior performance. As a result, municipal golf managers often earn the same secure income regardless of how successful the facility may be.
In summary, municipal golf facilities face considerable challenges to survive in the modern golf industry, and the City of San Francisco is facing many of these same issues, as we will identify throughout the text of this report.
Public Golf Operational Norms For comparison purposes to Harding Park, we present a review of 2005 actual results from premium public golf facilities in a year-round operating climate (defined as “Sunbelt”), and detailed in the National Golf Foundation’s publication, Operating & Financial Performance Profiles of 18-hole Golf Facilities in the U.S. shows the following. We note that Harding Park, even when adjusting for the fact that it is 27 holes, is much higher on rounds played, total revenues, and total expenses, but lags behind on total revenue per round.

National Golf Foundation Consulting, Inc. – City of San Francisco, California – 18
Public Premium Sunbelt Revenues
2005 2004 % change Green fees, cart fees and member/passholder revenue $1,872,270 $1,824,540 2.6% All other golf revenue $210,760 $210,130 0.3% F&B revenue (incl. banquets) $620,750 $583,430 6.4% Merchandise revenue $276,240 $264,170 4.6% All other operating revenue $120,270 $93,530 28.6% Total Revenue $3,100,290 $2,975,810 4.2%
Source: Operating & Financial Performance Profiles of 18-Hole Golf Facilities in the U.S., 2006 edition, National Golf Foundation
Public Premium Sunbelt Expenses
2005 2004 % change Total maintenance costs $825,640 $820,640 0.6% Golf car fleet costs $57,040 $51,300 11.2% COGS F&B $189,750 $189,250 0.3% COGS merchandise $189,000 $187,760 0.7% Other expenses $1,167,480 $1,129,710 3.3% Total Expenses $2,428,910 $2,378,670 2.1%
Notes: ”Total maintenance costs” includes payroll. ”Other expenses” is a large category because it includes all non-maintenance payroll and all other operating expenses. Source: Operating & Financial Performance Profiles of 18-Hole Golf Facilities in the U.S., 2006 edition,National Golf Foundation

National Golf Foundation Consulting, Inc. – City of San Francisco, California – 19
Public Premium Sunbelt Rounds
2005 2004 % change Average rounds 38,440 38,100 0.9%
Source: Operating & Financial Performance Profiles of 18-Hole Golf Facilities in the U.S., 2006 edition, National Golf Foundation
Rounds Budget for 2006 vs. Past
Public Premium Sunbelt Total Revenue Per Round
2005 2004 % change Average $80.65 $78.11 3.3% Range of values 2005: Below $25.00 23% $25.00-$35.00 29% $35.01-$45.00 23% Above $45.00 25% 100%
Source: Operating & Financial Performance Profiles of 18-Hole Golf Facilities in the U.S., 2006 edition, National Golf Foundation

National Golf Foundation Consulting, Inc. – City of San Francisco, California – 20
Public Premium Sunbelt Golf Revenue Per Round*
2005 2004 % change Average $54.19 $53.40 1.5% Range of values 2005: Below $20.00 35% $20.00-$25.00 19% $25.01-$30.00 25% Above $30.00 21% 100%
* Golf revenue is the sum of member dues/passholder revenues, regular green fee and car revenues, and all other golf revenues (range, etc.) Source: Operating & Financial Performance Profiles of 18-Hole Golf Facilities in the U.S., 2006 edition, National Golf Foundation
Public Premium Sunbelt F&B Revenue Per Round
(non-concessionaire) 2005 2004 % change Average $14.16 $13.54 4.6% Range of values 2005: Below $14.00 67% $14.00 and above 33% 100%
Source: Operating & Financial Performance Profiles of 18-Hole Golf Facilities in the U.S., 2006 edition, National Golf Foundation
Public Premium Sunbelt Merchandise Revenue Per Round
(concessionaire) 2005 2004 % change Average $7.19 $6.93 3.8% Range of values 2005: Below $7.00 61% $7.00 and above 39% 100%
Source: Operating & Financial Performance Profiles of 18-Hole Golf Facilities in the U.S., 2006 edition, National Golf Foundation

National Golf Foundation Consulting, Inc. – City of San Francisco, California – 21
Estimated San Francisco Area Golf Demand 2006-2011 A detailed demand analysis appears in Appendix B to this report. In this section, NGF Consulting will summarize the golf demand potential in this market area and how this demand will impact the City of San Francisco municipal golf operations.
The San Francisco market area is part of the San Francisco – Oakland – San Jose, California DMA (Designated Market Area). The tables below illustrates how this key California DMA ranks in relation to the other 209 DMAs nationwide on some key golf demand and supply measures.
San Francisco – Oakland – San Jose DMA
Characteristic Rank (of 210 DMAs) Predicted Household Participation Rate 73 of 210 Predicted Golfing Households 7 of 210 Predicted Golf Rounds Demanded 6 of 210 Total Number of Facilities 26 of 210 Public Facilities T30 of 210 Private Facilities T17 of 210 Premium Facilities 12 of 210 Standard Facilities 22 of 210 Value Facilities T94 of 210
San Francisco – Oakland – San Jose DMA
DMA Golf Demand Rankings Predicted Household Participation Rate 19% Rank (of 210 DMAs) 73 Predicted Number of Golfing Households 470,282 Rank (of 210 DMAs) 7 Predicted Number of Rounds Demanded - 2004 9,728,212 Rank (of 210 DMAs) 6
The above shows how the region is one of the top ten golf markets in the U.S. in terms of golfers and potential rounds demanded. The total number of facilities ranks in the top 12%, including a 12th place ranking for the number of premium (highest fee) courses and a tie for 94th place in number of value (lowest fee) facilities. In all, the approximately 470,000 permanent resident golfing households are expected to produce roughly 9.7 million rounds of golf annually, or about 21 rounds per golfing household per year.
While the San Francisco DMA is among the largest golf markets in the United States in terms of total demand, actual golf participation rates, and particularly rounds demanded per household, are low relative to national benchmarks. However, due to the sheer size of the population, estimated rounds demanded in the market is a very large number. Additionally, as we will see, the corresponding supply to service this demand, relative to national benchmarks, is extremely low – a positive for existing golf facility operators.
Predicted Golf Demand The population in the San Francisco area tends to show less-than-average golf participation characteristics. The indices presented below show that households in each of the San

National Golf Foundation Consulting, Inc. – City of San Francisco, California – 22
Francisco golf courses’ sub-market are 6 to 13 percent less likely to contain golfers (index=87 to 94), and these golfers tend to demand 44 to 55 percent fewer (Index=45 to 56) rounds per golfer per year as the overall U.S., which includes sun belt and other year-round golf markets. The one exception to this is the market around Sharp Park, which shows higher than average participation and rounds frequency.
Predicted Golf Demand 2006
SITE 3-Miles
Gleneagles 3-Miles
Harding 3-Miles Lincoln
3-Miles G. Gate
3-Miles Sharp
San Francisco
DMA California U.S. Golf Demand Indicators # of Golfing Households 17,340 10,628 14,672 10,751 5,374 469,829 2,070,750 20,392,712 Number of Rounds Played 228,411 166,260 169,768 134,081 116,456 9,718,832 45,929,544 495,441,760 Golfing Household Index 88 87 94 88 114 105 92 100 Rounds Played Index 48 56 45 45 102 90 84 100 Source: NGF Consulting 2006.
Corporate Market Demand The San Francisco area is home to a large number of major corporate and public employers. Although potential corporate demand for public golf rounds and/or memberships is difficult to quantify, it is clear that the operators of the City’s municipal golf courses should target this market by emphasizing the ease of access from all areas of the City. This corporate /organizational tournament play can augment the daily fee rounds expected from the primary resident markets, especially during off peak periods. Some corporations may also want to pre-pay for certain blocks of times, in order to offer perks to employees or to entertain clients.
Visitor Golf Demand As noted previously, about 16 million people visited San Francisco in 2005. These visitors have the potential to have a significant impact on demand at area golf courses. NGF research shows that roughly one-third of all golfers participate in the activity while traveling, playing .557 rounds per day of travel. To illustrate the potential demand from visitors, we have used a very conservative estimate of 10,000,000 visitors (rather than the reported 16 million) annually to craft the estimate for tourist demand below.
Area Visitors 2005
Estimated Visitors to San Francisco 10,000,000
X Estimated National Golf Participation Rate 12.6%
= Estimated Visiting Golfers to San Francisco 1,260,000
Estimated Golf Frequency Rate (Traveling Golfers) .557 Rounds/trip
Estimated Potential Visitor Rounds Demanded 701,820
As we can see, even using very conservative estimates for annual visitors, the potential demand for golf from San Francisco area tourists is more than 700,000 rounds annually. These visiting

National Golf Foundation Consulting, Inc. – City of San Francisco, California – 23
golfers could be especially important for a high-end golf courses such as Harding Park, or even Lincoln Park and Sharp Park (if improved), as traveling golfers often exhibit high incomes and are typically much less price sensitive than resident golfers.
San Francisco Area Golf Supply Inventory The subject San Francisco City golf courses are part of a MSA golf market that includes 26 total golf facilities comprising 488 holes of golf. In each 3-mile sub-market we can see there are a limited number of golf courses, with the Harding Park and Lincoln Park sub-markets having the most competition (2 other courses each). Of the 26 golf courses in the San Francisco MSA, 10 are private clubs and 16 are public access golf courses.
Golf Facility Supply 2006
SITE 3-Miles
Gleneagles 3-Miles
Harding 3-Miles Lincoln
3-Miles
G. Gate
3-Miles
Sharp
San Francisco
MSA California U.S. Golf Supply Summary Total Golf Facilities 1 3 3 2 1 26 925 16,057 Public Golf Facilities 1 1 3 2 1 16 628 11,702 Private Golf Facilities 0 2 0 0 0 10 297 4,355 Total Golf Holes 9 63 45 27 18 488 16,344 270,207 Public Golf Holes 9 27 45 27 18 270 10,683 191,979 Private Golf Holes 0 36 0 0 0 218 5,661 78,228
Source: NGF Consulting 2006
Household/Supply Ratios Utilizing this data in conjunction with the demographics presented earlier, we note the following comparison of golf facility supply to the number of households available in the market to support each facility. This “Household/Supply Ratio” estimates the relative supply of a market for comparison to other U.S. locations. The Household/Supply Ratio is derived by dividing the total number of households by the number of 18-hole equivalent golf courses. Household/Supply indices are derived from these ratios, and then compared with the base national figure of 100.
As the table below indicates, the immediate local San Francisco market area appears to be undersupplied with golf relative to the U.S. benchmark of 7,477 homes to support each 18 holes of golf. For instance, in the San Francisco MSA there are more than three times (Index=309) as many households available to support each 18 holes of golf than we observe nationally. The undersupply is even more notable in the public segment of the San Francisco MSA, and in some of the local 3-mile sub-markets. NGF research indicates that the City/County is, by a wide margin, a net exporter of rounds played to surrounding areas; the relative undersupply of golf courses in the City/County, as well as the poor condition of the City courses, are two of the primary reasons for this.

National Golf Foundation Consulting, Inc. – City of San Francisco, California – 24
Household/Supply Ratios 2006
SITE 3-Miles
Gleneagles 3-Miles
Harding 3-Miles Lincoln
3-Miles
G. Gate
3-Miles
Sharp
San Francisco
MSA California U.S. Households per 18 Holes: Total 212,790 18,935 33,770 43,911 25,416 22,669 13,428 7,343 Households per 18 Holes: Public 212,790 44,183 33,770 43,911 25,416 40,950 20,544 10,335 Households per 18 Holes: Private NA 33,137 NA NA NA 50,778 38,769 25,363 Households Supply Index: Total 2,898 258 460 598 346 309 183 100 Households Supply Index: Public 2,059 428 327 425 246 396 199 100 Households Supply Index: Private 0 131 0 0 0 200 153 100
Source: NGF Consulting 2006.
Recent Construction Activity Appendix C displays the recent golf construction activity on the local market. The rate of construction of new golf courses in the immediate local San Francisco area has been almost non-existent, with no new holes added in San Francisco County between 1995 and 2004. The situation is different in the broader San Francisco MSA market, where a total of 234 new golf holes (13 18-hole equivalents) were added to the market over that same time frame. These new golf courses represent an increase in public golf supply of more than 23.5 percent since 1995, compared with a 21 percent increase in the total U.S. public golf supply over that same period. It does appear that the situation has stabilized, as no new golf facilities are currently in the development pipeline for either San Francisco or San Mateo Counties.
New Golf Courses Proposed or Under Construction The NGF database reveals only two new golf course projects currently in planning in the Bay Area, neither of which is on the peninsula. Neither of these proposed courses, detailed below, is expected to have any significant impact on City of San Francisco golf operations.
Newark Golf Course Long-range plans are in progress for the development of this new golf community with advancement pending public hearings, rezoning and approvals. Construction start is to be announced. Included in the plans for this project are an 18-hole golf course and 10,000 square-foot clubhouse, driving range and an undetermined number of housing units.
Alameda Point Golf Course The EIR has been certified and negotiations are in progress for materials for this new golf resort community, which is still a long-term plan. No schedules for construction have been determined at this time. Included in this project are an 18-hole regulation golf course, an executive 9-hole course, 10,000 square-foot clubhouse, parks and a resort hotel. A total of 2,100 homes of various types are planned as well as a number of recreational amenities.
Golf Market Summary NGF consulting has made basic estimates of the demand for golf and documented the supply of facilities to service that demand. Plotting the results of the analysis on the NGF Opportunity Chart, we see that the market area generally falls into the “Inactive” golf market classification.

National Golf Foundation Consulting, Inc. – City of San Francisco, California – 25
This means that the local market area surrounding the City of San Francisco’s City golf courses has far more households available to support each 18-hole golf course in the community, relative to national benchmarks, but that these households tend to demand much lower than average rounds of golf. The implication for the City of San Francisco and its continued operation of its municipal golf courses is that growth in rounds at the individual facility level will have to come from increased participation among existing golfers, both resident and regional, or from tourist golfers. These statistics also emphasize the need for beginner facilities such as Golden Gate Park, as well as player development programs such as the First Tee.
Opportunity Chart
Opportunity Chart
-100
0
100
200
300
400
500
600
700
800
0 20 40 60 80 100 120 140 160 180 200
Rounds Demanded Index
Hou
seho
lds
Per 1
8-H
ole
Faci
lity
Inde
x
GleneaglesHardingLinco ln
Golden GateSharpSF CountySF M SASF DM ACalifornia
U.S.Inactive
Saturated Active
Opportunity
MARKET ENVIRONMENT SUMMARY San Francisco and the greater Bay Area benefit from a strong economy, driven largely by the high-tech industry and tourism. However, a downturn in the economy during the early 2000s, which resulted in corporate downsizing and relocations, seemed to have a significant effect on activity levels at area golf courses, which, in general, are currently operating at far below peak rounds played achieved in the late 1990s.
The demographic profile of San Francisco, in terms of median household income and median age, is predictive of high golf participation, according to NGF Demand Models. However, this is mitigated somewhat by the extremely high cost of living in the area. Household/supply ratios are also extremely favorable for golf operators located on the peninsula, as there are several times as many homes available to support each 18 holes of golf than there are nationally.
In general, the Bay Area is undersupplied with affordable public golf courses, and in the more urbanized areas such as San Francisco, demand is significantly supply constrained, especially given the current state of disrepair of some of the City’s golf courses. As a result, NGF research

National Golf Foundation Consulting, Inc. – City of San Francisco, California – 26
indicates that San Francisco and the northern half of San Mateo County are net exporters of golf rounds to peripheral areas such as the South, East, and North Bay areas.
NGF Consulting has also observed underserved corporate and hotel markets in San Francisco. Local corporations and other organizations are strong candidates for lucrative tournament play. However, due to both the poor conditioning and a lack of marketing emphasis, tournament play is a small percentage of total rounds at the City courses. Harding Park, as would be expected, does the most tournament business, at about 8% of total rounds.
There are also a reported 16 million annual visitors to San Francisco, and approximately 35,000 hotel rooms within the city. The visitor market has extremely good potential for the City golf courses, once all of them are in better condition and marketed properly. The courses located within the city would be at a competitive advantage for golfers staying in city hotels, if only due to proximity. This is especially true of business travelers, who may have time constraints. In summary, both the corporate and hotel/visitor markets will be prime candidates to tap for increased rounds played, if Sharp and Lincoln Parks are rehabilitated.

National Golf Foundation Consulting, Inc. – City of San Francisco, California – 27
Competitive Golf Market Two of the objectives of this study are to identify any opportunities that may exist for any or all of the City of San Francisco municipal golf facilities to increase market share and revenues, and to compare the subject golf courses to other local, regional, and national golf courses for the purpose of benchmarking fees, activity levels, and policies. In this section of the report, we profile the area municipal and daily fee market dynamics, and present an analysis of national premier municipal golf courses for the purpose of comparison to Harding Park. Finally, we present operating profiles for regional municipal golf systems.
GOLF MARKET DYNAMICS Local/Regional Municipal Golf Market Below is a map showing the locations of the regulation length municipal golf facilities profiled in this section. Summary operational information for these courses is contained in the tables that follow.

National Golf Foundation Consulting, Inc. – City of San Francisco, California – 28
Area Municipal Golf Courses
Club Type Par / Slope / Back Tee /
Forward Tee Municipality Year OpenStructure
(Operations/Mtce.)
Callippe Preserve Golf Course 18H-R 72 / 139 / 6,748 / 6024 City of Pleasanton 2005 Mgmt./Mgmt.
Chuck Corica Golf Complex 36H-R; 9H-P 71 / 119 / 6,586 / 5,708 City of Alameda 1927 City/City
Lake Chabot Golf Course 18H-R; 9H-P 72 / 123 / 6,102 / 5,234 City of Oakland 1923 See Text
Los Lagos Golf Course 18H-R 68 / N/A / 5,393 / 3,903 City of San Jose 2002 Mgmt./Mgmt.
Monarch Bay Golf Club 18H-R; 9H-E 71 / 128 / 7,015 / 5,140 City of San Leandro 1982 Lease/Lease
Palo Alto Municipal Golf Course 18H-R 72 / 118 / 6,820 / 6,227 City of Palo Alto 1956 Mgmt./City
Poplar Creek Golf Course 18H-R 70 / 113 / 6,042 / 4,768 City of San Mateo 1933 City/City
San Jose Municipal Golf Course 18H-R 72 / 119 / 6,700 / 4,200 City of San Jose 1968 Lease/Lease
Santa Clara Golf & Tennis Club 18H-R 72 / 118 / 6,704 / 5,492 City of Santa Clara 1987 Mgmt./Mgmt.
Shoreline Golf Links 18H-R 72 / 125/ 6,645 / 5,433 City of Mountain View 1983 City/City
Skywest Golf Course 18H-R 72 / 121 / 6,862 / 6,171 Hayward Area Rec & Park Dist. 1965 Muni/Muni
Sunnyvale Golf Course 18H-R 70 / 121 / 6,255 / 5,279 City of Sunnyvale 1969 City/City
KEY: R – Regulation P – Par 3 E – Executive Mgmt – Management Company N/A – Information not available

National Golf Foundation Consulting, Inc. – City of San Francisco, California – 29
Area Municipal Golf Courses – Summary Fee and Activity Levels
Golf Course Type
Total 2005
Rounds Recent Trend
18-Hole Non-Resident
Green Fee (WD/WE)
18-Hole Resident
Green Fee (WD/WE)
18-Hole N/R
Twilight Green Fee (WD/WE)1
18-Hole Senior
Green Fee (Res/NR)
Per Person 18-Hole Cart Fee
Area Municipal Golf Courses
Callippe Preserve Golf Course 18H-R 73,5142 DNA $42/$60 $36/$51 $26/$39 $26/$30 $13
Chuck Corica Golf Complex 36H-R, 9H-P 170,000* Down $30/$35 $23/$27 $23/$25 $18$/23 $14
Lake Chabot Golf Course 18H-R, 9H-P 43,329 Down $26/$37 $22/$30 $18/$30 $17/$17 $13
Los Lagos Golf Course 18H-R 70,000 Level $31/$45 DNA $22/$27 $20/$20 $14
Monarch Bay Golf Club 18H-R, 9H-E 114,000 N/A $35/$59 $27/$35 $19/$26 $27/$27 $13
Palo Alto Municipal Golf Course 18H-R 75,000 Down $35/$46 DNA $26/$30 $26/$31 $13
Poplar Creek Golf Course 18H-R 83,000 Down $35/$45 $28/$35 $24/$29 $23/DNA $13
San Jose Municipal Golf Course 18H-R 75,000* Down $34/$48 DNA $24/$30 $20/DNA $13
Santa Clara Golf & Tennis Club 18H-R 85,247 Down $33/$41 $20/$26 $24/$26 DNA $13
Shoreline Golf Links 18H-R 65,837 Down $38/$45/$54 $31/$38/$47 $25/$28 $28/$28 $11
Skywest Golf Course 18H-R 65,000 Down $29/$38 $25/$34 $19/$24 $18/$21 $14
Sunnyvale Golf Course 18H-R 85,000 Down $33/$43 DNA $24/$27 DNA $12.50
Market Average Rounds (per 18 holes)/Fees 69,305 $33.5/$46 $29/$39 $23/$28.5 $22.5/$24.5 $13
CHART KEY
1 Refers to early afternoon twilight; super-twilight rates are also the norm in market 2 For first 12 months open (December 2005 – November 2006)
E – Executive P – Par 3 *NGF Consulting Estimate N/A – Information not available DNA – Does not apply N/R – Non-resident Note: Where three rates listed, middle rate is Friday.

National Golf Foundation Consulting, Inc. – City of San Francisco, California – 30
City of San Francisco Regulation Length Municipal Golf Courses – Summary Fee and Activity Levels
Golf Course
Total FY 2005-06 Rounds
Recent Trend
18-Hole N/R Green
Fee (WD/WE)
18-Hole Resident1 Green Fee (WD/WE)
18-Hole N/R Twilight
Green Fee (WD/WE)
18-Hole Resident1 Twilight
Green Fee (WD/WE)
18-Hole Senior
Green Fee (WD/WE)
Per Person 18-Hole Cart Fee
Gleneagles Golf Course 34,851 N/A $20/$27 $20/$27 DNA DNA DNA $12
Harding Park Golf Course 60,4642 Down5 $135/$1553 $46/$59 $105/$1253 $35/$44 $31/$594 $13
Lincoln Park Golf Course 34,748 Down $32/$36 $20/$24 $19/$23 $19/$23 $12/$19 $13
Sharp Park Golf Course 35,195 Down $32/$36 $20/$24 $19/$23 $19/$23 $12/$19 $13
CHART KEY 1 City/County of San Francisco; northern California rates also available 2 Rounds are for 18-hole Championship course only 3 Fees include cart 4 Resident only 5 Hosted Amex in 2005
*NGF Consulting Estimate N/A – Information not available DNA – Does not apply N/R – Non-resident

National Golf Foundation Consulting, Inc. – City of San Francisco, California – 31
Significant Findings – Area Municipal Golf Market • The regional municipal golf courses we surveyed averaged just fewer than 70,000
rounds per 18 holes in 2005-06. For the overall municipal golf market, activity levels are down by about 30% since peaking (for most courses, in the late 1990s).
• Harding Park’s 60,464 rounds fall below the market average, which is not surprising given the much higher price points. When the Fleming course’s 41,502 rounds are added in, the overall facility falls just below the market average per 18 holes.
• Interestingly, both other City 18-hole courses, Lincoln and Sharp, are at about 50% of the average market activity levels, as is the 9-hole Gleneagles.
• The market average non-resident walking green fee was $33.50 on weekdays and $46 on weekends, with corresponding resident rates of $29 and $39, respectively. Average per person cart fee (shared cart) was $13. Resident rates at Sharp and Lincoln are considerably below market average, which is likely reflective of below average course conditions and support amenities at these two City courses as compared to the majority of municipal competitors. Non-resident weekend fees are also considerably lower than market at Sharp and Lincoln.
• As would be expected, Harding Park’s non-resident green fees, which are cart inclusive, are considerably higher than those at any other municipal course we surveyed. The next highest municipal fees are at the brand new Callippe Preserve, at $42/$60 for non-residents and $36/$51 for residents.
• All but four of the municipal courses surveyed – Los Lagos, Palo Alto, San Jose Municipal, and Sunnyvale - offer resident discounts.
• Fees at Gleneagles are in line with the only other 9-hole regulation length courses in the regional market – Diablo Hills, which is about 25 miles away in Walnut Creek, and Fremont Park, 28 miles away in Fremont.
• Chuck Corica, despite losing as many as 80,000 rounds off its peak activity of the 1990s, remains the most active overall facility in the market, though the most active courses per 18 holes are Santa Clara, Sunnyvale, and Poplar Creek.
• Los Lagos (San Jose) and Callippe Preserve (Pleasanton) are the newest entrants into the area municipal golf market, and both are high quality facilities that had immediate market impact. However, each has high associated debt service and Los Lagos has been unable to turn sufficient profit to service this debt. According to course operator CourseCo (which also manages Los Lagos), Callippe Preserve did an impressive 73,500 rounds in its first twelve months of operation, making the East Bay and South Bay golf markets even more competitive.
Daily Fee Market The greater Bay Area features a highly competitive daily fee golf market. Though most of these facilities are not considered direct competition for the City courses, interviews with these daily fee operators do indicate that they draw some play from San Francisco. Heightened competition has led to discounting of fees at some high quality courses, prompting some golfers who would

National Golf Foundation Consulting, Inc. – City of San Francisco, California – 32
normally play at generally lower fee municipal courses to occasionally travel to play “luxury” rounds. The table below contains a representative (though far from exhaustive) sampling of some area daily fee facilities, across different price points.
Golf Course Type Location
Estimated Annual Rounds Played
18-Hole Peak
Season Green Fee (WD/WE)
18-Hole Twilight
Green Fee (WD/WE)
Per Person
18-Hole Cart Fee
Off Season Discounting
(Yes/No) Regional Daily Fee Golf Courses (Regulation Length)
Adobe Creek Golf Course 18H-DF Petaluma 44,400 $36/$46/$561 $25/$28/$39 $14 No
Bridges GC at Gale Ranch 18H-DF San Ramon 40,000 $65/$85 $45/$60 Included Yes
Canyon Lakes Country Club 18H-DF San Ramon 35,000 $55/$65/$80 $27/$60 Included No
Cinnabar Hills Golf Club 27H-DF San Jose 50,000 $80/$100 $59/$79 Included Yes
Course at Wente Vineyards 18H-DF Livermore 40,000 $85/$105 $55/$65 Included Yes
Coyote Creek Golf Club 36H-DF Morgan Hill 60,000 $79/$86/$102 $65/$71 Included Yes
Crystal Springs Golf Course 18H-DF Burlingame 65,000 $36/$51 $26/$36 $14 Yes
Half Moon Bay Golf Links 36H-DF Half Moon Bay 90,000 $135/$1552 $40/$50 Included No
Hiddenbrooke Golf Club 18H-DF Vallejo 35,000 $65/$75/$95 $49/$69/$79 Included Yes
Metropolitan Golf Links 18H-DF Oakland 60,000 $40/$50/$60 $20/$30 $15 Yes
Peacock Gap Golf & CC 18H-DF San Rafael 60,000 $30/$46 $21/$31 $14 Yes
Poppy Ridge Golf Course 27H-DF Livermore 58,000 $57/$823 $27/$383 $16 No
Presidio Golf Course 18H-DF San Francisco 62,000 $78/$904 $32/$37/$52 $18 Yes
San Geronimo Golf Club 18H-DF San Geronimo 55,000 $33/$38/$65 $25/$35 $14 No
StoneTree Golf Club 18H-DF Novato 35,000 $85/$115 $65/$85 Included No
Sunol Valley Golf Courses 36H-DF Sunol 80,000 $28/$55 $20/$26 $12 Yes
CHART KEY
1 Resident fees are $28/$32/$44 2 Advance reservation green fee is $165/$180 3 NCGA and SCGA members receive significant discounts off of this rate 4 San Francisco resident rates are $42/$65/$77
Note: Where three fees indicated, middle fee is for Friday
Significant Findings – Daily Fee Market • The above list is just a representative sampling of the daily fee market. Many of
these courses provide formidable competition for area municipal courses, particularly during off peak times, when discounting of fees is prevalent. The list is not intended to be exhaustive, and Bay Area municipal courses compete with many other daily fee courses. Other high quality daily fee facilities that local golfers will travel to on occasion include Deer Ridge, Shadow Lakes, and Brentwood GC in the Brentwood area, Chardonnay Golf Club in Napa, and the Links at Bodega Bay.

National Golf Foundation Consulting, Inc. – City of San Francisco, California – 33
• Despite significantly higher peak time rates at most of these daily fee courses, they are competitive to area municipal courses due to discounting, mostly during off peak periods. For instance, though published rack rates may not change, about half of the daily fee courses in the market discount even their prime morning and weekend rates during the winter off season.
• Other forms of discounting are also prevalent in the market, with the most common type being twilight and super-twilight rates. Twilight rates, which are illustrated in the table above, generally start at noon or 1:00 pm and run until mid-afternoon, at which time still cheaper ‘super’ twilight rates are offered (often for unlimited play until dark). Twilight rates are typically accompanied by discounted carts.
• There are still other ways that discounting among daily fee courses manifests itself, including resident discounts, “player’s clubs” (frequent player programs), and participation in on-line wholesale programs such as golfnow.com and golf707.com.
• Finally, many daily fee courses practice aggressive yield management, where tee sheets are carefully monitored and unsold inventory is offered at discounted rates with the idea that an unsold tee time is gone forever. A common practice of yield management is to form e-mail clubs and to send out blasts to customers advertising special deals for certain times of the week.
• The daily fee facility that competes perhaps most directly with the San Francisco municipal golf courses (certainly Harding Park) is the Presidio, which practices very aggressive yield management. In addition, the Presidio offers significant discounts to City/County residents (its resident rates are cheaper than at Harding Park on weekdays and highly competitive on weekends). Super twilight rates are only $25 weekdays and $30 weekends, with a discounted $12 cart.
• Additionally, the Presidio offers other ways for golfers to play very cheaply, including a “Twilight Player’s Club” (pay $29 per month, and play anytime there is an opening while paying only the applicable cart fee), and the “Walk On” pass, which offers unlimited play for an entire year, with no fee, whenever there is an opening. This pass costs $1,700, which means a golfer playing only two times per week would effectively pay only $16.35 per round to play Presidio.
• Harding Park’s green fees compare with the highest daily fee rates in the market, and are higher than most. The clubs closest to Harding Park with regard to fees are Half Moon Bay ($135/$155 weekday/weekend) and Pasatiempo in Santa Cruz ($150/$175, plus $20 cart).
• As a result of new course openings, the 9/11 tragedies, and other economic factors, average rounds played at area daily fee courses are down about 20% to 30% since the late 1990s or 2000. While competition in the East Bay, South Bay, and North Bay areas is reported to be very intense, it is NGF Consulting’s opinion that the City courses may benefit from being in more of an insular geographic market, particularly if the day comes when these facilities can compete from a course conditioning perspective.
• In addition to rounds played being down, the majority of daily fee operators report that average daily rates (ADRs) – the actual green fee revenue divided by the

National Golf Foundation Consulting, Inc. – City of San Francisco, California – 34
number of rounds – have been stagnant or even declining over the last several years. This is obviously is a direct result of the discounting that has become prevalent in the market.
• The majority of daily fee courses in the market are not directly competitive to Lincoln and Sharp, due to location and the relative price/value proposition offered. However, as noted, deep discounting at certain times will prompt the golfer that is normally content with playing an average course for very affordable rates to play a higher quality course for a slightly higher cost.
• The daily fee courses that are probably most directly competitive to Sharp and Lincoln are Crystal Springs, leased from the City’s Public Utilities Commission, and Metropolitan Golf Links in Oakland, which reopened in April 2003 after being closed for about six years.
• Operated by CourseCo through a 30-year sublease involving the City and Port of Oakland, Metropolitan offers excellent conditions at affordable prices, particularly for afternoon tee times. It also offers discounts to Oakland residents. The home facility for the Cal-Berkeley golf team, Metropolitan offers a Johnny Miller ‘American Links’ design, grass driving range (a rarity in the East Bay), an expansive practice area, and full service clubhouse and banquet facilities. The course offers excellent conditioning, and drains exceptionally well, a clear advantage in this market. Greens are pure Bentgrass, resulting in consistent conditioning and speeds. The facility also benefits from excellent access to the 880 and the entire Bay Area.
Alternative Length Facilities Below we compare the basic pricing structure at the City’s two short courses to some other comparables in the market.
Area Alternative Length Golf Courses
Golf Course Type Location
9-Hole Non-Resident
Green Fee (WD/WE)
9-Hole Resident
Green Fee (WD/WE)
9-Hole Senior Green
Fee (WD/WE)
Replay Green
Fee
Per Person
Cart Fee
Fleming GC @ Harding Park 9H-E San Francisco $25/$30 $20/$22 $14/$191 $11 $7.50
Golden Gate Golf Course 9H-P San Francisco $14/$18 $10/$12 $7/$10 Applicable DNA
Chuck Corica (Mif Albright) 9H-P Alameda $9/$11 $9/$11 $7/DNA $7 $14
Mariners Point Golf Links 9H-P Foster City $16/$16 $12/$12 $12/$12 $10 DNA
Mill Valley Golf Course 9H-E Mill Valley $17/$19 $12/$14 $11/DNA $10 DNA
Mission Hills of Hayward GC 9H-E Hayward $17/$20 $15/$18 $142/DNA $8/$103 $8
CHART KEY: P – Par 3 E – Executive DNA – Does not apply 1 Resident only 2 Resident rate is $12 3 Resident/Non-resident

National Golf Foundation Consulting, Inc. – City of San Francisco, California – 35
Significant Findings • Fees at Golden Gate Park are in line with area comparable courses, and are
commensurate with the market the facility serves – beginners, juniors, and families. As Golden Gate can effectively serve as a cultivator of new players and a feeder facility for the rest of the San Francisco municipal golf system, its fees should be affordable to the majority of residents.
• Mariners Point, in Foster City, is a comprehensive teaching and practice center that features a 9-hole, par 3 golf course that is set along San Francisco Bay and is lighted for night time play. The facility also has 64 practice stalls on a variety of surfaces, including natural grass, and the hitting area has yardage markers and target greens. The short game facility includes well-manicured greens and bunkers to practice chipping, pitching and sand shots of varying distances. Mariners Point also has a fully stocked pro shop, with a large variety of hard and soft goods.
• Mission Hills, which the Hayward Area Park District opened in 1999, is a high quality well-maintained facility that features a highly successful night lighted, 50-stall, double-decked driving range and a fully equipped golf shop, in addition to the executive length golf course.
• Green fees at the City’s 9-hole Fleming course are considerably higher than those at other alternative length facilities in the market, and are similar to 18-hole rates at both Lincoln and Sharp Park. The fees are also not much below some other municipal course 18-hole rates, and are more expensive than several when the $11 replay rate is considered. Finally, fees at Fleming are similar to the super twilight rates at some high quality daily fee courses in the market.
• There are no power carts available at Golden Gate, Mariners Point, or Mill Valley.
National Premier Municipal Golf Courses The golf courses listed in the table below comprise a representative subset of facilities that are considered to be among the best municipal courses in the nation. Criteria used to pick them include quality of golf course, national reputation, current or previous affiliation with professional tournaments, and fee levels. The chart on the following page illustrates basic operating data for these facilities.
National Premium Municipal Comparables Facility Name Location # Holes Par Bethpage State Park (Black) Farmingdale, NY 18 71 Black Gold Golf Course Yorba Linda, CA 18 72 Brown Deer Park Golf Course Milwaukee, WI 18 71 Crandon Golf Course Key Biscayne, FL 18 72 Desert Willow Golf Resort Palm Desert, CA 36 72 Golf Resort at Indian Wells Indian Wells, CA 36 72 Incline Village Golf Courses Incline Village, NV 18R/18E 72 Miami Beach Golf Club Miami Beach, FL 18 72 SilverRock Resort La Quinta, CA 18 72 Torrey Pines Golf Course La Jolla, CA 36 72
R – Regulation E – Executive

National Golf Foundation Consulting, Inc. – City of San Francisco, California – 36
National Premium Municipal Comparables Peak Season Res. Rates Peak Season Non-Res. Rates Res as % of Non-Res
WD/WE 18 WD/WE Twi WD/WE 18 WD/WE Twi18-Hole Cart Fee WD/WE 18
WD/WE Twi
Senior WD/WE 18
Senior % (of regular N/R
rate)
Res ID Card Cost
Reserv. Policy
(Res/NR days)
Advance Res Fee1
Rounds Played 2005
% Resident
Play
# of Ann. Events/Ave. Field Size
Bethpage Black $39/$492 $21/$262 $78/$982 $42/$522 $163 50%/50% 50%/50% $24/DNA 31%/DNA DNA 7/2 DNA 33,0004 82% DNA Black Gold Golf Course $65/$75/$855 $40/$52/$72 $84/$94/$104 $52/$62/$72 Included 77%/82% 77%/100% $406/DNA 48%/DNA DNA 8/7 $5 75,000 40% 12/20 Brown Deer Park GC $35/$39 DNA $77.5/$84 DNA $13.75 45%/46% DNA $22.50/$39 29%/46% $17 5/5 DNA 30,000 N/A 25/90 Crandon Golf Course $73.5/$73.5 $36/$36 $138.5/$138.5 $36/$36 Included 53%/53% 100%/100% DNA DNA DNA 5/5 $10 55,036 51% 12/100+ Desert Willow Golf Resort $45/$45 $45/$45 $165/$165 $65/$65 Included 27%/27% 69%/69% DNA DNA $8 3/60 DNA 89,700 28% 48/80 Golf Resort at Indian Wells $35/$35 $35/$35 $125/$135 $40/$40 Included 28%/26% 88%/88% DNA DNA $5 14/3 DNA 90,000 8% DNA Harding Park Golf Course $46/$597 $35/$447 $135/$155 $105/$125 $133 34%/38% 33%/35% $31/$59 23%/38% $40 7/6 $10 102,000 65%8 N/A Incline Village Golf Courses $46/$46 $35/$35 $155/$155 $100/$100 Included 30%/30% 35%/35% DNA DNA $0 7/14 $15 46,2009 67% N/A Miami Beach Golf Club $85/$8510 DNA $185/$185 DNA Included 46%/46% DNA DNA DNA DNA 5/5 DNA 44,000 42% DNA SilverRock Resort $55/$55 $55/$55 $145/$160 $85/$95 Included 38%/34% 65%/58% DNA DNA $15 3/90 DNA 30,000 30% DNA Torrey Pines (North) $32/$40 $19/$24 $80/$100 $48/$60 $163 40%/40% 40%/40% $22/DNA 28%/DNA $25 7 days DNA 91,394 67%* 60/90 Torrey Pines (South) $41/$47 $25/$28 $130/$163 $78/$98 $163 32%/29% 32%/29% $26/DNA 20%/DNA $25 7 days DNA 64,589 67%* 60/90 Averages (per 18 holes) $50/$54 $35/$40 $125/$137 $65/$74 $15 42%/42% 59%/60% $28/$49 30%/42% $17 $10 49,71911 50% 36/78+
* NGF Consulting Estimate Note: Where three fees listed, represents Mon-Thu/Fri/Weekend DNA - Does not apply N/A - Information not available 1 Per player 2 Does not include $4 reservation fee 3 Represents per person shared cart fee, though single riders pay $18 for entire cart; cart fee included in non-resident rates 4 Activity for all five Bethpage courses totaled is 263,000 rounds 5 Lower fees sometimes available with 3-day advance 6 Non-resident senior is $49 7 City/County of Sand Francisco rates; there are also resident discounts for Northern California residents 8 Percentage mandated by City Council 9 Includes 19,200 rounds at executive 'Mountain' course 10 City of Miami Beach rates; smaller discounts also available for South Florida residents 11 Rounds played for SilverRock not included in calculation of average as it was open only for a partial year in 2005

National Golf Foundation Consulting, Inc. – City of San Francisco, California – 37
Significant Findings • Average resident green fees Harding Park are similar to the national average among
the national courses we profiled, though some of the courses included carts in their fees. It is notable that resident fees at Harding are now higher than those at Torrey Pines. For instance, weekend resident rates are $12 higher than San Diego residents pay to play on the ‘South’ course that will host the U.S. Open.
• Average non-resident fees at Harding are similar to Torrey Pines South course fees, but considerably higher than the North course. Also, Harding non-resident twilight rates are more than twice those being charged at Torrey’s North course. These comparisons to fees at Torrey Pines are notable, as Torrey enjoys not only a very high quality, but also considerable brand equity among municipal golf courses.
• Average rounds played among these premium municipal courses are about 50,000 per 18 holes. Harding Park, at about 102,000 rounds last year on its 27 holes, is one of the more active municipal golf courses at this price point. Bethpage State Park is the most active (about 277,000 on its 90 holes in 2006) of those we surveyed, but it is at a considerably lower price point than Harding Park.
• Resident play accounted for an average of about 50% of total play at the national comparables – identical to the 50% currently proposed for Harding Park, after a recent change in policy (mandated resident percentage had been 65%).
• Among our sampling of high-end national municipal golf courses, residents paid an average only 42% of the corresponding fees for non-residents. Residents of San Francisco receive a higher discount, relative to the green fee charged to non-residents, than residents receive on average at the other national municipal courses.
• The large fee disparity between residents and non-residents is reflective of the typical operating model at very high-end municipal courses: non-residents pay much higher fees so that residents can still enjoy affordable golf at a premium facility. It is sometimes the case that residents are playing at fees that do not cover the cost to the operator to produce the round.
• In addition to Harding Park, several of these national premier municipal courses have hosted professional events. Most prominent among these is Bethpage ‘Black’, which in 2002 became the first municipal golf course to host the U.S. Open. Brown Deer Park annually hosts the U.S. Bank Championship (formerly Greater Milwaukee Open), and SilverRock Resort will soon become home to the Bob Hope Chrysler Classic. Torrey Pines hosts the Buick Invitational each year and will host the U.S. Open in 2008. Crandon Park has been a long-time host to a Senior PGA Tour event.

National Golf Foundation Consulting, Inc. – City of San Francisco, California – 38
REGIONAL CASE STUDIES In Appendix D we present operating profiles of some regional municipal golf systems presented to help identify some trends with respect to municipal golf in this regional market. Though the situations and experiences for these municipalities cannot be compared directly (it is not possible to compare apples to apples) to the City of San Francisco due to the number of variables involved, the goal is to provide an illustration of how different local municipalities are operating their municipal golf systems, and how they are faring from an economic standpoint. What is clear is that there is some pain in the municipal golf market, but there are also some success stories.
Regional Municipal Golf Below are some initial observations about municipal golf in this region, followed by a matrix of operating structures and results, along with some significant findings (see Appendix E for complete profiles of each system).
• Some municipalities self-operate all aspects, while a variety of operating structures and contractual agreements govern the rest.
• Some are successful economically, some with regard to preservation and upkeep of the golf course assets, and some with both.
• Though there are many differences, there are also some commonalities: The majority of local municipal golf systems operate as enterprise funds. Most municipal golf systems in this regional market have experienced a considerable
decline in activity levels since their peak (which was most often in the late 1990s) Growth in expenses has outpaced growth in revenues Labor expenses are the single highest line item for expenses at these municipal golf
courses All of the municipalities surveyed lease out the food & beverage operation Many regional munis have undertaken large scale capital improvements in recent
years; virtually all have CIP set aside provisions to plan for future improvements There is typically a strong oversight function at the municipality, even when all or part
of the operations are leased or concessioned With a couple of possible exceptions (Lake Chabot, Skywest), all of the municipal
golf courses in the market are in superior condition to Lincoln and Sharp Park, based on the criteria established in this report.
Municipalities that are struggling with golf are seeking solutions (see Oakland, Salinas); Palo Alto has funding in the current year budget to do a study of their golf system
Public Utilities Commission (PUC) Golf Courses Below we present the contract terms for the two golf courses that sit on San Francisco PUC land, and are leased to private operators. They are important, as they are examples within the City of San Francisco itself of golf courses that are managed by people with golf expertise and experience, and that provide significant positive cash flow to the City. Additionally, though they are not considered municipal golf courses, the City retains oversight with respect to green fees and maintenance conditions, and also requires certain capital improvements of the lessees.

National Golf Foundation Consulting, Inc. – City of San Francisco, California – 39
Crystal Springs Golf Course Ground Lease. 20-year term Landlord: City and County of San Francisco Tenant: Crystal Springs Golf Partners, L.P. Dated November 26, 1996 Note: Tenant has a management agreement with CourseCo for daily operation of the premises.
Terms Base Rent: Annual Base Rent Monthly Payments Year 1-3 $1,250,000 $104,167 Year 4-10 $1,500,000 $125,000 Year 11-15 $2,000,000 $166,667 Year 16 forward $2,250,000 $187,500 Adjustment allowed each anniversary except #4, 11, and 16 – based on CPI
Percentage Rent: 8% F&B gross 12% Merchandise gross Years 1-2 25% gross revenues all other sources Years 3-5 35% gross revenues all other sources Years 6-20 40% gross revenues all other sources
Required improvements: Clubhouse renovation and ADA conformance $550,000 Parking, landscaping, entry gate improvement and expansion $215,000 Maintenance building, fuel storage tanks, on-course snack bar, ADA restrooms, landscaping $240,000 Driving range/practice area irrigation, turfing; fence repair; build practice green; add range lighting; add second deck $185,000 CourseCo to prepare master plan for golf course improvements $635,000 Add cart paths Reconstruction and expand certain tees and bunkers Restore native habitats around and within the course Improve drainage of the course and containment of run-off Contingency allowance for modification or additions to above $150,000
Total – not less than: $1,975,000
• In addition, a new irrigation system will be installed in lease year 6. • All improvements belong to the Landlord. Capital Improvement Fund required, with
6% monthly gross revenue in years 1 through 5 and 2% gross revenue in years 6 through 20. Held in trust for the benefit of the City’s interest in the premises. Funds

National Golf Foundation Consulting, Inc. – City of San Francisco, California – 40
used exclusively for repair and replacement of capital items. At end of lease, remaining funds will be remitted to Landlord.
• Must obtain written permission from SFWD for any improvements or alterations to premises. Maintenance and repairs are Tenant responsibility.
Amendment to Lease June 1, 2003 Because of declining economy and golf market, Tenant requested changes to original lease.
Base Rent From June 1, 2003 through May 31, 2006, base rent payable in monthly installments of $100,000.
From June 1, 2006 through the term of the lease, Base rent calculated as the greater of:
• 80% of average annual accrued rent for 3 immediately previous annual periods • or • CPI adjusted base rate
Percentage Rent Modified as follows: 8% F&B gross From 6/1/03-end 8% Merchandise gross Remainder of term 30% gross revenues all other sources Up to and including Revenue Threshold (as defined below) AND 65% gross all other sources exceeding Revenue Threshold Revenue Threshold means: 6/1/03 – 12/31/03 $2,164,167 Calendar years 2004 forward Revenue Threshold for previous calendar year multiplied by indices Other Changes
• Beginning June 1, 2003, City will make contributions to Capital Improvement Fund in addition to Tenant’s contributions (2% gross revenues) as rent credits. When the amount deposited by Tenant to bring CIF to $500,000 has been matched, City’s contributions cease.
• Changed the requirement of a new irrigation system in lease year 6 to: • New cart paths, new cart barn, wash down area, and other golf course and
clubhouse improvements will be installed before lease year 13. Other capital improvements will be installed prior to end of the Term. Tenant obligated to expend not less than $2,000,000 on capital improvements.
• Provided for a two-year lease review. Audited operating income for 2003 and 2004 compared to projected operating income for those years. May lead to amendment of lease.

National Golf Foundation Consulting, Inc. – City of San Francisco, California – 41
Operating Results and Other Observations • Rounds – 61,695 in 2006, representing an increase of about 2% over prior year;
65,250 budgeted for 2007 • Golf revenue per round up about 6% in 2006 • Located in a good demographic area – doesn’t do a lot of discounting • Green fee per round was $41.15 (up marginally); average per round cart revenue
was $8.30 • No union labor • Total golf revenue of $2,671,000 • Total gross F&B revenue of $1.95 million • CourseCo invested more than $2 million of own money into • Total annual rent paid to PUC of $1.2 to $1.3 million • Total expense, other than rent, of about $2.129 million, excluding F&B • Maintenance budget of $800,000, including $429,000 labor
Sunol Valley Golf Course Ground Lease dated September 15, 2003 Landlord: City and County of San Francisco Tenant: Sunol Valley Golf & Recreation Co. Term: January 1, 2004 through December 31, 2028 (25 years) Rent Annual Base
Rent Monthly
Payments Annual Percentage Rent
Year 1-2 $250,000 $20,833.33
5% admissions gross + 2.5% equipment rentals gross
+ 4 1/8% concessions gross, payable monthly
Years 3-10 $500,000 $41,666.67
10% admissions gross + 5% equipment rentals gross
+ 8.25% concessions gross, payable monthly
Year 11 & forward Calculation $166,667 Same as years 3-10 Adjustment allowed on 10th, 15th, and 20th anniversary – based on CPI
Improvements Tenant’s sole expense, in accordance with Landlord’s approval in writing. Tenant pays Landlord and administrative fee of 5% of total cost of any work in excess of $5,000. Required:
• Replacement of greens - four per year over a 9-year period • Renovation of the café/bar • Improvements to clubhouse • Repaving of maintenance road and parking lot • Replacement of cart bar

National Golf Foundation Consulting, Inc. – City of San Francisco, California – 42
• Improvements to irrigation system • Replacement of golf carts.
Capital Improvement Program Tenant established and maintains a Capital Improvement Fund account. Tenant deposits into that account 2% of gross revenues from preceding month, through entire term of lease. Funds used exclusively for construction, repair and replacement of capital items. Capital Improvement Plan is submitted by Tenant to Landlord within 30 days after the first of each lease year. Tenant is obligated to spend at least $10,800,000 on capital improvements. Maintenance Tenant has sole responsibility for condition, operation, repair, maintenance, and management of the premises.

National Golf Foundation Consulting, Inc. – City of San Francisco, California – 43
Regional Case Study Summary and Observations
Regional Municipal Golf Operations
Municipality: Alameda Hayward
Area Mountain
View Oakland Palo Alto Pleasanton Salinas
San Jose (Los
Lagos) 6 San
Leandro San Mateo Santa Clara Santa Cruz Sunnyvale San
Francisco Harding/Fleming Lincoln Sharp # Facilities 1 2 1 1 1 1 1 1 1 1 1 1 2 5 1 1 1 # Holes 45 27 18 27 18 18 18 18 27 18 18 18 27 81 27 18 18 Enterprise Fund (Yes/No) Yes Yes Yes Yes No Yes Yes Yes No Yes No Yes No 8 Yes Yes Yes Yes Operating Structure (Operations/Mtce.) City/City Muni/Muni City/City See Text Mgmt/City Mgmt/Mgmt City/City Mgmt/Mgmt Lease/Lease City/City Mgmt/Mgmt Lease/City City/City Various/City Mgmt/City Lease/City Lease/City Current Annual Rounds Played 170,000 107,500 65,837 43,329 75,000 73,514 42,000 70,000 114,000 83,000 85,000 48,000 85,000 216,732 101,966 34,736 35,186 Peak Annual Rounds Played 250,000 See Note 1 75,000 80,475 3 108,000 DNA N/A N/A N/A 100,000+ 105,000 80,000 101,000 N/A 150,000+ 70,000+ 70,000+ Total Gross Revenue $4,250,000 $3,127,000 $3,600,000 $1,385,000 N/A 4 $4,485,000 $1,000,000 $3,900,000 $4,500,000 N/A 4 $3,500,000 N/A 4 $4,200,000 $11,125,000* $5,964,153 $1,293,537 $1,895,476 Total Revenue to Municipality $4,250,000 $3,127,000 $3,600,000 $750,000 $3,350,000 $4,485,000 $1,000,000 $3,900,000 $768,000 $2,560,000 $3,500,000 $2,100,000 $4,200,000 $8,926,312 $5,964,153 $1,005,096 $807,952 Total Expense to Municipality (excluding debt) N/A $3,440,000 $3,575,000 2 $734,500 $2,600,000 $2,900,000 5 $1,475,000 $2,750,000 $209,000 $2,200,000 $2,350,000 7 $1,950,000 $3,000,000 $9,805,952 $6,327,827 $1,216,812 $1,064,638 Total Operating Net to Municipality N/A ($313,000) $25,000 $15,500 $750,000 $1,585,000 ($475,000) $600,000 $559,000 $360,000 $1,150,000 $150,000 $1,200,000 ($879,640) ($363,674) ($211,716) ($256,686) Annual Debt Service N/A $0 $0 $0 $556,000 N/A $375,000 $1,400,000 $520,635 $708,000 $0 $198,000 $0 $935,420 $935,420 $0 $0 Total Expense to Municipality $5,000,000 $3,440,000 $3,575,000 $734,500 $3,156,000 N/A $1,850,000 $4,150,000 $729,635 $2,908,000 $2,350,000 $2,148,000 $3,000,000 $10,741,372 $7,263,247 $1,216,812 $1,064,638 Total Net to Municipality ($750,000) ($313,000) $25,000 $15,500 $194,000 N/A ($850,000) ($250,000) $38,365 ($348,000) $1,150,000 ($48,000) $1,200,000 ($1,815,060) ($1,299,094) ($211,716) ($256,686) Maintenance Expense N/A N/A $1,250,000 N/A N/A N/A $820,000 $1,270,000 N/A $1,100,000 N/A $750,000 $1,700,000 $3,679,655 $2,394,321 $720,606 $798,448 Maintenance Staffing (FTEs) N/A 12 11.5 N/A 9 14 8 N/A N/A 12.3 N/A 12 15 47 26 10 10 Labor Expense N/A $2,095,000 $1,510,000 N/A $916,000 $1,335,000 N/A N/A N/A $1,170,000 $850,000 N/A $1,200,000 $5,513,780 $3,490,099 $643,361 $749,132 Labor Expense / Revenue Dollar N/A $0.67 $0.42 N/A $0.27 $0.30 N/A N/A N/A $0.46 $0.24 $0.00 $0.29 $0.62 $0.59 $0.64 $0.93 Cost of Production per Round $29.41 $32.00 $54.30 $16.95 $42.08 N/A $44.05 $59.29 $6.40 $35.04 $27.65 $44.75 $35.29 $49.56 $71.23 $35.03 $30.26 Cost of Production (excluding debt service) N/A $32.00 $54.30 $16.95 $34.67 $39.45 $35.12 $39.29 $1.83 $26.51 $27.65 $40.63 $35.29 $45.24 $62.06 $35.03 $30.26 Labor Exp. %/Total Expense Budget N/A 60.9% 42.2% N/A 35.2% 46.0% N/A N/A N/A 53.2% 36.2% N/A 40.0% 56.2% 55.2% 52.9% 70.4%
1 Rounds at Skywest are down from a peak of 90,000+ in the late 1990s to the current 65,000 2 This figure includes a $400,000 administrative charge from the General Fund and an additional $100,000 transfer to the General Fund 3 Highest number since 2000, but not necessarily all time peak 4 Total gross revenue not available as aspects of the pro shop are concessioned
5 Represents estimate based on current budget of $2.58 million, not including management fee 6 Complete information was not provided for San Jose Municipal, Rancho del Pueblo 7 Doesn’t include transfer to General Fund, which is equivalent to operating profits less a capital improvement set-aside 8 Operates as part of Community Recreation Fund
*NGF Consulting estimate General Notes: Figures reported are for most recently available fiscal year (2005-06 for City of San Francisco courses) Labor expense at Harding/Fleming includes KSM payroll. Labor expense at Lincoln and Sharp is from City perspective only. Maintenance expense at City of San Francisco courses includes payroll, materials & supplies, and equipment; for Harding/Fleming, also includes course & grounds maintenance listed on KSM income statement. Gross reported for all systems includes a net lease payment for food & beverage Difference between total gross revenue and total expense may not equal the net profit in some cases (see San Jose), as some municipalities reported total gross (cost of goods sold not deducted) while others reported adjusted gross revenue

National Golf Foundation Consulting, Inc. – City of San Francisco, California – 44
• Labor expense per revenue dollar: average among seven municipalities reporting labor expense was $0.38, compared to $0.62 for San Francisco.
• Of 13 municipalities surveyed, six were self-operated by municipality for both management and maintenance, two were contracted for management and maintained by municipality, and five were completely contracted out
• Of those municipalities surveyed, 10 reported making an operating profit; of these: Three were municipality self-operated for both management and maintenance
functions Five were contracted out for both management and maintenance functions Two were contracted for operations, but with municipal maintenance
• Seven of the 10 profitable systems made a profit after debt service; of these: Two were municipality self-operated for both management and maintenance
functions Four were contracted out for both management and maintenance functions One was contracted for operations, but with municipal maintenance
• The most profitable golf systems, before debt service, belonged to: Pleasanton (management company) – an estimated $1.585 million Sunnyvale (City self-operated and maintained) - $1.2 million Santa Clara (management company) - $1.15 million Palo Alto (management company/City maintenance) - $750,000 San Leandro (entire operation leased out) - $559,000
• Seven of twelve reporting municipalities (Alameda did not report) had annual debt service, which averaged about $537,000. The highest debt service was San Jose’s $1.4 million for the construction of Los Lagos Golf Course; San Joes has additional debt for Rancho del Pueblo.
• San Francisco’s cost of production per round in FY 2005-06 was the second highest among the municipalities surveyed, at $45.24 per round (Mountain View was highest at $54.30, but this includes various transfers to the General Fund). When excluding debt service, San Francisco ranked third overall. These numbers will go up considerably for 2006-07, as the payment to the Open Space fund increases to $1.41 million and the budget at Harding Park increases significantly.
• The average number of full-time equivalent maintenance staff at those municipalities reporting was .59 per golf hole, nearly exactly what the San Francisco system is budget for. However, when considering actual staffing at City courses, the number for San Francisco drops to .49 per FTEs per 18 holes.
• Labor as a percentage of the total expense budget averaged 44.8% among the municipalities reporting. For those golf systems that were completely self-operated by the municipality, the average was 49% (San Francisco is at 56.2%).
• All of the municipalities surveyed have Capital Improvement Plan provisions, regardless of how they are operated.
• Many courses have undergone, or plan, major recent capital improvements: City of Santa Clara - Renovation of greens in late 1990s. City of Palo Alto – Complete renovation of the golf course. City of Santa Cruz - Underwent $3M renovation in 2004.
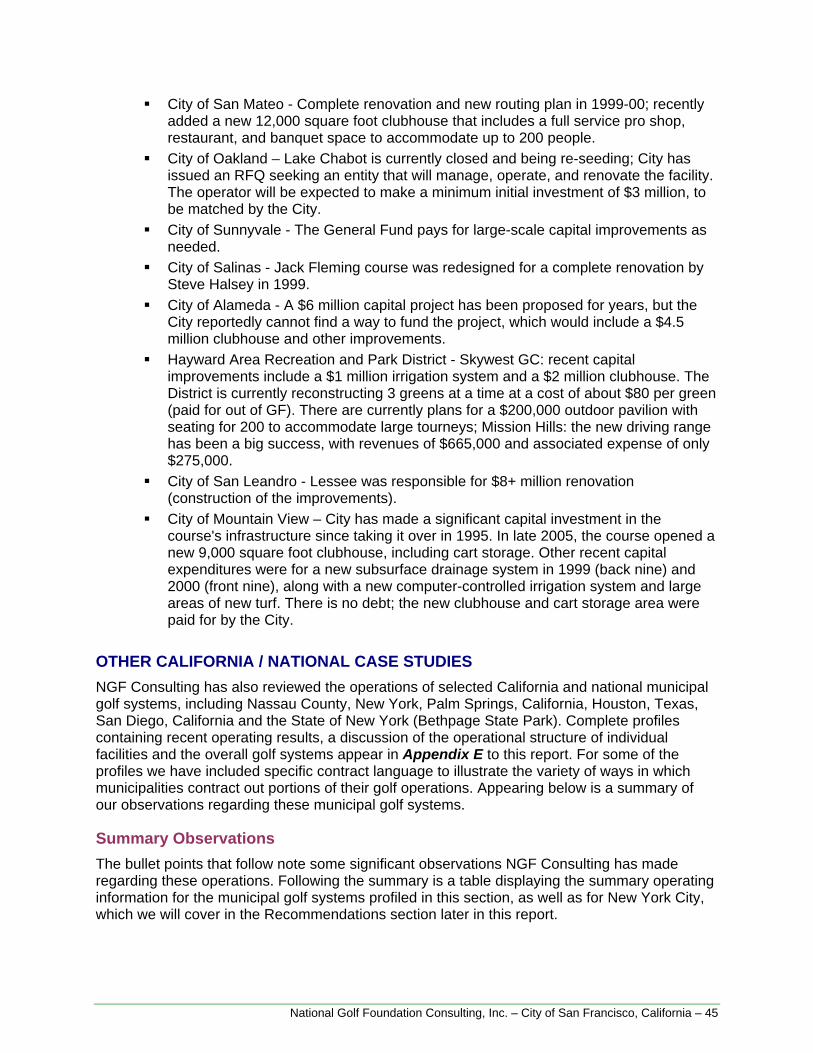
National Golf Foundation Consulting, Inc. – City of San Francisco, California – 45
City of San Mateo - Complete renovation and new routing plan in 1999-00; recently added a new 12,000 square foot clubhouse that includes a full service pro shop, restaurant, and banquet space to accommodate up to 200 people.
City of Oakland – Lake Chabot is currently closed and being re-seeding; City has issued an RFQ seeking an entity that will manage, operate, and renovate the facility. The operator will be expected to make a minimum initial investment of $3 million, to be matched by the City.
City of Sunnyvale - The General Fund pays for large-scale capital improvements as needed.
City of Salinas - Jack Fleming course was redesigned for a complete renovation by Steve Halsey in 1999.
City of Alameda - A $6 million capital project has been proposed for years, but the City reportedly cannot find a way to fund the project, which would include a $4.5 million clubhouse and other improvements.
Hayward Area Recreation and Park District - Skywest GC: recent capital improvements include a $1 million irrigation system and a $2 million clubhouse. The District is currently reconstructing 3 greens at a time at a cost of about $80 per green (paid for out of GF). There are currently plans for a $200,000 outdoor pavilion with seating for 200 to accommodate large tourneys; Mission Hills: the new driving range has been a big success, with revenues of $665,000 and associated expense of only $275,000.
City of San Leandro - Lessee was responsible for $8+ million renovation (construction of the improvements).
City of Mountain View – City has made a significant capital investment in the course's infrastructure since taking it over in 1995. In late 2005, the course opened a new 9,000 square foot clubhouse, including cart storage. Other recent capital expenditures were for a new subsurface drainage system in 1999 (back nine) and 2000 (front nine), along with a new computer-controlled irrigation system and large areas of new turf. There is no debt; the new clubhouse and cart storage area were paid for by the City.
OTHER CALIFORNIA / NATIONAL CASE STUDIES NGF Consulting has also reviewed the operations of selected California and national municipal golf systems, including Nassau County, New York, Palm Springs, California, Houston, Texas, San Diego, California and the State of New York (Bethpage State Park). Complete profiles containing recent operating results, a discussion of the operational structure of individual facilities and the overall golf systems appear in Appendix E to this report. For some of the profiles we have included specific contract language to illustrate the variety of ways in which municipalities contract out portions of their golf operations. Appearing below is a summary of our observations regarding these municipal golf systems.
Summary Observations The bullet points that follow note some significant observations NGF Consulting has made regarding these operations. Following the summary is a table displaying the summary operating information for the municipal golf systems profiled in this section, as well as for New York City, which we will cover in the Recommendations section later in this report.

National Golf Foundation Consulting, Inc. – City of San Francisco, California – 46
• Other California/national examples of municipal golf systems show that there is no universal way of operating, and that results are widely variable; it also shows that golf can be very profitable, or it can require significant support from the General Fund.
• New York City is an example of a very profitable municipal golf system, generating about $6 million in profit (all from license fees) for the City in 2005, while maintaining control of course conditioning, policies, fees, etc. In addition, the licensees are responsible for capital improvements.
• Nassau County and Houston are examples of systems that are struggling under a very high cost of labor (nearly 70% of total expenses). Houston, which self-operates several facilities and has a mishmash of contracts for the rest, loses money on the facilities it self-operates but generates a profit on its private operations. However, unlike New York City, course conditions at its privately operated golf courses are poor, as the lessees struggle to put money into maintenance while making the rent payments to the City.
• San Diego is an example of a system that is being supported by a cash cow – Torrey Pines. Despite losing money at its other two facilities, San Diego generated a net profit of nearly $5 million in 2005. Similarly, New York State clears about $4 million at the Bethpage State Parks Golf Courses.
• Crystal Springs, which is leased from the City of San Francisco through its Public Utilities Commission, is almost a microcosm of New York City. San Francisco receives anywhere from $1.2 million to $1.3 million annually on the facility, with little associated expense. Additionally, the City sets stipulations for green fees, and the operator – CourseCo – has reportedly invested about $2 million in the facility and is responsible for future capital improvements.
• San Francisco’s cost to produce each round of golf is more than twice that of the examples noted above, with the exception of Nassau County, which is producing rounds at about 58% of the cost that San Francisco is.
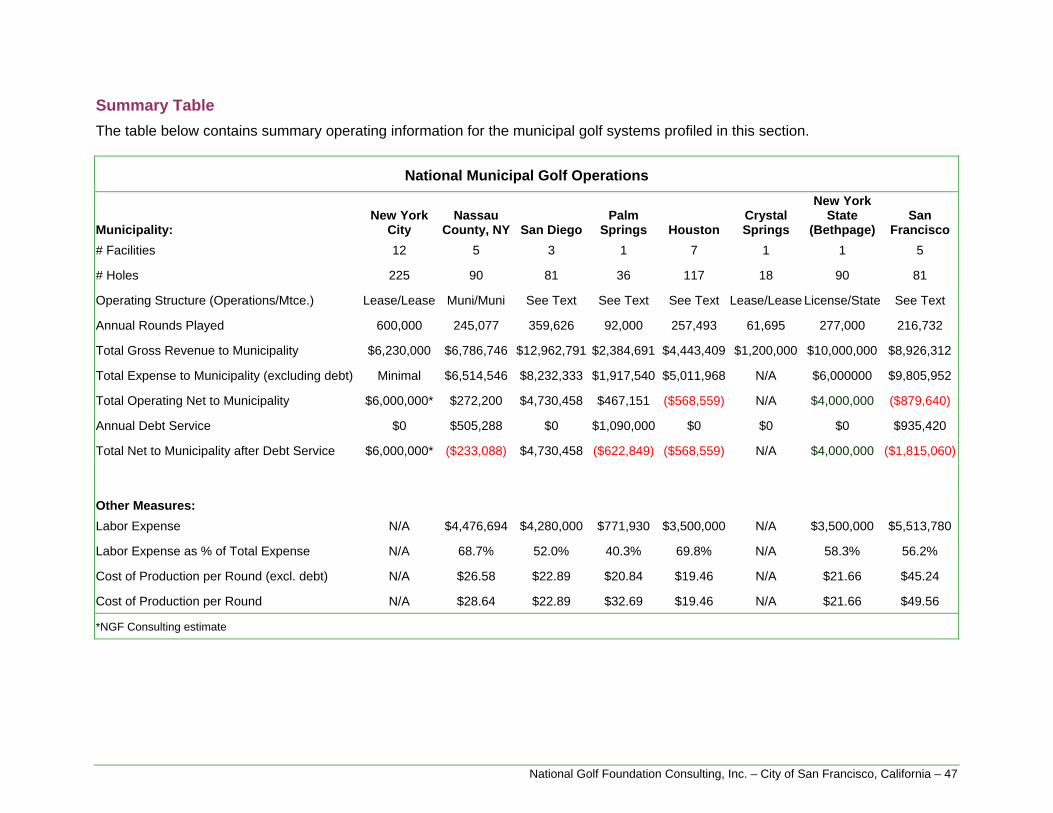
National Golf Foundation Consulting, Inc. – City of San Francisco, California – 47
Summary Table The table below contains summary operating information for the municipal golf systems profiled in this section.
National Municipal Golf Operations
Municipality: New York
City Nassau
County, NY San DiegoPalm
Springs Houston Crystal Springs
New York State
(Bethpage)San
Francisco # Facilities 12 5 3 1 7 1 1 5
# Holes 225 90 81 36 117 18 90 81
Operating Structure (Operations/Mtce.) Lease/Lease Muni/Muni See Text See Text See Text Lease/Lease License/State See Text
Annual Rounds Played 600,000 245,077 359,626 92,000 257,493 61,695 277,000 216,732
Total Gross Revenue to Municipality $6,230,000 $6,786,746 $12,962,791 $2,384,691 $4,443,409 $1,200,000 $10,000,000 $8,926,312
Total Expense to Municipality (excluding debt) Minimal $6,514,546 $8,232,333 $1,917,540 $5,011,968 N/A $6,000000 $9,805,952
Total Operating Net to Municipality $6,000,000* $272,200 $4,730,458 $467,151 ($568,559) N/A $4,000,000 ($879,640)
Annual Debt Service $0 $505,288 $0 $1,090,000 $0 $0 $0 $935,420
Total Net to Municipality after Debt Service $6,000,000* ($233,088) $4,730,458 ($622,849) ($568,559) N/A $4,000,000 ($1,815,060)
Other Measures: Labor Expense N/A $4,476,694 $4,280,000 $771,930 $3,500,000 N/A $3,500,000 $5,513,780
Labor Expense as % of Total Expense N/A 68.7% 52.0% 40.3% 69.8% N/A 58.3% 56.2%
Cost of Production per Round (excl. debt) N/A $26.58 $22.89 $20.84 $19.46 N/A $21.66 $45.24
Cost of Production per Round N/A $28.64 $22.89 $32.69 $19.46 N/A $21.66 $49.56
*NGF Consulting estimate

National Golf Foundation Consulting, Inc. – City of San Francisco, California – 48
COMPETITIVE GOLF MARKET SUMMARY The regional municipal golf courses we surveyed averaged just fewer than 70,000 rounds per 18 holes in 2005-06, and most area operators report activity levels that are down by about 30% since peaking in the 1990s. Los Lagos (San Jose) and Callippe Preserve (Pleasanton) are the newest entrants into the area municipal golf market, and both are high quality facilities that have had immediate market impact.
Harding Park’s 60,464 rounds fall below the market average, which is not surprising given its price points, which are considerably higher than those at any other municipal course we surveyed. When the Fleming course’s 41,502 rounds are added in, the overall facility falls just below the market average per 18 holes. Both other City 18-hole courses, Lincoln and Sharp, are at about 50% of the average market activity levels, as is the 9-hole Gleneagles.
The greater Bay Area features a highly competitive daily fee golf market, as illustrated by a decrease in average rounds played of about 20% to 30% since the late 1990s. Though most daily fee facilities are not considered direct competition for the City courses, discounting of fees is prevalent at many high quality courses, prompting some golfers who would normally play at generally lower fee municipal courses to occasionally travel to play “luxury” rounds. Many daily fee courses practice aggressive yield management, where tee sheets are carefully monitored and unsold inventory is offered at discounted rates with the idea that an unsold tee time is gone forever. This is a flexibility that the San Francisco municipal courses do not currently have.
The daily fee facility that competes perhaps most directly with the San Francisco municipal golf courses (certainly Harding Park) is the Presidio, which practices very aggressive yield management. In addition, the Presidio offers significant discounts to City/County residents, and offers other programs whereby golfers can play the course affordably. Presidio’s resident rates are cheaper than at Harding Park on weekdays and are highly competitive on weekends.
Harding Park’s green fees compare with the highest daily fee rates in the regional market, and are higher than most. The clubs closest to Harding Park with regard to fees are Half Moon Bay ($135/$155 weekday/weekend) and Pasatiempo in Santa Cruz ($150/$175, plus $20 cart). Resident green fees at Harding are now higher than those at Torrey Pines. For instance, weekend resident rates are $12 higher than San Diego residents pay to play on the ‘South’ course that will host the U.S. Open. Average non-resident fees at Harding are similar to Torrey Pines South course fees, but considerably higher than the North course. Also, Harding non-resident twilight rates are more than twice those being charged at Torrey’s North course. These comparisons to fees at Torrey Pines are notable, as Torrey enjoys not only a very high quality, but also considerable brand equity among municipal golf courses.
NGF Consulting also performed an analysis of some premier national municipal comparables to Harding Park, which, at about 102,000 rounds last year on its 27 holes, is one of the more active municipal golf courses at this price point. Among our findings was that resident play accounted for an average of about 50% of total play at the national comparables – identical to the 50% currently proposed for Harding Park, after a recent change in policy. Additionally, we noted a large fee disparity between residents and non-residents at high-end municipal courses, which is the typical operating model at very high-end municipal courses - non-residents pay much higher fees so that residents can still enjoy affordable golf at a premium facility.
We also presented overviews of regional municipal golf systems that were illustrative of trends with respect to golf in this regional market. While we observed a variety of operating structures,

National Golf Foundation Consulting, Inc. – City of San Francisco, California – 49
contractual agreements, and operating results, there are also some commonalities. For instance, the majority of the municipal golf courses in the market are in superior condition to Lincoln Park and Sharp Park according to the NGF Consulting team. Additionally, all of the systems have provisions for capital improvements, and many of the golf courses have undergone major improvements in recent years. Finally, we outlined how some municipal golf systems that are struggling economically are actively seeking solutions, including soliciting outside help from entities that have golf operations and maintenance expertise.
Our regional overview also revealed a couple of key operating ratios that are illustrative of the high expense structure for the City golf system. Labor expense per revenue dollar averaged $0.38 among seven municipalities reporting, compared to $0.62 for San Francisco. Secondly, San Francisco’s cost of production per round in FY 2005-06 was the second highest among the municipalities surveyed, at $45.24 per hole. This figure will go up considerably for 2006-07, as the payment to the Open Space fund increases to $1.41 million and the budget at Harding Park increases significantly.
In the final section of this chapter, we present the contract terms for the City’s two PUC golf courses, which are leased to private operators. They serve as examples within the City of San Francisco itself of golf courses that are managed by people with golf expertise and experience, and that provide significant positive cash flow to the City. Additionally, though they are not considered municipal golf courses, the City retains oversight with respect to green fees and maintenance conditions, and also requires certain capital improvements of the lessees.

National Golf Foundation Consulting, Inc. – City of San Francisco, California – 50
City of San Francisco Municipal Golf Operations Review
The City’s municipal golf system comprises five facilities: the 9-hole Gleneagles International Golf Course; 9-hole par 3 Golden Gate Park Golf Course; the recently renovated 27-hole Harding Park Golf Course, which includes the 9-hole executive Fleming Course; 18-hole Lincoln Park Golf Course; and, the 18-hole Sharp Park Golf Course. The facilities are maintained by the Recreation and Parks Department, and managed under a variety of agreements, which will be explained in detail in the individual facility sections of this report. One of the City’s primary goals with respect to its Golf Division is to provide challenging and accessible golfing experiences to residents of, and visitors to San Francisco.
As we will see from the results of the Golfer Survey Program (GSP) instituted at the five golf courses during the course of this engagement, the City’s municipal golf system suffers from a very poor public perception at this time, with the possible exception of Harding Park. However, at the same time, golfers also recognize the unrealized potential of facilities such as Lincoln Park and Sharp Park, and are very passionate about the potential rehabilitation of these assets.
As part of this consulting effort, NGF Consulting has observed a very dedicated and hard working staff that is managing a budget of over $10 million in golf revenues in each of the last three fiscal years. Harding Park alone has accounted for over $8 million of this revenue, placing it among the highest five of municipal golf courses nationally in annual revenue production.
OVERVIEW OF GOLF OPERATIONS In conducting this evaluation of the City’s municipal golf system, it is apparent to the consultants that there are issues for us to evaluate that are unique to each individual facility, as well as issues that are system-wide and apply to the entire Golf Operations Division. NGF Consulting will address the individual facility issues in the chapters that follow. In this section we will provide an overview of issues related to the overall Golf Operations Division and therefore common to all San Francisco municipal golf courses.
Administration The City’s Recreation & Parks Department (RPD) and its Director oversee the municipal golf courses. The Department’s Golf Division oversees grounds maintenance, while the Property Management Department handles contracts for each golf course property, including those with the First Tee, PGA TOUR, and Kemper Sports Management. The basic chain-of-command for the Golf Division is as follows:
• General Manager, Recreation & Park Department • Director of Operations • Superintendent of City Wide Services • Golf Program Director

National Golf Foundation Consulting, Inc. – City of San Francisco, California – 51
It is evident that City oversight of the golf courses is restricted to grounds maintenance and contract oversight. There are no positions, either staffed or vacant, that entail any expertise in the actual administration and management of municipal golf courses or golf system operations. NGF Consulting was told that creating such a position was discussed “four or five years ago but it has never been budgeted for.
Golf Enterprise Fund The City of San Francisco Golf Division operates as an Enterprise Fund, and as such is expected to operate like a business with revenues expected to cover operational and maintenance expenses, capital improvement costs and any debt that may be incurred by the system. It is extremely important to maintain and manage the Enterprise Fund in a fiscally responsible manner so that the users of the facilities (golfers) are not only supporting the daily operational and maintenance costs, but also the long-term capital improvement projects to keep the courses competitive with the local golf market and up to today’s industry standards.
A 1999 Office of the Legislative Analyst (OLA) report noted that the City’s golf courses had, up until that point in time, been generating surplus revenue, which was appropriated to fund other RPD (Department of Recreation and Park) programs. In FY 1999-00, total annual revenue from green fees and concessions totaled approximately $5.1 million. RPD’s FY 2000-01 budget for the City’s golf courses was approximately $3.4 million, about 77% of which was spent on salaries and benefits – about 77 percent. As we will see later in this section, the situation has reversed, as General Fund transfers are now required to support the Golf Fund. This is despite the fact that Harding Park green fee revenues have nearly tripled since FY 1999-00, to more than $4.1 million.
Golf Course Maintenance and Staffing As noted, the RPD handles the maintenance of the City golf courses, with oversight from the Golf Division and its Director of Operations. The lone exception is at Gleneagles (McLaren Park), where all operations, including management, concessions, and maintenance, have been contracted to a private company since 1980.
Total budgeted maintenance staffing for the City courses for Fiscal Year 2006-07 is summarized in the table below. As we will explore further in the individual course section of this report, actual staffing at the golf courses is considerably lower than budgeted as of this writing:
• Lincoln/Golden Gate – 12 allocated staff; currently includes 3 vacant gardeners, 1 gardener on SL, 5 gardeners (1 exclusive to Golden Gate), 1 park section supervisor, 1 truck driver
• Harding/Fleming – 26 allocated staff; currently includes 2 vacancies (1 gardener, 1 truck driver), Gardening Supervisor, Mechanic, 3 truck drivers, 1 plumber, 1 operating engineer, 17 gardeners; 36 total staff recommended by PGA TOUR
• Sharp Park – 11 allocated staff; currently includes 4 vacant gardeners, 1 park section supervisor, 1 truck driver, and 5 gardeners (though the Golf Program Director noted he had only 4 here)
In addition, there is a four-person program-wide tree crew, plumber, mechanic, and pest control specialist.

National Golf Foundation Consulting, Inc. – City of San Francisco, California – 52
Golf Fund: FY 2006-2007 Budgeted Positions
Golden Gate
Park Golf Fund Harding/ Fleming Lincoln Park Sharp Park Total Title FTE Salary FTE Salary FTE Salary FTE Salary FTE Salary FTE Salary
Manager I 0.12 $12,337 0.38 $39,064 0.25 $25,700 0.25 $25,700 1.00 $102,801
Gardener 1.00 $57,422 18.00 $1,033,597 9.00 $516,799 9.00 $516,799 37.00 $2,124,617
Park Section Supervisor 0.33 $23,041 1.00 $69,821 0.67 $46,781 1.00 $69,821 3.00 $209,464
Pest Control Specialist 0.12 $8,378 0.38 $26,532 0.25 $17,456 0.25 $17,456 1.00 $69,882
Tree Topper 0.38 $27,836 1.12 $79,940 0.75 $53,531 0.75 $53,531 3.00 $214,838
Tree Topper Supervisor I 0.13 $10,351 0.37 $29,460 0.25 $19,906 0.25 $19,906 1.00 $79,623
Operating Engineer, Universal 1.00 $82,842 1.00 $82,842
Plumber 0.20 $17,726 1.00 $88,633 .40 $35,453 0.40 $35,453 2.00 $177,265
Truck Driver 3.00 $215,990 1.00 $71,997 1.00 $71,997 5.00 $359,984
General Laborer 0.12 $6,660 0.38 $21,091 0.25 $13,876 0.25 $13,876 1.00 $55,503
Special Salary Savings - Misc. ($629) $2,564 ($6,469) ($2,618) ($2,478) ($9,630)
Attrition Savings - Misc. $3,207 (1.98) ($119,059) (2.92) ($178,589) (4.90) ($294,441)
Positions Not Detailed - Misc. $1,107 0.00 $1,107
Overtime - Misc.
Step Adjustments - Misc. $300 ($12,419) $1,519 $889 $905 ($8,806)
Total 2.40 $163,422 0.00 ($5,541) 26.63 $1,682,020 10.84 $680,711 10.23 $644,377 50.10 $3,164,989
National Golf Foundation Consulting, Inc. – City of San Francisco, California – 53
Capital Improvement Program Other than a Capital Reserve item for Harding Park (set aside is budgeted at $251,364 annually), there appears to be no capital improvement plan for the City’s golf courses, with the following exceptions:
• At Golden Gate Park, a 9-station driving cage was installed, and the City agreed to pay Manager $65,461.54 reimbursement for planning, design, purchase and other costs, payable in five annual installments.
• The Gleneagles Tenant (who may be allowed rent credits for City-required improvements upon City approval) agreed to make specific facility improvements:
Year 1-2: Improvements to entrance, clubhouse, kitchen and patio area; trim and remove tree limbs. Explore adding a driving range/cage. $50,000 estimated cost.
Years 2-4: Review possibility of adding forward tees on several holes; lease new equipment. $50,000 estimated cost.
Year 4-5: Based on financial feasibility studies, implement driving range. Purchase new TVs for clubhouse. $50,000 estimated cost.
Year 6-7: Review cart path and conduct major renovation of cart paths; review condition of parking lot and driveway and possibly repave and stripe. $100,000 estimated cost.
• The initial contract for Sharp Park required capital improvements of $575,000 in three stages; rent credits were to be allowed for improvements beyond those set forth in lease.
Stage One – within 120 days of date of lease: $250,000 remodel, refurbish, and rehabilitate the clubhouse $25,000 construct cart enclosure area and golf driving cage Stage Two – approximately 2 years from lease date: $150,000 construct deck on west side of clubhouse with
underground cart storage and maintenance facility Stage Three – on or before 5th year of operation: $150,000 construct deck on south end of clubhouse
Harding Park Renovation Background As noted elsewhere in this report, the once-proud Harding Park had fallen into a state of disrepair by the time the year 2000 came around. The City agreed that a total renovation of the facility was needed, and its original plan to finance the makeover was to raise private funds. That idea failed, evidently because of the varied special interest groups that make up the political spectrum of the city. Unions demanded that civil servants continue to maintain the golf course, and supervisors resisted any increase of green fees (about $20) for city residents. The city found itself unable to cut labor costs or increase revenues. Arnold Palmer Golf Management Co. then backed out of its deal with the city to oversee the renovation and manage the course.

National Golf Foundation Consulting, Inc. – City of San Francisco, California – 54
Later that year, a deputy city attorney devised a plan to use $16 million of state grant funds, which were designated to improve or build recreational facilities for low-income and minority San Francisco residents, as a loan to Harding Park. Future golf course revenues were designated as a means to repay the loan with interest. In 2002, the Board of Supervisors authorized the Recreation and Park Department to use the state funds for Harding, provided that the money was repaid with interest from golf course funds within 25 years.
A RPD brief – “The Revised Plan for Renovating Harding Park” – from February 2002 noted that securing a PGA TOUR event was not the goal of the project. Rather, the brief stated, “the Championship offers a critical means toward achieving the ultimate goal of providing the best possible recreational experiences for San Franciscans at affordable fees”.
Some key specifics of the plan for the Harding Park renovation, as outlined in the RPD brief, are summarized below:
Financing – While the City does not have to pay these funds back to the State, a portion of revenues from the renovated golf courses will be used to pay to the voter approved Park, Recreation and Open Space Fund (the “Open Space Fund”) an amount equal to the grant funds used for the Harding project, plus interest.
The City will enter into shorter-term management agreements, under which the City will retain greater control over course management than it would have had under a lease.
Fees and Rounds - The fee structure ultimately selected will be designed to meet target revenues while preserving historic levels of resident play at Harding Park.
Of the 25,000 non-resident rounds, no more than 5,000 rounds could be set aside on a discounted basis for certain “Bay Area” residents, if an equal number are set aside at a premium rate for long-term advance reservations.
Scope of the Renovation - The estimated budget for the project, excluding the First Tee facilities, is approximately $14 million. The First Tee program would separately pay for all of its facilities, plus some percentage of the overall capital costs of the project.
…the only additions to the course needed for the City to host the PGA TOUR Championship are special Championship tees.
Management – The courses will be operated as public, municipal golf courses without having to balance the needs and objectives of a private-for-profit development entity against the City’s municipal purposes. Rate increases to keep pace with the Consumer Price Index will continue to be subject to the approval of the Recreation and Park Commission, and rate increases greater than CPI increases will require both Commission and Board of Supervisors approval. Within these constraints, the City intends to seek qualified managers who, in addition to providing normal course management services, can provide specialized training to the City’s maintenance staff and otherwise participate in ensuring Harding’s excellence. The manager will also be required to ensure that resident play stays at historic levels and to upgrade the reservation system and generally improve the process of securing a tee time.
Course Maintenance – City employees will continue to maintain the courses. In fact, to properly implement and sustain the renovation project, a substantial increase in the number of

National Golf Foundation Consulting, Inc. – City of San Francisco, California – 55
City employees working on the courses is required. In addition, new equipment, supplies and specialized training will be provided to fully empower the City’s maintenance staff.
Special Golf Fund – Without adequate funding, even the best-trained City employees cannot properly maintain Harding Park. To protect the course from slipping back into disrepair after the renovations are complete, it is essential that the City establish a regular source of funding for supplies, maintenance equipment and long-term capital repairs and improvements. Specifically, the City could establish a special “Golf Fund” as an enterprise fund separate from the City’s General Fund. The fund could capture golf course revenues and use them to pay for operating and maintenance expenses and a capital improvement reserve, to repay the initial grant expenditure plus interest, and to help fund future improvements to other City courses including Lincoln Park. The Golf Fund would essentially function as a dedicated capital improvement reserve account for improving and maintaining the golf courses (Bold and italics by NGF Consulting).
The PGA TOUR Championship – …Second, the PGA TOUR Championship will pay the City significantly more money than it will cost. A non-profit agency, the PGA TOUR has agreed to donate an estimated $1 million dollars and 50% of any remaining net revenues from each Championship held at Harding Park to the City, which will help pay for the First Tee Program at the Harding-Fleming golf complex, course related improvements and improvements to the surrounding Lake Merced recreational area.
Board of Supervisors Audit An audit by a Board of Supervisors Budget Analyst looked at overall management of the city Recreation and Park Department and found, among other things, that the renovation of the 18-hole Harding and nine-hole Fleming golf courses at Harding Park, which began in 2002, wound up costing $23.6 million, which was $7.6 million, or 47 percent, over the original estimate of $16 million. The audit also noted that the city lost $141,619 on the 2005 American Express Championship tournament, which featured a dream playoff between Tiger Woods and John Daly. (A spokesman for the PGA TOUR during the tournament at Harding said the event brought at least $55 million in tourist spending to the Bay Area).
Agreement with PGA TOUR The following is a synopsis of important language from the Master Tournament Agreement between the City and County of San Francisco and PGA TOUR, Inc:
Harding Park would become a regular site of the TOUR Championship if certain improvements to Harding Park were made. Subject to the terms and conditions of this Agreement, TOUR hereby agrees to hold the Championship at Harding Park three times over the nine-year period beginning January 1, 2006 or until the TOUR permanently cancels the Championship.
City required to build a 26-stall driving range with artificial mats, target greens, yardage markers and fencing.
Maintenance Standards – TOUR’s obligation to hold the Championship at Harding Park is further conditioned upon Harding Park Golf Course achieving course conditions suitable for the Championship, as reasonably determined by the TOUR’s Agronomy and Rules and Competitions Departments. Ultimate approval of course conditions remains at all times in the discretion of TOUR’s Agronomy Department.

National Golf Foundation Consulting, Inc. – City of San Francisco, California – 56
Course Closure – Harding Park will be partially or completely closed for public play for the two-week period commencing on the Monday before the start of a Championship week and ending on the day after the Championship is completed.
Facility Fee – For each Championship held at Harding Park, the TOUR shall pay City a facility fee (Base Reimbursement Fee) in the amount of $250,000 (increased for successive Championships by CPI increase).
No more than 120 days after completion, the TOUR shall pay the local First Tee Chapter at Harding Park from any net revenues earned by the TOUR from such Championship $250,000 (CPI increase). If net revenues from the applicable Championship are less than $250,000, the amount of the Phase I First Tee Fee shall be limited to the amount of such net revenues.
No more than 120 days after completion of each Championship held at Harding Park, from any net revenues earned by the TOUR from such Championship, TOUR shall pay City an amount equal to the amount, if any, by which the City’s actual costs related to any Championship (as reasonably documented by City to TOUR) exceed the Base Reimbursement Fee, up to a maximum of $130,000 (increased…CPI).
• Phase 2 First Tee Fee - $250,000 if available from net revenues. • Improvement Fee - $250,000 paid by TOUR only if available from net revenues after
payment of above fees. • Participation Fee - 50% of any remaining net revenues from the Championship paid
by TOUR to City, which deposits into the Golf Fund.
Summary of Payments From PGA TOUR Payable to Amount Conditions City $250,000 (Base Reimbursement Fee) The First Tee Harding Park Chapter
$250,000 (Phase I First Tee Fee) If net revenues are less than $250,000, the amount of the Phase 1 First Tee Fee will be limited to amount of such net revenues
City $130,000 maximum (additional costs to City related to Championship)
The First Tee Harding Park Chapter
$250,000 (Phase II First Tee Fee) If available from remaining net revenues
City $250,000 If available from remaining net revenues City 50% of any remaining net revenues
Amendments There has been an amendment to the original agreement between the City and the PGA TOUR, dated January 1, 2005. This dealt primarily with the amounts paid to the City and the First Tee, as well as the TOUR’s commitment regarding the type and number of tournaments that will be played at Harding Park. The amendments also addressed revenue sharing terms.
The flat base amounts payable by the TOUR to the City and The First Tee during tournament years was increased from $250,000 to $500,000. Additionally, the contract now calls for five tournaments over 15 years, beginning January 1, 2005. NGF Consulting was told that the primary impetus of some of the changes was scheduling conflicts that were occurring from the TOUR’s perspective. The new agreement notes that the tournaments at Harding Park will be either the NEC, Amex, or TOUR Championships, though the President’s Cup in 2009 is currently the next tournament being proposed.

National Golf Foundation Consulting, Inc. – City of San Francisco, California – 57
Summary of System-wide Historical Performance The table below summarizes system-wide economic performance since FY 2002-03. (NGF Consulting received several documents and notes slight differences in figures, depending on the source document used).
San Francisco Recreation & Park Department - Golf Revenue & Expenditure Summary FY 2002-03 FY 2003-04 FY 2004-05 FY 2005-06 FY 2006-07 Revenue Budget Actual Budget Actual Budget Actual Budget Actual BudgetGolf Green Fees $3,701,000 $3,255,710 $7,332,800 $6,356,368 $7,687,000 $6,213,549 $7,832,000 $6,235,928 $8,150,218 Resident Cards/Concessions $285,000 $258,207 $1,832,600 $795,259 $1,590,000 $1,787,343 $2,915,000 $2,603,519 $2,693,420 Operating Transfer from GF $536,372 $536,372 $1,568,079 $1,568,079 $1,391,414 $1,391 Beginning Fund Bal - NRP $43,232 $43,232 $120,316 $120,316 $112,001 Beginning Fund Bal - APR $311,312 $311,312 Interest Earned - NPR $6,528 $20,000 $266 $10,000 $5,433 $10,000 ($33,451) $10,000 Interest Earned - APR ($1,271) $0 ($1,562) $0 ($822)
Revenue Total $3,986,000 $3,519,174 $9,185,400 $7,150,331 $10,177,916 $8,896,419 $12,445,395 $10,494,391 $12,357,053 Expense Salaries $1,894,729 $2,055,981 $2,693,854 $2,638,658 $2,876,784 $2,833,079 $2,760,825 $2,895,550 $3,164,989 Fringes $490,930 $516,876 $531,136 $513,981 $706,662 $706,663 $883,250 $784,105 $948,619 Overhead $487,808 $358,592 $971,223 $613,254 $1,688,318 $1,151,846 $3,036,110 $1,536,601 $1,520,467 Professional & Special Services $30,000 $29,926 $2,887,941 $2,299,097 $2,602,535 $2,099,549 $3,510,537 $3,273,505 $4,079,835 Rent/Leases Equipment $284,024 $284,024 $280,131 $284,024 $284,024 Other Expenses $10,903 $10,820 $14,571 $28,953 Materials & Supplies $97,000 $96,043 $337,654 $183,322 $362,977 $308,128 $358,105 $332,528 $356,040 Workorders $270,357 Equipment $58,800 $0 $75,580 $0 $4,662 $0 $16,668 $16,338 Services of Other Dept. $165,000 $161,288 $258,336 $212,089 $386,158 $378,149 $371,087 $354,537 Facilities Maintenance $300,000 $300,000 $250,000 $202,514 $637,546 $310,401 $48,447 $48,447 Capital Reserve (APR) $251,364 $251,364 $251,364 Repayment to Open Space $329,080 $329,080 $935,420 $935,420 $1,417,075 Operating Transfer $461,733 $0 $997,139 $150,000
Expenditure Total $3,986,000 $3,518,706 $9,002,863 $6,812,915 $9,889,649 $8,411,739 $12,466,515 $10,741,372 $12,357,053 Surplus (Deficit) $0 $468 $182,537 $337,416 $288,267 $484,680 ($21,120) ($246,981) $0

National Golf Foundation Consulting, Inc. – City of San Francisco, California – 58
Fiscal Year 1999-00 marked the last year when system-wide rounds played showed an increase over prior year. All City golf courses, with the exception of Harding Park, had increased activity levels that year, while Harding Park experienced a slight decrease in the total number of rounds, from just under 86,000 in FY 1998-99 to approximately 85,000 in FY 1999-00. At the time, green fees were considerably lower at Harding Park than they are currently. Specifically, residents paid $17 weekdays and $20 weekends, while non-residents paid $26 and $31, respectively. These rates reflect the state of disrepair Harding Park had fallen into since its championship days, and were only marginally higher than those charged at Lincoln and Sharp.
• System-wide (excluding Gleneagles) rounds played fell by an extraordinary 125,598 between FY 1999-00 and 2005-06 – a decline of 37%. As we saw in the Competitive Golf Market section of this report, the overall regional municipal golf market saw an average per course decrease in activity of between 25% and 30% during this time.
• The renovation of Harding Park had an enormous impact on revenue growth, as system-wide revenues increased from about $5.1 million prior to the renovation, to $8.93 million (excluding GF transfer) in 05-06. Green fees accounted for $6.236 million of this total, while resident cards and concessions totaled $2.6 million.
• Harding/Fleming Park accounted for more than $5.96 million in revenue in FY 2005-06, including $4.14 million in green fees, or $58.49 total revenue, and $40.60 green fee revenue, per round. System-wide green fees were $6.236 million, or $28.77 per round. Total concession/resident card revenue was $2.6 million, including $1.82 million from Harding Park.
• The total expense budget for the entire golf system was about $3.4 million as recently has FY 2000-01. Expense growth to $10.74 million in FY 05-06, including $7.26 million at Harding ($935,000 payment to OS is included here). The cost of production per round in 05-06 was $49.56, up from about $10 in FY 99-00. The total expense budget for FY 2006-07 is $12.36 million, an increase of more than 15% over 05-06 actual expenses. This increase reflects a $482,000 increase in the payment to Open Space, but also includes an increase in professional services at Harding of more than $500,000 and an increase in salaries and benefits of $434,000.
• The Golf Fund cash flowed positively through FY 2003-04, when it netted $337,416. In FY 04-05, the Fund showed a $51,692 loss, excluding a transfer in from the General Fund of $536,372. Still, this year showed a small operating profit before the initial repayment to the Open Space Fund was made in the amount of $329,080.
• Operating losses grew in FY 2005-06, to nearly $880,000 (excluding a transfer in from the General Fund of $1.57 million), despite revenues of more than $8.9 million. The repayment to Open Space of $935,420 brought total losses to $1.815 million. The annual debt payment to Open Space will grow to more than $1.4 million through 2031.
• The cost of labor system-wide has increased from $2.78 million in 99-00, or $8.12 per round, to $5.5 million (including Kemper payroll), or more than $25 per round.

National Golf Foundation Consulting, Inc. – City of San Francisco, California – 59
Marketing There is very little marketing support from the City of San Francisco for the golf course operation as a whole, nor for any of the individual golf facilities. The RPD home page has a link to a page dedicated to golf. This golf home page in turn has a link for all of the City’s courses, as well a fee information page. (Marketing efforts on the part of the individual operators are covered in the Individual Facilities section).
At present there is no comprehensive marketing plan incorporating research, planning, strategy, market identification, budget, advertising, timetable, and follow-up. There does not appear to be a commitment to marketing. While this is typical in municipal golf, it is also deadly for a business that is competing head-to-head with privately owned businesses in a highly competitive field. Low marketing budgets are common at municipally run golf operations. Successful golf courses in the private sector typically allocate about 3%-5% of their revenue to marketing.
Golf Fees The system-wide fee structure is approved annually by the San Francisco Board of Supervisors. Year-to-year fee increases, except by special ordinance, are restricted to a percentage equal to the increase in the Consumer Price Index (CPI) for residents, and to two times the CPI for non-residents. Gleneagles, which is operated through a ground lease, is restricted to the language in its contract regarding the setting of fees. There is currently limited flexibility in the system to adjust fees seasonally or based on demand without council approval. This puts the City courses at a distinct competitive disadvantage compared to privately operated daily fee facilities as well as some other municipal golf courses, which are able to practice time-appropriate yield management.
Labor Expenses and Issues In addition to direct operating expenses for maintaining each facility (other than Gleneagles), the City of San Francisco has other direct expenses incurred, including costs associated with administrative services and materials/supplies. Overhead is charged to each facility based on the number of full-time equivalent maintenance staff assigned to that facility. Maintenance labor alone was nearly $3.7 million in FY 2005-06, and is budgeted for more than $4.1 million in FY 2006-07.
The City of San Francisco is maintaining their golf facilities with primarily unionized full-time employees. NGF Consulting is told that four labor unions – plumbers, engineers, teamsters, and gardeners – work on the maintenance crews. The City appears to have a generous benefits program, equivalent to about 30 percent of total salaries (does not included operations payroll at Harding Park). Also, staffing is constant throughout the year, and does not vary with play levels. One of the main benefits of using “seasonal employees” from the City perspective is savings on benefits.
• San Francisco’s cost to produce each round of golf is more than twice that observed for other California/National municipal golf systems profiled on page 46 of this study. The exception is Nassau County, which is producing rounds at about 58% of the cost that San Francisco is. These production costs are driven largely by the high cost of labor.
• Our regional overview revealed that labor expense per revenue dollar averaged $0.38 among seven municipalities reporting, compared to $0.62 for San Francisco.

National Golf Foundation Consulting, Inc. – City of San Francisco, California – 60
Secondly, San Francisco’s cost of production per round in FY 2005-06 was the second highest among the municipalities surveyed, at $45.24 per round. This figure will go up considerably for 2006-07, as the payment to the Open Space fund increases to $1.41 million and the budget at Harding Park increases significantly.
• The average number of full-time equivalent maintenance staff at those regional municipalities reporting was .59 per golf hole, nearly exactly what the San Francisco system is budget for. However, when considering actual staffing at City courses, the number for San Francisco drops to .49 per FTEs per 18 holes.
• Labor as a percentage of the total expense budget averaged 44.8% among the municipalities reporting. For those golf systems that were completely self-operated by the municipality, the average was 49%. San Francisco is at 56.2%.
These statistics would not be so telling if the San Francisco municipal golf courses were in better condition. However, with perhaps a couple of exceptions regionally and among the national golf systems we profiled, Lincoln Park and Sharp Park Golf Courses are in far worse maintenance condition than any of those we’ve observed (Appendix G).
NGF Consulting surveyed three high-end privately owned golf clubs in the San Francisco market to gain wage information for golf course maintenance workers. Though only a couple of position categories match exactly, the table below illustrates the disparity in the wage structures of the City workers and those at the subject privately owned clubs.
Wages
Position # Title Wage
Private Sector Wage
3422 Gardening Supervisor $33.09 3417 Gardener $27.22 $20.00 7355 Truck Driver $34.09 7328 Operating Engineer $39.22 7347 Plumber $41.99 7514 Laborer $26.30 $14.00 3436 Arborist $37.72 3424 Pest Control Specialist $33.09 7737 Machinist $40.42
Mechanic $25.00 Spray Technician $22.00 Foreperson $25.00
The issue regarding high labor expense structures is common with municipally owned facilities, and makes it more difficult to compete with private sector golf courses.

National Golf Foundation Consulting, Inc. – City of San Francisco, California – 61
Accounting Accounting and reporting procedures associated with oversight of the individual golf operations do not appear to be optimal. NGF Consulting was provided with several different sets of mismatched operating results and budgets from different sources, making it very difficult to ascertain what actual revenue and expense figures were at each course. Some operating information was reported to us on old-style computer ledger paper and, in some cases, revenue centers that were listed one month were gone the next. There were also differences between what the operators (at Golden Gate and Harding Park, for instance) reported for a given year and what the City reported. These inconsistencies are evident despite the vigorous reporting responsibilities of the operators, who report their obligations in this regard to be quite ponderous and time consuming. The lack of a system-wide point-of-sale (POS) system is undoubtedly contributing to accounting inconsistencies.
Another problem that is evident is the “gray area” (to quote one operator) about how maintenance salaries (including system-wide tree crew, etc) and overhead are assigned to each course. Based on the condition of the golf courses at Lincoln Park and Sharp Park, which NGF Consulting documents in this report, and despite having only 5 working gardeners each, Lincoln and Sharp Park were assigned $643,000 and $749,000, (as well as close to $200,000 each for allocated overhead) respectively, for maintenance labor and benefits in 2005-06. Our inspection of these facilities indicates that they have limited value to show for this money.

National Golf Foundation Consulting, Inc. – City of San Francisco, California – 62
Individual Facility Analyses HARDING PARK GOLF COURSE The Harding Park Golf Course includes the 18-hole Harding Park Golf Course, the Fleming 9-Hole Course, and a First Tee Learning Center. The 18-hole Harding Park Golf Course features four tee boxes on each hole and plays to 6,845 yards from the championship tees and 5,375 yards from the forward tees. Par is 72 from the Men’s tees and 73 from the Ladies tees. The 9-hole, par 30 Fleming Course plays to 2,165 yards for the men and 1,865 yards for the ladies. Both courses feature parkland settings with a very mature urban forest.
Harding Park GC Location and History
Harding Park GC History Located along Lake Merced, the land where these courses sit was once farmed. Soil conditions eventually made the land less desirable for farming at which time the land was placed under the jurisdiction of the Spring Valley Water Company. In 1922 work began to establish an 18-hole golf course along the lake. The golf course architect credited for the work is William “Willie” Watson, a Scottish emigrant who came to the United States in 1898. Watson arrived in the U.S. to assist Robert Foulis complete the Minikahda Country Club in Minneapolis, Minnesota. Foulis entered the golf by working at the Old Tom Morris Golf Shop in St. Andrews, Scotland. Foulis is considered a major influence on introducing golf to America from Scotland at the turn of the century in 1900.
In 1934, Jack Fleming, head of the City’s Golf Courses, undertook remodeling of the course in anticipation of the U.S. Public Links Championship in 1937. Significant changes were made, including changes to bunkers, tree planting, and addition of turf on the tees. In 1959, additional remodeling was undertaken to allow for a 9-hole course (The Fleming Course) to be configured within the 18 holes that made up Harding Park. The six practice holes that had been created in the original design, plus the practice area, were used to create the new 9-hole course.

National Golf Foundation Consulting, Inc. – City of San Francisco, California – 63
The 2003 Re-building Harding Park, including the Fleming Course, was completely re-built in 2003. The catalyst for this work was the very poor condition of the facility and the opportunity for the City to enter into an arrangement with the PGA TOUR to bring a pre-determined number of future TOUR events to the site. The 2005 AMEX Championship, featuring a playoff duel between Tiger Woods (eventual champion) and John Daly, was the first of these events. The continuation of this agreement is seen by some people that are heavily involved in the San Francisco Municipal Golf System as critical to the future marketing direction of the City courses, especially as it relates to branding the City as a “golf destination”.
Design work for the re-building was handled by the PGA TOUR. The golf course builder (contractor) was Landscapes Unlimited. The reported contract amount for golf course improvements was $7.3 million. This was for construction work only and did not include the clubhouse, turf eradication, tree work, or the First Tee Facilities.
The requirements of the PGA TOUR seem to have been given greater weight in the reconstruction than were preserving the historical qualities of the existing golf courses. While both courses were reported to be in terrible shape and literally “falling apart”, there were certainly features resilient in the facility from its original design. A review of the changed course and construction approach shows that virtually none of the classic era golf features were preserved, nor were any efforts taken to restore features. Rather, Harding Park and The Fleming Courses were completely re-built. Only the routing (layout) endures, and even it was significantly adjusted in the effort.
Inventory of Facilities In addition to its two golf courses, the Harding Park Complex includes a driving range, First Tee learning center, clubhouse/pro shop, maintenance facility, and on-course beverage carts. On-course restrooms take the form of dilapidated temporary structures. Food and beverage service is provided by the Grill & Bar located within the clubhouse at Harding Park.
Regulation 18-Hole Course The Harding Park Golf Course plays to roughly 5,375 yards from the forward tee to a back tee (tournament) length of more than 6,845-yards. Par is 72 with ratings from 68.0 to 72.8 (men’s). The slope ranges from 120 to 126. The predominant features include the towering Monterey Cypress trees and the nearby presence of Lake Merced. Harding’s strategy and character have been substantially enhanced with the inclusion of several carefully placed bunkers and re-contoured green complexes. The addition of multiple teeing surfaces provides the course the flexibility to offer distinct playing characteristics that will challenge every golfer, from beginner to the most skilled player.
9-Hole Fleming Course The Fleming Course offers a 9-hole “short-course” for golfers seeking a shorter and simpler round of golf. The course plays to 1,865 yards for ladies and 2,165 yards for men. The design is simple with few hazards and or special design features of any kind. The course matches the regulation 18-hole course at Harding with tree-lined holes and beautiful vistas.
Practice Facilities Existing practice facilities include a small, netted full driving range, the First Tee area and a few practice putting greens. One practice putting green forms a large lawn immediately adjacent to the existing clubhouse. This establishes a pleasant entry experience as one comes onto the property.

National Golf Foundation Consulting, Inc. – City of San Francisco, California – 64
Practice range and First Tee driving range
Clubhouse The clubhouse is a new, bi-level construction that was developed in conjunction with (just after) the 2003 renovation. The clubhouse consists of two full levels, plus a basement. The ground level houses a pro shop, main dining area, kitchen, restrooms and the ‘Lakeview Terrace Room’ (used by PGA TOUR as a lounge during the tournament). The upper level includes additional restrooms, offices and meeting space. Banquet capacity is 70-80 upstairs, and up to 150 in the Cypress Room. The dining area is capable of hosting up to 140 - 150 patrons at a time and is often used for events and parties.
Golf Course Physical Review The purpose of evaluating the physical aspects of the City’s golf courses is to address, on a “global basis”, the fundamental conditions and issues associated with each property, and to establish a baseline for where these golf courses stand today. We can then provide direction on goals, priorities and approaches that should be considered by the City as it makes parallel decisions on matters pertaining to management, operation and potential restructuring of its golf program.
It is essential to think of each of the City’s golf course property as an asset. Together, the courses form a collection of assets that may be marketed, used and enjoyed by residents and visitors. Ideally, golf courses are always in excellent condition and there is always a well-crafted plan for future improvements. In reality, this not always the case, as golf course owners and managers get sidetracked. These essential ingredients must be continually addressed and revisited. If properly maintained and upgraded, these golf courses have the potential to reclaim their previous stature and comprise an outstanding municipal golf system befitting the beautiful City of San Francisco.
Method NGF Consulting utilized the services of golf architect Forrest Richardson, a member of the American Society of Golf Course Architects (ASGCA) to assist with the physical evaluations of each City golf course. Mr. Richardson has completed golf course projects in the Bay Area and is currently overseeing large restoration/renovation projects involving Bay Area microclimates and similar turf issues. Additionally, Mr. Richardson is the author of two books on golf course architecture, including an extensive work, Bunkers, Pits & Other Hazards (John Wiley & Sons, 2005), in which he includes significant perspectives on classic era golf course design, restoration, renovation and maintenance issues associated with older golf courses.

National Golf Foundation Consulting, Inc. – City of San Francisco, California – 65
The method for evaluating all of the facilities involved physical tours of each City golf facility and interviews with key staff charged with caring for and operating the properties. Additional data, both provided by the City and secured independently, was used to ascertain the configurations, general maintenance activities and limitations of each facility. In some cases other interviews are conducted with golf course builders, golf course design professionals previously involved with the courses, and governmental agencies that have oversight or jurisdiction.
Findings are compared to similar courses and operations that have been observed both recently and over the last 15+ years by Mr. Richardson and NGF Consulting, and conclusions are made regarding the relative maintenance condition of the subject courses. Maintenance staffing recommendations that are made for each facility are based on factors unique to each course, such as configuration, layout, turf acreage, expected use levels, and not based on any ‘industry standard.” Please reference the many pictures contained in Appendix G that support the conclusions made in this section.
Recommendations are derived that balance goals and objectives with reasonable expectations for improvement and/or preservation of each golf course asset. It is typical that recommendations are prioritized, but in some cases it may not be possible to determine a priority without further study. Without specific study and preparation of detailed plans it is not possible to accurately arrive at final cost estimates for improvements to golf courses. Therefore, any estimates given should only be considered as general ranges for use in planning and budgeting. This methodology is used in the NGF Consulting physical review of all five of the City’s municipal golf courses.
General Condition of Harding Park Courses Overall, maintenance appears good at the two courses. When the level of staffing and residual problems from re-building are considered, the golf courses are in decent shape and very playable. Green conditions, a major factor in customer satisfaction, are very good. The primary concern with maintenance at this facility primarily relates to the 2003 renovation, which included an approach to remove all existing turf by scraping off a significant layer of upper soil, bury this soil in deep pits, and plate the golf course with sands and soils excavated from these pits and other areas. Only at tree lines (predominantly lining fairways) were grades to be retained. This was to preserve many large trees and the lined effect.
In reviewing topsoil management procedures it became clear that the effort to re-build the courses assumed that deeper soils were of sandy quality, typically a beneficial soil type for growing turf. However, since there was no specific requirement or specification for managing earthwork, these sandy soils became mixed with other soils and pockets of less suitable soils are likely to have become mixed with this blend. The result: A hodge-podge of soils was developed at the golf courses. Currently this poses problems to turf care and may contribute to drainage woes.
A major budget crisis erupted during construction when drainage sumps dug to handle water drainage failed. A major drainage effort needed to be re-planned and constructed in order to preserve the work done and render the courses acceptable for growing turf and operation. A large drainage field was excavated and established. Drainage lines from areas of the course were connected to this field and the original sump design was scrapped. Other problems resulted from heavy rains (late 2002 and winter 2003) that washed away excavated soils into Lake Merced. This event — termed a landslide – was a catastrophic environmental event that clouded the high profile project before it was completed.

National Golf Foundation Consulting, Inc. – City of San Francisco, California – 66
Specific Golf Course Issues NGF Consulting has identified several specific issues with the physical condition of the Harding Park Golf Course that may need to be addressed in the coming years. These include the following:
Soil Types (Resulting from Topsoil Management) - During re-construction, golf industry best practices were not used in topsoil management. The result has been difficult turf management, irrigation inconsistency and problems with drainage. While this is being handled by the present maintenance staff, it has prompted additional cost to the City. An aggressive program to topdress fairways is being implemented to even out the conditions. Of concern with this effort is the addition of organic material that the City reported is being added to the topdress mix. This may be counterproductive. Scrutiny is essential in order to mitigate this situation caused by a lack of topsoil management and to ensure that the topdress mix is well thought out.
Kikuyu Grass Infestation - Kikuyugrass (Pennisetum clandestinum) is re-establishing itself at an alarming rate. While staff controls the infestation, it may prove too overwhelming if large areas are allowed to go uncontrolled. A specialized management plan needs to be created that shows effective control and establishes a baseline budget for implementation.
Artificial Turf Decline - The artificial turf installed at practice and First Tee areas is showing decline, primarily in respect to weed infestation. Some hitting areas are worn and not up to standards for practice. NGF Consulting understands that this is the responsibility of the First Tee, and should be addressed with the contractor/manufacturer and implement a plan for on-going weed control.
On-course Facilities - Rest Room facilities and drinking water were not facilitated in the major re-construction effort. These facilities are much needed to complete the transformation of the Harding Park Golf Facility and there is infrastructure available to add these facilities.
Poor condition of on-course facilities, drainage problems
Drainage - New (additional) drainage is needed in numerous areas to relieve wet conditions. Of course, it is customary that even the most well-planned renovation/remodeling requires ancillary drainage and irrigation measures afterwards. Drainage along paths, gradual areas and shady areas would benefit from new drain lines connected to the master drainage system. The correct method of this evaluation is to engage an independent golf course construction consultant to prepare findings. Should the system not be adequate, or prone to failure, the City will have no choice but to invent in retrofitting and additional improvements.

National Golf Foundation Consulting, Inc. – City of San Francisco, California – 67
Safety - The proximity and configuration of the practice area needs to be addressed with respect to conflicts between golfers and range users.
Maintenance Approach/Staffing Harding Park is being maintained by a reported 24 employees, including the Supervisor, a mechanic, 3 truck drivers, a plumber, an operating engineer, and 17 gardeners (Total staff recommended by the PGA TOUR is 36). The staff falls under the same labor union that manages non-golf city parks; therefore, categories of employees are non consistent with standard golf industry nomenclature or organization. For example, only certain employees may operate certain equipment. Irrigation must be handled by “plumbers”, who are not allowed to perform other functions.
Note is made that the PGA TOUR has recommended a total staff of 36 for Harding Park’s 27 hole operation. Considering the issues noted and the need for increased maintenance activity before and after PGA events, this recommendation seems appropriate. An alternative solution would be to engage temporary labor at these times. However, there appears to be an obstacle to temporary labor.
A review was made of requirements of the PGA TOUR with respect to maintenance procedures and plans. Absent a detailed review of maintenance procedures, it does appear that the City is meeting the general intent of PGA requirements, and mowing protocols seem in line with the suggestions of the PGA. Because the Harding Park Course has mostly naturalized areas of rough and tree canopy, PGA requirements concerning ornamental planting areas and beds do not seem to apply. The requirement for aerification and topdressing appears to be met based on the overview meeting held with the maintenance staff. In order to address specific areas of the PGA requirements an in-depth assessment of maintenance practices would need to be undertaken.
It was reported that the Harding Park facility, according to agreements with the PGA TOUR, is to receive agronomic oversight from the current management company, Kemper Sports Management. Such oversight, with corresponding budgets, planning and commitment, would be very beneficial to Harding Park.
Other Observations Reclaimed water is potentially a future consideration for Harding Park’s irrigation needs. However, there appears to be no solid plan in effect to begin planning for this likelihood. It is unclear whether the irrigation system as installed would require significant retrofitting, or whether measures would need to be taken to isolate additional drainage fields from Lake Merced. (Lake Merced is a source of emergency drinking water for the City.) Such comment is made so these potential issues may be evaluated and integrated to further planning.
Pesticides and herbicides are significantly limited within the City of San Francisco. The City’s tight control exceeds U.S. Federal requirements in several areas. This places a hardship on the effective operation of golf courses in controlling weeds and pests. While strict control is desirable, the level of control thwarts many “best practice” approaches used throughout the golf industry, even in highly sensitive environments. The City’s Integrated Pest Management (IPM) program makes it very problematic to rid courses of English Daisy and other weeds. Ground burrowing mammals are also left uncontrolled except for trapping methods.
Specific Physical Recommendations The specific NGF Consulting recommendations for optimizing the physical condition of the Harding Park Golf Course facility are presented in the Recommendations section of this report.

National Golf Foundation Consulting, Inc. – City of San Francisco, California – 68
Operations Overview As noted above, Harding Park is being maintained by a reported 24 employees. Kemper Sports Management’s full-time staffing is summarized below. It should be noted that the City requires the management company to comply with certain wage and benefit provisions (such as minimum hourly wage) required for City contractors, though the ultimate expense flows through to the City.
Staffing - Kemper Kemper has reported the following full-time staff to NGF Consulting. (All other labor is reported to be part-time in nature):
• Vacant General Manager (is budgeted for FY 06-07) • Vacant Director of Golf (also budgeted) • Property Controller • Event Sales Director (Tournament Sales) • Assistant Golf Professional • 5 Pro Shop Counterpersons • Building Maintenance Supervisor • Food & Beverage Director • Assistant F&B Director • F&B Supervisor • Catering Coordinator • 7 other full-time workers in kitchen
It is apparent that Harding Park has a large payroll, even by the standards of premier municipal golf facilities across the nation that we profiled in a previous section of this report. Obviously, City labor laws contribute to the high expense, but there are areas where NGF Consulting is concerned that the operation is top heavy. The food & beverage operation, for instance, has a payroll of nearly $500,000, yet is producing only about $740,000 in gross revenue (compare Sharp Park’s ($1,000,000+ in F&B revenues). Secondly, it seems that the responsibilities of the three top management positions could be combined into two positions (as noted, two are actually vacant currently). It is the consultants’ understanding that the cumbersome reporting function to the City is one of the reasons for three management positions.
Staffing Issues There are no industry standards that can be referenced to determine the appropriate staffing levels for a golf operation. The number of staff needed for a particular golf operation depends on several factors. In the total United States, municipal golf facilities with a 10 to 12 month golf season average 15.3 employees per 18-hole facility, and all golf courses with golf revenue in excess of $1.0 million average 17.3 employees per 18-hole facility in 2005. Some factors influential in determining appropriate staff:
• The average number of rounds a facility plays each day.
• The types and level of player services provided by the facility.
• The number and size of tournaments and outings or other special events a facility accommodates each day, week or month.

National Golf Foundation Consulting, Inc. – City of San Francisco, California – 69
• The physical layout of the facility.
• Training and experience of the employees.
• Level of management supervision.
Personnel costs typically represent the largest single expense item in a golf course operation, and this is the case for Harding Park Golf Course. Therefore, an analysis of these costs is essential to understanding the financial performance of the City of San Francisco golf operation.
The NGF review of municipal golf operations nationwide in 2005 revealed the following averages for full-time staffing at 18-hole municipal golf courses nationwide:
U.S. Averages Distribution of Staffing – Full-Time (Year-Round)
If the Season is If Total Revenue is
U.S. 10-12 mos. <10 mos. Below $1.0
mm Above $1.0
mm Course Maintenance 7.4 8.0 6.7 7.1 8.0 Golf Operations 3.3 4.5 2.2 2.9 5.5 General & Administrative 1.3 1.2 1.4 1.1 1.2 Food & Beverage 1.3 1.6 1.1 1.7 2.6 Other 0.0 0.0 0.0 0.0 0.0 Total 13.3 15.3 11.4 12.8 17.3 Source: Operating & Financial Performance Profiles of 18-Hole Facilities in the U.S. – 2005 Edition, National Golf Foundation
We see that Harding Park has more considerably more staff than the U.S. average, although the amount is not out of line when you consider there are 27-holes (+ First Tee), the size of the revenue and expense budgets (also much higher than U.S. average), the administration required to manage the facility and the fact the course is hosting professional championship events.
Management Agreement with Kemper Sports Management This management agreement between the City and County of San Francisco (City) and Kemper Sports Management-Harding Park, LLC (Manager) was dated April 1, 2003. The term is for seven years from July 1, 2003 through July 1, 2010. Parties may negotiate to extend the agreement for two years. City pays Management $192,000 annually at $16,000 per month. Security deposit or surety bond of $100,000. A pre-opening consulting fee of $10,000 per month plus expenses was paid by City to Manager from March 1, 2003 through opening day.
Manager receives reimbursement from City for operating expenses.
Incentive fees paid by City to Manager after the end of each anniversary date of the initial term of the agreement are 5% of gross revenues exceeding $6,000,000 in any fiscal year.
Under specified guidelines, the Manager is entitled to compensation for additional services required by the City that increase personnel costs above standard staffing levels. The City will pay payroll and benefit expenses plus a management fee of 10% of such payments. Approval required for additional funding.

National Golf Foundation Consulting, Inc. – City of San Francisco, California – 70
Manager supervises all golf activities that comprise the day-to-day business operation of the 27-hole course. Manager maintains structures, grounds, parking lots, and walkways. City maintains the golf course. Manager is required to enter into a separate agreement with The First Tee local chapter to accommodate all First Tee activities.
Manager will meet all requirements of hosting the PGA TOUR tournament events (entering a separate agreement with the TOUR subject to approval by the City).
Manager must employ a Director of Agronomy to work with the City’s Superintendent of Golf Course, the PGA TOUR, and the USGA. Manager will enter into a separate agreement with the USGA for agronomy services.
Manager’s Director of Agronomy. Manager shall designate one of its employees to serve as a liaison to City’s Director of Golf and superintendent of the golf courses regarding maintenance of the property by the City’s maintenance employees.
• Qualifications. Have thorough knowledge of general business administration practices and golf
course operations practices and procedures as would be acquired through a minimum of five years of similar golf course maintenance experience in progressively responsible positions.
Prior supervisory experience required and working knowledge of golf course operations, turf management and practices necessary.
Credentials subject to the approval of the PGA TOUR. If the Manager of Operations meets the qualifications, he or she may also serve as
the Director of Agronomy.
• Duties. Work closely with local tournament personnel and with PGA TOUR staff to prepare
for successful tournaments and events. Provide periodic written reports and evaluations of the courses’ conditions to the
PGA TOUR as directed by the City or as required under the Tournament Agreement with the PGA TOUR.
Develop strategies for achieving the course conditions described in the Master Tournament Agreement with the PGA TOUR.
Meet at least on a weekly basis with the City’s Director of Golf and Superintendent of the property.
Review USGA reports obtained according to the contract between the Manager and the USGA and discuss any problems cited in such reports
Propose and discuss plans for addressing those problems with the City’s representatives at the regular meetings.
Consult with the USGA’s Agronomist on a regular basis and discuss any concerns and possible remedies for such concerns with the City’s representatives.
In conjunction with the City’s Director of Golf and the USGA’s Agronomist, the Director of Agronomy shall also develop and provide periodic training programs for City’s employees.
City agreed to construct a new clubhouse “shell” and bear sole cost and expense of pre-opening, marketing, design, and construction. Manager is responsible for designing and

National Golf Foundation Consulting, Inc. – City of San Francisco, California – 71
installing a temporary clubhouse facility as well as designing, purchasing, and installing interior furnishings and equipment for the new clubhouse.
Manager was to take out a two-part loan. Trache 1: for pre-opening costs and expenses in the amount of $800,000 to $1,000,000 to be repaid by City to Manager, amortized over the first 48 months of the initial agreement, as part of Operating Expenses. Trache 2: for improvements to the clubhouse, not to exceed $1,000,000, to be repaid by City over the remaining period of the agreement. No more than $1,000,000 may be outstanding principle at any one time. Provisions are included for default by either party.
++++++++
Approval papers for lease for establishing and operating a professional golf shop at the Harding Park Golf Course between California Golf Center, Inc. and the Recreation and Park Commission. Approved April 18, 1983. No lease attached.
Marketing Issues The overall San Francisco area golf market has become much more competitive over the last decade, and Harding Park has been affected in its ability to maintain rounds activity levels of past years (more below), at least partly due to much higher price points. NGF Consulting has observed that despite these declines the City of San Francisco has not been active in attempting to attract additional players to the Harding Park facility. It seems the City and Kemper have been largely reliant on the associated publicity and afterglow of the AMEX Championship as its chief marketing tool, with some other limited marketing activities such as promotions with the Convention and Visitors Bureau, CD and other advertising, including with United Airlines.
Website The major marketing push lately has been the creation of a website that was built and managed by Cyber Golf for Kemper Sports - www.harding-park.com. The golf course operator pays for the website as part of the pass-through operating expense and maintains it, and has been using it to build up an email database in conjunction with the website to be used for marketing purposes. In general, we found the website to be well designed and functional. We particularly like the up-to-date rates and tee time information. Also, a website is extremely useful when people can find it easily. When we searched with Google and Yahoo, this website (or the City’s) comes up as one of the first 10 listings under “San Francisco golf,” but not “Bay Area Golf.”
New Players It is our understanding that many other golf courses in the region are becoming more aggressive in their efforts to attract new players using beginner programs, lessons, golf schools, tournaments/outings, leagues, and clubs. Rather than waiting for potential customers to contact the course, many courses find it is more productive to actively seek out new players in various ways ranging from price discounts to value-added specials to innovative pre-paid arrangements. While this may not be an issue for the Harding Park operation, NGF Consulting will address it in greater detail with regard to Sharp Park and Lincoln Park.
Market Draw As would be expected of a course of Harding’s caliber, it draws from a much wider market area than do the other City courses. However, NGF Consulting’s analysis indicates that a relatively small percentage of play is coming from players that do not reside in northern California. Rounds played information supplied to us indicates that, prior to the Bay Area, and then Northern California, rates being implemented, actual rounds played from non-City residents was less than 30%. Since these rates were implemented, it has become apparent that less than 15%

National Golf Foundation Consulting, Inc. – City of San Francisco, California – 72
of rounds are being produced at the highest non-resident rates. (Please refer to the customer origin map in Appendix F to this report).
Fee Structure A special ordinance by the Board of Supervisors raised Harding Park’s and Fleming’s green fees to the highest level ever. In the first two tables below we list the current green fees; the second set of tables shows the fee trend over the last few years. (Please note that the Northern California Rate, which applies to residents of 43 counties, superseded the Bay Area Rate).
Harding Park Golf Course Fees include cart: Weekday Weekend Standard $135 $155 Northern California Resident $89 $99 Tournament $115 $135 Twilight-Standard $105 $125 Twilight-Northern California $69 $79 Off Season/Aerification-Standard $115 $135 Off Season/Aerification-No. Calif $79 $89 Off Season/Aerification-Tournament $100 $115 Fees do not include cart: San Francisco Resident $46 $59 San Francisco Resident Senior $31 $59 San Francisco Resident Junior $15 $20 Twilight-San Francisco Resident $35 $44 Super Twilight $45 $55 Northern California: Alameda, Contra Costa, Marin, San Mateo, Santa Clara, Santa Cruz, Solano, Sonoma, Del North, Siskiyou, Modoc, Humboldt, Trinity, Shasta, Lassen, Plumas, Tehama, Mendocino, Lake, Glenn, Butte, Sierra, Colusa, Sutter, Yuba, Nevada, Placer, Napa, Yolo, Sacramento, El Dorado, San Joaquin, Amador, Alpine, Calaveras, Stanislaus, Toulumne, Mariposa, Monterey, San Benito, Merced, Fresno, and Tulare counties Off Season is from December 1 to the last day of February. Aerification is from the first day that major greens aerification starts until 7 days after completion
Fleming Golf Course
Weekday Weekend Standard $25 $30 San Francisco Resident $20 $22 San Francisco Resident Senior $14 $19 San Francisco Resident Junior $10 $13 Tournament $30 $41 Replay $11 $11
Weekday = M-Th; Weekend = F-Sun

National Golf Foundation Consulting, Inc. – City of San Francisco, California – 73
Harding Park Fees (Weekday/Weekend) 2004-05 2005-06 2006-07
Resident $33 / $46 $35 / $48 $46/59 Non-resident (standard) $78 / $90 $125 / $138 $135 / $155 Senior $20 / $46 $21 / $48 $31 / $59 Bay Area/ No. Calif. N/A $82 / $94 $89 / $99 Resident Twilight $24 / $32 $25 / $34 $35 / $44 Non-resident Twilight $57 / $68 $80 / $92 $105 / $125
Fleming Fees (Weekday/Weekend) 2004-05 2005-06 2006-07
Resident $16 / $18 $17 / $19 $20 / $22 Non-resident (standard) $18 / $23 $22 / $27 $25 / $30 Senior $10 / $15 $11 / $16 $14 / $19
As the tables indicate, Harding’s resident walking fees have gone up 39% on weekdays and 28% on weekends since 2004-05, while non-resident rates (include cart) have gone up by more than 70%. Senior resident rates have increased by 55% on weekdays and 28% on weekends.
Though Harding Park is certainly a premier facility and has developed some brand equity due to the publicity surrounding the renovation and the AMEX Championship, activity levels over the course of FY 2006-07 bear close watching. These fee increases will be a good barometer of the price elasticity of demand at Harding Park.
Note: Other observation regarding the green fees for Harding and Fleming, in relation to the competitive market and some premier national municipal comparables, are contained in the ‘Competitive Golf Market’ section of this report.
Golfer Survey Distribution of NGF’s Golfer Survey Program was by means of an e-mail distribution to a proprietary NGF database of San Francisco golfers, as well as a distribution of paper surveys at each City course, and a posting of the survey’s master link on the RPD website. A complete listing of results from the survey is provided in a separate GSP Appendix Book. This appendix book will also include key definitions, and an explanation of how grades are established.
Harding Park 18 During the course of this consulting effort, NGF implemented our Golfer Survey Program (GSP) at Harding Park to gauge opinions from the facility’s golfers. NGF Consulting recognizes that this survey was conducted with current golfers at the facility and is limited in that former and infrequent players at the City golf course may not have been surveyed. Still, a total of 435 surveys were collected by NGF, with 211 completed by those identifying themselves as City residents. The ratings from the total survey group are displayed in the following table.

National Golf Foundation Consulting, Inc. – City of San Francisco, California – 74
Harding Park Golf Course
435 Responses 11/14/2006 – 1/8/2007
Factor
Average Score
(Scale 1-5) 6-Scenery and Aesthetics of Course 4.5 2-Convenience of Course Location 4.0 4-Overall Course Conditions 4.0 5-Condition of Greens 3.9 13-Overall experience 3.8 9-Amenities (clubhouse, pro shop, locker room) 3.6 8-Condition of Golf Cars 3.5 10-Friendliness/Service of Staff 3.5 1-Overall Value of Course 3.3 11-Food and Beverage Service 3.2 7-Pace of Play 3.0 12-On-course Services (restrooms, drinking water) 2.9 14-Affordability 2.7 3-Tee-time Availability 2.4
Average Score: 1 = very dissatisfied; 2 = somewhat dissatisfied; 3 = neither satisfied nor dissatisfied;4 = somewhat satisfied; 5 = very satisfied
Other Findings 1. Harding Park golfers that responded to the survey rated the facility relatively high on the
measures of scenery and aesthetics of course, convenience of location, and overall course conditions. The key business drivers on which Harding Park fared the poorest were tee time availability, affordability, on-course services (such as restrooms), pace of play, food and beverage service, and overall value of course. Though ratings on several key business drivers, such as overall experience and friendliness/service of staff, were relatively low compared to national benchmark data, the absolute ratings for these measures did not illustrate overall dissatisfaction among the survey group.
2. Our surveys also show a wide variety of other golf courses that are also played by Harding Park golfers. The Presidio and Half Moon Bay are the most popular local facilities with this group, in addition to many other area golf facilities both public and private (consistent with lower loyalty).
3. The profile of the Harding Park golfer is predominantly male (92%) and somewhat younger (52% between 30-45) than the national benchmark. One key finding was only 2% of survey respondents were out-of-state visitors, indicating a potential opportunity for the facility to grow activity in this potentially lucrative market. The map displaying the origin of customers is displayed in Appendix F to this report.
4. The survey indicated that 67% of respondents think that the overall quality of the City’s golf courses would improve if oversight and management of the golf system were not the City’s responsibility. Among the comments noted on this question were that golf is not a priority for the city, the courses are being neglected, the City “handcuffs” operators and the City does not respect the golf courses as a true City resource. The survey group

National Golf Foundation Consulting, Inc. – City of San Francisco, California – 75
tends to believe that professional management with golf knowledge and experience would improve the golf courses.
5. City residents tend to be a little more loyal (loyalty index = 19%) and rate the golf course slightly higher than non-residents (loyalty index = 5%). The City residents who filled out the survey are slightly younger and report slightly lower incomes than the non-residents. Overall, the grades and importance factors tend to be roughly the same between the two survey groups.
6. Survey respondents were also asked to voice their opinions in an open-ended comments section that was part of the survey. Among the most common points raised include the need for a computerized (on-line) tee-time reservation system, quickening the pace of play, more on-course restrooms and drinking fountains, and better training for pro shop staff. Some golfers also noted that the restaurant is not open for breakfast when they arrive for early tee times.
Fleming 9-Hole GSP was also implemented period at the 9-hole Fleming Course. A total of 72 surveys were collected by NGF, with 48 completed by those identifying themselves as City residents. The ratings from the total survey group are displayed in the table below.
Fleming 9-Hole Golf Course 72 Responses
11/14/2006 – 1/8/2007
Factor
Average Score
(Scale 1-5) 2-Convenience of Course Location 4.3 6-Scenery and Aesthetics of Course 4.3 5-Condition of Greens 4.1 4-Overall Course Conditions 4.1 13-Overall experience 4.0 3-Tee-time Availability 3.9 9-Amenities (clubhouse, pro shop, locker room) 3.9 10-Friendliness/Service of Staff 3.8 1-Overall Value of Course 3.7 8-Condition of Golf Cars 3.5 14-Affordability 3.4 11-Food and Beverage Service 3.3 7-Pace of Play 3.2 12-On-course Services (restrooms, drinking water) 3.0
Average Score: 1 = very dissatisfied; 2 = somewhat dissatisfied; 3 = neither satisfied nor dissatisfied;4 = somewhat satisfied; 5 = very satisfied
Other Findings It appears that the Fleming golfers completing the survey shared some of the same concerns as noted for the Harding 18. The pace of play, food and beverage service, and on course services were rated below average. Course conditions and overall value were rated higher, with improvement still needed in overall course conditions. Fleming golfers were only slightly younger (60% under 50) and more apt to be female (15% female). Fleming golfers were also much less likely to believe that the overall quality of the City’s golf courses would improve if oversight and management of the golf system were not the City’s responsibility (58% say City

National Golf Foundation Consulting, Inc. – City of San Francisco, California – 76
should run). Among the comments related to this question was a concern that outside management would not invest in the Fleming Course and focus only on Harding. In open-ended comments Fleming golfers noted their appreciation of the 2-hour round of golf and the appeal to beginners and other less-skilled golfers.
Facility Performance and Data Analysis The City of San Francisco has supplied the consultants with a variety of documents and reports on the activity and economic performance of the Harding Park Golf Course facility. The performance data for the golf operation have been analyzed in the following paragraphs.
Activity Levels The Harding Park Golf Course maintains a relatively high level of rounds activity, with both the 18-hole regulation and Fleming 9-hole courses exceeding national municipal golf course standards. However, NGF Consulting does note that overall activity at this facility has fallen from its FY2000 high of 145,000+ rounds down to just under 102,000 rounds in FY2006 (decline of 30%). NGF Consulting notes that FY2006 featured a very rainy spring and the American Express Championship (AMEX) that involved either closing the course entirely or restricting play for several weeks. Early indication for the first quarter of FY2007 shows increases in September and October of 2006, particularly in non-resident and tournament play.
Harding Park Golf Course
Rounds Played Fiscal Years 2000-2007* FY 1999-00 FY2000-01 FY 2001-02** FY 2004-05 FY 2005-06 FY 2006-07*
Rounds - Harding 87,085 82,675 82,992 71,425 60,464 31,024Rounds - Fleming 58,017 46,751 46,755 45,456 41,502 23,196Total Rounds Played 145,102 129,426 129,747 116,881 101,966 54,220
Source: City of San Francisco. *First 6 months of FY07. **July 1, 2001 – May 27, 2002.

National Golf Foundation Consulting, Inc. – City of San Francisco, California – 77
Harding Park Golf Course
Rounds Played by Type – FY2005-06 2004-2005 Weekday Weekend Total Standard 7,766 8,132 15,898 Resident 13,022 14,279 27,301 Senior 9,588 409 9,997 Junior 358 353 711 Tournament 2,505 3,201 5,706 Hotel 269 7 276 Club 0 1,162 1,163 Twilight 0 Standard 1,741 1,242 2,984 Resident 3,968 3,421 7,389
Total 39,217 32,206 71,425 2005-2006* Weekday Weekend Total Standard 2,200 2,178 4,378 Standard-O/S, Aerate 195 158 353 Bay Area 9 County 1,736 1,437 3,173 Bay Area 9 County-O/S, Aerate 493 769 1,262 Resident 7,045 8,646 15,691 Senior 5,419 406 5,825 Junior 266 337 603 Tournament 2,008 2,054 4,062 Tournament-O/S Aerate 462 462 Club 725 725 Twilight 0 Standard 437 333 770 Bay Area 9 County 548 402 950 Resident 2,138 2,026 4,164 Total YTD 22,485 19,933 42,418
Source: City of San Francisco. * For 9 months ending 3/31/2006
Capacity Issues A golf course’s theoretical capacity can be determined mathematically by multiplying the number of available tee times (utilizing only the first tee as the starting hole) in an hour by the number of hours of daylight, minus two hours, multiplied by the maximum number of players in a group, usually a foursome. A more realistic measure, a golf course’s actual capacity takes into account the loss of tee times for weather, unplayable conditions, cancellations, no-shows, groups of less than four players, and other reasons a golf course would never actually play the theoretical capacity such as a desire to maintain conditions (as with the 18-hole course at Harding Park).
The actual capacity for a given course is difficult, if not impossible, to calculate because most courses differ in physical characteristics and management procedures. For example, a course that has paved cart paths and good drainage can quickly resume play after a heavy rain, whereas a course that does not have paved cart paths and/or has poor drainage may have to suspend play for several hours or the entire day. In the San Francisco, California area the 18-hole municipal golf courses have demonstrated activity in the 90,000+ rounds per year range on 18 holes (theoretical capacity), but the actual capacity of the area’s 18-hole golf courses is more

National Golf Foundation Consulting, Inc. – City of San Francisco, California – 78
realistically closer to 70,000 or 80,000 rounds annually. Harding Park had been operating at close to full capacity prior to the renovation; ideally, however, a course at Harding Park’s high price points, from a conditioning and pace of play perspective, should probably target maximum rounds played levels of about 70,000.
Revenue Analysis NGF Consulting has reviewed the financial statements in detail and has made comparisons to the rounds activity reports. The following tables summarize the Harding Park GC revenues for the past two full fiscal years, with a partial year in early FY2007. Overall, the data shows a relatively consistent level of revenue performance since the renovation with total top-line revenues expected to exceed $6.0 million in FY2007. As shown previously, this revenue production is very strong in comparison to other public golf operations nationwide.
Of particular note is the considerable increase in ancillary revenue coinciding with the addition of the new clubhouse at Harding Park. This served to triple food and beverage revenue, and nearly double the revenue from merchandise sales. Range revenue has also increased considerably in the last two years and the data shows all ancillary revenue centers up substantially in the first quarter of FY2007.
City of San Francisco Harding Park Golf Course Revenue (2004-2007*)
FY 2001-02** FY 2004-05 FY 2005-06 FY 2006-07*Green Fees - Harding $1,284,758 $3,589,364 $3,419,325 $2,038,794 Green Fees - Fleming $396,844 $732,779 $721,093 $467,167 Total Green Fee Revenue $1,681,602 $4,322,143 $4,140,418 $2,505,961
Cart Fees - Harding $174,888 $250,256 $222,195 $70,645 Cart Fees - Fleming N/A $20,335 $19,311 $10,290 Food & Beverage N/A $212,464 $737,743 $476,510 Pro Shop $22,764 $238,100 $423,053 $197,436 Range $58,413 $216,843 $270,762 $132,554 G&A N/A $131,372 $150,671 N/ATotal Concession $271,733 $1,069,370 $1,823,735 $887,435
Total Revenue $1,953,335 $5,391,513 $5,964,153 $3,393,396
Source: City of San Francisco and Kemper Sports. *Through -12/31/06 (6 mos.). ** July 1, 2001-May 27, 2002
Harding Park Golf Course revenue is derived primarily from golf fees and the concession income as shown above. The average green fee revenue per round of golf increased by approximately 10 percent from FY2005 to FY2006, while overall facility revenue per round grew at 26 percent over the same period due of course to the opening of the new clubhouse. The data shows the significant impact on total facility revenue resulting from the renovation of Harding Park back in 2002. Total revenues have more than tripled from about $2 million to $6.6 million, as has total and green fee revenue per round. The first six months of FY2006-07 show considerable increases in revenues and revenue per round as new increased green fees have taken effect. Average revenue per round estimates are displayed below:

National Golf Foundation Consulting, Inc. – City of San Francisco, California – 79
City of San Francisco
Harding Park Golf Course per Round Revenue (2002, 2005-2006) FY 2004-05 FY 2005-06 FY 2001-02**
Rounds - Harding 71,425 60,464 82,992Rounds - Fleming 45,456 41,502 46,755Total Rounds Played 116,881 101,966 129,747 Harding Green Fee per Harding Round $50.25 $56.55 $15.48Fleming Green Fee per Fleming Round $16.12 $17.37 $8.49Total Green Fees per Total Round $36.98 $40.61 $12.96
Harding Cart Fee per Harding Resident Round $7.21 $7.56 $4.34 Food & Beverage per Total Round $1.82 $7.24 Pro Shop per Total Round $2.04 $4.15 $0.18Range per Total Round $1.86 $2.66 $0.45Total Concession per Total Round $9.15 $17.89 $1.97Total Revenue per Total Round $46.13 $58.49 $14.93
Source: City of San Francisco and Kemper Sports. *Through 1st Qtr, October 30, 2006. ** July 1, 2001-May 27, 2002
Expense Analysis The City of San Francisco and Kemper Sports have provided the consultants with actual expenditures for the operation of the Harding Park Golf Course for FY2005 and FY2006, as well as a budgeted amount for the full FY2007. The Harding Park Golf Course expense performance appears in the table below. The figures show that the 2006-07 budget now exceeds $8.6 million, about $1.34 million+ higher than in FY2006. It should be noted that these expense estimates do include capital reserves and a $1.4 million repayment to City open space fund. Still, this amount is clearly higher than the revenue and certainly seems out of line with expectations for upscale public golf courses in the U.S. and in this local market area.
Harding Park’s total expense budget has grown from $1.36 million in FY 1999-00 to a budgeted $8.6 million in 06-07, an increase of more than 500%. Maintenance labor has is expected to go up by more than $570,000 between actual 04-05 and the budget for 06-07, an increase of more than 16% in just two years.

National Golf Foundation Consulting, Inc. – City of San Francisco, California – 80
City of San Francisco Harding Park Golf Course – Operations Expenses
2004-05 2005-06 2006-07 Budget Expenditure Salaries $1,483,998 $1,618,710 $1,682,020 Fringes $374,057 $433,517 $506,763 Overhead $377,546 $618,009 $605,813 Professional & Special Serv. $2,068,218 $2,890,610 $3,669,159 Rent/Leases Equipment $284,024 $284,024 $284,024 Workorders $5,000 Other Expenses $1,710 $4,404 Materials & Supplies $205,816 $203,782 $185,000 Services of other Dept. $15,515 $23,407 Facilities Maintenance $154,140 Capital Reserve $0 $251,364 $251,364 Repayment to Open Space $329,080 $935,420 $1,417,075 Expenditure Total $5,294,104 $7,263,247 $8,606,218
Source: City of San Francisco
Cost of Production Golf facilities are like any other business enterprise in that the facilities operate under the restrictions of “production costs” – costs associated with “producing” a round of golf. In the golf facility industry, most of the production costs are fixed and will be required regardless of how many rounds are played, unless staff is reduced. NGF Consulting has derived from the Harding Park Golf Course financial statements that the total expense to operate the facility is budgeted to be $8,606,218 in FY 2007, including administrative overhead, encumbrances and general fund payments. Given this amount and the 2007 expected rounds played, the facility cost of production ratios are as follows:
Harding Park Golf Course Cost of Production (Fiscal Years 2005-2007)
2004-05 2005-06 2006-07 Budget Expenditure Salaries $12.70 $15.87 $14.89 Fringes $3.20 $4.25 $4.48 Overhead $3.23 $6.06 $5.36 Professional & Special Serv. $17.70 $28.35 $32.47 Rent/Leases Equipment $2.43 $2.79 $2.51 Workorders $0.04 Other Expenses $0.01 $0.04 Materials & Supplies $1.76 $2.00 $1.64 Services of other Dept. $0.13 $0.23 Facilities Maintenance $1.32 Capital Reserve $2.47 $2.22 Repayment to Open Space $2.82 $9.17 $12.54 Expenditure Total $45.29 $71.23 $76.16
Source: City of San Francisco and Kemper Sports

National Golf Foundation Consulting, Inc. – City of San Francisco, California – 81
It is expected to cost the City of San Francisco about $76 total in FY2007 to produce each round of golf on the Harding Park Golf Course. There is no industry standard for an appropriate cost of production, but this figure should be compared to the revenue ratios and be considered whenever green fee schedules are being contemplated. NGF Consulting notes a probable disparity between the cost of production on the regulation 18-hole and the Fleming 9-hole courses, and the recent rise in production costs as expenses have gone up and rounds have declined slightly.
Food and Beverage Operation The Harding Park facility got a significant revenue boost in FY 2005-06 with the addition of the new “Sandy Tatum” clubhouse. However, the facility also incurred some new expenses that contributed to the declining economic performance of the overall facility. Of particular note is the performance of the food and beverage operation at Harding Park. In the table below, NGF Consulting displays a sketch pro-forma of food and beverage operations at Harding Park showing just what this operation is contributing to the bottom line at the facility.
Harding Park Golf Course Food and Beverage Operation (FY 2005-2006)
FY 2004-05 FY 2005-06 F&B Revenue $212,464 $737,743 Less: Direct F&B Expense Cost of Goods $75,791 $266,823 Payroll $89,812 $491,574 Other Expenses $20,657 $102,250 Total F&B Expenses $186,260 $860,647 Harding Net F&B $26,204 ($122,904)
Source: Kemper Sports
Other Issues at Harding Park Resident vs. Non-Resident Play One of the biggest challenges facing municipal golf courses that are in high demand is ensuring equitable access to the courses for its various user groups, both resident and non-resident. Until recently, the City of San Francisco mandated that 65% of tee times be set aside for city residents. Just prior to NGF Consulting being retained for this study, the policy was changed to 50% resident play, with the idea that the higher priced non-resident rounds increase and give the system a revenue boost.
Clearly, Harding Park has benefited from growing popularity since the renovation and the hosting of the AMEX tournament, and is in high demand. However, as noted earlier, NGF Consulting analysis indicates that a relatively small percentage of rounds played at Harding Park are at the highest non-resident fees, so relative access to the course may not be an issue at this time. This could change of course if the City puts an emphasis on marketing San Francisco golf when, or if, the other courses in the system are brought up to standard.
PGA TOUR Agreement (Please refer to ‘City of San Francisco Municipal Golf Operations’ section).
Harding Park Best Case “As-Is” Financial Projections Based on the analysis conducted in early 2007, the NGF Consulting team has prepared an estimate of “best case” financial performance for the Harding Park Golf Course assuming that
National Golf Foundation Consulting, Inc. – City of San Francisco, California – 82
the facility continues operations on an “as-is” basis. The results of this analysis are shown in the following exhibits:
Base Assumptions This proforma estimate is based on the assumption that the City continues its operation on an ‘as-is’ basis, with only minimal changes to the operation. NGF Consulting has assumed that rounds activity observed in the first half of FY2006-07 will continue for the next five years. Average revenue per round is expected to increase at a sight two percent (2%) per year, after a significant increase is assumed for FY2006-07 due to fee increases and actual results for the first six months of the year. The facility expenses are projected to increase at four percent per year (4%) across the board, with the exception of fringe benefits that increase at eight percent (8%), and we assume the City can at least get a handle on the growth in expenses for the next five to six years (through 2012).
Proforma Estimate for Harding Park FY2007 – FY2012 The best case ‘as-is’ projection appears in the table on the following page.

National Golf Foundation Consulting, Inc. – City of San Francisco, California – 83
City of San Francisco Harding/Fleming Projected Golf Course Revenue (FY2007-2012)
FY 2006-07 FY 2007-08 FY 2008-09 FY 2009-10 FY 2010-11 FY 2011-12 Rounds - Harding 63,000 63,000 63,000 63,000 63,000 63,000Rounds - Fleming 46,000 46,000 46,000 46,000 46,000 46,000Total Rounds Played 109,000 109,000 109,000 109,000 109,000 109,000
Green + Cart Fees - Harding $4,578,672 $4,670,246 $4,763,651 $4,858,924 $4,956,102 $5,055,224Green + Cart Fees - Fleming $947,843 $966,800 $986,136 $1,005,859 $1,025,976 $1,046,495Total Green + Cart Fees $5,526,515 $5,637,046 $5,749,786 $5,864,782 $5,982,078 $6,101,719
Food & Beverage $788,635 $804,408 $820,496 $836,906 $853,644 $870,717Pro Shop $452,237 $461,282 $470,507 $479,917 $489,516 $499,306Range $289,440 $295,229 $301,134 $307,156 $313,299 $319,565Total Concession $1,530,312 $1,560,919 $1,592,137 $1,623,980 $1,656,459 $1,689,588
Total Revenue $7,056,827 $7,197,964 $7,341,923 $7,488,762 $7,638,537 $7,791,308 Average GF - Harding $69.00 $70.38 $71.79 $73.23 $74.69 $76.18Average GF - Fleming $20.14 $20.54 $20.95 $21.37 $21.80 $22.24Avg. Cart Fees - Harding $7.56 $7.71 $7.87 $8.02 $8.18 $8.35Avg. Cart Fees - Fleming $0.47 $0.47 $0.48 $0.49 $0.50 $0.51Avg. Food & Beverage $7.24 $7.38 $7.53 $7.68 $7.83 $7.99Avg. Pro Shop $4.15 $4.23 $4.32 $4.40 $4.49 $4.58Avg. Range $2.66 $2.71 $2.76 $2.82 $2.87 $2.93Total Concession $16.36 $16.69 $17.02 $17.36 $17.71 $18.06
Total Average Revenue/Rnd. $64.74 $66.04 $67.36 $68.70 $70.08 $71.48 Expenditure Salaries $1,682,020 $1,749,301 $1,819,273 $1,892,044 $1,967,725 $2,046,435 Fringes $506,763 $547,304 $591,088 $638,375 $689,445 $744,601 Overhead $605,813 $630,046 $655,247 $681,457 $708,716 $737,064 Professional & Special Serv. $3,669,159 $3,815,925 $3,968,562 $4,127,305 $4,292,397 $4,464,093 Rent/Leases Equipment $284,024 $295,385 $307,200 $319,488 $332,268 $345,559 Workorders $5,000 $5,200 $5,408 $5,624 $5,849 $6,083 Other Expenses $0 $0 $0 $0 $0 $0 Materials & Supplies $185,000 $192,400 $200,096 $208,100 $216,424 $225,081 Services of other Dept. $0 $0 $0 $0 $0 $0 Facilities Maintenance $0 $0 $0 $0 $0 $0 Capital Reserve $251,364 $261,419 $271,875 $282,750 $294,060 $305,823 Repayment to Open Space $1,417,075 $1,417,075 $1,417,075 $1,417,075 $1,417,075 $1,417,075 Expenditure Total $8,606,218 $8,914,054 $9,235,826 $9,572,219 $9,923,960 $10,291,813 Surplus (Deficit) ($1,549,391) ($1,716,090) ($1,893,902) ($2,083,457) ($2,285,423) ($2,500,505)

National Golf Foundation Consulting, Inc. – City of San Francisco, California – 84
SHARP PARK GOLF COURSE The Sharp Park Golf Course is an 18-hole golf facility located in Pacifica, California immediately adjacent to the Pacific coast. The facility includes an 18-hole golf course and clubhouse that sits on direct oceanfront property acquired by the City of San Francisco sometime around 1930. The facility offers a very player-friendly golf course with outstanding views and vistas of the Pacific Ocean.
Sharp Park GC Location and History
Sharp Park GC History Sharp Park Golf Course was originally designed by Dr. Alister Mackenzie, one of the most celebrated and respected golf architects of all time. The course is located in Pacifica, a nearby community of the San Francisco Bay Area. While located in Pacifica, the land remains in control of the City of San Francisco. The golf course sits within an area designated as The Golden Gate National Recreation Area, managed by the U.S. Department of the Interior.
The history of Sharp Park begins with Mackenzie’s well-intentioned design of an 18-hole course along the coastal dunes of Pacifica. With Lincoln Park and Harding Park busy on weekends, another course was needed. The City of San Francisco purchased lots in San Mateo County from 1929 to 1930, paving the way for creating another golf course.
Jack Fleming was Mackenzie’s assistant at the time. The approach to the Sharp Park site was to dredge material in order to build up fairway grades. This work took a reported 14 months. In mid 1930, Robert Hunter was appointed to direct construction of Sharp Park Golf Course. Hunter is thought to have a great deal to do with the design of Sharp Park. Joe Faulkner, in his San Francisco Golf History, notes that Hunter was paid $750 for his ten months duration of work at Sharp Park. After delays due to wet conditions, the course opened in April of 1932.
The site chosen, and methods of dredging to fill areas for fairways, have each contributed to chronic drainage problems. While the course became immensely popular, holes along the beach (Nos. 2 through 8) that were part of the original design were soon relocated. A major tide and storm decided their fate within a few years, in 1938. Eventually, these holes were replaced in an area now referred to as “the canyon”, the opposite direction from the ocean. In the 1960s

National Golf Foundation Consulting, Inc. – City of San Francisco, California – 85
the State constructed a major highway across the course. This necessitated the re-design of a few holes and created a separation of the original portion of the course from the newer holes in the canyon area.
There are many more “tales” of remodeling at Sharp Park, but the changes noted above constitute the primary alterations. Even with so many significant changes, Sharp Park remains an engaging and interesting golf course. This is a testament to Alister Mackenzie’s skill at creating interesting greens and a routing that unfolds like any good and exciting story. While the “story” would be much better with holes along the ocean—as per the original design—the course as it is today remains a very enjoyable routing when conditions are good.
Inventory of Facilities Sharp Park Golf Course includes an 18-hole golf course, clubhouse, practice green and maintenance area. A summary of these amenities follows:
Golf Course The Sharp Park golf course plays to a total of 6,476 yards from its longest tee, down to 5,793 yards from its shortest tee. The shortest yardage is traditionally used by the female segment of golfers and NGF Consulting notes that 5,800 yards is very long for women. Female golfers usually hit golf balls about 75% as far as male golfers, meaning that a 5,800-yard golf course for women is equivalent to a 7,730-yard golf course for men (longer than PGA TOUR courses). The Sharp Park GC operators have recognized this length issue and assigned a ‘women’s par’ of 74, instead of the standard 72. The United States Golf Association (USGA) has also recognized the length and difficulty of the red tees and assigned a higher slope and rating to the Red Tees (72.9 rating – 120 slope) than to the longer Blue Tees (71.2 rating – 119 slope).
The golf course setting is links, meaning it occupies land formed by erosion of the seashore caused by winds, tides and inland drainage. (A “links” is defined as: A seaside golf course constructed on a natural sandy landscape that has been shaped by the wind and receding tides [from the Old English “lincas”, meaning the plural of a ridge, a Scottish term to mean the undulating sandy ground near a shore]).
The set-up of the golf course is rather unique in that four (holes #4-7) of the 18 holes are on the east side of Cabrillo Highway (U.S. Highway One), connected by a tunnel under the freeway. The routing offers several parallel fairways divided by several rows of mature trees. The central lagoon comes into play on three of the holes, while hole #16 plays along the Pacific Ocean. In general, the course is walkable, but some hills, particularly on the east four holes, are such that the site it is only walked by the hearty and well conditioned golfer.
Practice Facilities / On-Course Restrooms Besides a practice putting green there is no formal practice opportunity beyond a series of hitting cages. Restroom facilities are temporary and inadequate for modern golf facilities. In addition to being an ‘eyesore,’ there may be safety and health issues to consider as well. Permanent on-course restroom facilities are recommended. The aerial image in Appendix G shows very little (if any) room for practice range expansion

National Golf Foundation Consulting, Inc. – City of San Francisco, California – 86
Examples of practice amenities, on-course drainage pond
Clubhouse The current clubhouse is the original facility dating back to 1932. Although somewhat historic, the lack of functionality in the clubhouse may be detracting from the overall potential of the Sharp Park golf operation. The bag drop and parking situation is awkward to say the least, and the pro shop is small with limited outward view to manage the flow of golfers. The food and beverage concession appears to be well thought of by the golfers, but the clubhouse does not provide for a large enough common area to support any kind of large gathering of people such as in a tournament or golf outing. Space has been added over the last 20 years at operator expense and this has helped facilitate a larger volume of restaurant business that comes through the facility.
Maintenance Facility and Equipment The maintenance facility at Sharp Park GC is really nothing more than a ‘compound’ that consists of a small trailer with an office and break room, some older structures and a few temporary storage containers. There are no sanitary facilities. Although crews are supposed to use the rest room facilities in the clubhouse, this reality is doubtful. Security is a problem, and vandalism is reported to be common. Workers are cramped, needed facilities are lacking and equipment is not securely housed. Further, the golf maintenance equipment itself is old and outdated, and some equipment that is basic and necessary for the operations is simply not available.
Photos showing the poor condition of maintenance facilities and equipment

National Golf Foundation Consulting, Inc. – City of San Francisco, California – 87
Physical Review NGF Consulting has reviewed the physical condition of the Sharp Park Golf Course under the same methodology used at Harding Park as described previously. The key physical issues uncovered at Sharp Park include the following:
Poor Turf Conditions There are considerable turf problems at Sharp Park, caused mostly by problems associated with inadequate irrigation, inefficient drainage and a small maintenance crew (just five at the time of this study). The turf at Sharp Park is made up of several varieties, including Kikuyugrass (Pennisetum clandestinum), which has infested the course for many years and may even now be the predominant variety of playing grass. Where kikuyugrass is predominant it seems to be an acceptable playing grass. Beyond this problem are wet areas, dead areas and a general lack of consistent turf quality. Greens suffer from a lack of more frequent aeration and verticutting to open roots to more oxygen and drainage. Tees are not level and suffer from being too small, generally shady, and poorly drained. The staff complains of English Daisy infestation and other weed problems, but this would generally be acceptable if other turf areas were in excellent shape.
Irrigation The irrigation system at Sharp Park is made up of many types. Canyon holes, for example, are plagued by an irrigation system designed by the City’s park staff in the 1980s, apparently with little knowledge of golf course irrigation system nuances. About half of the course is irrigated through the use of a quick coupler system, an older type of irrigation system that is no longer used in modern golf courses for primary irrigation needs. The “system” is a hodge-podge of types and causes excess time to be spent repairing and managing the watering. Additionally, water expenses may be increasing due to cost issues associated with water rights and grandfathered cost agreements. It is obvious that an updated, state-of-the-art irrigation system would benefit the maintenance, help to reduce expenses and help to improve overall water conservation.
Drainage and Flooding (Laguna Salada) Drainage is a key issue at this facility due to the low-lying area of the golf course. While dredging enabled the course to be developed, it could not possibly have prevented the natural courses of water to still pond and make their way towards the ocean.
The large Laguna Salada, a marsh/pond that remains within the golf course, functions to collect water that runs off from inland areas, detaining it before it is metered out to sea. This system seems simple enough, until one examines the changes that have taken place over the years:
• First, a large sea levee was constructed to protect the course and residential areas. This change isolated the Laguna Salada from the ocean and necessitated a mechanical means of pumping water out to the ocean. It is our understanding that the original system used gravity, but eventually a pump was installed at a lower pond known as Horse Stable Pond.
• Second, development in the nearby community has considerably increased drainage (sheet run off from streets, rooftops, and lots). This means that more water ends up in the lagoon, furthering complications that come with rains and storms. Additionally, silt from upstream locations has deposited in the lagoon, diminishing its capacity.

National Golf Foundation Consulting, Inc. – City of San Francisco, California – 88
• Thirdly, over the years a great deal of vegetation has been allowed to grow in the lagoon and waterway that connects it with Horse Stable Pond. This condition slows water movement and stalls the positive drainage that once occurred more quickly.
If these problems are not enough on their own, the condition of slow moving water, and too much water-growing vegetation, has now caused an increase in some species of animal habitat within portions of the golf course. Specifically, the Red-Legged Frog, San Francisco Garter Snake, Fork-Tailed Damsel Fly and the Yellow Bellied Salt Marsh Thrush are all species that have found refuge in the lagoon at Sharp Park Golf Course.
During recent rains (in 2005 and 2006), the course flooded so significantly that emergency pumping is called for. However, the frog species was believed to be vulnerable had additional pumping been allowed. The result was a prolonged period in which water remained over turf areas and pumping was halted.
During this time it was reported that drainage may have compromised residential areas because the lagoon water had backed up so far as to not allow more water to be collected within the golf course/lagoon area. Ideally, water enters the golf course through drainage channels and is detained. From this lagoon location, water then is supposed to drain by gravity to a lower pond (Horse Stable Pond) and is then pumped out to sea—its historic drainage path. However, with a moratorium placed on pumping, the lagoon remains full and the entire system backs up. This potentially endangers the public and the Sharp Park property.
Safety Cart signage is needed to appropriately orient golfers where the paths may pose a safety risk. Further, there are locations on the golf course where the tees and hole alignments may add to the safety concern related to errant golf shots. This requires further study in conjunction with a master plan.
Cart Path Deterioration Several cart paths are broken, worn out, or in need of re-location to rectify drainage or appropriate access. A master plan for path work should be undertaken in concert with a full master plan of the course and facilities. It is noted that heavy, multi-ton trucks used in tree maintenance drive on the cart paths. This has reportedly caused a great deal of damage.
Cart path deterioration, poor bunker maintenance

National Golf Foundation Consulting, Inc. – City of San Francisco, California – 89
Maintenance Staff With just five on the crew to take care of the golf course, Sharp Park suffers from neglected areas and poor conditions. No area of the course can be considered to be in good condition. Greens are not aerified as frequently as needed, grass is not mowed as often as needed, bunkers are not cared for as frequently as called for, etc. The crew does a good job of caring for areas of the course considering it has such little available labor and staff positions.
Arbor Care The City deploys a well-trained arbor crew and staff to take care of trees. However, as we will document in other City courses as well, this work is performed in a vacuum when it comes to the City’s golf facilities. No formal plan for taking care of trees is in effect for the golf courses, nor does it seem as though the game of golf being considered when maintaining trees. Factors such as shade, turf quality, irrigation, strategy, safety, views, etc. appear to be considered in the maintenance of trees on this property. While it may be that these factors are considered, it appears from interviews and research that at no point is a professional golf course architect in the mix to give advice and opinion.
Master Plan Needed Sharp Park Golf Course is in great need of a master plan for its entire facility. Such a plan should address design, features, paths, trees, safety, turf quality, irrigation, and drainage. Specific options would be outlined for rectifying the lagoon drainage system. It is recommended that this work involve a civil engineer in concert with a professional golf course architect.
Maintenance Approach Sharp Park’s limited crew results in a golf maintenance program that cannot catch up with daily needs. The staff falls under the same labor union that manages non-golf city parks, and is categorized in a manner that is not consistent with standard golf industry nomenclature or organization. A course of this size and complexity should have a minimum of 12 maintenance personnel. It would also be common to employ seasonal staff.
Other Observations As with the other City golf courses, use of pesticides and herbicides is significantly limited due to the City’s tight control. This places a hardship on the effective operation of golf courses in controlling weeds and pests. While strict control is desirable, the level of control thwarts many “best practice” approaches used throughout the golf industry, even in highly sensitive environments. The City’s Integrated Pest Management (IPM) program makes it very problematic to rid courses of English Daisy and other weeds. Ground burrowing mammals are also left uncontrolled except for trapping methods.
It was noted during this study that there is a small contingent within the community that has proposed closure of Sharp Park Golf Course, presumably rendering it to a natural or passive park state. This seems unwise as the golf course provides a sustainable recreation amenity and the golf course exists quite nicely alongside trails and existing passive recreation areas. It is, after all, the servant-like function of the golf course to handle drainage from the Pacifica area and other upstream areas that both serves the community and also has enabled this habitat initially.
Physical Enhancement Recommendations The NGF Consulting team has prepared a priority-order schedule of recommendations designed to improve the physical condition and make the golf facility more appealing to a broader segment of the golfing public, particularly non-resident (visitor) golfers that are likely to be willing to pay higher fees. A summary of the recommendations appears in the Recommendations section later in this report.

National Golf Foundation Consulting, Inc. – City of San Francisco, California – 90
Operations Overview Staffing The City employs a total of five FTE’s at Sharp Park to maintain the golf course grounds. Additional staff is at the facility to manage the golf and food/beverage operations, although these are employees of the vendor. As noted previously, NGF Consulting research nationally indicates that all municipal golf courses with golf revenue in excess of $1.0 million average 17.3 employees per 18-hole facility in 2005, with 8.0 employees dedicated to golf course maintenance. We have noted a recommendation of 12 maintenance employees at Lincoln Park (higher than U.S. average).
The NGF Consulting finding related to this data is that the mix between maintenance and non-maintenance labor seems to be weighted heavily towards non-maintenance labor when compared to other municipal golf facilities. Further, we note that while there are five FTE’s assigned to maintain the Sharp Park facility, the contracted operator reports to NGF Consulting that not all maintenance workers are present when needed. In all this suggests that the distribution of labor at Sharp Park may not be ideal, especially in light of our physical review that suggested some areas of golf course maintenance are lacking. Irrigation maintenance was singled out by the NGF Consulting team as a problem due to antiquated equipment, and the fact that there are so few maintenance employees to handle the job. In all it seems that the total staff level at Sharp Park is not enough to cover all necessary maintenance items at this facility.
Concession Agreements The concession agreement in place at Sharp Park is summarized below:
Consent to Assignment of the Sharp Park Golf concession lease from Jack Gage and Joan Lantz to Sharp Park Restaurant and Pro Shop, Inc. dated September 15, 1988. Approved by the City. The concession involves starter services; full bar, restaurant, and banquet facilities; lessons, equipment and cart rentals; and merchandise sales.
Lease for establishing and operating a restaurant and a professional golf shop, dated April 22, 1983. Between Recreation and Park Commission on behalf of City and County of San Francisco (Commission) and a joint venture of Jack Gage, Joan Lantz and Mike Shannon (Lessee). Terms go through 2003. Lessee pays minimum annual rent of $30,000 first year and $75,000 each year thereafter. Percentage of gross revenue, (all income less sales taxes) payable monthly:
10% merchandise sales 20% lessons/instruction, club rental, practice balls 12% cart rental 10% cart rental after April 1, 1984 5% food & beverage 11% alcoholic beverages and banquets
If percentages do not add up to minimum annual rent, Lessee pays the minimum 10 days after the end of the fiscal year. Minimum annual rent is adjusted each January 1, based on CPI, beginning in 1991. Lessee must give employees pay and benefits and working conditions generally same as City/County employees, but Lessee may collectively bargain with union for rates.
Lessee pays for utilities, equipment, materials, supplies, etc. and maintains at its own expense, the leased facilities, furniture, and equipment. Lessee pays all taxes, licenses, permits, and assessments. Capital improvements of $575,000 in three stages were agreed upon in the lease:

National Golf Foundation Consulting, Inc. – City of San Francisco, California – 91
Stage One – within 120 days of date of lease: $250,000 remodel, refurbish, and rehabilitate the clubhouse $25,000 construct cart enclosure area and golf driving cage Stage Two – approximately 2 years from lease date: $150,000 construct deck on west side of clubhouse with
underground cart storage and maintenance facility Stage Three – on or before 5th year of operation: $150,000 construct deck on south end of clubhouse
Lessee required to provide 3 separate performance bonds:
50% of amount of contracts for completion of work, guaranteeing payment of wages, materials, supplies and equipment,
50% of total estimated construction costs, guaranteeing completion of improvements and repairs
$25,000 surety bond renewable annually through term of lease, as security for collection of any damages or breach of lease
Rent credits will be allowed for improvements beyond those set forth in lease.
Note: This agreement has been on a month-to-month basis for several years.
Marketing and Revenue Enhancement Activities In this section of our report, NGF Consulting will identify key activities either underway or proposed that attempt to stimulate greater activity, and/or increase revenues, at Sharp Park Golf Course. It is our understanding that Sharp Park Golf Course tends to attract a very local and unchanging clientele. NGF Consulting has documented some of the physical items in need of attention at Sharp Park to improve the overall golf experience for its customers. It is believed that these improvements should make the golf course more appealing to a broader group of potential golf customers, particularly tourists to the area.
One of the keys to Sharp’s future financial success is to create additional non-resident play, similar to the Harding Park model. With higher maintenance standards, improved customer service and increased amenities Sharp could become much more competitive in the local golf market. If this facility is to be able to grow its revenues to cover the day-to-day golf course operation and fund the desired improvements noted previous, it is clear that Sharp Park will have to either (1) grow rounds to levels exceeding present levels, or (2) increase the average revenue earned per round at the facility, or (3) do both.
The legacy of Alister Mackenzie is virtually unknown by golfers at Sharp Park. The occasional visitor will know of the Mackenzie legacy, but this is rare. With so few courses designed by Mackenzie that available to the public, San Francisco is missing a grand opportunity to capitalize on this in marketing and promotion.
Fee Structure The City of San Francisco pricing structure for Sharp Park is outlined in the tables shown below:

National Golf Foundation Consulting, Inc. – City of San Francisco, California – 92
Sharp Park
Weekday Weekend Standard $32 $36 Resident $20 $24 Senior $12 $19 Junior $10 $19 Back 9/10 $11 $15 Twilight $19 $23 Tournament $38 $47
$1.00 per person will be added to above rates if reservations are made through the Automated Reservation System Weekday = M-Th; Weekend = F-Sun
Green fees at Sharp Park are among the lowest in this municipal market. Increasing the amount of higher-revenue non-resident play is one of the keys to profitability at this facility but, as discussed in earlier in this report, the fees for Sharp Park seem market appropriate given the below average condition of the course and the quality of the support amenities. As rounds have been declining severely over the last several years, fee increases cannot be reasonably justified. NGF Consulting believes that the facility must first be rehabilitated before any meaningful price increases would be absorbed by the market without a drop in play.
Sharp Park Golf Course - Golfer Survey Overview NGF implemented GSP at Sharp Park to gauge opinions from the facility’s golfers. A total of 143 surveys were collected by NGF, with 47 completed by those identifying themselves as City residents. The ratings are displayed in the table below. More detailed findings are contained in the associated GSP Appendix Book.
Sharp Park Golf Course 143 Responses
11/14/2006 – 1/8/2007
Factor
Average Score
(Scale 1-5) 6-Scenery and Aesthetics of Course 4.2 14-Affordability 4.2 2-Convenience of Course Location 4.1 10-Friendliness/Service of Staff 3.7 1-Overall Value of Course 3.6 3-Tee-time Availability 3.6 13-Overall experience 3.3 7-Pace of Play 3.2 11-Food and Beverage Service 3.2 8-Condition of Golf Cars 2.9 4-Overall Course Conditions 2.6 9-Amenities (clubhouse, pro shop, locker room) 2.5 5-Condition of Greens 2.5 12-On-course Services (restrooms, drinking water) 2.3
Average Score: 1 = very dissatisfied; 2 = somewhat dissatisfied; 3 = neither satisfied nor dissatisfied;4 = somewhat satisfied; 5 = very satisfied

National Golf Foundation Consulting, Inc. – City of San Francisco, California – 93
Other Findings 1. Sharp Park golfers that responded to the survey rated the facility relatively high on the
measures of convenience of location, affordability and scenery and aesthetics. The key business drivers on which Sharp Park fared the poorest were condition of golf cars, overall course conditions, amenities, condition of greens, and on-course services. Though ratings on factors such as overall experience and friendliness of staff were relatively low compared to national benchmark data, the absolute ratings for these measures did not illustrate overall dissatisfaction.
2. There were an unusually high number (approximately 30) of incomplete surveys submitted by Sharp Park respondents; incomplete surveys cannot be entered into the system. However, a hand calculation of these surveys revealed higher average scores than those observed with the complete surveys summarized above, especially with regards to measures such as friendliness/service of staff, and food and beverage service.
3. Our surveys also show a wide variety of other golf courses that are also played by Sharp Park golfers, including other City courses like Harding Park and Lincoln Park (both in the top five). Crystal Springs and the Presidio are the most popular other local facilities with this group, in addition to many other area golf facilities both public and private (consistent with lower loyalty).
4. The profile of the Sharp Park golfer is predominantly male (90%) and somewhat older (58% over 50) than the national benchmark. One key finding was that the course is as popular with Pacifica residents (22%) as San Francisco City residents (21%). The map displaying the origin of customers is displayed in Appendix F to this report.
5. The survey indicated that 74% of respondents think that the overall quality of the City’s golf courses would improve if oversight and management of the golf system were not the City’s responsibility. Among the comments noted on this question was that a ‘private operator’ would have a greater vested interest in maintaining activity and that excess revenues from the golf course would go to continued upgrades and improved maintenance. The survey also revealed that 60% of respondents would play more frequently, 30% would not be affected, and only 10% they would play less if the conditions at Sharp Park were improved AND fees increased.
6. There is virtually no difference in survey responses, grades or loyalty between the two survey groups - residents and non-residents. However, the non-resident group did not mention the other City courses (Harding and Lincoln) in the top five of other courses played, while City residents listed Harding and Lincoln as the top two facilities played (other than Sharp).
7. Survey respondents were also asked to voice their opinions in an open-ended comments section that was part of the survey. Among the most common points raised include the need for better maintenance and quickening the pace of play. The respondents also voiced an expression that the City (or someone) should invest in improving the Sharp facility as it should be able to charge higher fees given scenery, history and location.
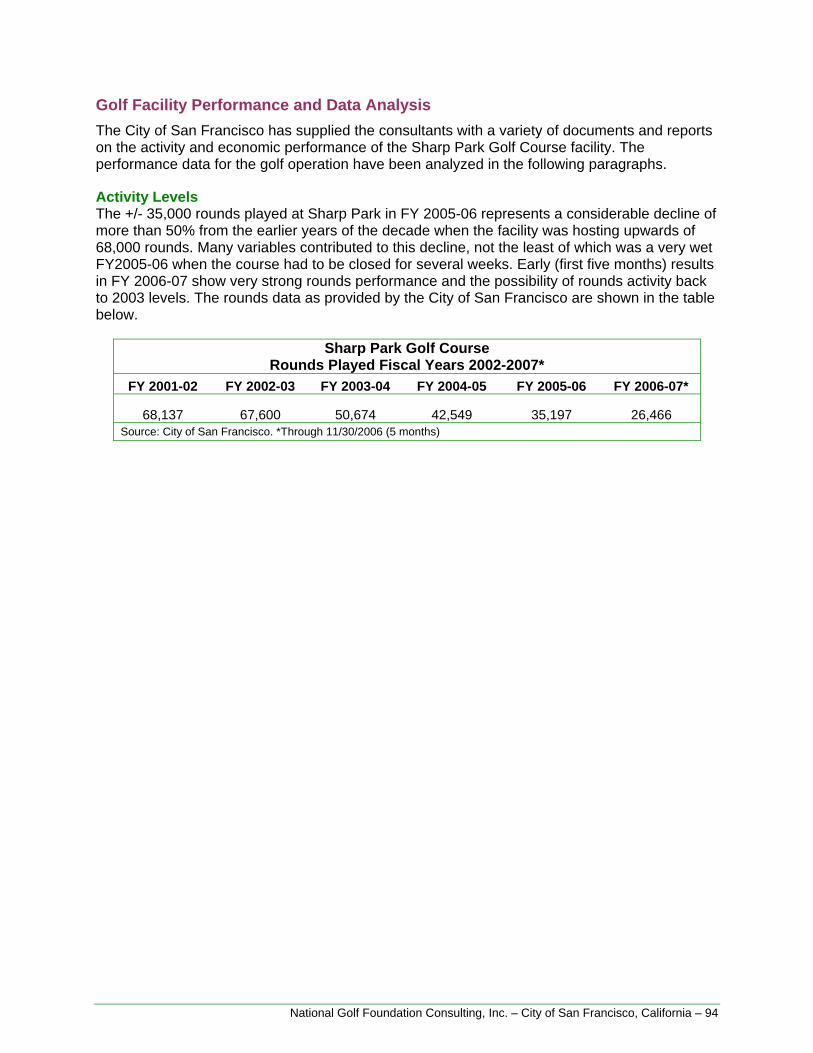
National Golf Foundation Consulting, Inc. – City of San Francisco, California – 94
Golf Facility Performance and Data Analysis The City of San Francisco has supplied the consultants with a variety of documents and reports on the activity and economic performance of the Sharp Park Golf Course facility. The performance data for the golf operation have been analyzed in the following paragraphs.
Activity Levels The +/- 35,000 rounds played at Sharp Park in FY 2005-06 represents a considerable decline of more than 50% from the earlier years of the decade when the facility was hosting upwards of 68,000 rounds. Many variables contributed to this decline, not the least of which was a very wet FY2005-06 when the course had to be closed for several weeks. Early (first five months) results in FY 2006-07 show very strong rounds performance and the possibility of rounds activity back to 2003 levels. The rounds data as provided by the City of San Francisco are shown in the table below.
Sharp Park Golf Course Rounds Played Fiscal Years 2002-2007*
FY 2001-02 FY 2002-03 FY 2003-04 FY 2004-05 FY 2005-06 FY 2006-07*
68,137 67,600 50,674 42,549 35,197 26,466 Source: City of San Francisco. *Through 11/30/2006 (5 months)

National Golf Foundation Consulting, Inc. – City of San Francisco, California – 95
Sharp Park Golf Course
Rounds Played by Type – FY2003-06 2002-2003 Weekday Weekend Total Standard 4,289 2,460 6,749
Resident 10,110 11,309 21,419
Senior 17,242 4,285 21,527
Junior 848 602 1,450
Tournament 1,470 2,250 3,720
Twilight 3,915 2,105 6,020
Back 9 4,071 2,507 6,578
Total 41,945 25,518 67,463
2003-2004 Weekday Weekend Total Standard 2,679 1,745 4,424
Resident 7,161 10,972 18,133
Senior 12,698 3,727 16,425
Junior 606 480 1,086
Tournament 1,144 3,395 4,539
Twilight 2,068 1,310 3,378
Back 9 754 1,928 2,682
Total 27,110 23,557 50,667
2004-2005 Weekday Weekend Total Standard 1,958 1,423 3,381
Resident 5,438 10,232 15,670
Senior 10,294 3,599 13,893
Junior 548 707 1,255
Tournament 956 1,947 2,903
Twilight 1,794 1,427 3,221
Back 9 571 1,656 2,227
Total 21,559 20,991 42,550
2005-2006 Weekday Weekend Total Standard 1,712 1,084 2,796
Resident 4,458 7,157 11,615
Senior 8,695 2,542 11,237
Junior 381 500 881
Tournament 764 1,755 2,519
Twilight 1,968 1,365 3,333
Back 9 768 2,037 2,805
Total 18,746 16,440 35,186
Source: City of San Francisco.

National Golf Foundation Consulting, Inc. – City of San Francisco, California – 96
Capacity Issues In our discussion of Harding Park we identified the theoretical capacity (absolute maximum) and actual capacity (more realistic maximum) of municipal golf facilities in this regional market. The 18-hole course at Sharp Park should be able to achieve annual rounds played numbers in the 70,000+ rounds range, indicating that the 18-hole course at Sharp is under performing, at 50 percent or less of capacity. As such, it is clear that there is capacity available on the Sharp Park Golf Course that can be used to attract the much-needed additional higher fee play.
Revenue Analysis NGF Consulting has reviewed the financial statements in detail and has made comparisons to the rounds activity reports. The following tables summarize the performance of revenues for the past five full fiscal years. Overall, the data shows a clearly declining level of revenue performance, mirroring the decline in rounds activity. In FY2001-02 the Sharp Park Golf Course generated over $2.5 million in total top-line gross revenue, falling to $2.0 million in FY2005-06. This represents a decline of 33 percent in green fee revenue (to the City) and 19 percent in concession items from the 2001-02 high mark.
City of San Francisco Sharp Park Golf Course Revenue (Fiscal Years 2004-2007)
FY 2002-03 FY 2003-04 FY 2004-05 FY 2005-061
Total Green Fee Revenue $1,253,680 $1,075,400 $884,021 $732,041
Lessons $12,188 $11,080 $5,876 $1,535 F&B $971,323 $937,320 $969,360 $888,422 Golf Carts $187,867 $190,276 $165,336 $58,964 Merchandise $30,707 $24,724 $26,151 $24,646 Other $0 $0 $0 $0 Total Concession $1,202,084 $1,163,400 $1,166,723 $1,069,894Total Facility Revenue $2,455,764 $2,238,800 $2,050,744 $1,801,935
Concession to City $114,920 $111,864 $108,114 $99,917Total City Revenue* $1,368,600 $1,187,264 $992,135 $831,958
Source: City of San Francisco and NGF Consulting *Total City revenue excludes transfers from General Fund. Lessee revenues in italics. *Through 11/30/2006. – FY06 course was severely impacted due to flooding from Dec 18th to May 1st.
Revenue Ratios and Ancillaries The City of San Francisco’s revenue at Sharp Park GC is derived primarily from green fees and rent (concession) payments. Golf consumers present at the facility are also spending money on power cart rentals, retail items and food and beverage items. The City collects concession revenue for these items, but an estimate for actual revenues from these items has been provided to NGF Consulting. Average revenue per round estimates are displayed below:

National Golf Foundation Consulting, Inc. – City of San Francisco, California – 97
City of San Francisco Sharp Park per Round Revenue (Fiscal Years 2004-2007)
FY 2003-04 FY 2004-05 FY 2005-06 FY 2006-07*
Total Green Fee Revenue $21.22 $20.57 $20.14 $20.61
Lessons $0.22 $0.10 $0.05 $0.03F&B $20.28 $25.06 $28.26 $18.64Golf Carts $3.79 $3.80 $4.26 $2.81Merchandise $0.53 $0.69 $0.75 $0.49Total Concession $24.82 $29.65 $33.32 $21.98 Total Facility Revenue $46.05 $50.22 $53.46 $42.59
Source: City of San Francisco and NGF Consulting *Through 11/30/0.
The above table shows how ancillary revenues can play a large role in the overall potential of the Sharp Park Golf Course, especially in the food and beverage revenue center, which is a very strong performer and continues to improve. Also, the average cart rental revenue per round is much lower than the fee for the item, indicating the possibility of a high volume of walking golfers. Still, since the City is only collecting about 10% of cart revenue there is room for increased net revenue to the City as carts tend to have a high operating margin (more detail in this section). The level of retail sales is very weak at Sharp Park with a very light selection of items being offered and a lot of unused space. A more aggressive retail operation could significantly enhance top-line revenues. Although margins in golf retail tend to be somewhat low (more detail in this section), the highest margin items do tend to be apparel and logo-type items that may sell well at Sharp, especially in the tourist segment.
Expense Analysis The City of San Francisco has provided the consultants with a complete budget for the City’s portion of operation expenses at Sharp Park Golf Course for the last two full fiscal years, as well as a budget for the current (FY2006-07) year. The City-provided Sharp Park Golf Course expense performance appears in the table below. The figures show that the 2006-07 budget has grown to $1.26 million, about $450,000+ higher than the green fee and concession revenue earned by the City at the facility. It should be noted that expense estimates include all internal transfers and payments to the general fund.
City of San Francisco Sharp Park Golf Course - Operations Expenses
Expenditure 2004-05 2005-062006-07 Budget
Salaries $518,949 $589,283 $644,377 Fringes $125,269 $159,849 $194,562 Overhead $189,793 $182,360 $231,952 Professional & Special Serv. $0 $61,621 $63,300 Other Expenses $7,499 $22,209 $48,000 Materials & Supplies $36,805 $49,316 $79,429 Facilities Maintenance $96,596 Expenditure Total $974,911 $1,064,638 $1,261,620
Source: City of San Francisco and NGF Consulting

National Golf Foundation Consulting, Inc. – City of San Francisco, California – 98
Cost of Production NGF Consulting has derived from the Sharp Park Golf Course financial statements that the total City expense to operate the facility is budgeted to be $1,261,620 in FY 2007, including administrative overhead, encumbrances and general fund payments. Given this amount and the 2006-07 expected rounds played, the facility cost of production ratios are as follows:
Sharp Park Golf Course Cost of Production (Fiscal Years 2005-2007)
2004-05 2005-06 2006-07 Budget
Golf Rounds 42,549 35,195 35,000 Expenditure Salaries $12.20 $16.74 $18.41 Fringes $2.94 $4.54 $5.56 Overhead $4.46 $5.18 $6.63 Professional & Special Serv. $1.75 $1.81 Other Expenses $0.18 $0.63 $1.37 Materials & Supplies $0.87 $1.40 $2.27 Facilities Maintenance $2.27 Expenditure Total $22.91 $30.25 $36.05
Source: City of San Francisco and NGF Consulting
It is expected to cost the City of San Francisco about $36.00 total in FY2007 to produce each round of golf on the Sharp Park Golf Course, EXCLUDING actual vendor expenses. As noted, there is no industry standard for an appropriate cost of production, but this figure should be compared to the revenue ratios and be considered whenever green fee schedules are being contemplated.
Other Issues at Sharp Park Month-to-month lease – As noted, Sharp Park’s operator has been on a month-to-month arrangement for as long as seven years. This is a far from ideal for any business. NGF Consulting’s main concern is that the lessee has no incentive to sink needed capital improvement dollars into the facility.
Carts – Sharp Park features a gas cart fleet. Due to legislation related to environmental concerns first raised by the Clean Air Act of 1990, gasoline powered golf cars are no longer available for purchase or lease as of June 2000 in the San Francisco Bay region (as well as other targeted areas of California). The cart fleet is in need of replacement, thus necessitating a new electric cart barn. The concessionaire noted to NGF that he would replace the barn if awarded a new contract (see previous issue).
Lack of Point-of-Sale System – As noted in the overall operations section of this report, there is no unified point-of-sale system at the City’s golf courses. In fact, Sharp Park is strictly a cash business. In general, NGF Consulting strongly recommends against municipal golf courses operating without a POS system, and especially not on a cash-only basis, as accurate accounting of rounds played is not always assured.

National Golf Foundation Consulting, Inc. – City of San Francisco, California – 99
Sharp Park Best Case “As –Is” Financial Projections Based on the analysis conducted in early 2007, the NGF Consulting team has prepared an estimate of “best case” financial performance for the Sharp Park Golf Course assuming that the facility continues operations on an “as-is” basis. The results of this analysis are shown in the table that follows.
Base Assumptions This proforma estimate is based on the assumption that the City continues its operation on an ‘as-is’ basis, with only minimal changes to the operation. NGF Consulting has assumed that rounds are held at the very successful levels observed in the first five months of FY 2006-07 and that average revenue per round increases at a slight two percent (2%) per year. The facility expenses are assumed to be somewhat more stable, and are projected to increase at four percent (4%) per year, except fringe benefits that increase eight percent (8%) per year through 2012.
Proforma Estimate for Sharp Park FY2007 – FY2012 The best case ‘as-is’ projection appears in the table on the following page.

National Golf Foundation Consulting, Inc. – City of San Francisco, California – 100
City of San Francisco Sharp Park Projected Golf Course Revenue (FY2007-2012)
FY 2006-07 FY 2007-08 FY 2008-09 FY 2009-10 FY 2010-11 FY 2011-12Rounds Played 63,500 63,500 63,500 63,500 63,500 63,500 Total Green Fee Revenue $1,307,621 $1,333,774 $1,360,449 $1,387,658 $1,415,411 $1,443,719
Lessons $2,138 $2,181 $2,224 $2,269 $2,314 $2,360 F&B $1,183,668 $1,207,342 $1,231,488 $1,256,118 $1,281,241 $1,306,865 Golf Carts $178,398 $181,966 $185,605 $189,317 $193,104 $196,966 Merchandise $31,390 $32,018 $32,658 $33,311 $33,978 $34,657 Other $0 $0 $0 $0 $0 $0 Total Concession $1,395,594 $1,423,506 $1,451,976 $1,481,016 $1,510,636 $1,540,849
Concession to City $118,625 $120,998 $123,418 $125,886 $128,404 $130,972 Total City Revenue $1,426,247 $1,454,772 $1,483,867 $1,513,544 $1,543,815 $1,574,691
Total Facility Revenue $2,703,215 $2,757,279 $2,812,425 $2,868,673 $2,926,047 $2,984,568 Per Round Average Revenue Green Fees $20.59 $21.00 $21.42 $21.85 $22.29 $22.74Lessons $0.03 $0.03 $0.04 $0.04 $0.04 $0.04F&B $18.64 $19.01 $19.39 $19.78 $20.18 $20.58Golf Carts $2.81 $2.87 $2.92 $2.98 $3.04 $3.10Merchandise $0.49 $0.50 $0.51 $0.52 $0.54 $0.55Other $0.00 $0.00 $0.00 $0.00 $0.00 $0.00Total Concession $21.98 $22.42 $22.87 $23.32 $23.79 $24.27 Expenditure Salaries $644,377 $670,152 $696,958 $724,836 $753,830 $783,983 Fringes $194,562 $210,127 $226,937 $245,092 $264,699 $285,875 Overhead $231,952 $241,230 $250,879 $260,914 $271,351 $282,205 Professional & Special Serv. $63,300 $65,832 $68,465 $71,204 $74,052 $77,014 Other Expenses $48,000 $49,920 $51,917 $53,993 $56,153 $58,399 Materials & Supplies $79,429 $82,606 $85,910 $89,347 $92,921 $96,638 Facilities Maintenance $0 $0 $0 $0 $0 $0 Expenditure Total $1,261,620 $1,319,867 $1,381,067 $1,445,387 $1,513,006 $1,584,115 Surplus (Deficit) $164,627 $134,904 $102,800 $68,157 $30,809 ($9,423)
Italics indicate concessionaire revenue (total or included)

National Golf Foundation Consulting, Inc. – City of San Francisco, California – 101
LINCOLN PARK GOLF COURSE The Lincoln Park Golf Course is an 18-hole ‘precision’ golf facility located in the northwest corner of the City of San Francisco, along the Pacific coast with views of the Ocean and the Golden Gate Bridge. The facility includes an 18-hole golf course and clubhouse that sits on property that is immediately proximate to the Golden Gate National Recreation Area.
Lincoln Park GC Location and History
Lincoln Park GC History The site of Lincoln Park Golf Course was an old 200-acre segregated cemetery called Potter’s Field. Still occupying an area of the first fairway is a large monument to Chinese who were interred at Potter’s Field. Writing in his excellent history document of San Francisco’s golf courses, Joe Faulker writes, “To say the least, the monument is a thought-provoking hazard.”
Jack Neville, who later would co-design Pebble Beach, was instrumental in pushing the City to begin thinking about establishing a municipal golf course in 1902. At that time San Francisco as a community offered golf only to the wealthy at country club settings. Joining Neville (a member at nearby Claremont Country Club), was Vincent Whitney (a member of Olympic Club.) Neither man needed affordable golf, but stood fast in their determination to convince John McLaren, the City’s park director, to undertake a public golf course project.
McLaren suggested Potter’s Field and the two were given approval to try and construct a few holes. Until 1908 the three holes remained, and were a popular draw to locals. Neville and Whitney created another three holes, and then more. By 1917, eighteen holes had been created, although they were described as a hodge-podge of mediocre golf.
Herbert Fowler, a member of the Royal & Ancient Golf Club of St. Andrews and the Honourable Company of Edinburgh Golfers, became interested in golf course design in the early 1900s. He eventually partnered with Tom Simpson to form Fowler & Simpson. While Simpson worked on the firm’s majority of American projects, Fowler focused on British projects. Lincoln Park, however, is credited to Fowler in its 1922 transformation. Fowler remodeled the original 9 holes and created a new 9 holes. San Francisco’s own Jack Fleming is credited with the most modern remodel of Lincoln Park in the 1960s.

National Golf Foundation Consulting, Inc. – City of San Francisco, California – 102
Inventory of Facilities Lincoln Park Golf Course includes an 18-hole golf course, clubhouse, practice green and maintenance area. A summary of these amenities follows:
Golf Course The Lincoln Park Golf Course is a par-68, 5,146-yard course. It is “precision” in nature - slightly longer than an “executive length” course, but slightly less than a typical regulation length course. There is only one par-5. The setting is parkland with dramatic ups and downs as the course unfolds across a hill above the City. Views are spectacular, highlighted by the famed 17th hole that overlooks San Francisco Bay and the Golden Gate Bridge.
The definition of an “executive course” is:
Courses with an 18-hole par between 55 and 68; derived from the expectation that “executives” would be able to enjoy a round of golf within the business day and still meet their commitments; coined by the late William Mitchell, golf course architect, who reasoned that “such courses could be quickly and enjoyably played by business executives at the tail end of a hectic workday. (On Course, A Dictionary of Golf Course Terms; FRA 2001)
The set-up of the golf course is unique in that three (holes #3-5) of the 18 holes are located behind the ‘Legion of Honor’ building that sits at the top of the hill on the property. Finding your way from the second green to the third tee is difficult for golfers not familiar with the golf course as there is a lack of adequate signage. The routing offers several parallel fairways, with little to separate and distinguish individual golf holes. This golf course is very walkable due to the short length of the golf course and the general closeness of the golf holes.
Practice Facilities / On-Course Restrooms Other than a practice putting green there is no formal practice opportunity present at Lincoln Park. However, there is a small (2-3 acre) area that is frequently used by golfers to hit balls on their own. This area, above the clubhouse and adjacent to the No. 18 Hole, may be suited for a formal range area that could generate revenue. One approach may be to excavate an area and then use netting (a cage design) as has been done at Golden Gate. Study needs to be undertaken to weigh this possibility. NGF Consulting noted no on-course restrooms at Lincoln Park. The aerial image in Appendix G shows limited space for additional practice facilities.
Clubhouse The current clubhouse is the original facility dating back to 1916. Although somewhat historic, the facility has serious flaws, not the least of which is it is not compliant with the ‘Americans with Disabilities Act’(ADA). The building also has two levels, including a lower level locker/rest room that is not completely functional. During our visit, the men’s restroom was not clean. The bar/food service area appears to have been updated recently and has some appeal with a window overlook to the 18th hole, although it should be noted that several panes in the glass are cracked or broken. The food and beverage concession appears to be well thought of by the golfers, and there is a separate room available, adjacent to the kitchen, to host larger parties and/or banquets of up to 60+ persons. However, this area is clearly run-down with chipped paint, wall cracks and other unsightly features that make the facility less desirable as a location for an event.

National Golf Foundation Consulting, Inc. – City of San Francisco, California – 103
Poor condition of Lincoln Park GC clubhouse
Maintenance Facility and Equipment While equipment is mostly older and there are some needed types of equipment, this is not nearly as much of a problem as the general configuration and adequacy of the basic maintenance facility. Maintenance equipment is stored and worked on in small and dingy buildings that are scattered about below the clubhouse. Some facilities are housed in the basement of the clubhouse. Security is a problem. Vandalism is common. Workers are cramped, and so is the equipment.
Physical Review NGF Consulting has reviewed the physical condition of the Lincoln Park Golf Course under the same methodology as described previously. The key physical issues uncovered at Lincoln Park include the following:
Poor Turf Conditions Turf problems abound at Lincoln Park. A majority of issues can be traced to the problems associated with inadequate irrigation, insufficient drainage and a maintenance crew that numbers just five at the time of this study. Turf is made up of several varieties. Kikuyugrass (Pennisetum clandestinum) has infested the course for many years, but this is least worrisome. The primary concern is wet areas, dead areas and a general lack of consistent turf quality. It is rare at Lincoln Park to find a fairway that is wholly in decent shape. Greens and tees are no different. While staff complains of English Daily infestation, this problem pales in comparison to the overall decline of turf due to the issues noted.
Irrigation The irrigation system at Lincoln Park is made up of many types. These range from portions that were installed in the 1920s, to partial replacements in the 1950s, to recent upgrades. A comprehensive plan has been prepared by a qualified golf irrigation designer, but has not been implemented in full. The result is a “system” that is, at best, awkward to manage and highly unreliable. The irrigation problems lead to turf problems, additional maintenance requirements (time, labor, materials, and costs), and customer dissatisfaction.
Drainage Drainage is problematic due to focused drainage paths established as a result of various developments. It is likely that prior to the development of park roads, public spaces, and cart paths, the course drained fairly well, but these improvements created diversions that focused

National Golf Foundation Consulting, Inc. – City of San Francisco, California – 104
run-off onto course areas. The results are severe drainage issues during rainy periods and the wet season.
Examples of drainage & irrigation problems at Lincoln Park GC; cart paths in disrepair
Safety Road crossings need to be addressed to improve safety. Directional signage is needed to safely orient golfers along longer hauls between holes where road crossings and traversing through parking areas is required.
Cart Path Deterioration Several paths are broken, worn out, or in need of re-location to rectify drainage or appropriate access. A master plan for path work should be undertaken in concert with a full master plan of the course and facilities.
Maintenance Staff With just five on the crew to take care of the course, Lincoln Park operates at a bare minimum level of maintenance. The course suffers from a lack of needed attention to nearly every imaginable area of typical and customary golf course care. Greens are not aerified as frequently as needed, grass is now mowed as often as needed, bunkers are not cared for as needed, etc. The list goes on and on. It is nothing short of a miracle that the five crew members do as well as they do in keeping the basic course areas in shape enough for customers to play golf.
Arbor Care The City deploys a well-trained arbor crew and staff to take care of trees. However, as with other golf courses, this work seems to be performed in a vacuum when it comes to the City’s golf facilities. No formal plan for taking care of trees is in effect for the golf courses. The care provided is reactionary - when a tree dies, it is removed; when a tree falls, it is carted away; when it appears like areas are barren, new trees are planted. Again, it appears from interviews and research that at no point is a professional golf course architect in the mix to give advice and opinion.
Maintenance Approach Lincoln Park’s limited crew results in a golf maintenance program that cannot catch up with daily needs. A course of this size and complexity should have a minimum of 10 maintenance personnel. It would also be common to employ seasonal staff. At Lincoln Park, a maintenance supervisor must also oversee Golden Gate Park Golf Course. This position, as well as an irrigation technician, should ideally not have to split time to other facilities.

National Golf Foundation Consulting, Inc. – City of San Francisco, California – 105
Other Observations As with the other courses, Lincoln’s use of pesticides and herbicides is significantly limited due to the City’s tight control. This places a hardship on the effective operation of golf courses in controlling weeds and pests as with other golf courses.
Physical Enhancement Recommendations The NGF Consulting physical enhancement recommendations appear in the Recommendations section later in this report.
Operations Overview Staffing As noted the City employs a total of five FTE’s at Lincoln Park to maintain the golf course grounds. The concessionaire employs additional staff to manage the golf and food/beverage operations, although the total staff at the facility is not large. The key NGF finding related to this data is that there clearly is not sufficient staff to maintain this facility to the standard that would allow Lincoln Park to compete effectively with other golf facilities.
Concession Agreements The concession agreement in place at Lincoln Park is summarized below. We note that this was an incomplete document.
An Assignment, Assumption and Consent Agreement between the City and County of San Francisco (City), Arnold Palmer Golf Management LLC (Assignor), and Yugi Golf Management LLC (Assignee) was dated March 20, 2001 (effective March 1, 2001). Assignor and City were parties to a lease dated April 22, 1983; amended by a memorandum of understanding dated February 20, 1986; and further amended from time to time. By this agreement, Assignee took over all of Assignor’s interests and obligations under the lease. City consented and released Assignor.
Attached as Exhibit A is an undated lease agreement for restaurant and golf pro shop at Lincoln Park Golf Course that has missing pages in our copy. It is between the Recreation and Park Commission (on behalf of the City and County of San Francisco) and California Golf Centers, Inc. and was approved by the Board of Supervisors on April 19, 1983. The term is for 10 years with a possible extension of one 5-year period. The agreement notes the City is to collect all green fee revenue and 25 percent (25%) of all other ancillary revenues to the facility.
Also attached is a February 20, 1986 memorandum of understanding for golf pro shop lease at Harding/Fleming Park Golf Course and Lincoln Park Golf Course. The agreement is between the Recreation and Park Commission and Silband Sports Corporation (formerly California Golf Center, Inc.) The purpose of the MOU was to clarify the 1983 lease.
Marketing and Revenue Enhancement Activities It is our understanding that Lincoln Park Golf Course tends to attract a very local and unchanging clientele, and that little is done by either the City or the operator in terms of marketing. However, Lincoln does draw some ancillary revenue and publicity from occasional photo shoots and even national advertising campaigns and movies featuring the 17th hole (a Nike ad featuring Ernie Els teeing off into San Francisco Bay hangs in the clubhouse).
NGF Consulting believes that Lincoln Park has an excellent opportunity to draw significant tourist play through aggressive marketing, but that this opportunity will be achievable only after the facility is brought up to a quality level at least comparable to competing facilities as documented in this report. We also feel that there is potential to raise non-resident play

National Golf Foundation Consulting, Inc. – City of San Francisco, California – 106
significantly once the facility is improved and marketed. High fee tournament/ outing business should also improve markedly after improvements.
Finally, the legacy of Jack Neville (co-designer of Pebble Beach) and Herbert Fowler (a respected British designer) are all but forgotten at Lincoln Park. While much of Neville’s work is likely lost to years of remodeling and change, it can certainly be said that both men were responsible for establishing much of the routing and anatomy of Lincoln Park’s current layout. This legacy is worth marketing and touting by the City.
Fee Structure The pricing structure for Lincoln Park is outlined in the table shown below:
Lincoln Park
Weekday Weekend Standard $32 $36 Resident $20 $24 Senior $12 $19 Junior $10 $19 Back 9/10 $11 $15 Twilight $19 $23 Tournament $38 $47 Driving Range/Cage: Cage Call for Info
$1.00 per person will be added to above rates if reservations are made through the Automated Reservation System Weekday = M-Th; Weekend = F-Sun
With green fees identical to those at Sharp Park, fees at Lincoln Park are among the lowest in this municipal market. Also like Sharp, the fees at Lincoln are market appropriate given the poor conditioning documented in this report and the quality of the support amenities, and the facility must first be rehabilitated before any meaningful price increases would be absorbed by the market without a further decrease in rounds.
Lincoln Park – Golfer Survey Overview NGF implemented GSP at Lincoln Park to gauge opinions from the facility’s golfers. A total of 144 surveys were collected by NGF, with 67 completed by those identifying themselves as City residents. The ratings from the total survey group are displayed in the table below. A complete listing of results from the survey is provided in the GSP Appendix Book for complete GSP responses.

National Golf Foundation Consulting, Inc. – City of San Francisco, California – 107
Lincoln Park Golf Course
144 Responses 11/14/2006 – 1/8/2007
Factor
Average Score
(Scale 1-5) 6-Scenery and Aesthetics of Course 4.5 14-Affordability 4.1 2-Convenience of Course Location 4.1 3-Tee-time Availability 3.8 10-Friendliness/Service of Staff 3.4 1-Overall Value of Course 3.4 13-Overall experience 3.1 7-Pace of Play 2.9 8-Condition of Golf Cars 2.5 11-Food and Beverage Service 2.4 9-Amenities (clubhouse, pro shop, locker room) 2.2 12-On-course Services (restrooms, drinking water) 2.2 4-Overall Course Conditions 2.2 5-Condition of Greens 2.0
Average Score: 1 = very dissatisfied; 2 = somewhat dissatisfied; 3 = neither satisfied nor dissatisfied;4 = somewhat satisfied; 5 = very satisfied
Other Findings 1. Lincoln Park survey respondents rated the facility relatively high on the measures of
convenience of location, affordability, and scenery and aesthetics. The key business drivers on which Lincoln fared the poorest were condition of golf cars, food and beverage service, amenities, on-course services, overall course conditions, and condition of greens. Though ratings on factors such as overall value and friendliness/ service of staff were relatively low compared to national benchmark data, the absolute ratings for these measures did not show an average score indicating dissatisfaction. The survey group indicated that the golf course conditions should be the highest priority for improvement.
2. Our surveys also show a wide variety of other golf courses that are also played by Lincoln Park golfers, including other City courses like Harding Park and Sharp Park (both in the top five). Crystal Springs and the Presidio are the most popular other local facilities with this group, in addition to many other area golf facilities both public and private (consistent with lower loyalty).
3. The profile of the Lincoln Park golfer is predominantly male (90%) and somewhat older (96% over 30) than the national benchmark. One key finding was that golfers identifying themselves as “out-of-state visitors” represented only one percent (1%) of respondents, indicating a potential opportunity to grow rounds in this potentially lucrative segment. The map displaying the origin of customers is displayed in Appendix F to this report.
4. The survey indicated that 67% of respondents think that the overall quality of the City’s golf courses would improve if oversight and management of the golf system were not the City’s responsibility. Among the comments noted on this question was that a ‘private operator’ would be more likely to invest the dollars needed for improvement, and then

National Golf Foundation Consulting, Inc. – City of San Francisco, California – 108
hire motivated employees to protect the investment. The survey also revealed that 73% of respondents would play more frequently, 21% would not be affected, while only 5% they would play less if the conditions at Lincoln Park were improved AND fees increased.
5. City residents tend to rate the course slightly higher than non-residents, although the “atrocious” conditions are still a sore spot with both groups. The non-residents who filled out the survey tend to be older, wealthier and more likely to be female the City residents. Overall, the grades and importance factors tend to be roughly the same between the two survey groups.
6. Survey respondents were also asked to voice their opinions in an open-ended comments section that was part of the survey. Among the most common points raised include the need for better maintenance, particularly drainage (‘muddy’ conditions), and a need to improve the concessions (food & beverage). The respondents also voiced an expression that this facility could be a real jewel with its views and location and should be upgraded, even if it means higher green fees.
Golf Facility Performance and Data Analysis The performance data for the Lincoln Park golf operation have been analyzed in the following paragraphs.
Activity Levels Activity at Lincoln Park has fallen steadily since the 2002-03 fiscal year, settling at about +/- 35,000 rounds played in FY 2006, with rebound expected in FY2007. The rounds data as provided by the City of San Francisco are shown in the table below.
Lincoln Park Golf Course Rounds Played Fiscal Years 2003-2007*
FY2002-03 FY2003-04 FY2004-05 FY2005-06 FY2006-07*
Rounds Played 54,945 40,848 33,274 34,748 19,699 Source: City of San Francisco. *first five months of FY07

National Golf Foundation Consulting, Inc. – City of San Francisco, California – 109
Lincoln Park Golf Course Rounds Played by Type – FY2003-06
2002-2003 Weekday Weekend Total
Standard 9,069 8,780 17,849
Resident 6,948 8,827 15,775
Senior 6,577 1,454 8,031
Junior 1,035 426 1,461
Tournament 137 524 661
Twilight 4,506 3,542 8,048
Back 9 1,682 1,395 3,077
Total 29,954 24,948 54,902
2003-2004 Weekday Weekend Total Standard 5,153 7,711 12,864
Resident 5,151 8,212 13,363
Senior 4,493 943 5,436
Junior 598 531 1,129
Tournament 261 805 1,066
Twilight 2,819 2,547 5,366
Back 9 359 1,252 1,611
Total 18,834 22,001 40,835
2004-2005 Weekday Weekend Total Standard 3,317 6,818 10,135
Resident 3,723 6,811 10,531
Senior 3,385 890 4,275
Junior 420 463 883
Tournament 93 358 451
Twilight 2,895 3,120 6,015
Back 9 300 783 1,083
Total 14,133 19,243 33,376
2005-2006 Weekday Weekend Total Standard 3,598 6,605 10,203
Resident 3,998 6,833 10,831
Senior 3,115 569 3,684
Junior 344 423 767
Tournament 446 515 961
Twilight 3,304 3,367 6,671
Back 9 559 1,060 1,619
Total 15,364 19,372 34,736
Source: City of San Francisco.

National Golf Foundation Consulting, Inc. – City of San Francisco, California – 110
Capacity Issues The shorter-length 18-hole course at Lincoln Park should be able to achieve rounds played numbers up to 65,000+ rounds annually, indicating that the facility is under performing at less than 55 percent of capacity.
Revenue Analysis NGF Consulting has provided a summary of revenue performance for Lincoln Park GC for the past four full fiscal years, plus a preliminary estimate of green fee revenue in FY 2007. Overall, the data shows a clearly declining level of revenue performance, mirroring the decline in rounds activity through FY 2005-06. However, as with other courses in the system, Lincoln Park GC has had a rebound in rounds activity for the first five months of FY2006-07.
City of San Francisco Lincoln Park Golf Course Revenue (Fiscal Years 2004-2007*)
FY 2002-03 FY 2003-04 FY 2004-05 FY 2005-06Total Green Fees $1,238,408 $1,009,440 $786,798 $855,044
Merchandise $17,309 $8,912 $6,493 $6,395 Lessons $205,365 $116,388 $69,861 $76,919 F&B $256,067 $238,673 $182,436 $203,600 Golf Carts/Rentals $119,223 $83,996 $58,567 $60,882 Other $40,589 $37,663 $46,122 $56,346 Total Concession $638,553 $497,465 $366,779 $396,166 Total Facility Revenue $1,876,961 $1,506,905 $1,153,577 $1,251,210 Concession to City $91,152 $77,363 $61,850 $81,716Total City Revenue* $1,329,560 $1,086,803 $848,648 $936,760
Source: City of San Francisco and NGF Consulting Lessee revenues in italics.
In FY2002-03 (the last year of Arnold Palmer Golf Management) the Lincoln Park Golf Course generated about $1.67 million in total top-line gross revenue, falling to just under $1.15 million in FY2004-05, with a slight recovery in FY 2005-06, and a strong recovery seen in early FY2006-07. The figures in FY2004-05 represent a decline of 19 percent in green fee revenue (to the City) and 38 percent in concession items from the 2002-03 level. Unlike the other courses in the City system, Lincoln Park has experienced a more severe decline in concession revenue than green fee revenue. This may be a reflection of the diminished quality of ancillary services at the facility since the Arnold Palmer Golf Management team has departed.
Revenue Ratios and Ancillaries The City of San Francisco’s revenue at Lincoln Park GC is derived primarily from green fees and rent (concession) payments. Golf consumers present at the facility are also spending money on power cart rentals, retail items and food and beverage items. Average revenue per round estimates are displayed below:

National Golf Foundation Consulting, Inc. – City of San Francisco, California – 111
City of San Francisco Lincoln Park per Round Revenue (Fiscal Years 2004-2007)
FY 2003-04 FY 2004-05 FY 2005-06 FY 2006-07*Total Green Fees $24.40 $25.02 $25.85 $23.05
Merchandise $1.93 $1.87 $1.74 $1.14Lessons $0.29 $0.19 $0.24 $0.15F&B $2.10 $2.19 $1.43Golf Carts/Rentals $6.55 $6.96 $6.78 $4.43Other $0.12 $0.42 $0.27Total Concession $8.77 $11.23 $11.37 7.43
Total Facility Revenue $33.17 $36.25 $37.22 $30.48
Source: City of San Francisco and NGF Consulting
The above table shows a generally growing per round revenue performance of the Lincoln Park Golf Course, with a reduction back to FY2002-03 levels seen in early FY2006-07. It is our understanding that the food and beverage concession was closed in 2003-04, just after the departure of the previous (Arnold Palmer) management team.
Expense Analysis The City-provided Lincoln Park Golf Course expense performance appears in the table below. The figures show that the 2006-07 budget has grown to just over $1.21 million, about $350,000+ higher than the green fee revenue earned at the facility. It should be noted that this expense estimates do not include any capital improvement funds, operating encumbrance or a payment to the general fund.
City of San Francisco Lincoln Park Golf Course - Operations Expenses
Expenditure 2004-05 2005-06 2006-07 Budget
Salaries $536,942 $500,886 $680,711 Fringes $146,700 $142,475 $205,940 Overhead $234,429 $192,505 $245,031 Professional & Special Serv. $0 $4,350 Other Expenses $1,311 $1,866 Materials & Supplies $39,916 $60,907 $80,780 Equipment $0 $16,338 Facilities Maintenance $31,322 Expenditure Total $990,620 $914,977 $1,216,812
Source: City of San Francisco and NGF Consulting
Cost of Production NGF Consulting has derived from the Lincoln Park Golf Course financial statements that the total City expense to operate the facility was $914,977 in FY 2006 and budgeted at $1,216,812 for FY 2007. Given this amount and the actual rounds played, the facility cost of production ratios are as follows:

National Golf Foundation Consulting, Inc. – City of San Francisco, California – 112
Lincoln Park Golf Course Cost of Production (Fiscal Years 2005-2007)
2004-05 2005-06 2006-07 Budget
Golf Rounds 33,274 34,748 35,000 Expenditure Salaries $16.14 $14.41 $19.45 Fringes $4.41 $4.10 $5.88 Overhead $7.05 $5.54 $7.00 Professional & Special Serv. $0.12 Other Expenses $0.04 $0.05 Materials & Supplies $1.20 $1.75 $2.31 Equipment $0.47 Facilities Maintenance $0.94 Expenditure Total $29.77 $26.33 $34.77
Source: City of San Francisco and NGF Consulting
It is expected to cost the City of San Francisco about $34.77 total in FY2007 to produce each round of golf on the Lincoln Park Golf Course, EXCLUDING actual vendor expenses. As noted, there is no industry standard for an appropriate cost of production, but this figure should be compared to the revenue ratios and be considered whenever green fee schedules are being contemplated.
Other Issues at Lincoln Park Gas Carts / Month-to-month lease / Lack of Point-of-Sale System – see Sharp Park discussion.
Safety/Security - Non-golfers walking the course at Lincoln Park is apparently condoned, based on discussion with the operator and our own experience when touring the course. NGF consultants witnessed several non-golfers on the course, including a man walking his dog and a man with baby strapped to his back. The potential liability issues to the City here should be obvious, not to mention the distraction to golfers.
Clubhouse – The current clubhouse, though functional, is in a state of disrepair. Built in 1916, it may have some historic value, but it is not conducive to a high quality golf experience. NGF Consulting was told that it had “pre-existing non-conforming” ADA; status, and possible asbestos issues. Needless to say, the current facility would not be appropriate if the golf course itself were to be rehabilitated and high-fee tourist play actively sought.
Even if the City (or some other entity) preferred to renovate the clubhouse rather than replace it (thus preserving some of the historical significance), the cost of renovation for a building of similar size would likely be $2.5 million or more (especially if added banquet/function space or completely replaced). However, NGF Consulting sees this as necessary to maximizing the economic potential of Lincoln Park, in terms of both rounds played and other revenues. (Banquet and corporate meeting business would have great potential because of the views offered at Lincoln). NGF Consulting recommends hiring a structural engineer to determine if the building is worth renovating or it is best to simply replace it.

National Golf Foundation Consulting, Inc. – City of San Francisco, California – 113
Lincoln Park Best Case “As –Is” Financial Projections Based on the analysis conducted in early 2007, the NGF Consulting team has prepared an estimate of best case financial performance for the Lincoln Park Golf Course assuming that the facility continues operations on an “as-is” basis. The results of this analysis are shown in the table that follows.
Base Assumptions This proforma estimate is based on the assumption that the City continues its operation on an ‘as-is’ basis, with only minimal changes to the operation. NGF Consulting has assumed that rounds are held at actual FY2005-06 and FY2006-07 (partial) levels and that average revenue per round increases at a slight two percent (2%) per year. It is also assumed for this ‘best case’ scenario that City expenses are held in check to an average annual growth of four percent (4%), except fringe benefits that are eight percent (8%) per year through FY2012.
Proforma Estimate for Lincoln Park FY2007 – FY2012 The results of this analysis are shown in the table below:
City of San Francisco Lincoln Park Projected Golf Course Revenue (FY2007-2012)
FY 2006-07 FY 2007-08 FY 2008-09 FY 2009-10 FY 2010-11 FY 2011-12Rounds Played 47,000 47,000 47,000 47,000 47,000 47,000 Total Green Fee Revenue $1,083,405 $1,105,073 $1,127,175 $1,149,718 $1,172,712 $1,196,167Merchandise $53,683 $54,757 $55,852 $56,969 $58,108 $59,270 Lessons $7,158 $7,301 $7,447 $7,596 $7,748 $7,903 F&B $67,283 $68,628 $70,001 $71,401 $72,829 $74,285 Golf Carts/Rentals $208,290 $212,456 $216,705 $221,039 $225,460 $229,969 Other $12,884 $13,142 $13,404 $13,673 $13,946 $14,225 Total Concession $349,297 $356,283 $363,409 $370,677 $378,090 $385,652
Concession to City $87,324 $89,071 $90,852 $92,669 $94,523 $96,413Total City Revenue $1,170,729 $1,194,144 $1,218,027 $1,242,387 $1,267,235 $1,292,580Total Facility Revenue $1,432,702 $1,461,356 $1,490,583 $1,520,395 $1,550,803 $1,581,819Average Revenue per Round Green Fees $23.05 $23.51 $23.98 $24.46 $24.95 $25.45Merchandise $1.14 $1.17 $1.19 $1.21 $1.24 $1.26F&B $1.43 $1.46 $1.49 $1.52 $1.55 $1.58Golf Carts/Rentals $4.43 $4.52 $4.61 $4.70 $4.80 $4.89Total Concession $7.43 $7.58 $7.73 $7.89 $8.04 $8.21Expenditure Salaries $680,711 $707,939 $736,257 $765,707 $796,336 $828,189 Fringes $205,940 $222,415 $240,208 $259,425 $280,179 $302,593 Overhead $245,031 $254,832 $265,026 $275,627 $286,652 $298,118 Professional & Special Serv. $4,350 $4,524 $4,705 $4,893 $5,089 $5,292 Other Expenses $0 $0 $0 $0 $0 $0 Materials & Supplies $80,780 $84,011 $87,372 $90,867 $94,501 $98,281 Expenditure Total $1,216,812 $1,273,722 $1,333,568 $1,396,519 $1,462,756 $1,532,474 Surplus (Deficit) ($46,083) ($79,578) ($115,541) ($154,131) ($195,521) ($239,894)
Italics indicate concessionaire revenue (total or included)

National Golf Foundation Consulting, Inc. – City of San Francisco, California – 114
GOLDEN GATE PARK GOLF COURSE The Golden Gate Park Golf Course is a 9-hole, par-3 golf layout built within the famous Golden Gate Park. The course is located near the western end of the park and is accessible through several Park entrances near the Chain of Lakes Drive and the Beach Chalet. This facility serves a niche in the local golf market, serving primarily juniors and other less-skilled golfers. The facility is also appealing in that it offers the local City golfers a round of golf with a shorter duration, which is important today because NGF studies have shown that time availability is the most often cited reason for declines in golf participation.
Golden Gate Park GC Location and History
Golden Gate Park GC History Credit is given—at least partially—to San Francisco Chronicle sports writer, Art Rosenbaum, who in 1948 suggested that the City undertake development of a short, 18-hole beginner’s course. The City eventually chose an area of Golden Gate Park that had been used for dumping. Jack Fleming was hired to create a design for the 18-hole “short” course. Although his plans called for 18 holes, the City opted to build just 9 holes, figuring they could add on later. The Golden Gate Park Course was immensely popular in its early days with green fees of less than $1.00.
Inventory of Facilities Golden Gate Park Golf Course includes a 9-hole golf course, clubhouse, practice green and netted practice hitting area. A summary of these amenities follows:
Golf Course - The Golden Gate Park golf course plays to a total of 1,357 yards, with all 9-holes being par-3’s ranging from 109 to 193 yards. The short, simple golf course provides for ease of play for all skill levels and certainly is easy to walk. Further, five of the nine holes are in immediate proximity to the clubhouse for additional ease of access. This golf course has strong appeal to less-skilled golfers and the present staff works to promote the facility to beginners of all ages, thereby providing a potential ‘feeder’ facility to help grow the number of golfers in San Francisco that can participate at this and all other City golf facilities.

National Golf Foundation Consulting, Inc. – City of San Francisco, California – 115
Practice Amenities – Golden Gate offers very simple practice amenities including a small putting green just off the clubhouse, and a caged hitting station for full swing practice. While simple in nature this ‘swing cage’ set up appears to be a nice fit for the Golden Gate facility and an excellent source of additional revenue for the facility, in addition to providing a station for full swing practice and lessons. This full swing cage was added at the expense of the present operator, though it was eventually sold to the City and is being paid off in installments.
Google Earth image shows limited space for additional practice facilities
Clubhouse - The current clubhouse is a small facility that primarily serves as a snack bar area for the facility. The space includes a small kitchen with a counter and seating for no more than 20+ patrons. A small selection of golf items are also displayed for sales in the open space. Outside, the present operator has added a deck area with tables for additional outdoor seating. The food and beverage concession goes by the name “Ironwood BBQ,” and offers a diverse menu and daily specials. The facility promotes itself well and uses the Ironwood BBQ brand to attract non-golfers to the facility for lunches. The facility is also capable of hosting some parties and events, although the sizes are limited.
Maintenance Facility and Equipment - Equipment for aeration is brought in from other facilities. As a result, aeration is infrequent. A barn serves to house the few pieces of equipment present at this golf course. It can be described as cozy, old and barely large enough for a few mowers and some hand tools. Security can be a problem. A new, larger facility should be considered.
Physical Review NGF Consulting has reviewed the physical condition of the Golden Gate Park Golf Course under the same methodology as described previously. The specific physical enhancement recommendations and associated costs are presented in the Recommendations section later in this report. The key physical issues uncovered at Golden Gate Park include the following:
• Maintenance Staff - The City gets by with just one full time employee to take care of this roughly 25-acre facility. This facility should have 3-4 full-time maintenance staff, with perhaps two sufficing during off season times.
• Arbor Care - Trees need thinning and removal in some areas, thereby allowing for better air circulation and sunlight. The operator reports that people looking for lost balls under fallen tree limbs has contributed to slow pace of play.
National Golf Foundation Consulting, Inc. – City of San Francisco, California – 116
• Feature Remodeling - The staff undertakes re-building of selected golf features, including bunkers, etc. While this is admirable, much of the work is contrary to design aesthetics and strategy. The floor is way too high and there remains very little challenge in the hazard. In essence, the charm and appeal of the bunkers are being lost to work that is well intentioned, but incorrectly executed. Worse, labor and funds are being spent that should be better earmarked. To rectify this situation, a master plan and guidance by a professional golf course architect is called for.
• Maintenance Approach - Golden Gate Park’s limited crew results in a golf maintenance program that is only able to address the most basic course needs. There is barely time to cut new holes in the practice putting green, a customary and necessary management practice. As with the other city-operated golf maintenance staffs, the staff at Golden Gate falls under the same labor union that manages non-golf city parks and has the same non-industry appropriate position categories. The result is an awkward situation when the irrigation system needs repair or large equipment is needed to be operated.
• Maintenance Supervisor - The maintenance supervisor is shared with Lincoln Park Golf Course. This seems to work well considering that Golden Gate Park Golf Course is quite small and simple to care for. However, in considering the much-needed attention at Lincoln Park, this situation may cause undue stress when supervision is needed at Golden Gate.
Operations Overview Staffing As noted there is only one City employee to maintain the entire Golden Gate golf facility. The concessionaire employs a very small additional staff to manage the golf and food/beverage operations. Exacerbating the problem is that the lone gardener is off on Thursday and Friday (ahead of normally heavier weekend play), and reportedly spends two to three days per week at Lincoln. While NGF Consulting believes that there is insufficient staff to maintain this facility to high standards, this issue is less severe at this facility than at the other 18-hole courses in the City system (Sharp, Harding and Lincoln).
Concession Agreement This management agreement for Pro Shop and Food & Beverage concession services between the City and County of San Francisco (City) and Global Golf Management, LLC (Manager) was dated May 26, 2004. The term is for seven years from July 1, 2004 through June 30, 2011. No provision for extension except “holdover on a month-to-month basis upon mutual agreement. City pays a management fee of $300,000 annually at $25,000 per month. Security deposit $25,000.
All gross revenues go to the City, except for golf instruction and beer/wine sales.
Incentive fees are paid by the City to the Manager after the end of each anniversary date of the initial term of the agreement:
• Food & Beverage – 80% above Annual Budget Figure (ABF) • Merchandise/Equipment Sales – 80% above ABF • Practice/Driving Range – 20% above ABF • Green Fees – 10% above ABF • Club and Pull Cart Rentals – 5% above ABF

National Golf Foundation Consulting, Inc. – City of San Francisco, California – 117
The Annual Budget Figure is the projected base revenue target for individual revenue streams presented as part of Manager’s Annual Budget, which is approved by the City’s General Manager.
Under specified guidelines, Manager is entitled to compensation for additional services required by the City that increase personnel costs above standard staffing levels. The City will pay payroll and benefit expenses plus a management fee of 10% of such payments. Approval required for additional funding.
Reimbursable expenses approved in the initial agreement:
• Driving Cage – City agreed to pay Manager $65,461.54 reimbursement for planning, design, purchase and other costs for installation of a 9-station driving cage. Paid in 5 annual installments.
• Product Inventory – City agreed to purchase from Manager existing inventory of merchandise and food and beverage items in stock at time of contract initiation, to serve as a starting inventory for the Manager.
Manager supervises all golf activities that comprise the day-to-day business operation of the 9-hole course. Manager maintains structures, grounds, parking lots, and walkways. The City maintains the golf course. Manager is required to accommodate all First Tee activities.
Marketing and Revenue Enhancement Opportunities As is the case with the other subject courses, the City does little, if anything, to promote Golden Gate Park Golf Course. This is unfortunate as this facility can act as a feeder golf course for the rest of the courses in the system, as it is ideal for cultivating new players. The operator is active in promoting the facility, especially through personal selling and establishing strong relationships with customers (during NGF’s visit, it seemed that Bruce Olsen was on a first name basis with everybody). Other marketing activities at Golden Gate include:
• Cultivation of a very active lesson and junior program • Creation of a quality dedicated website • Separate promotion of Ironwoods BBQ • Display ad in Yellow Pages • Direct mail marketing
Fee Structure The pricing structure for Golden Gate Park is outlined in the table shown below:

National Golf Foundation Consulting, Inc. – City of San Francisco, California – 118
Golden Gate Park Weekday Weekend Standard $14 $18 Resident $10 $12 Senior $7 $10 Junior $4 $6 Twilight $7 $8 Tournament $17 $25 Driving Range/Cage: Cage $3 $5
small bucket
(approx. 25 balls) large bucket
(approx. 75 balls)
Weekday = M-Th; Weekend = F-Sun As noted in the competitive section, fees at Golden Gate Park are in line with area comparable courses, and are commensurate with the market the facility serves – beginners, juniors, and families. As Golden Gate can effectively serve as a cultivator of new players and a feeder facility for the rest of the San Francisco municipal golf system, its fees should be affordable to the majority of residents, though there may be room for moderate increases without a decrease in play or putting an undue burden on golfers.
Golden Gate Park GC – Golfer Survey Overview NGF implemented GSP at Golden Gate Park to gauge opinions from the facility’s golfers. A total of 84 surveys were collected by NGF. The ratings from the total survey group are displayed in the table below. Further details are contained in the associated GSP Appendix Book.
Golden Gate Park Golf Course 84 Responses
11/14/2006 – 1/8/2007
Factor
Average Score
(Scale 1-5) 2-Convenience of Course Location 4.7 1-Overall Value of Course 4.6 14-Affordability 4.5 6-Scenery and Aesthetics of Course 4.5 10-Friendliness/Service of Staff 4.5 13-Overall experience 4.4 3-Tee-time Availability 4.4 11-Food and Beverage Service 4.2 9-Amenities (clubhouse, pro shop, locker room) 3.8 7-Pace of Play 3.8 4-Overall Course Conditions 3.7 12-On-course Services (restrooms, drinking water) 3.5 5-Condition of Greens 3.5 8-Condition of Golf Cars 3.2
Average Score: 1 = very dissatisfied; 2 = somewhat dissatisfied; 3 = neither satisfied nor dissatisfied;4 = somewhat satisfied; 5 = very satisfied

National Golf Foundation Consulting, Inc. – City of San Francisco, California – 119
Other Findings 1. Overall, Golden Gate Park golfers are about 50% loyal to the facility, much higher than
the national benchmark of 5% (‘value’ facility benchmark) and the highest in the City golf system. It is clear that golfers at this facility are satisfied in every aspect of the operation, except the golf carts of which there are none. The survey group indicated that the condition of the greens is the only area that is in need of improvement.
2. Our surveys also show the other City courses Harding Park, Lincoln, Gleneagles and Sharpe Park were all in the top six competing golf facilities.
3. The profile of the Golden Gate Park golfer shows the highest proportion of females (24%) and a generally younger (52% under 50) golfer than at other City facilities. The course tends to draw a very local clientele as 87% of respondents identified themselves as City residents. The map displaying the origin of customers is in Appendix F.
4. Unlike at the other facilities, most respondents (58%) think that the overall quality of the City’s golf courses would NOT improve if oversight and management of the golf system were taken away from the City. The survey also revealed that a majority of respondents (83%) would prefer to keep the fees low in lieu of improvements.
5. Survey respondents were also asked to voice their opinions in an open-ended comments section that was part of the survey. Among the most common points raised include the need for a beginner-oriented facility like this and the need to keep fees low. The respondents also voiced an appreciation for the quality of the Ironwoods BBQ food and beverage concession.
Golf Facility Performance and Data Analysis The performance data for the Golden Gate Park golf operation are presented below.
Activity Levels The +/- 47,000 rounds played at Golden Gate Park in FY 2005-06 represents a considerable decline from the earlier years of the decade when the small 9-hole facility was hosting upwards of 68,000+ rounds. The rounds data as provided by the City of San Francisco are shown in the table below.
Golden Gate Park Golf Course Rounds Played Fiscal Years 2002-2007*
FY 2001-02 FY 2002-03 FY 2003-04 FY 2004-05 FY 2005-06 FY 2006-07*
55,601 67,916 57,136 48,298 44,823 18,558 Source: City of San Francisco. *Through 11/30/2006 (5 months).
Capacity Issues NGF Consulting expects a short-length, 9-hole par-3 golf course like the Golden Gate Park GC should be able to achieve rounds played numbers up to 60,000+ rounds annually, indicating that this facility is operating at well below capacity.
Revenue Analysis NGF Consulting has reviewed the financial statements and presented the revenue performance for Golden Gate Park GC in the following tables. This data shows that Golden Gate Park is

National Golf Foundation Consulting, Inc. – City of San Francisco, California – 120
capable of generating revenues of $850,000+, and more than $15 per round of golf. We note that data shows green fee revenue per round is up in FY 2006-07, while ancillary revenue per round has fallen slightly.
The operator has created two profitable revenue centers that did not exist before they took over – lessons and a hitting cage – and built up the food & beverage operation, indicating a strong degree of business savvy. The hitting cage (driving range) added in 2004 has been generating upwards of $35,000+, and unlike other revenue centers at the facility is still trending upwards. In all, $35,000+ in revenue for a hitting cage like this is a very strong level of revenue and likely indicative of demand for range use in the City. It is clear that the driving range revenue, much of which comes from customers who do not play a round of golf, will be the key to the future growth in revenue at this facility. Lessons, which accrue to the operator, are also a strong performer, averaging more than $140,000 over the last two years.
City of San Francisco Golden Gate Park Golf Course Revenue
(Fiscal Years 2002-2007)
FY 2002-03 FY 2003-04 FY 2004-05* FY 2005-06*Rounds Played 67,916 57,136 48,114 43,462 Total Green Fees $670,340 $573,269 $479,265 $515,691
Lessons $74,124 $130,474 $0 $0 F&B $79,394 $85,995 $44,494 $78,977 Carts Rentals $21,051 $4,726 $19,419 $18,681 Merchandise $35,279 $17,255 $37,152 $28,260 Range $35,888 $35,059 $29,389 $35,298 Gross Concession $241,943 $312,839 $130,454 $161,217City Concession $12,293 $14,857 $130,454 $161,217Total City Revenue $682,633 $588,126 $609,719 $676,908
Concessionaire Revenue Lessons $229,650 $297,982 $140,000 $140,000Beer Sales $34,338 $42,370Total Facility Revenue $912,283 $886,108 $784,057 $859,278
Source: City of San Francisco, Global Golf Mgt. + NGF Consulting. Lessons not payable under new City agreement beginning 7/1/04.

National Golf Foundation Consulting, Inc. – City of San Francisco, California – 121
City of San Francisco Golden Gate Park Golf Course Revenue per Round
(Fiscal Years 2002-2007)
FY 2001-02* FY 2002-03* FY 2003-04* FY 2004-05 FY 2005-06 FY 2006-07* Total Green Fee Revenue $7.98 $7.70 $10.04 $9.93 $11.25 $14.04
Lessons $0.23 $1.32 $2.52 $2.91 $3.22 $2.93F&B $1.18 $1.33 $1.54 $1.03 $2.07 $2.06Golf Carts/Pull Carts $0.25 $0.64 $0.66 Equipment Rentals $0.23 $0.22 $0.21 $0.40 $0.52 $0.46Merchandise $0.45 $0.53 $0.85 $0.84 $0.75 $0.62Range $0.61 $0.84 $0.77Total Concession $2.34 $4.04 $5.77 $5.80 $7.40 $6.84
Total Revenue $10.32 $11.74 $15.81 $15.73 $18.66 $20.88
Expense Analysis The City-provided Golden Gate Park Golf Course expense performance appears in the table below. The figures show that the 2006-07 budget now stands at roughly the same $600,000 level from the previous year (with a slight decline). As such, this facility is showing an operation profit for the City, unlike the other City courses we have examined. The high cost of labor allocated to these City golf courses is evident here, as Golden Gate was assigned $234,935 (FY2006) in labor expense for sharing a teamster, a gardener, and a gardening supervisor.
City of San Francisco Golden Gate Park Golf Course - Operations Expenses
Expenditure 2004-05 2005-06 2006-07 Budget
Salaries $136,620 $186,671 $163,422 Fringes $29,016 $48,264 $47,506 Overhead $40,240 $46,936 $58,832 Professional & Special Serv. $0 $313,776 $313,550 Other Expenses $300 $474 Materials & Supplies $2,171 $6,781 $10,831 Facilities Maintenance $1,819 Expenditure Total $210,166 $602,902 $594,141
Source: City of San Francisco and NGF Consulting
Cost of Production Given the above noted expense estimates and the actual rounds played, the facility cost of production ratios are as follows:

National Golf Foundation Consulting, Inc. – City of San Francisco, California – 122
Golden Gate Park Golf Course Cost of Production (Fiscal Years 2005-2007)
2004-05 2005-06 2006-07 Budget
Golf Rounds 48,298 44,823 45,000 Expenditure Salaries $2.83 $4.16 $3.63 Fringes $0.60 $1.08 $1.06 Overhead $0.83 $1.05 $1.31 Professional & Special Serv. $0.00 $7.00 $6.97 Other Expenses $0.01 $0.01 $0.00 Materials & Supplies $0.04 $0.15 $0.24 Facilities Maintenance $0.04 $0.00 $0.00 Expenditure Total $4.35 $13.45 $13.20
Source: City of San Francisco and NGF Consulting
It is expected to cost the City of San Francisco about $13.20 total in FY2007 to produce each round of golf on the Golden Gate Park Golf Course, EXCLUDING actual vendor expenses.
Golden Gate Park Best Case “As –Is” Financial Projections Based on the analysis conducted in early 2007, the NGF Consulting team has prepared an estimate of best case financial performance for the Golden Gate Park Golf Course assuming that the facility continues operations on an “as-is” basis. The results of this analysis are shown in the following exhibits:
Base Assumptions This proforma estimate is based on the assumption that the City continues its operation on an ‘as-is’ basis, with only minimal changes to the operation. NGF Consulting has assumed that rounds are consistent with actual FY2005-06 levels and projected FY2006-07 figures. We also assume average revenue per round increases at a slight two percent (2%) per year. The facility expenses are projected to increase at four percent (4%) per year, with eight percent (8%) increases in fringe benefits through 2012.
Proforma Estimate for Golden Gate Park FY2007 – FY2012 The results of this analysis are shown in the table on the following page:

National Golf Foundation Consulting, Inc. – City of San Francisco, California – 123
City of San Francisco Golden Gate Park Golf Course Projected Revenue
(Fiscal Years 2007-2012)
FY 2007-08 FY 2008-09 FY 2009-10 FY 2010-11 FY 2011-12 Rounds Played 45,000 45,000 45,000 45,000 45,000 Total Green Fee Revenue $644,470 $657,359 $670,506 $683,917 $697,595
F&B $94,385 $96,272 $98,198 $100,162 $102,165Equipment Rentals $21,033 $21,454 $21,883 $22,321 $22,767Merchandise $28,310 $28,876 $29,454 $30,043 $30,643Range $35,487 $36,197 $36,921 $37,659 $38,413Gross City Concession $179,215 $182,799 $186,455 $190,184 $193,988Less: Direct Sales Cost $14,657 $14,950 $15,249 $15,554 $15,865COGS % 8.2% 8.2% 8.2% 8.2% 8.2%City Concession $164,558 $167,849 $171,206 $174,631 $178,123 Total City Revenue $809,028 $825,209 $841,713 $858,547 $875,718 Concessionaire Revenue Lessons $82,753 $84,408 $86,096 $87,818 $89,574 Beer Sales $23,682 $24,156 $24,639 $25,132 $25,634
Total Facility Revenue $915,463 $933,772 $952,447 $971,496 $990,926 Average Revenue per Round Green Fees $14.32 $14.61 $14.90 $15.20 $15.50Beer $0.53 $0.54 $0.55 $0.56 $0.57Lessons $1.84 $1.88 $1.91 $1.95 $1.99F&B $2.10 $2.14 $2.18 $2.23 $2.27Equipment Rentals $0.47 $0.48 $0.49 $0.50 $0.51Merchandise $0.63 $0.64 $0.65 $0.67 $0.68Range $0.79 $0.80 $0.82 $0.84 $0.85Total Concession $5.82 $5.94 $6.06 $6.18 $6.30Total Revenue $20.14 $20.55 $20.96 $21.38 $21.80 Expenditure Salaries $169,959 $176,757 $183,828 $191,181 $198,828 Fringes $51,306 $55,411 $59,844 $64,631 $69,802 Overhead $61,185 $63,633 $66,178 $68,825 $71,578 Professional & Special Serv. $326,092 $339,136 $352,701 $366,809 $381,482 Other Expenses $0 $0 $0 $0 $0 Materials & Supplies $11,264 $11,715 $12,183 $12,671 $13,178 Facilities Maintenance $0 $0 $0 $0 $0 Expenditure Total $619,807 $646,651 $674,734 $704,117 $734,867 Surplus (Deficit) $189,221 $178,557 $166,979 $154,430 $140,851
Italics indicate concessionaire revenue (total or included)

National Golf Foundation Consulting, Inc. – City of San Francisco, California – 124
GLENEAGLES GOLF COURSE (MCLAREN PARK) The Gleneagles Golf Course is a small 9-hole golf course located at McLaren Park in the southeastern part of the City of San Francisco. The golf course was carved out of a hillside and is bordered on two sides by residences in the Excelsior and Visitacion Valley districts. The course occupies about 50 acres out of 300 acres that make up McLaren Park.
This facility has been leased to a private operator since its inception in the 1960s, and has been promoted as a tough test of golf for better skilled players seeking a time-shortened round of challenging golf. The facility is another of the City golf courses that has appeal in that it offers a round of golf with a shorter duration to appeal to a growing segment of time-constrained golfers.
Gleneagles GC Location and History
Gleneagles GC History Jack Fleming designed the course in 1962, arguing with City officials that the more gradual terrain at the upper portion of the 300-acre park would be better suited to golf. Fleming lost—but was probably correct in his belief given the drainage and saturated soil problems facing Gleneagles today.
Budgets were reported to be exceeded in the construction, as was a failure to follow Fleming’s plans. Fleming had designed Golden Gate Park Golf Course for the City in 1950 and it was through this connection that he became involved in the golf course at McLaren Park. Fleming did his best, creating nine unique golf holes on what—even today—would be considered a nearly impossible site. Keeping in mind that Fleming was not given authority to move much material, the 9-hole course is quite remarkable.
The City eventually considered closing the course, citing a lack of business and conditions that were atrocious. Robert Muir Graves, a golf course architect from northern California, made modifications in 1982. Eric de Lambert eventually took over the course on a month-to-month lease. De Lambert made his own changes, most notably the new No. 1 green that sits awkwardly above the old green’s location on a steep hillside. New management has been contracted with the City on a lease-basis.

National Golf Foundation Consulting, Inc. – City of San Francisco, California – 125
Inventory of Facilities Gleneagles Golf Course includes a 9-hole golf course, clubhouse and practice green. A summary of these amenities follows:
Golf Course - The Gleneagles golf course plays to a total of 3,006 yards, although a second set of tees allows a golfer to play a second nine holes from 2,854 yards. Otherwise, the course plays as normal with two par-5s and two par 3s. As noted, the hilly site makes the golf here somewhat difficult and provides a real challenge for better golfers. The hills have also created some very awkward shots in the playing of golf.
Practice Amenities – There are no practice facilities for hitting warm-up shots. The lessee communicated a concept to install a few hitting nets (cages) against the hillside behind and adjacent to the maintenance building. This seems a reasonable idea and one that may positively affect business and enjoyment of the course.
Clubhouse - The current clubhouse is a small facility that emphasizes the Scottish pub-type atmosphere. The small, full-service bar is very popular with golfers and other locals. There is limited food service, and a very small retail area. Total seating inside is for about 30, while an outside seating area accommodates several small tables and perhaps 20 people.
Maintenance Facility and Equipment - Equipment is old and not entirely in working order. The lessee has made improvements and purchased some newer equipment. The old facility does an adequate job of housing equipment, but needs repairs.
Physical Review NGF Consulting has reviewed the physical condition of the Gleneagles Golf Course under the same methodology as described previously. Specific physical enhancement recommendations and associated costs are presented in the Recommendations section later in this report. The key physical issues uncovered at Gleneagles include the following:
• Poor Turf Conditions - Turf problems are evident where drainage and/or irrigation coverage is most lacking. Additionally, turf issues are present in shady areas where trees need to be thinned or removed. Soils at Gleneagles have endured years of poor drainage and build-up of organics, resulting in mucky areas where good drainage is now nearly impossible, and turf suffers from aerobic soils that drain and allow oxygen to reach roots. Kikuyugrass (Pennisetum clandestinum) has infested portions of the course but this may actually be welcome in many areas where grass does not grow at all. Greens are frequently soft and mushy. Topdressing and aerification has been successful in rectifying conditions in some areas, but more needs to be done. Greens are virtually unplayable in wet conditions due to the spongy nature of the soil and its tendency to not allow proper drainage.
• Irrigation - The irrigation system at Gleneagles is old and outdated. Many components are held together with retrofitted parts. However, the very small staff makes due and seems to deliver water very efficiently.
• Drainage - Drainage problems are due to the fact that this golf course is built on a hillside, and the slopes allow run-off to infiltrate features and downhill areas of the course. A very well placed and engineered drainage intercept trench along the entirety of the upper flanks of the golf course is required. Once such an improvement is in place, it would then leave only the seepage and watershed that falls on the course itself to be dealt with. On a positive note, the sloping terrain supports positive

National Golf Foundation Consulting, Inc. – City of San Francisco, California – 126
drainage. Obviously it is the wet season when drainage is most troublesome, but Gleneagles experiences a significant amount of wet areas even when it is relatively dry in the rest of the Bay area.
• The greens need significant drainage improvements. Some work has been done, but without a formal plan. The lessee is to be commended on efforts thus far, but could likely realize even better results if a plan were crafted and followed as investment dollars were expended.
• Arbor Care - The City is no longer responsible for the care of the trees on the course, which is the lessee’s responsibility. Much progress has been made in just the past six months, but more work is required. As with the other City courses, Gleneagles needs a well-crafted tree plan. The City should recognize that the trees remain an asset of the park and, ideally, participate in assisting the lessee with needs associated with arbor care.
• Safety – Some added tees may be ill-positioned in relation to greens and fairways. Also, while tree lined fairways provide buffering, they also restrict views and prevent golfers from warning one another with the cry of “fore” when an errant shot may pose danger. A study of changes (added tees) should be undertaken to determine if any adjustments may be warranted.
• Cart Paths - A loosely established collection of paths, some of which are not connected, wind their way around the course. Many of these paths are poorly aligned, have no drainage associated with them, and have developed significant rutting. The result is a “system” of paths that often appear as deep trenches, and in some cases as wide ditches. With little gravel or base, they become deeper. This situation is not entirely detrimental given the fact that Gleneagles does not have many cart users and features a fleet of only 15 carts. But it is essential that maintenance equipment has good access to areas of the course. This is especially important in wet climates such as San Francisco, and on steep sites such as this.
Lease Approach Relative to Conditions and Maintenance The approach to lease the facility seems to have lifted a burden from the City, but it must be realized that the City is still in ownership of the golf course asset. Therefore, the “asset” needs to be addressed in the context of improvements that are allowed to be made, as well as the sequence and the quality of allowed improvements. The City should undertake the lead in examining such questions as the Gleneagles lease is carried out.
Operations Overview Staffing As noted the City does not have any employees associated with the Gleneagles operation, as all employees work for the lessee. The lessee has four full-time workers – a General Partner, a head groundskeeper, and two other groundskeepers. There are approximately six part-time workers. Labor is brought in as needed for special projects.
Concession Agreement This lease for management, maintenance and operation of the 9-hole golf course and all ancillary activities between the City and County of San Francisco (City) and Gleneagles Golf Partners, LP (Tenant) was dated December 1, 2004. The term is for nine years from December 1, 2004 through November 30, 2013. At the end of lease term, either party has the option to extend the lease for nine more years, upon approval by City. If the option is not taken, holding

National Golf Foundation Consulting, Inc. – City of San Francisco, California – 127
over on a month-to-month basis is allowed within guidelines. Tenant paid a security deposit of $25,000.
Tenant pays City a base rent of 7% of monthly gross revenues plus participation rent of 2% of gross revenues between $737,337 and $860,050 and 3% of amount above $860,050.
Tenant may be allowed rent credits for City-required improvements, upon City approval.
Tenant agreed to make specific facility improvements:
• Year 1-2: Improvements to entrance, clubhouse, kitchen and patio area; trim and remove tree limbs. Explore adding a driving range/cage. $50,000 estimated cost.
• Years 2-4: Review possibility of adding forward tees on several holes; lease new equipment. $50,000 estimated cost.
• Year 4-5: Based on financial feasibility studies, implement driving range. Purchase new TVs for clubhouse. $50,000 estimated cost.
• Year 6-7: Review cart path and conduct major renovation of cart paths; review condition of parking lot and driveway and possibly repave and stripe. $100,000 estimated cost.
Tenant may not assign or sublet without City approval.
Marketing and Revenue Enhancement Opportunities The lessee does an excellent job marketing the course. In his 2006 book, To the Nines, Anthony Pioppi devotes a chapter to Gleneagles. Pioppi calls the course one of the most interesting and difficult 9-holes layouts in America. Among his observations are that there is almost a cult following of patrons at Gleneagles. Gleneagles sports a resilient “membership” of players who are devoted to fast play, good golf and extreme care for the course. Indeed, if not for the caring attitude of the majority of regulars, Gleneagles would be an awful mess of divots, ball marks and very slow paced rounds.
The operator does maintain a dedicated website (gleneaglesgolfsf.com) for Gleneagles; the site features a basic history of the course, as well as a scorecard and basic information regarding directions and rates. Attractive pictures of the course scroll through the screen as one reads about the facility. In addition to the website, the operators do some advertising, including a recent 2-page ad in the “Bay Area and Northern California Golf Guide”. The first page of the ad includes basic information for Gleneagles, as well as an interesting write-up. The facing page is an elegant, non-busy ad with Scottish-themed illustrations and the theme: “So difficult, we stopped building after nine holes”.
Fee Structure The pricing structure for Gleneagles is outlined in the table shown below. Though the agreement with the City is structured as a ground lease, the Board of Supervisors must approve proposed green fee increases. Fees at Gleneagles are in line with the only other 9-hole regulation length courses in the regional market – Diablo Hills, which is about 25 miles away in Walnut Creek, and Fremont Park, 28 miles away in Fremont.

National Golf Foundation Consulting, Inc. – City of San Francisco, California – 128
Gleneagles Golf Course Weekday Weekend 9 Holes $13 $16 18 Holes $20 $27 Seniors (65+) $90 for 10 rounds Juniors (17 and under) $90 for 10 rounds Carts ( two riders): 9 Holes $14 $14 18 Holes $24 $24 Extra $14 $14 Pull Carts (Riksha): 9 Holes $5 $5 18 Holes $9 $9 Extra $4 $4
Weekday = M-Th; Weekend = F-Sun Gleneagles GC – Golfer Survey Overview NGF implemented GSP at Gleneagles to gauge opinions from the facility’s golfers. A total of 76 surveys were collected by NGF, 42 of which were completed by City residents. The ratings from the total survey group are displayed in the table below. Further details are contained in the associated GSP Appendix Book.
Gleneagles Golf Course 76 Responses
11/14/2006 – 1/8/2007
Factor
Average Score
(Scale 1-5) 14-Affordability 4.6 3-Tee-time Availability 4.5 1-Overall Value of Course 4.4 10-Friendliness/Service of Staff 4.3 13-Overall experience 4.1 7-Pace of Play 4.1 6-Scenery and Aesthetics of Course 3.9 2-Convenience of Course Location 3.9 5-Condition of Greens 3.6 11-Food and Beverage Service 3.6 9-Amenities (clubhouse, pro shop, locker room) 3.5 4-Overall Course Conditions 3.4 8-Condition of Golf Cars 3.1 12-On-course Services (restrooms, drinking water) 2.9
Average Score: 1 = very dissatisfied; 2 = somewhat dissatisfied; 3 = neither satisfied nor dissatisfied;4 = somewhat satisfied; 5 = very satisfied

National Golf Foundation Consulting, Inc. – City of San Francisco, California – 129
Other findings 1. Overall, Gleneagles golfers are about 33% loyal to the facility, much higher than the
national benchmark of 5%. Customers that responded to the survey rated the facility quite high on the measures of affordability, tee time availability, overall value, and friendliness/service of staff. The key business drivers on which Sharp Park fared the poorest were condition of golf cars, and on-course services.
2. The profile of the Gleneagles golfers shows a group that is predominantly male (92%) and older (51% over 50). The course tends to draw somewhat local as 55% of respondents identified themselves as City residents. The map displaying the origin of customers is displayed in Appendix F.
3. The survey revealed that a vast majority of respondents (92%) would play more or the same rounds of golf at Gleneagles if the conditions were improved AND the green fees increased.
4. In open-ended comments the respondents noted the ease of getting a tee time and the fact that the golf course presents a challenge, even to better-skilled players. They also noted affection for the staff and friendly bar atmosphere created at the facility.
Golf Facility Performance and Data Analysis Although all City earnings from the Gleneagles golf operation are derived from the lease, NGF Consulting has reviewed some of the basic operating data for the Gleneagles facility. The following is a summary of the facility’s performance:
McLaren Park (Gleneagles) Golf Course Rounds and Green Fee Revenue - 2005-2006
2005 2006 Rounds Revenue Rounds Revenue Jan 2,107 27,109 1,646 21,883 Feb 2,255 29,378 2,315 33,563 Mar 2,522 31,651 1,651 21,183 Apr 3,234 41,645 2,298 29,917 May 3,398 43,824 3,543 46,371 Jun 3,380 42,801 3,340 43,910 Jul 3,969 51,557 3,775 54,684 Aug 3,758 48,056 3,342 49,637 Sep 3,607 47,050 3,286 47,278 Oct 3,753 50,114 3,361 48,060 Nov 3,079 40,369 2,271 33,183 Dec 1,892 25,339 36,954 $478,893 30,828 $429,669
Source: Gleneagles Golf Course and City of San Francisco

National Golf Foundation Consulting, Inc. – City of San Francisco, California – 130
Ancillary Revenue
McLaren Park (Gleneagles) Golf Course Ancillary Revenue - 2005-2006
2005 F&B Merch Carts Total Jan $9,208 $331 $1,773 $11,312 Feb 8,992 32 1,722 10,746 Mar 11,202 410 2,298 13,910 Apr 14,072 812 2,973 17,857 May 16,023 521 2,981 19,525 Jun 16,614 403 3,292 20,309 Jul 22,211 777 3,554 26,542 Aug 16,389 586 3,248 20,223 Sep 16,498 1,346 3,055 20,899 Oct 21,133 2,102 3,891 27,126 Nov 15,739 955 2,516 19,210 Dec 11,188 1,802 1,351 14,341 $179,269 $10,077 $32,654 $222,000 2006 F&B Merch Carts Total Jan $9,119 $416 $1,127 $10,662 Feb 12,332 780 1,738 14,850 Mar 9,575 453 1,251 11,279 Apr 11,828 752 1,391 13,971 May 17,214 1,117 3,040 21,371 Jun 16,046 1,242 3,170 20,458 Jul 18,677 1,138 4,369 24,184 Aug 16,986 1,060 4,532 22,578 Sep 16,462 958 3,571 20,991 Oct 18,030 1,152 4,232 23,414 Nov 10,622 575 2,596 13,793 Dec 156,891 9,643 $156,891 $9,643 $31,017 $197,551
Source: Gleneagles Golf Course and City of San Francisco
Gleneagles Economic Performance – City Perspective The City of San Francisco basically collects lease payments from the Gleneagles lessee and assumes some expenses for the operation, although none have been recorded since the end of FY 2005 when the City suspended its arbor care at the facility. In FY 2004-05 the City had spent some $47,000+ on salaries and benefits related to arbor care at Gleneagles. The Gleneagles operating statement from the perspective of the City looks as follows:

National Golf Foundation Consulting, Inc. – City of San Francisco, California – 131
City of San Francisco Gleneagles Golf Course - Operations
2004-05 2005-06 2006-07 Golf Rounds 36,954 32,720 33,000 Revenue Concessions $37,590 $47,219 $48,328 Revenue Total $37,590 $47,219 $48,328 Expenditure Salaries $28,445 Fringes $6,536 Overhead $9,876 Facilities Maintenance $2,411 Expenditure Total $47,268 $0 $0 Surplus (Deficit) ($9,678) $47,219 $48,328
Source: City of San Francisco, Gleneagles GC and NGF Consulting
Gleneagles “As–Is” Financial Projections NGF Consulting has prepared an estimate of financial performance for Gleneagles from the perspective of the City for the next five years (through 2012) assuming that the facility continues operations on an “as-is” basis. The results of this analysis are shown in the tables below. The estimates assume stable rounds activity with a modest (2%) annual increase in average golf revenue per round. This estimate shows that Gleneagles can earn revenue in excess of the $737,337 required to add an additional two percent (2%) to the lease payment. Under this scenario NGF Consulting does not expect Gleneagles to earn revenue sufficient to reach the $860,050 revenue level required to add an additional one percent (1%) to the lease.
Proforma Estimate for Gleneagles Golf Course (City Perspective) FY2007 – FY2012
City of San Francisco Golden Gate Park Golf Course Projected Revenue
(Fiscal Years 2007-2012)
FY 2006-07 FY 2007-08 FY 2008-09 FY 2009-10 FY 2010-11 FY 2011-12 Rounds Played 35,000 35,000 35,000 35,000 35,000 35,000 Green Fees $463,750 $473,025 $482,486 $492,135 $501,978 $512,017 Merchandise $12,243 $12,487 $12,737 $12,992 $13,252 $13,517 F&B $179,791 $183,387 $187,055 $190,796 $194,612 $198,504 Golf Carts/Rentals $34,623 $35,316 $36,022 $36,743 $37,478 $38,227 Total Concession $690,407 $704,215 $718,300 $732,666 $747,319 $762,265Concession to City $48,328 $49,295 $50,281 $51,287 $67,259 $68,604Total Facility Revenue $690,407 $704,215 $718,300 $732,666 $747,319 $762,265Total City Expenditure $0 $0 $0 $0 $0 $0Surplus (Deficit) $48,328 $49,295 $50,281 $51,287 $67,259 $68,604

National Golf Foundation Consulting, Inc. – City of San Francisco, California – 132
SYSTEM-WIDE BEST CASE ‘AS-IS’ FINANCIAL PROJECTIONS Based on the individual facility best case financial projections presented above, the following tables show how the whole system is expected to perform over the next five full fiscal years, or through the end of FY2012.
Full System Rounds Played Projections
City of San Francisco Municipal Golf System
Total Rounds Played and other Misc. Data (FY2007-2012)
Rounds Played FY 2006-07 FY 2007-08 FY 2008-09 FY 2009-10 FY 2010-11 FY 2011-12Harding 63,000 63,000 63,000 63,000 63,000 63,000Fleming 46,000 46,000 46,000 46,000 46,000 46,000Sharp 63,500 63,500 63,500 63,500 63,500 63,500Lincoln 47,000 47,000 47,000 47,000 47,000 47,000Golden Gate 45,000 45,000 45,000 45,000 45,000 45,000Gleneagles 35,000 35,000 35,000 35,000 35,000 35,000Total System Rounds 299,500 299,500 299,500 299,500 299,500 299,500 City Revenue/Round Harding/Fleming $64.74 $66.04 $67.36 $68.70 $70.08 $71.48 Sharp $22.48 $22.93 $23.39 $23.86 $24.33 $24.82 Lincoln $24.91 $25.41 $25.92 $26.43 $26.96 $27.50 Golden Gate $17.63 $17.98 $18.34 $18.70 $19.08 $19.46 Gleneagles $1.38 $1.41 $1.44 $1.47 $1.92 $1.96 Tot. City Revenue/Round $36.25 $36.97 $37.71 $38.47 $39.29 $40.07 Fringes as % of Salaries 30.0% 31.1% 32.3% 33.6% 34.9% 36.3%
Sal. + Fringe % of City Rev. 37.9% 39.0% 40.1% 41.3% 42.5% 43.7%Overhead as % of City Rev. 14.0% 14.3% 14.6% 15.0% 15.3% 15.6%

National Golf Foundation Consulting, Inc. – City of San Francisco, California – 133
Full System Revenue and Expense Projections
City of San Francisco Municipal Golf System
Total Revenue and Expense Projections (FY2007-2012) Green Fee Revenue FY 2006-07 FY 2007-08 FY 2008-09 FY 2009-10 FY 2010-11 FY 2011-12Harding $4,578,672 $4,670,246 $4,763,651 $4,858,924 $4,956,102 $5,055,224Fleming $947,843 $966,800 $986,136 $1,005,859 $1,025,976 $1,046,495Sharp $1,308,804 $1,334,980 $1,361,680 $1,388,913 $1,416,691 $1,445,025Lincoln $1,083,405 $1,105,073 $1,127,175 $1,149,718 $1,172,712 $1,196,167Golden Gate $631,833 $644,470 $657,359 $670,506 $683,917 $697,595Total Green Fee Revenue $8,550,557 $8,721,568 $8,896,000 $9,073,920 $9,255,398 $9,440,506Concessions to City Harding/Fleming $1,530,312 $1,560,919 $1,592,137 $1,623,980 $1,656,459 $1,689,588Sharp $118,625 $120,998 $123,418 $125,886 $128,404 $130,972Lincoln $87,324 $89,071 $90,852 $92,669 $94,523 $96,413Golden Gate $161,332 $164,558 $167,849 $171,206 $174,631 $178,123Gleneagles (to City) $48,328 $49,295 $50,281 $51,287 $67,259 $68,604Total Concession to City $1,945,922 $1,984,841 $2,024,537 $2,065,028 $2,121,275 $2,163,701 Addl. General Revenue $360,000 $367,200 $374,544 $382,035 $389,676 $397,469
Total City Revenue $10,856,479 $11,073,609 $11,295,081 $11,520,983 $11,766,349 $12,001,676 Expenditure Salaries $3,164,989 $3,291,810 $3,423,704 $3,560,874 $3,703,531 $3,851,894 Fringes $948,619 $1,025,001 $1,107,493 $1,196,584 $1,292,803 $1,396,720 Overhead $1,520,467 $1,585,074 $1,652,455 $1,722,730 $1,796,024 $1,872,470 Professional & Special Serv. $4,079,835 $4,243,323 $4,413,366 $4,590,225 $4,774,175 $4,965,501 Rent/Leases Equipment $284,024 $295,385 $307,200 $319,488 $332,268 $345,559 Workorders $286,640 $300,922 $315,916 $331,658 $348,184 $365,535 Other Expenses $48,000 $49,920 $51,917 $53,993 $56,153 $58,399 Materials & Supplies $356,040 $370,282 $385,093 $400,497 $416,516 $433,177 Services of other Dept. $0 $0 $0 $0 $0 $0 Facilities Maintenance $0 $0 $0 $0 $0 $0 Capital Reserve $251,364 $261,419 $271,875 $282,750 $294,060 $305,823 Repayment to Open Space $1,417,075 $1,417,075 $1,417,075 $1,417,075 $1,417,075 $1,417,075 Expenditure Total $12,357,053 $12,840,210 $13,346,094 $13,875,875 $14,430,791 $15,012,152 Surplus (Deficit) ($1,500,574) ($1,766,601) ($2,051,013) ($2,354,892) ($2,664,442) ($3,010,476) Net to City by Facility Harding/Fleming ($1,549,391) ($1,716,090) ($1,893,902) ($2,083,457) ($2,285,423) ($2,500,505)Sharp $165,809 $136,111 $104,031 $69,412 $32,089 ($8,117)Lincoln ($46,083) ($79,578) ($115,541) ($154,131) ($195,521) ($239,894)Golden Gate $199,024 $189,221 $178,557 $166,979 $154,430 $140,851 Gleneagles (to City) $48,328 $49,295 $50,281 $51,287 $67,259 $68,604 General ($318,262) ($345,560) ($374,438) ($404,981) ($437,276) ($471,415)Total System Net to City ($1,500,574) ($1,766,601) ($2,051,013) ($2,354,892) ($2,664,442) ($3,010,476)

National Golf Foundation Consulting, Inc. – City of San Francisco, California – 134
Recommendations NGF Consulting has prepared a schedule of recommendations for the continued operations of the City of San Francisco municipal golf system. These recommendations are organized into three main categories: 1.) Management; 2.) Other system-wide; and, 3.) Individual facility recommendations. In the chapter following these recommendations, NGF Consulting will display the potential financial impact of enacting all of these recommendations. However, we first present the various alternatives available to the City, followed by a discussion of each.
MANAGEMENT OPTIONS Before presenting the recommended management arrangement for the City of San Francisco municipal golf system, NGF Consulting has examined a variety of options available to any municipality that owns golf facilities. These options, which are presented from the perspective of the City of San Francisco, include:
• Continue As-Is (Status Quo): Under this scenario, the City continues to operate the facilities in the same manner as it is now.
• City Manages: In this option the City takes over full management of the golf courses under control of the RPD.
• Closing the Golf Courses: Not part of the scope of this study – see discussion below.
• Full-Service Management Contract: Hire a management company to operate all aspects of all City golf facilities along the lines of what is in place at Harding Park.
• Leasing: Lease the facilities to a private operator(s) in exchange for an annual (or monthly/quarterly) lease payment to the City. The lease could be established to include certain lessee requirements, possibly including capital investment in facility improvements.
• New Corporation: The City could create a new non-profit 501(c)3 corporation that would be formed to oversee the City’s golf facilities and pay an annual (or monthly / quarterly) fee to the City. The Corporation would then be responsible for all lease/contract negotiations, hiring, and compliance requirements.
A general discussion of each option, along with key advantages and disadvantages is presented in the following paragraphs:
Continue As-Is (Status Quo) This is the “default” option. Lack of action would automatically put this option in place. As we have documented in this report this option would result in continuing general fund support, growing to over $3 million by 2012. The NGF Consulting team believes that the City’s golf operations can be more productive than is currently the case.
Status Quo is obviously the simplest solution, requiring no action unless the City is willing to make a substantial investment (over $8.5 million) in upgrading the facilities and likely enhancing revenues. While this option may seem irresponsible at first glance, the option may actually have

National Golf Foundation Consulting, Inc. – City of San Francisco, California – 135
some merit if the City feels obligated to retain City golf maintenance staff (gardeners). The City has to also consider how it views the golf courses. If the golf courses are seen as primarily being an amenity to the citizens of the City in much the same way as other parks that do not produce revenue, then the City should be prepared to subsidize its operation just as it subsidizes the operations of those other amenities.
However, if the City desires to generate a return from the golf courses, or simply have them pay their own way, then the golf courses need to be run more like businesses and less like parks. This will then require a substantial change in the operational makeup and require golf business knowledge and experience in the City golf system that does not exist today.
Advantages of Status Quo Option • Simplest option
• Retain City employees
Disadvantages of Status Quo Option • Requires continued and growing subsidies from the General Fund.
• Revenues will not cover rapidly increasing costs, particularly labor cost.
• City lacks expertise in managing golf facilities.
• Does not address other needed improvements identified in this report.
City Manages This option is very similar to the above “Status-Quo” option except that the City would take direct control of all golf facilities (except the Gleneagles lease) and operate the golf courses directly out of the RPD. Many municipalities throughout the United States employ this option in order to retain very tight control of their golf operations. While this option does exist for the City, it is very unlikely to work for San Francisco for many of the same reasons noted above. If this option were to be considered it would also require a substantial change in the operational makeup and require golf business knowledge and experience be added to the City system.
Advantages of Direct City Management • Direct City control of the assets
• Retain City employees
Disadvantages of Direct City Management • Requires continued and growing subsidies from the General Fund.
• Revenues will not cover rapidly increasing costs, particularly labor cost.
• City lacks expertise in managing golf facilities.
• Does not address other needed improvements identified in this report.
Discussion It is clear from everything we have reviewed in this study effort that either of these City continuing to run the golf facilities options are not tenable for the City of San Francisco. The key

National Golf Foundation Consulting, Inc. – City of San Francisco, California – 136
deficiency in the San Francisco City golf system, the high cost of labor, is not addressed in either of these City-run options and therefore this option is not recommended.
Further, we note that NGF Consulting economic analysis of this option shows no scenario under which the City can generate revenues sufficient to cover the expense structure and additional cost of improvements, while also adhering to NGF Consulting’s recommendations regarding the need for increased maintenance staffing at the golf courses. These cuts will only reduce playing conditions further, leading to reduced revenue, leading to even more expense cuts, and so the cycle continues with worsening conditions and increased General Fund subsides every year.
Closure of Golf Course(s) NGF Consulting was hired because of its vast experience and expertise in helping municipal golf systems improve their economic performance. The goal of the study was to identify the most viable option for the continued operations of the City’s golf courses. As such, analyzing the potential costs and benefits of potentially closing one or more courses was beyond the scope of this study. For the City to consider this option, it would obviously have to do much further study, identifying both its goals with respect to offering affordable golf to its residents, as well the expenses, revenues, and various other costs and benefits that would be eliminated with the closure of golf courses.
Full Service Management Contract Under this scenario all operations of the golf facilities would be turned over to a privately owned company. In this case the City would own all user fee revenue and make a payment to the management entity. Two basic types of management contracts are:
Management Only This is very much like the agreement in place at Harding Park today. The ‘management only’ type of management contract assumes that a management company (or individual) is hired by the City to manage the golf facilities. However, all employees remain employees of the City and the City would continue to pay all expenses. The management company would be paid a fee to oversee the operations. The fee can be a flat amount each month, or a percentage of revenue, or a combination of both. NGF Consulting would not recommend a flat fee as it greatly reduces incentive to perform.
Full Service Management Contract Under this management contract, the City would pay the private operator to oversee ALL aspects of the golf operation, including golf course maintenance. This agreement could operate very much like a lease, although the City would still own all direct fee revenues produced by the golf facilities and would pay a fee to the company for its services. This type of agreement can be set up such that all employees of the golf operation are employees of the management company, not the municipality. These deals tend to be shorter term than leases and are therefore more flexible to change over time. Although the City would still be responsible for all major capital improvements, the minor “upkeep” types of improvements are often the responsibility of the management company, depending on how the deal is structured.
Personal Services Management Contract A Personal Services Contract is very similar to the management contract discussed above, except that the vendor is an individual as opposed to a company. And while a personal services contract is often narrower in scope (often only covering some of golf operations), they can also be comprehensive and include both operations and maintenance. Although a personal services contract could be just for the services of the individual, the contract discussed herein is one

National Golf Foundation Consulting, Inc. – City of San Francisco, California – 137
whereby the employees of the operation become employees of the contractor. We will also assume that the contract includes both golf operations and maintenance.
Advantages of Management Contracts • Assuming the management contract covers all aspects of running the facility,
including course maintenance, and then the City would likely have lower cash outlays for labor.
• A management company (or individual) is likely to have a substantially less expensive benefits package that can result in significant payroll savings.
• It is assumed that the company or individual hired has experience and expertise in golf facility operations. Not only can this provide help in operations and maintenance but also in other areas such as marketing and merchandising, that are currently being ignored or minimally attended to at San Francisco facilities.
• An individual is likely to be much more highly motivated to perform than a company. Their personal incentive would be much stronger, with more to gain and more to lose. This usually has a positive effect on overall performance.
Disadvantages of Management Contracts • The City would have less ability to control the quality of operations and/or course
maintenance.
• Under a ‘management only’ contract the management entity does not have incentive to control expenses, unless expenses remain with the management entity (which really makes it a de facto lease).
• Under a ‘management only’ contract the high maintenance labor expense would remain intact.
• The City would still be responsible for the long-term capital improvements.
• Management companies often will move managers around, taking their best managers and putting them into their most profitable facilities.
• Management entities often ‘relax’ in the last year of an agreement, unless the entity is strongly motivated to want to renew the contract.
• Unlike a lease, management contracts usually do not provide a guaranteed income for the owner (the City), but rather a guaranteed income for the management entity.
• Does not address other personnel issues, such as the termination policy.
• The fact the City has four separate golf facilities (excludes Gleneagles) makes personal services contracts much more difficult. It could mean as many as four different contracts. Obviously, the more contracts, the more complicated it becomes.
• With multiple contractors comes the issue of consistency in operations from one facility to the next.

National Golf Foundation Consulting, Inc. – City of San Francisco, California – 138
• With multiple contractors, it becomes more difficult to coordinate activities, such as marketing and promotions, across the facilities.
Discussion This is an option that could produce significant results, as long as the selected management company is of good quality and is given full responsibility for the operation. However, under most true management company scenarios, the expense will still flow through to the City. There are good management companies and there are bad management companies. The overall quality of these types of agreements rests with the City’s ability to find a qualified company, negotiate a contract that is “win-win” for both sides, and then provide proper oversight to see to it that the contract is complied with.
NGF Consulting believes that the only management contract that might make sense in San Francisco is one that removes all payroll expenses from the City (a de facto lease). This should not only result in a major cost-savings to the overall operation, but eliminates other issues such as termination policies and specialized job responsibilities. When designed as a revenue-sharing contract, the City would have a much greater chance for a positive cash flow.
However, the large downside to this option is the lack of any guarantees for the City of San Francisco. The base management fee would be paid to the facility operator regardless of actual performance and, as such, the operator has no real incentive to perform. In short, the City remains the real risk taker and potential loser in the operation. Given this, it would be wiser for the City to enter into a full-service lease than a management contract.
Leasing Under this scenario, the City of San Francisco golf courses would be leased to a private operator that would be responsible for all operating expenses as well as capital upkeep. The lessee would then receive most (if not all) of the revenue and pay the City either a flat payment (flat lease) or a percentage of revenue (percentage lease). The City of San Francisco already has a lease agreement in place with one of the subject courses, Gleneagles (McLaren Park) Golf Course.
Advantages to Leasing • Stops the Bleeding: As all expenses for the operation of the facility would be the
responsibility of the lessee, the City would have no further exposure to cash outlays, other than debt service.
• Guaranteed Revenue Stream: Given that the lessee would be absorbing almost all of the expenses, plus would be paying a lease payment to the City, the City would almost certainly have a positive cash flow. The lease would provide funds that be used to help pay down the existing debt on Harding Park.
• Simplicity: The City would be relieved of a lot of the responsibility in maintaining and operating the facility.
• Capital Improvements: The lease could require the lessee make the needed capital improvements as a condition to the lease. This would greatly decrease or eliminate the cost of improvements to the City.
• Maintenance Equipment: The lessee would be responsible for providing maintenance equipment and new golf carts.

National Golf Foundation Consulting, Inc. – City of San Francisco, California – 139
• Familiarity: San Francisco already has a lease agreement with one of its courses – Gleneagles – with positive cash flow to the City. The PUC courses (Crystal Springs and Sunol Valley Golf Courses) are also operated under a lease with terms favorable to the City.
Disadvantages to Leasing • Profit Motive: A lease arrangement may directly conflict with the stated objective of
providing an affordable, enjoyable recreation activity for the citizens of San Francisco, as private interests (including maximizing return) can often be in opposition to public interests (which include providing a community service).
• Labor Issues: The lease will likely mean that City maintenance employees would lose their positions at the golf courses, or at least face reductions in pay and/or benefits. Although we note the individuals in these positions now would likely be transferred to another position within the RPD.
• Pricing Control: Unless specified in the lease, the lessee may seek free rein over golf fees, likely making the golf courses more expensive to the general public. If the lease has restrictions on raising fees, the lease option becomes less appealing to the private management companies that may be bidding for the lease award.
• Quality Control: Unless the contract is carefully executed, the City would have little ability to regulate the quality of the operation, as long as the lease terms are met. And even if they are not met, the legal and practical cost to “force” conformity with the lease can be expensive.
• Long term: Leases are typically for a long term, especially if capital improvements are included in the lease terms. This makes it difficult to get out of the lease, should the City become displeased with the lessee’s operations of the facility.
Discussion While leasing of municipal golf facilities was popular in previous decades, its popularity waned in the 1990s as golf revenues were increasing and municipalities began to see what they thought were large sums in golf revenue going to an outside vendor and not the municipality. However, since the turn of the 21st century leases are coming back into fashion for municipal golf facilities, particularly in California. This has been due to increased competition in the golf market and the growing need for expert and efficient management and marketing.
Although the appeal of turning everything over to an outside agency does have a lot of merit, especially in terms of relieving the current financial burden, we should note some downsides of this option. First, it s very likely that if the City goes in this direction many City maintenance positions will be affected, although the individuals in those positions today will likely be “reassigned” elsewhere. We also note that it may be difficult to attract an acceptable vendor with lease terms favorable enough to the City to make it attractive enough to entice a vendor. These lease agreements work best when they are “win-win” for both the lessee and the City. The municipalities that find trouble in these lease agreements often have entered into agreements where one party or the other is doing better. If the deal is too favorable to the City, the vendor may struggle and the asset could suffer as a result. If the deal is too favorable for the vendor, the municipality could suffer. So it is clear the contract terms are key to any successful lease arrangement.

National Golf Foundation Consulting, Inc. – City of San Francisco, California – 140
New Non-Profit 501(c)3 Corporation 501(c) is a subsection of the United States IRS Code, which lists 28 types of non-profit organizations exempt from certain federal taxes. These non-profit organizations are very common in the business world, but much less so in golf (the so-called “Baltimore Model” was the first). The 501(c)3 form of the organization typically involves various charitable, non-profit, religious, and educational entities.
Advantages to 501(c)3 (from municipal golf perspective) • Operation of the system is turned over to people with the expertise to run it as a
business, while preserving the goal of providing affordable quality golf experiences to residents.
• As a 501(c)3 organization, the Corporation is required to use all of the operating revenues on the golf courses, towards their management, maintenance, and capital improvement needs.
• Because it is a local entity, revenues stay within the municipality.
• Local/on-site management can quickly respond to problems.
• Capital projects would be financed through private bank financing, with no use of taxpayer dollars. Needed projects that might drag on for months or years awaiting approval under public management can be quickly implemented.
• All of the workers are employees of the Corporation and have golf expertise. The cost of labor is greatly reduced.
• Once the initial Board of Directors had been established, future and/or additional board members are appointed by the existing board.
• The Board of Directors oversees the facilities and meets every month to review financial reports, capital projects and operational/policy issues.
• Politics would not intervene with the implementation of best business practices. The Board of Directors and management staff are free to concentrate on, and quickly address, the needs of the golfing public.
Disadvantages to 501(c)3 • Labor Issues: This type of organization would likely result in current City
maintenance employees being offered positions to stay on, but under a different labor agreement. Should they choose not to stay on under different terms, the City would have to decide their fate. As noted earlier, we assume that the individuals in these positions would likely be transferred elsewhere within RPD or the City.
• Pricing Control: Unless specified in the lease, the Corporation may seek to raise golf fees thereby making the golf courses more expensive to the general public.
• Quality Control: Unless the contract is carefully executed, the City would have little ability to regulate the quality of the operation, as long as the lease terms are met.
The first issue, of course, involves the City clearly defining what its objectives are in seeking solutions to the current problems with the golf system. The pricing and quality control issues are

National Golf Foundation Consulting, Inc. – City of San Francisco, California – 141
easily addressed through careful negotiations and execution of the contract between the City and the Corporation, and between the Corporation and the ultimate operators of the golf courses.
NGF CONSULTING MANAGEMENT RECOMMENDATION NGF Consulting’s analysis of the San Francisco municipal golf system has made very clear that the City and the RPD do not have the golf expertise to manage the City’s golf courses. (This conclusion, among others, was confirmed by a recent audit by a Board of Supervisors budget analyst). Though this has been true for some time, golf was still able to turn a profit in years past, before the regional and national economic climate of golf changed, and before the expense structure (including the debt associated with the Harding Park renovation) of the system became untenable. With this basic fact in mind, and having discussed the state of the current City golf operation in detail in this report and presented some options for the system’s continued operations, NGF Consulting has concluded that there are two reasonable options available to the City if it wants to continue offering golf to its citizens without using taxpayer dollars to subsidize it. These options are:
1. Lease the golf courses to a tax-exempt 501(c)3 non-profit corporation 2. Enter into one or more lease agreements (may include one or more current operators)
that will cover management and maintenance of the facilities Before we make our recommendation as to which of these options fits best for the City, we present the following summarized case studies of two cities that have rescued failing golf systems through implementation of these strategies. The state of the golf systems of these cities bore many similarities to what is has been happening in San Francisco over the last five years, especially with regard to golf course conditions, growing labor budgets, and declining overall economic performance of the system. At the end of this section, we also summarize our findings regarding two leased golf courses within the City of San Francisco itself.
New York City Example The New York City municipal golf system comprises twelve facilities – all 18-hole regulation courses with the exception of 36-hole Pelham/Split Rock, an 18-hole executive length course, and a 9-hole regulation course. All of the City’s golf facilities are privatized, with concessionaires paying license fees to the City based on gross receipts. American Golf Corporation manages eight of these facilities
Up until 1983, New York City operated and maintained the courses themselves with unionized labor. Operating losses were in the multiple millions of dollars, and playing conditions were atrocious. Recognizing that they did not have the expertise within the City to effectively manage the golf system, and that labor costs were growing out of control, the City decided to turn a few of the courses over to private managers to test the waters. No City workers assigned to the golf courses lost their jobs; they were simply reassigned within Parks Department. The experiment was a success, and the City golf operation was eventually fully privatized.
• The golf contracts are under the purview of the Parks & Recreation Department; the system is not set up as an enterprise fund.
• Contractors are “licensees”, not lessees, and City retains much control over the system:

National Golf Foundation Consulting, Inc. – City of San Francisco, California – 142
• City approves all fees (increases tied to inflation).
• Maintenance standards clearly spelled out, and inspectors routinely go out to check compliance.
• Licensees must present detailed capital improvement plan (as part of RFP response) for facility they are bidding on.
• Capital improvement requirements (100% licensee responsibility) often total up to $5 or $6 million, and are typically carried out in the first several years of the contract or renewal.
• Rounds played system-wide peaked at about 917,000 in 1998. Beginning in 1999, rounds played began a precipitous decline, bottoming out at about 597,000 in 2003 – a decrease of 35% over that time period.
• Despite the declining rounds, the system remains highly profitable to the City. Gross license fees from the City’s twelve facilities totaled $6.23 million (on gross revenues of $23.3 million) in 2005, with minimal associated expenses (no expense is explicitly assigned to golf, but rather is spread out over the City’s 100+ concessions) except those associated with oversight.
• Overall, license fees, as a percentage of gross revenue, averaged about 26.7% in 2004 and 2005
City of Baltimore Example Founded in 1985, Baltimore Municipal Golf Corporation (BMGC) began with a $500,000 loan from the City of Baltimore, four well-defined goals and an untested format for managing municipal golf courses. Initially met with skepticism and detractors, BMGC transformed Baltimore's deteriorating facilities into top quality municipal golf courses, funding over $9 million in capital improvements to its five facilities.
Now widely known as the “Baltimore Model”, the new management structure for the municipal golf system resulted in:
• Investment of more than $9 million in capital improvements
• Donation of over $4 million to Baltimore City youth programs
• Creation of a very successful junior golf program
• Vastly improved course conditions and higher maintenance standards
• Sustaining a highly competitive fee structure
Below is a discussion of some of the details of the formation of the BMGC.
During the late 1970s and early 1980s, Baltimore lost more than $500,000 annually on the operation of its five municipal golf courses, resulting in a reduction of the funds allocated to the golf courses by the City Council and Parks Department. This reduction in funding resulted in the facilities falling into total disrepair. Deteriorating course conditions led to further decreases in rounds and revenues, resulting in a vicious cycle. The PGA and LPGA relocated two tour

National Golf Foundation Consulting, Inc. – City of San Francisco, California – 143
events, previously held on Baltimore City courses, to other cities. And, Baltimore's Pine Ridge Golf Course, which was one of the region's finest public facilities, was removed from Golf Digest's listing of top 100 courses.
Then-Mayor William Donald Schaefer formed a committee to assess the golf course operation and to make appropriate recommendations. The committee was comprised of prominent business leaders, Baltimore City's director of Parks and Recreation and director of Golf Course Maintenance. The committee identified many operational problems that contributed to the decline of the golf operation and which required immediate solutions, including:
• Lucrative contracts with the existing golf professionals
• Excessive labor budget
• Insufficient funding of general expenses; and
• The effects of politics on business decisions
Recognizing the need for a shift in management the committee assessed the various management options. Though it would set a precedent, the committee decided that the formation of a private, not-for-profit corporation incorporated the best features of the alternatives considered. However, before the plan could be implemented, several issues needed to be addressed, the foremost of which were: (1) The new organization would not have any assets, and (2) The fate of the existing golf course employees. The committee addressed these issues as follows:
1). Assets - the initial funding came from the City in two forms: a direct loan and a line of credit. The mayor directed the City to provide the new company with a $125,000 bridge loan to cover all of its expenses during the first month of operation. The City also made arrangements for the corporation to receive a $350,000 line of credit to purchase badly needed maintenance equipment, to be paid back in installments over five-years.
2.) Existing Employees - it was decided that the existing employees would be transferred to other positions within the City, but they had the option to apply for positions with the new company. Specifically, the new management agreement incorporated the following language: "...all personnel now employed by the City to work on the golf course properties shall remain City employees. It is also understood that the Baltimore Municipal Golf Corporation (BMGC) may have need for the skills and talents of some of these persons and the City hereby authorizes BMGC to offer employment to City employees at such rates and on such conditions as BMGC shall choose. Such employees do not have to accept such an offer and, if not, will remain City employees."
Under criticism from many corners, Mayor Schaefer chose to accept the findings and recommendations of the committee and created the Baltimore Municipal Golf Corporation (BMGC). The ten-member volunteer Board of Directors was composed of prominent business leaders, the president of the Park Board, and average golfers. To ensure that City officials are kept informed, BMGC sends them quarterly financial reports and an audited annual report. The annual reports are also available to any citizen upon request.
As noted, the golf course assessment committee identified some major problems with the existing operation; those issues most salient to the situation in San Francisco are noted below, including their ultimate resolutions:

National Golf Foundation Consulting, Inc. – City of San Francisco, California – 144
Excessive Labor Budget: Wages had grown to 85% of the entire operating budget, and there were 120 full-time workers and no seasonal/part-time workers, resulting in too many workers during the slow season and too few workers during the busy season. The benefits package for these employees had grown to 50% of the labor budget. There was also excessive leave and overtime policies, and equipment repairs were conducted by an off-site central maintenance department that was slow, unreliable and expensive.
• Resolution: Full-time staff was reduced to 65 workers, including five administrative personnel, and total staff was adjusted to the seasonal needs of the each facility. The benefit package was reduced to 35% the labor budget. These changes adjusted the percentage of money being allocated to labor from 85% to 56% of the operational budget.
Insufficient Funding: Under Parks and Recreation, all of the revenues received from golf course operations went into the General Fund. Yearly budgets and capital improvements required the approval of the Parks Department and City Council. Not only was there a decline in the money being allocated to the courses, it could take months or years to get approvals for capital projects.
• Resolution: By forming a private, not-for-profit corporation, all of the revenue generated by the golf courses was used for the management, maintenance, and capital improvement needs of the facilities. The Board of Directors oversees the facilities and meets every month to review financial reports, capital projects and operational/policy issues.
Political Influence: Crucial operating decisions that required immediate action were held up by multiple Park Board and City Council meetings. When decisions were made, they were often politically motivated.
• Resolution: The new 501(c)-3 organization would be free of bureaucratic red tape as it implemented sound business principles. The Board of Directors and management staff, could concentrate on, and quickly address, the needs of the golfing public.
Since its inception, BMGC has turned around the floundering golf course operations that were losing over $500,000 annually, thus providing the City of Baltimore with over $5,000,000 in savings over the first 10 years of operation.
Other highlights of this municipal golf success story:
• BMGC's Board has directed more than $6,500,000 in capital improvements, which were made without using tax dollars or bond issues. Funding for operational expenses and capital purchases come from playing fees.
• In addition to the purchase of new maintenance equipment at each facility, major expenditures during the rehabilitation period included roofs, air conditioning, restrooms, computerized irrigation systems and pumping stations, upgrading of all facilities to accommodate individuals with disabilities, and construction of a new clubhouse and golf cart storage facility.
• The new golf management concept resulted in the BMGC becoming the first recipient of the Reilly Award, presented in a national competition to determine the best idea for change in parks and recreation.

National Golf Foundation Consulting, Inc. – City of San Francisco, California – 145
• BMGC subsequently had two of its courses rated among the top ten public facilities in a tri-state area, and sustained some of the lowest greens fees in the Mid-Atlantic states. Current 18-hole green fees, including riding cart, range from $25 to $45, depending on the course and the day of the week.
Former Executive Director of the BMGC, Lynnie Cook, notes that, in order for this concept to work, the municipality must be truly interested in the betterment of its golf course(s) and it must allow the organization to function independently of local government. In essence, the private, not-for-profit format works because it is operated and managed like a business.
According to NGF Consulting research, there are indications that the City of Baltimore is forgetting this basic tenet, as the BMGC has become more politicized in recent years. More importantly, as the system became more and more successful, the City of Baltimore, which at the beginning was content to simply be rid of the operating losses, began looking at golf with more interest. Ultimately, they decided to re-write the agreement with the BMGC and now require an annual lease payment of $400,000 from the corporation. This requirement coincided with a severe downturn in the Baltimore municipal golf market, as rounds have declined from a peak of about 345,000 in the late 1990s to the current 260,000. Therefore, capital improvements, which had been implemented on a yearly basis, are now being deferred, as the lease payment to the City always takes precedence.
San Francisco Public Utilities Commission Golf Courses As we noted earlier in this report, Crystal Springs Golf Course and Sunol Valley Golf Course are daily fee golf facilities that are located on San Francisco PUC land, and are leased to private operators. They serve as examples within the City of San Francisco itself of golf courses that are managed by people with golf expertise and experience, and that provide significant positive cash flow to the City. Additionally, though they are not considered municipal golf courses, the City retains some oversight with respect to green fees and maintenance conditions, and also requires certain capital improvements of the lessees.
Recommendation for the City of San Francisco Municipal Golf System Having assessed the various options open to the City, NGF Consulting recommends that the City utilize the 501(c)3 framework for the future operation (management and maintenance) and stewardship of the municipal golf courses. The private, not-for-profit Corporation incorporates the best elements of the various options presented in this section. Below we present the basic framework for how we envision the business model operating; following that is a discussion of some issues and alternatives with respect to operational and capital improvement funding.
Basic Framework There are many details that will have to be worked out between the City and the Corporation. However, the basic framework, as we envision it, is:
• City leases, or even deeds, the golf courses to a 501(c)3 non-profit corporation (the “Corporation”). A long-term lease of 30+ years is recommended. Language is put into the lease regarding required capital improvements (and who owns them), maintenance standards (and how they are enforced), and green fee guidelines for residents, indexed somehow to market conditions.
• Of the five golf facilities, we recommend that Harding/Fleming, Sharp Park, and Lincoln Park be packaged together, and an RFQ (request for qualification and interest) be issued by the Corporation to solicit potential interest for the

National Golf Foundation Consulting, Inc. – City of San Francisco, California – 146
management, maintenance, and master planning (creation and implementation of short- and long-term capital improvement plan) of these three facilities. Of course, current operators will be encouraged to express their interest.
• The Corporation is overseen by a volunteer Board of Directors, and the only managerial position is an Executive Director.
• As we saw with the City of San Leandro, where American Golf Corporation invested more than $8 million of its own money in Monarch Bay, as well as with Oakland (language in their RFQ notes at least a $3 million investment required of interested parties) and New York City (AGC, again, has spent multiple millions of dollars because they know the golf facilities will throw off considerable positive cash flow), it is not unreasonable to expect a management entity to invest considerable money in needed capital improvements. Language in the initial RFQ should clearly spell out the expected requirements of the bidder with regard to capital investment.
• Based on our projections for these facilities, assuming our recommendations are enacted, we foresee considerable interest in operating these facilities if they fall under the Corporation umbrella. The ultimate operating structure should be with one operator for all three facilities, working under a sub-lease to the 501(c)3.
• Golden Gate and Gleneagles should be handled differently within the Corporation. These facilities have motivated and knowledgeable operators with business savvy and a strong relationships with their clientele. Gleneagles is already under a profitable lease. Golden Gate serves the junior/beginner market and has an operator that is a good match.
• The only change we recommend with regard to Golden Gate is that the current management agreement be terminated, and a sub-lease agreement be entered into between the two parties.
• Because of the substantial capital improvements that are needed to make any solution plausible, the likely need to fund short-term operating losses while the courses are being improved and the transition is taking place, and the Corporation taking on the substantial debt owed to Open Space, it is essential that the City put no undue burden on the Corporation in the lease agreement. NGF Consulting believes that a nominal payment of $1 per course would not be an unreasonable agreement, as the City will be rid of the burden of its operating losses. In our model, we have also assumed that the revenue from resident ID cards, which is upwards of $300,000, will remain with the City. Between this revenue and the Gleneagles ground lease, the City will be taking in between $350,000 and $400,000 annually, with little associated expense.
Funding / Working Capital Considerations Perhaps the biggest issue to be dealt with should the City golf courses be turned over to the Corporation is the bridge funding for operations and the debt service payment, and the mechanism by which the needed capital improvements are to be paid for. This will not be an issue once the ultimate operator is in place. In the interim, an agreement must be worked out between the City and the Corporation as to how operations are to be funded during the transition period.

National Golf Foundation Consulting, Inc. – City of San Francisco, California – 147
One thing that would help immensely would be a change in the repayment terms on the Open Space debt. Perhaps the annual payment could be deferred until the Corporation begins turning an operating profit. Another option for short-term operations and capital improvement financing is a loan from the General Fund to the Corporation. Of course, any funding scenario is expected to include some component of private donations and, at least as far as capital improvements are concerned, contributions from the ultimate manager of the properties. A creative example of raising private funds comes from the City of Houston, where private sector contributions in the amount of $1.2 million took the form of sponsorships for elegant granite hole markers that were placed at each tee of Memorial Park. The contributions went toward Memorial’s renovation in the mid 1990s.
OTHER SYSTEM-WIDE RECOMMENDATIONS In addition to the above recommended change in management and operation, NGF Consulting has prepared a list of other system-wide recommendations designed to help improve the overall revenue potential of the City’s golf system. These recommendations basically cover four main areas that apply to all of the City’s golf courses – yield management, pace-of-play, marketing and improved record keeping/accounting. The recommendations are detailed in the following paragraphs.
Yield Management Give management, within boundaries, the flexibility to adjust playing fees (within specified parameters) in response to market dynamics or repeated soft spots in the tee sheets (yield management). While the published ‘rack’ rate would not be compromised, the ability to adjust to market conditions will enable the municipal golf courses to compete more effectively with private operators (we have noted how aggressively the Presidio, one of Harding Park’s chief competitors, manages their inventory of tee times). As noted, yield management does not affect the published rack rate, and can be a great way to stay in touch with customers and to test pricing elasticity in the market. It is an effective tool as long as the club is covering the variable cost attached to producing the round of golf.
Pace of Play Interviews with the individual operators, as well as the results of the Golfer Survey Program, indicate that slow pace of play is a serious concern for golfers at all of the City courses. Below are some recommendations for improving (quickening) pace of play. The first step is to develop a systematic way of tracking pace of play. This is best done by utilizing a starter that will record the start time of every group, thus records can be established of what the pace of play really is. If the pace is over four and half hours, it is a problem. There are a number of strategies that can be employed to improve the pace-of-play including:
• Pin Placement: Pin placements should not be too punitive, such as on a steep slope. This not only contributes to a slower pace of play (more putts), but also will increase player dissatisfaction due to higher than normal scoring. Maintenance staff needs to be better trained on how and where to locate the pins.
• Appropriate Tee: Golfers new to a course are often unsure as to which tee box to use. Starters should be trained to help golfers identify the most appropriate tee for their individual skill level and experience with the golf course. We would also recommend that these handicap suggestions be put on the scorecard.

National Golf Foundation Consulting, Inc. – City of San Francisco, California – 148
• Tee Time Interval: When there are consistent delays at the start, it is indicative of a tee time interval that is too short. If this is the case, we would recommend going to a 9- or 10-minute interval with the idea of working in walk-ins as the pace allows. With a strong walk-in market the total number of rounds should not decrease as the walk-ins can be more easily worked in with longer tee intervals. This has the double benefit of increasing satisfaction both with the players booking tee times, as they are going to be able to tee off at the designated time, and with walk-ins as they will be more readily accommodated.
• Pace of Play Policy: This is most important and should be given to all golfers, including those that have played the course. The facility’s pace-of-play policy should be explained and golfers encouraged to keep up with the group in front of them. This creates an expectation with the golfer and can be done in a manner that is professional and inoffensive.
Record Keeping / Accounting Regardless of how the San Francisco municipal golf system is ultimately operated, NGF Consulting strongly recommends that an effective point-of-sale (POS) system be implemented that is consistent for all facilities. Such a system has many benefits, not the least of which is that it will help a great deal with regard to accounting inconsistencies relating to operating results.
A good POS should have:
• Integrated tee-sheet that will also store information about each golfer. This will allow the facility to track usage by individuals and enhancing marketing opportunities.
• Ability to book tee times online. This is expected to be one of the biggest waves of change in the golf industry over the next five years, and it is a win-win situation. It is more convenient to the customer as it is not only faster, but accessible 24 hours per day and seven days per week, and it is much more efficient for the operator, who currently spends significant time on the phone taking tee times. We also note the high number of comments in the golfer survey expressing a desire for this service, especially at Harding Park.
• Management Tools: A good POS system will provide reports that are very useful in making good management decisions. Further, the system will help the City keep up with what any contractor or lessee is earning and assists in establishing appropriate contract/lease terms.
• Marketing: By being able to store customer data, cost-effective targeted marketing programs can be developed.
It should be noted that the above mentioned system need not be expensive, as there are companies in this business that offer integrated systems for less than $3,000/year, per facility.
Therefore, it is imperative that the City/management keep a very close eye on activity levels for the balance of the fiscal year, and be willing to experiment with fees should the operating results and the market dictate. One way to do this is to practice yield management, especially during off peak periods such as weekdays. If management sees that the upcoming Tuesday is particularly weak, an e-mail blast can be sent out promoting special prices for people who golf that day.

National Golf Foundation Consulting, Inc. – City of San Francisco, California – 149
Marketing Plan Attracting supplemental play from the tourist/visitor and corporate markets is critical to maximizing the economic performance of the San Francisco municipal golf system. Therefore, it is imperative that the City/management place an increased emphasis on marketing, especially after the recommended improvements are made to the golf facilities. We do not believe that the San Francisco municipal golf system will be viable, regardless of who operates it, without a greatly increased marketing budget (which is minimal now) and a strong focus on direct selling.
NGF Consulting recommends employing a dedicated full-time person whose sole responsibility is to produce business for the golf courses through recruitment of new tournaments and direct selling to the major hotels in San Francisco. As mentioned in the ‘Market Environment’ section of this report, San Francisco has a very significant tourism and hotel market that is largely untapped by area golf courses. Larger conventions would be outstanding candidates for large weekday tournaments, and individual business and leisure travelers who are golfers would find the convenience and quality (once improved) of the City’s municipal golf courses appealing. It is anticipated that these visiting golfers would pay substantially higher green fees than are now being paid, should Lincoln and Sharp Parks be rehabilitated (NGF research confirms that traveling golfers are much less likely to be price sensitive than resident golfers).
Of course, direct selling must be accompanied by an organized marketing campaign centering on the quality of the golf courses, and must leverage and build upon the brand equity created at Harding Park due to its reformation, and its affiliation with the PGA TOUR. A marketing campaign should be a cooperative effort with the Convention & Visitors Bureau, and should focus on branding San Francisco as a golf destination. Even if the city is never truly thought of in those terms (after all, there are so many other attributes of the city that will come to mind first for most people contemplating a visit), these marketing efforts should succeed in creating awareness of the golf courses and getting golfers who are visiting anyway to play golf while they are there.
Though the rehabilitation of Sharp Park and Lincoln Park are seen as necessary and critical to such a marketing push, it is equally important that the relationship with the PGA TOUR be sustained, both for marketing purposes and so that the lucrative non-resident rates at Harding Park remain sustainable. In order to ensure this, the City/manager must be certain to maintain Harding Park to the standards required of the master agreement between the two parties. Issues covered in this report, such as the potential for increased problems with kikuyugrass, ensuring that the grounds superintendent has appropriate experience, knowledge and credentials, and maintaining an appropriate level of staff (including agronomic expertise) are absolutely critical.
A second prong of the marketing campaign should be more oriented towards local golfers who may have given up on the City courses. “Under new ownership” is a marketing theme that often has little meaning, and gains little traction with consumers. However, given the relatively poor course conditions documented in this report, golfers have taken their play elsewhere and marketing that emphasizes how the courses have been improved should be highly effective (“try us again for the first time”). Along these lines, a month-long “Grand Re-opening” event, featuring special promotions and tournaments, will build good will and awareness in the market and give the municipal golf courses a leg up on recovering market share.
The commitment to marketing must be evident as soon as the assets are improved, when building awareness and stimulating trial are critical. Successful golf operations in the private sector typically allocate about 3%-5% of their revenue to marketing. This would be appropriate

National Golf Foundation Consulting, Inc. – City of San Francisco, California – 150
for the subject facilities once play has somewhat stabilized, but a higher initial budget is recommended.
INDIVIDUAL FACILITY RECOMMENDATIONS In addition to the above recommended system-wide changes to the City golf operation, each of the individual facilities have specific deficiencies, mostly physical in nature, that also need to be addressed. These recommendations are detailed in the following paragraphs.
Harding Park / Fleming GC Recommendations NGF Consulting has the following specific recommendations for optimizing the physical condition of the Harding Park Golf Course facility:
1. Develop a capital expenditure plan to address needed on-course facilities and improvements that may be called for as concluded by other evaluations.
2. Engage an outside agronomic consultant (non-PGA) to provide opinions on kikuyugrass control, soil and turf conditions. Included should be a parallel evaluation of irrigation and fertilization systems, and procedures.
3. Hold the artificial turf manufacturer / contractor to the warranty on materials and installation of these components.
4. Undertake an evaluation of the drainage system installation and longevity of this system; including an appraisal of any needed additions.
5. Address safety concerns as part of a City-wide master planning process for all of the City’s golf course assets.
Golf Superintendent Position Because of several factors, not the least of which is the $24 million that was spent renovating the golf course, it is essential that the City/manager ensures that the Superintendent (or Gardening Supervisor in San Francisco nomenclature) at Harding Park have the proper credentials, knowledge, and experience required to oversee a property of this quality. If this is not ensured, not only is the value of the asset compromised, but also the future relationship with the PGA TOUR is at risk. Losing this relationship could very well have reverberations throughout the system, in terms of the sustainability of the high rates at Harding, as well as the brand equity associated with the facility, which will be key to future marketing efforts.
Sharp Park GC Recommendations The NGF Consulting team has prepared a priority-order schedule of recommendations designed to improve the physical condition and make the golf facility more appealing to a broader segment of the golfing public, particularly non-resident (visitor) golfers that are likely to be willing to pay higher fees. A summary of the recommendations follows in the bullets below. Detailed cost estimates for each item are presented at the end of the section.
1. Create an overall master plan for the facility. Develop a Master Plan addressing design, features, paths, trees, safety, turf quality, irrigation, drainage and the potential for resurrecting one or more golf holes that originally existed along the ocean; master plan components should address items listed below.

National Golf Foundation Consulting, Inc. – City of San Francisco, California – 151
i. Developing a viable management plan to rectify drainage associated with the Laguna Salada, Saddle Pond and the entire upstream and pumping system to evacuate water to the sea. As noted, this work should be undertaken as part of the master plan process, but should involve a civil engineer familiar with resource management plans in this area. (Note: A pending management plan for rectifying this problem has already been commissioned and sits in wait at the City. Further reports indicate that approval was once received for dredging of the clogged lagoon system, but for varying reasons, the City chose not to act.)
ii. Integrate the drainage (lagoon) solutions to the master plan for all golf elements and areas.
iii. Study the eventual possibility of re-establishing one or more holes in areas along the
existing sea levee where golf holes used to be positioned (cost not assumed in recommended improvements).
iv. Be sensitive to the design ideals of Alister Mackenzie, working to preserve and
restore any documented features possible as the master plan is prepared.
2. Invest in a new irrigation system or, at a minimum, completion of the system as designed in recent years. (Note: Russ Mitchell, a noted irrigation designer from Northern California, has prepared extensive plans for the City).
3. Invest in drainage improvements at other areas beyond the Laguna Salada.
4. Invest in cart path improvements and repairs.
5. Cart Barn – A new cart barn need to be added for new electric carts.
6. Establish needed maintenance facilities and invest in new equipment as required to adequately care for the golf course.
7. Increase the full-time maintenance staff to about 10, in addition to seasonal and /or part-time help as needed.
8. Study the potential to integrate additional trails along the golf course for public recreation.
Lincoln Park GC Recommendations The NGF Consulting recommendations for Lincoln Park GC are noted below. Detailed cost estimates for each item are presented at the end of this section.
1. Create an overall master plan for the facility. Develop a Master Plan addressing design, features, paths, trees, safety, turf quality, irrigation and drainage.
2. Invest in a new irrigation system or, at a minimum, completion of the system as designed in recent years (by Russ Mitchell as noted previously).
3. Invest in drainage improvements.
4. Invest in cart path improvements and repairs.

National Golf Foundation Consulting, Inc. – City of San Francisco, California – 152
5. Renovate clubhouse structure (details later in section).
6. Establish needed maintenance facilities and invest in new equipment as required to adequately care for the golf course.
7. Cart Barn – A new cart barn need to be added for new electric carts.
8. Increase the full-time maintenance staff to at about 10, in addition to seasonal and /or part-time help as needed.
Golden Gate Park GC Recommendations The NGF Consulting recommendations for Golden Gate Park GC are noted below. Detailed cost estimates for each item are presented at the end of this section.
1. Create an overall master plan for the facility. Develop a Master Plan for the facility. Included should be a look at teeing area additions and a study of whether the change in hole sequence was an appropriate modification by the operator of the concession.
2. Establish needed maintenance facility upgrades and invest in new equipment as required to adequately care for the golf course.
3. Increase the maintenance staff to at least 3. Projected cost is discussed in financial projections addressed later in this section.
4. Study opportunities to open the facility at night. We are told that this has been explored by the operator, but has not been feasible due to opposition from the Audubon Society. Options may include special evening golf programs using lighted fairway markets, glow balls, etc.
Gleneagles GC Recommendations The NGF Consulting recommendations for Gleneagles GC are noted below. We note as this facility is presently under lease and these recommendations could be completed either by the City or the lessee. Detailed cost estimates for each item are presented at the end of this section.
1. Create an overall master plan for the facility. While this facility is leased, the City is still encouraged to develop a master plan document that can form the basis for approval of improvements. Such a document would also allow for prioritization of improvements, establishing a road map for the City and lessee to follow as the course ages.
2. Re- Establish the #1 green. It may be possible to re-establish this original green and retain the upper green as an alternate green; such a design characteristic would be suitable, especially at Gleneagles.
3. Look into irrigation system needs, developing a strategy for eventual replacement and/or upgrading.
4. Invest in much-needed drainage improvements, including the potential for a major intercept drainage trench along the upper boundaries of the course.

National Golf Foundation Consulting, Inc. – City of San Francisco, California – 153
5. Invest in cart path improvements, specifically a planned system of paths with appropriate base that can withstand use and solve some drainage problems.
6. Develop a practice venue for customers.
7. Make repairs to the maintenance facility that, at minimum, protect equipment and provide a safe environment for storage and personnel.
8. Develop means to partner with the lessee in regards to arbor care, taking the burden of tree thinning and removal away from the lessee and allowing those funds to be spent on other important areas.
Projected Cost of Individual Facility Recommendations The table on the following page displays the cost estimates for completing the above noted individual facility recommendations, as prepared by NGF Consulting in early 2007 and based on Bay Area cost inputs that may or may not apply directly to the City of San Francisco.

National Golf Foundation Consulting, Inc. – City of San Francisco, California – 154
City of San Francisco Golf Course Study: Recommended Investments
Year 1 Year 2 Year 3 Total System-wide Investments
On-call Golf Course (Fees) 175,000 175,000 175,000 Pesticide Study (Fees) 75,000 Irrigation Planning (Fees) 20,000 20,000 640,000
Harding Park Golf Course Outside Agronomic Consultant (Fees) 15,000 Drainage System Evaluation (Fees) 7,500 Restroom Facilities (2) 80,000 102,500
Lincoln Park Golf Course Develop Master Plan (Fees) (1) Irrigation Planning (Fees) (1) Irrigation System Upgrades 700,000 Drainage Improvements 150,000 Cart Path Improvements 200,000 Practice Area Development 450,000 Clubhouse Improvements 2,000,000 Re-build Maintenance Facility & Cart Barn 1,200,000 Maint. Budget Override (Corrective Actions/Materials) 125,000 125,000 4,950,000
Sharp Park Golf Course Develop Master Plan (Fees) (1) Civil Engineering/Environmental Consulting (Fees) 150,000 Lagoon Improvements 800,000 “Lost Holes” Study (Fees) (1) Irrigation Planning (Fees) (1) Irrigation System Upgrades 900,000 Drainage Improvements (Non-lagoon Areas) 200,000 Cart path Improvements/Repairs 150,000 Re-build Maintenance Facility & Cart Barn 1,750,000 Re-build Hole No. 8 - 60,000 Public Trails Study (Fees) (1) Maint. Budget Override (Corrective Actions & Materials) 250,000 4,260,000
Golden Gate Park Golf Course Develop Master Plan (Fees) (1) Re-build Maintenance Facility 350,000 350,000
Gleneagles Golf Course Develop Master Plan (Fees) (2) (1) Re-establish Original No. 1 Green (2) 100,000 Evaluate Irrigation System Needs (Fees) (2) (1) Drainage Improvements (2) 200,000 Path Improvements (2) 150,000 Practice Venue (3) 60,000 Maintenance Facility Repairs (3) 25,000 $535,000
Grand Total 607,500 7,220,000 3,010,000 $10,837,500
(1) Included in System-wide Investments (Fees) (2) Recommended Investment by City (Fees) (3) Recommended Lessee Investment (Fees)

National Golf Foundation Consulting, Inc. – City of San Francisco, California – 155
Projected Economic Performance for the 501(c)3 Corporation
The key activity associated with this NGF Consulting study effort was to be able to take all of the findings, recommendations, assumptions, capital improvements and individual golf course financials, and evaluate the impact they would have on the overall health of the City of San Francisco Municipal golf system. In doing so, NGF Consulting has made several assumptions that will be presented before the projected performance of each facility and the overall 501(c)3 corporation (the “Corporation”) are presented, through the end of FY2012.
KEY ASSUMPTIONS In preparing these financial projections for the golf courses, NGF Consulting has made several assumptions on the operation and condition of these facilities, the most important of which is that all of the recommendations presented in this study, including the creation of the 501 (c)-3 corporation, will be implemented. Further, we note that since Gleneagles (McLaren Park) is operated under an appropriate lease agreement, this lease should remain in place for the new Corporation framework. NGF Consulting has also assumed the City RPD would retain all revenues from the sale of resident ID cards.
Assumptions related to staffing, expenses and revenues for each facility appear in the sections that follow. Other key assumptions that apply to all facilities are listed below:
• All of the NGF Consulting’s management, physical and other recommendations are enacted by the City of San Francisco, including the retention of an on-call golf architect to assist with master plans for the upgrade of facilities in an orderly and efficient manner.
• The financial pro forma concentrates on operating cash flows and assumes that the new 501(c)3 would not have any additional debt associated with improvements, as all funding would come from other sources. Additional debt will be necessary if the combination of private donations and capital invested by the ultimate operator(s) of the golf courses is not sufficient to fund improvements and short-term operational deficits.
• Lincoln Park and Sharp Park golf courses are upgraded as recommended by NGF Consulting as soon as practical. We note that this is not a full-scale renovation as was completed at Harding Park in 2002-03, but rather a serious ‘face-lift’ for the City’s two most physically troubled golf courses. Although we are not recommending a full-scale renovation and golf course closure during renovation, NGF Consulting has assumed for the sake of conservatism that no revenues will be collected on these courses for the one year they are under repair. The improvement / upgrading schedule would be as follows:
Lincoln Park GC should be upgraded first. This is due to several reasons, including: (1) approvals will be easier to obtain; (2) the facility needs both golf course AND clubhouse improvements; and (3) the Sharp Park upgrade will take longer due to planning related to Laguna Salada and drainage issues.

National Golf Foundation Consulting, Inc. – City of San Francisco, California – 156
Lincoln Park will be closed (no revenue earned) for FY2007-08 to complete upgrades to the irrigation, drainage, and cart paths, as well as the addition of a practice area. The clubhouse would be renovated and a new cart barn will be added to accommodate clubhouse and new (required) electric carts. A small grow-in maintenance and administration expense is assumed during the year the course is closed for upgrade.
During the year that Lincoln is closed for upgrade, we assume that the conditions at Sharp Park would be improved as a more efficient maintenance team is in place, and preliminary improvements begin.
After completing and re-opening the improved Lincoln Park GC, in FY2008-09 the Sharp Park Golf Course would be closed for its upgrade. Rounds at Sharp Park would be diminished in FY2007-08 due to the extra half year that will be required for the Sharp Park upgrade.
The Sharp Park upgrade is very similar to Lincoln except that the Sharp plan does not involve a clubhouse upgrade, but does involve extensive Laguna Salada improvements.
• Upon re-opening after upgrades, both Lincoln and Sharp would experience increased play levels and higher average revenue per round.
• Most fees and charges are assumed to grow at an annual rate three percent (3%), unless otherwise noted, representing a system-wide commitment to keeping fees in line with the CPI, with actual adjustment no less than every two years. Although we do project expenses to grow faster, the 3% growth is projected for revenues through 2012.
• Ancillary fee revenues are estimated based on actual performance at the subject City golf courses adjusted as average revenue per round.
• The maintenance expenses estimated by NGF Consulting for all courses assume that some new maintenance equipment is leased (expense included); maintenance expenses also include water costs.
• Direct cost of goods sold (COGS) for all courses are assumed at 75% for merchandise and 60% for food and beverage. This is based on similar percentages experienced by other municipal and daily fee courses in the market and profiled by NGF Consulting in this study.
• All expenses are assumed to increase at a rate of four percent per year through 2012. This amount approximates the actual expense increases observed at the subject facilities, with the exception of personnel costs. It is assumed that the new 501 (c)3 will be able to contain costs to match the growth in other expenses.
• In keeping with the conservative posture taken for this operations study, a five percent (5%) contingency is assumed at all courses to account for any unforeseen changes in expenses.

National Golf Foundation Consulting, Inc. – City of San Francisco, California – 157
Justifications for Projections NGF Consulting believes the financial projections created for this City municipal golf system, under the management of a newly created 501(c)3, are wholly achievable and even somewhat conservative in nature. NGF consulting believes this due to the following reasons:
• Potential high quality of the City’s golf assets after improvements.
• The city/peninsula is somewhat of an insular market, with few local golf courses (especially given that the state of some of the City courses) to service the dense population. NGF research confirms that the city has a higher-than-average number of households available to support each 18 holes of golf in the City, and the City is a large net exporter of rounds played to outlying areas such as the East, South, and North Bays. Improving the golf course will allow them to capture back market share, especially among City residents.
• San Francisco golfers, as confirmed by the golfer survey results, are very passionate about the City’s golf courses, which scored very unfavorably with exception of Golden Gate (even Harding scored average or worse on many measures, perhaps due to higher fees or disappointment after the renovation). It is NGF’s conclusion that many of these passionate customers would return to the City courses, or play more frequently, if they were better managed and in better condition.
• The golfer survey results also indicate, overwhelmingly, that residents would be willing to pay moderately higher green fees in exchange for better course conditions at Lincoln and Sharp.
• The golf courses, with the exception of Harding Park, are all currently operating at much less than capacity, and at much lower levels than the regional average for municipal golf courses. Additionally, they have all shown the potential in the recent past to achieve much higher activity levels.
• In addition to increased rounds that will result if the courses are improved as recommended in this study, the Corporation can re-position Lincoln and Sharp to significantly higher price points for non-residents, especially out-of-state tourists who are typically not price sensitive. The seeming inelasticity of Harding Park’s demand since the September 1, 2006 price increases is encouraging in this respect.
• In addition to the City and Bay Area resident populations, the municipal golf system has an enormous untapped supplemental market from which to draw play – San Francisco’s 15+ million annual tourists. NGF Consulting believes that this market shows enormous potential, once the maintenance conditions of the courses, especially Lincoln and Sharp are improved. There seemingly has been no organized effort on anyone’s part to tap this market. Even if San Francisco cannot successfully be branded as a “golf destination”, tourists and business travelers will play the courses much more frequently when they are here
• In 2005, the San Francisco Convention & Visitors Bureau booked more than 2 million confirmed group room nights for future years. A direct selling effort to hotels for tournaments, as well as a cooperative marketing effort between the Corporation, the City, and the C&VB should be very successful in drawing high fee visitor rounds.

National Golf Foundation Consulting, Inc. – City of San Francisco, California – 158
GOLF OPERATIONS PERFORMANCE BY FACILITY NGF Consulting has created cash flow models for each of the five golf facility operations, operated within the framework of the Corporation, through the year 2012, under the assumptions detailed in the body of this report and noted above. These tables show the projected cash flows for the full operation through 2012, or the next five years that NGF Consulting can project with confidence. Each category of revenue has been listed separately, and an estimate of the projected average revenue per round has been provided. The full system-wide cash flow statement will follow the individual facility projections. The full system will include additional administrative and marketing expenses for the Corporation, peaking in the early years ($507,000 in FY09) when the system is new and would engage in a strong marketing push. Decreases in marketing expenses would reduce the overhead expenses to just over $400,000 in FY2012.
Below are NGF Consulting’s projected operating expense structures, as well as associated assumptions, for each of the five golf facilities expected to be included in the new 501(c)3 corporation. Estimated salaries are market- and industry-based (NGF, our parent company, has done extensive research related to golf industry salary/wage norms for various classifications), and do not reflect the City of San Francisco wage/salary/benefit structure.
HARDING / FLEMING GC PROJECTED FINANCIAL PERFORMANCE (FY2008-12) Harding / Fleming GC Revenue Assumptions (FY2008-12)
• Average fee revenue at Harding Park is assumed to be comparable with actual 2006-07 figures, with three percent (3%) growth expected through 2012.
• Ancillary fee revenue is assumed to be comparable with actual 2006-07 figures with three percent (3%) growth expected through 2012. An exception is food and beverage revenue which is projected to increase 10 to 12% for FY 2008-09 to account for continued success in growing this business at Harding Park.
• Rounds are projected at a stable 115,000 rounds per year, with increases in non-resident play expected in the next five years.
Harding / Fleming GC Expense Assumptions (FY2008-12) Fixed Expenses Golf course maintenance expenses (includes practice facility) have been estimated to be $2,700,000 in 2007-08, and General and administrative expenses have been estimated to be $800,000 in 2007-08, both growing at four percent per year to 2011-12. Overall, golf course expenses are expected to conform to the following general schedules prepared by NGF Consulting.
Other Expenses Expenses associated directly with revenue centers such as merchandise, food and beverage, have been assumed based on historical patterns established at regional and national golf facilities of this type. Expenses associated with operating a fleet of 80 golf carts has been estimated based on an accepted industry estimate of roughly $2,000 per cart per year.
Clubhouse expenses have been estimated to be $600,000 in 2007-08, growing at four percent per year to about $702,000 by 2011-12. This line item includes clubhouse-related supplies, repairs, custodial services, and professional services, as well as a salary for a Building

National Golf Foundation Consulting, Inc. – City of San Francisco, California – 159
Maintenance Supervisor. Food & Beverage expenses have been estimated to be $800,000 in 2007-08, growing at four percent per year to about $936,000 by 2011-12. This line item does not include cost-of-goods-sold, but does include salaries for a Food & Beverage Director, Assistant F&B Director, Catering/Banquet Manager, five full-time kitchen staff (Chef, assistant, 3 cooks), and various part-time/seasonal workers.
Estimated Golf Course Maintenance Expense Harding Park GC – 2007-08
Salaries & Wages Full-Time Employees Course Superintendent 1 Asst. Superintendent 1 Irrigation Specialist 1 Mechanic 22 Crew Members @ $42,000 each Benefits & Taxes @ 25%
$75,000
50,000 50,000 50,000
924,000 287,500
Part-Time Labor 20,000 hours @ $15.00/hr.
300,000
Total Salaries & Wages $1,736,250 Utilities (incl. Water) 250,000 Equipment Lease 225,000 Seed, Sod & Sand 150,000 Supplies (Chemicals & Fertilizer) 70,000 Professional Services (Plumbing/Agronomy) 120,000 Repairs & Maintenance 40,000 Fuel & Oil 75,000 Maintenance Administration 30,000 Total Course Maintenance Expense $2,696,250
Source: NGF Consulting estimate 2007
Administrative & General Expense
Salaries & Wages Full-Time Employees Director of Golf/Head Golf Professional General Manager 4 Assistant Golf Professionals @ $40,000 Director of Accounting/Finance Benefits & Taxes @ 25%
80,000 85,000
160,000 75,000
100,000 Part-Time Labor Shop Clerks, starters, rangers, etc. (10,000 hours @ $12.00/hr.)
120,000
Advertising & Promotion 40,000 Insurance 100,000 Supplies 25,000 Miscellaneous 15,000 Total Administrative & General Expense $800,000
Source: NGF Consulting Estimate 2007

National Golf Foundation Consulting, Inc. – City of San Francisco, California – 160
Harding / Fleming GC Projected Financial Performance (FY2008-12)
501(c)3 Corporation Harding/Fleming Projected Golf Course Performance (FY2008-2012)
FY 2007-08 FY 2008-09 FY 2009-10 FY 2010-11 FY 2011-12Rounds – Harding 69,000 69,000 69,000 69,000 69,000Rounds – Fleming 46,000 46,000 46,000 46,000 46,000Total Rounds Played 115,000 115,000 115,000 115,000 115,000 Green + Cart Fees – Harding $5,165,178 $5,320,134 $5,479,738 $5,644,130 $5,813,454Green + Cart Fees – Fleming $976,278 $1,005,567 $1,035,734 $1,066,806 $1,098,810Total Green Fee Revenue $6,141,457 $6,325,700 $6,515,471 $6,710,935 $6,912,264
Food & Beverage $857,008 $882,718 $909,200 $936,476 $964,570Pro Shop $491,444 $506,188 $521,373 $537,015 $553,125Range $314,534 $323,970 $333,689 $343,700 $354,011Total Concession $1,725,978 $1,865,158 $1,921,112 $1,978,746 $2,038,108
Merch. Cost of Sales $368,583 $379,641 $391,030 $402,761 $414,844F&B Cost of Sales $514,205 $529,631 $545,520 $561,885 $578,742Net Concessions $1,063,414 $1,095,317 $1,128,176 $1,162,022 $1,196,882Total Net Revenue $6,946,852 $7,190,217 $7,405,924 $7,628,101 $7,856,944 Average Revenue per Round Green Fees – Harding $71.07 $73.20 $75.40 $77.66 $79.99Green Fees – Fleming $20.74 $21.37 $22.01 $22.67 $23.35Cart Fees – Harding $7.79 $8.02 $8.26 $8.51 $8.77Cart Fees – Fleming $0.48 $0.49 $0.51 $0.52 $0.54Food & Beverage $8.00 $9.00 $9.27 $9.55 $9.83Pro Shop $4.27 $4.40 $4.53 $4.67 $4.81Range $2.74 $2.82 $2.90 $2.99 $3.08Total Facility Revenue/Rnd. $15.01 $16.22 $16.71 $17.21 $17.72 Expenditure Golf Course Maintenance $2,700,000 $2,808,000 $2,920,320 $3,037,133 $3,158,618 Golf Administration $800,000 $832,000 $865,280 $899,891 $935,887 Golf Cart/Equipment Expense $160,000 $166,400 $173,056 $179,978 $187,177 Clubhouse Expense $600,000 $624,000 $648,960 $674,918 $701,915 Food/Beverage Expense $800,000 $832,000 $865,280 $899,891 $935,887 Contingency (5%) $253,000 $265,650 $278,933 $292,879 $307,523 Expenditure Total $5,313,000 $5,528,050 $5,751,829 $5,984,691 $6,227,007 Surplus (Deficit) to 501 (c)3 $1,633,852 $1,662,167 $1,654,095 $1,643,410 $1,629,937
NGF Consulting estimate – January 2007 based on assumptions detailed in attached report.

National Golf Foundation Consulting, Inc. – City of San Francisco, California – 161
SHARP PARK GC PROJECTED FINANCIAL PERFORMANCE (FY2008-12) Sharp Park GC Revenue Assumptions (FY2008-12)
• In establishing new average revenues per round, NGF Consulting has assumed prime-time, non-resident weekday fees in the range of $57 and $65 weekends (including cart). Resident discount percentages would remain as today. Projected rounds and fees for 2009-10 are as shown in the table below. Three percent (3%) annual growth is estimated through 2012.
Sharp Park GC Fee Schedule and Expected Rounds
After Renovation (2009-10)
Rounds Fee Fee Type Weekday Weekend Total Weekday Weekend Standard 4,950 3,850 8,800 $57 $65 Resident 5,500 11,000 16,500 $27 $31 Senior 11,000 3,850 14,850 $18 $25 Junior 550 550 1,100 $14 $23 Tournament 2,750 3,300 6,050 $70 $85 Twilight 2,750 1,650 4,400 $24 $30 Back 9 1,100 2,200 3,300 $14 $18 55,000 Overall average $36.00
• Ancillary fee revenue is assumed to be comparable with actual 2006-07 figures with three percent (3%) growth expected through 2012, after closing in 2008-09 for renovation.
• Rounds are projected at a stable 55,000 to 58,000 rounds per year after reopening in FY 2009-10. Increases in non-resident play expected through 2012.
Sharp Park GC Expense Assumptions (FY2008-12) Fixed Expenses Golf course maintenance expenses (includes practice facility) have been estimated to be $1,250,000 in 2009-10 (first full year after facility improvements). General and administrative expenses have been estimated to be $350,000 in 2009-10. The estimates appear in the tables on the following page. Growth is four percent per year.
Other Expenses Expenses associated with operating a fleet of 75 golf carts has been estimated based on an accepted industry estimate of roughly $2,000 per cart per year. Clubhouse expenses have been estimated to be $300,000 in 2009-10. This line item includes clubhouse-related supplies, repairs, custodial services, and professional services, as well as a salary for a Building Maintenance Supervisor. Food & Beverage expenses have been estimated to be $350,000 in 2009-10. This line item does not include cost-of-goods-sold, but does include salaries for a Food & Beverage Director, Catering/Banquet Manager, two full-time kitchen staff, and various part-time/seasonal workers.

National Golf Foundation Consulting, Inc. – City of San Francisco, California – 162
Estimated Golf Course Maintenance Expense Sharp Park GC – 2009-10
Salaries & Wages Full-Time Employees Course Superintendent Assistant Superintendent Irrigation Specialist Mechanic 9 Crew Members @ $42,000 each Benefits & Taxes @ 25%
$70,000
50,000 50,000 50,000
378,000 149,500
Part-Time Labor 5,200 hours @ $14.00/hr.
72,800
Total Salaries & Wages $820,300 Utilities (incl. Water) 100,000 Equipment Lease 115,000 Seed, Sod & Sand 80,000 Supplies (Chemicals & Fertilizer) 30,000 Professional Services (Plumbing/Agronomy) 40,000 Repairs & Maintenance 20,000 Fuel & Oil 35,000 Maintenance Administration 10,000 Total Course Maintenance Expense $1,250,300
Source: NGF Consulting estimate 2007
Administrative & General Expense
Salaries & Wages Full-Time Employees Director of Golf/Head Golf Professional 2 Assistant Golf Professionals @ $40,000 Benefits & Taxes @ 25%
65,000 80,000 36,250
Part-Time Labor Shop Clerks, starters, rangers, etc. (6,240 hours @ $12.00/hr.)
74,880 Advertising & Promotion 20,000 Insurance 50,000 Supplies 12,000 Miscellaneous 12,000 Total Administrative & General Expense $350,130
Source: NGF Consulting Estimate 2007

National Golf Foundation Consulting, Inc. – City of San Francisco, California – 163
Sharp Park GC Projected Financial Performance (FY2008-12)
501(c)3 Corporation Sharp Park Projected Golf Course Performance (FY2008-2012)
FY 2007-08 FY 2008-09 FY 2009-10 FY 2010-11 FY 2011-12Rounds Played 45,000 0 55,000 58,000 58,000 Closed for Total Green Fee Revenue $946,049 Renovation $1,980,000 $2,150,640 $2,215,159
Lessons $1,545 $0 $2,750 $2,987 $3,077F&B $855,596 $0 $1,100,000 $1,194,800 $1,230,644Golf Carts $128,952 $0 $440,000 $477,920 $492,258Merchandise $22,690 $0 $110,000 $119,480 $123,064Other $0 $0 $13,750 $14,935 $15,383Total Concession $1,008,784 $0 $1,666,500 $1,810,122 $1,864,426
Merch COGS $17,017 $0 $82,500 $89,610 $92,298F&B COGS $513,358 $660,000 $716,880 $738,386Net Concessions $478,408 $924,000 $1,003,632 $1,033,741
Facility Net Revenue $1,424,457 $0 $2,904,000 $3,154,272 $3,248,900 Average Revenue per Round Total Green Fee Revenue $21.02 $0.00 $36.00 $37.08 $38.19Lessons $0.03 $0.00 $0.05 $0.05 $0.05F&B $19.01 $0.00 $20.00 $20.60 $21.22Golf Carts $2.87 $0.00 $8.00 $8.24 $8.49Merchandise $0.50 $0.00 $2.00 $2.06 $2.12Other $0.00 $0.00 $0.25 $0.26 $0.27Total Facility Revenue/Rnd. $43.44 $0.00 $66.30 $68.29 $70.34
Expenditure Golf Course Maintenance $1,000,000 $300,000 $1,250,000 $1,300,000 $1,352,000 Golf Administration $250,000 $100,000 $350,000 $364,000 $378,560 Golf Cart Expense $80,000 $0 $150,000 $156,000 $162,240 Clubhouse Expense $200,000 $0 $300,000 $312,000 $324,480 Food/Beverage Expense $250,000 $0 $350,000 $364,000 $378,560 Contingency (5%) $89,000 $0 $120,000 $124,800 $129,792 Expenditure Total $1,869,000 $400,000 $2,520,000 $2,620,800 $2,725,632 Surplus (Deficit) to 501 (c)3 ($444,543) ($400,000) $384,000 $533,472 $523,268
NGF Consulting estimate – January 2007 based on assumptions detailed in attached report.

National Golf Foundation Consulting, Inc. – City of San Francisco, California – 164
LINCOLN PARK GC PROJECTED FINANCIAL PERFORMANCE (FY2008-12) Lincoln Park GC Revenue Assumptions (FY2008-12)
• In establishing new average revenues per round, NGF Consulting has assumed prime-time, non-resident fees in the range of $54 and $61 weekday/weekends (including cart). Resident discount percentages would remain as today. Projected rounds and fees for 2008-09 are as shown in the table below. Three percent (3%) annual growth is estimated through 2012.
Lincoln Park GC Fee Schedule and Expected Rounds
After Renovation (2008-09)
Rounds Fee Fee Type Weekday Weekend Total Weekday Weekend Standard 6720 10800 17520 $54 $61 Resident 4800 8160 12960 $21 $25 Senior 3840 960 4800 $13 $20 Junior 480 480 960 $11 $19 Tournament 1440 1920 3360 $65 $80 Twilight 3120 3120 6240 $19 $24 Back 9 720 1440 2160 $12 $16 48000 Overall average $38.00
• Ancillary fee revenue is assumed to be comparable with actual 2006-07 figures with large, 20-25% increases in the first two years after renovation to account for an upgraded clubhouse at Lincoln with enhanced food and beverage revenue due to increased event and meeting business.
• Rounds are projected at a stable 50,000 to 52,000 rounds per year after reopening in FY 2008-09. Increases in non-resident play expected through 2012.
Lincoln Park GC Expense Assumptions (FY2008-12) Fixed Expenses Golf course maintenance expenses have been estimated to be $1,100,000 in 2008-09 (first full year after facility improvements). General and administrative expenses have been estimated to be $350,000 in 2008-09. The estimates appear in the tables on the following page. Growth is four percent per year.
Other Expenses Expenses associated with operating a fleet of 55 golf carts has been estimated based on an accepted industry estimate of roughly $2,000 per cart per year. Clubhouse expenses have been estimated to be $250,000 in 2008-09. This line item includes clubhouse-related supplies, repairs, custodial services, and professional services, as well as a salary for a Building Maintenance Supervisor. Food & Beverage expenses have been estimated to be $300,000 in 2008-09. This line item does not include cost-of-goods-sold, but does include salaries for a

National Golf Foundation Consulting, Inc. – City of San Francisco, California – 165
Food & Beverage Director, Catering/Banquet Manager, two full-time kitchen staff, and various part-time/seasonal workers.
Estimated Golf Course Maintenance Expense Lincoln Park GC – 2008-09
Salaries & Wages Full-Time Employees Course Superintendent Irrigation Specialist Mechanic 8 Crew Members @ $42,000 each Benefits & Taxes @ 25%
$65,000
50,000 50,000
336,000 125,250
Part-Time Labor 5,200 hours @ $14.00/hr.
72,800
Total Salaries & Wages $699,050 Utilities (incl. Water) 100,000 Equipment Lease 100,000 Seed, Sod & Sand 70,000 Supplies (Chemicals & Fertilizer) 25,000 Professional Services (Plumbing/Agronomy) 40,000 Repairs & Maintenance 20,000 Fuel & Oil 35,000 Maintenance Administration 10,000 Total Course Maintenance Expense $1,099,050
Source: NGF Consulting estimate 2007
Administrative & General Expense
Salaries & Wages Full-Time Employees Director of Golf/Head Golf Professional 2 Assistant Golf Professionals @ $40,000 Benefits & Taxes @ 25%
65,000 80,000 36,250
Part-Time Labor Shop Clerks, starters, rangers, etc. (6,240 hours @ $12.00/hr.)
74,880 Advertising & Promotion 20,000 Insurance 50,000 Supplies 12,000 Miscellaneous 12,000 Total Administrative & General Expense $350,130
Source: NGF Consulting Estimate 2007

National Golf Foundation Consulting, Inc. – City of San Francisco, California – 166
Lincoln Park GC Projected Financial Performance (FY2008-12)
501(c)3 Corporation Lincoln Park Projected Golf Course Performance (FY2008-2012)
FY 2007-08 FY 2008-09 FY 2009-10 FY 2010-11 FY 2011-12Rounds Played 0 48,000 50,000 52,000 52,000 Closed for Total Green Fee Revenue Renovation $1,824,000 $2,100,000 $2,288,000 $2,356,640
Merchandise $0 $120,000 $128,750 $137,917 $142,055Lessons $0 $9,600 $10,300 $11,033 $11,364F&B $0 $288,000 $400,000 $520,000 $535,600Golf Carts/Rentals $0 $384,000 $412,000 $441,334 $454,574Other $0 $24,000 $25,750 $27,583 $28,411Total Concession $0 $825,600 $976,800 $1,137,868 $1,172,004
Merch COGS $0 $90,000 $96,563 $103,438 $106,541F&B COGS $0 $172,800 $240,000 $312,000 $321,360 Net Concessions $0 $562,800 $640,238 $722,430 $744,103
Facility Net Revenue $0 $2,386,800 $2,740,238 $3,010,430 $3,100,743 Average Revenue per Round Green Fees $0.00 $38.00 $42.00 $44.00 $45.32Merchandise $0.00 $2.50 $2.58 $2.65 $2.73Lessons $0.00 $0.20 $0.21 $0.21 $0.22F&B $0.00 $6.00 $8.00 $10.00 $10.30Golf Carts/Rentals $0.00 $8.00 $8.24 $8.49 $8.74Other $0.00 $0.50 $0.52 $0.53 $0.55Total Facility Revenue/Rnd. $55.20 $61.54 $65.88 $67.86 Expenditure Golf Course Maintenance $300,000 $1,100,000 $1,144,000 $1,189,760 $1,237,350 Golf Administration $100,000 $350,000 $364,000 $378,560 $393,702 Golf Cart Expense $0 $110,000 $114,400 $118,976 $123,735 Clubhouse Expense $0 $250,000 $300,000 $312,000 $324,480 Food/Beverage Expense $0 $300,000 $350,000 $364,000 $378,560 Contingency (5%) $0 $105,500 $113,620 $119,301 $125,266 Expenditure Total $400,000 $2,215,500 $2,386,020 $2,482,597 $2,583,094 Surplus (Deficit) to 501 (c)3 ($400,000) $171,300 $354,218 $527,833 $517,649
NGF Consulting estimate – January 2007 based on assumptions detailed in attached report.

National Golf Foundation Consulting, Inc. – City of San Francisco, California – 167
GOLDEN GATE PARK GC PROJECTED FINANCIAL PERFORMANCE (FY2008-12) Golden Gate Park GC Revenue Assumptions (FY2008-12)
• Average fee revenue at Golden Gate Park is assumed to be comparable with actual 2006-07 figures, with three percent (3%) growth expected through 2012.
• Ancillary fee revenue is assumed to be comparable with actual 2006-07 figures with three percent (3%) growth expected through 2012.
• Rounds are projected at a growing 48,000 to 54,000 rounds per year.
Golden Gate Park GC Expense Assumptions (FY2008-12) Fixed Expenses
Estimated Golf Course Maintenance Expense Golden Gate Park GC – 2007-08
Salaries & Wages Full-Time Employees Course Superintendent 2 Crew Members @ $42,000 each Benefits & Taxes @ 25%
$60,000
84,000 36,000
Part-Time Labor 2,080 hours @ $14.00/hr.
29,120
Total Salaries & Wages $209,120 Utilities (incl. Water) 50,000 Equipment Lease 40,000 Seed, Sod & Sand 25,000 Supplies (Chemicals & Fertilizer) 10,000 Professional Services (Plumbing/Irrigation) 10,000 Repairs & Maintenance 7,500 Fuel & Oil 20,000 Maintenance Administration 3,000 Total Course Maintenance Expense $374,620
Source: NGF Consulting estimate 2007

National Golf Foundation Consulting, Inc. – City of San Francisco, California – 168
Administrative & General Expense
Salaries & Wages Full-Time Employees Director of Golf/Head Golf Professional 2 Assistant Golf Professionals @ $30,000 Benefits & Taxes @ 25%
60,000 60,000 30,000
Part-Time Labor Shop Clerks, starters, rangers, etc. (3,120 hours @ $12.00/hr.)
37,440 Advertising & Promotion 12,500 Insurance 30,000 Supplies 10,000 Miscellaneous 10,000 Total Administrative & General Expense $249,940
Source: NGF Consulting Estimate 2007
Other Expenses Expenses associated with leasing maintenance equipment has been estimated based on the short length and small acreage of Golden Gate, and is expected to be $25,000 in 2007-08, growing at four percent per year to about $30,000 by 2011-12. Clubhouse expenses have been estimated to be $50,000 in 2007-08. This line item includes clubhouse-related supplies, repairs, custodial services, and professional services. Food & Beverage expenses have been estimated to be $50,000 in 2007-08. This line item does not include cost-of-goods-sold, but does include payroll expenses for kitchen staff.

National Golf Foundation Consulting, Inc. – City of San Francisco, California – 169
Golden Gate Park GC Projected Financial Performance (FY2008-12)
501(c)3 Corporation Golden Gate Park Projected Golf Course Performance (FY2008-2012)
FY 2007-08 FY 2008-09 FY 2009-10 FY 2010-11 FY 2011-12Rounds Played 48,000 52,000 53,000 54,000 54,000 Total Green Fee Revenue $694,174 $774,583 $813,163 $853,361 $878,961
Lessons $145,048 $161,850 $169,911 $178,311 $183,660F&B $101,664 $113,440 $119,090 $124,977 $128,727Beer Sales $48,198 $53,781 $56,459 $59,250 $61,028Equipment Rentals $22,655 $25,280 $26,539 $27,851 $28,686Merchandise $30,493 $34,025 $35,720 $37,486 $38,610Range $38,224 $42,652 $44,776 $46,990 $48,399Gross Concession $386,283 $431,027 $452,496 $474,865 $489,111Merch COGS $22,870 $25,519 $26,790 $28,114 $28,958F&B COGS 89,917 100,332 105,330 110,537 113,853 Net Concessions $273,496 $305,176 $320,376 $336,214 $346,300 Total Net Revenue $967,670 $1,079,758 $1,133,539 $1,189,574 $1,225,261 Average Revenue per Round Green Fees $14.46 $14.90 $15.34 $15.80 $16.28Beer $1.00 $1.03 $1.07 $1.10 $1.13Lessons $3.02 $3.11 $3.21 $3.30 $3.40F&B $2.12 $2.18 $2.25 $2.31 $2.38Equipment Rentals $0.47 $0.49 $0.50 $0.52 $0.53Merchandise $0.64 $0.65 $0.67 $0.69 $0.72Range $0.80 $0.82 $0.84 $0.87 $0.90Total Facility Revenue/Rnd. $21.51 $22.15 $22.82 $23.50 $24.20Expenditure Golf Course Maintenance $375,000 $393,750 $413,438 $434,109 $455,815 Golf Administration $250,000 $262,500 $275,625 $289,406 $303,877 Clubhouse Expense $50,000 $52,500 $55,125 $57,881 $60,775 Food/Beverage Expense $50,000 $52,500 $55,125 $57,881 $60,775 Contingency (5%) $36,250 $38,063 $39,966 $41,964 $44,062 Expenditure Total $761,250 $799,313 $839,278 $881,242 $925,304 Surplus (Deficit) to 501 (c)3 $206,420 $280,446 $294,261 $308,332 $299,957
NGF Consulting estimate – January 2007 based on assumptions detailed in attached report.
GLENEAGLES (MCLAREN PARK) GC PROJECTED FINANCIAL PERFORMANCE (FY2008-12) Gleneagles GC Revenue Assumptions (FY2008-12) The NGF Consulting projection for the financial performance of Gleneagles from the perspective of the 501 (c)3 is the same as for the City assuming that the facility continues operations on its
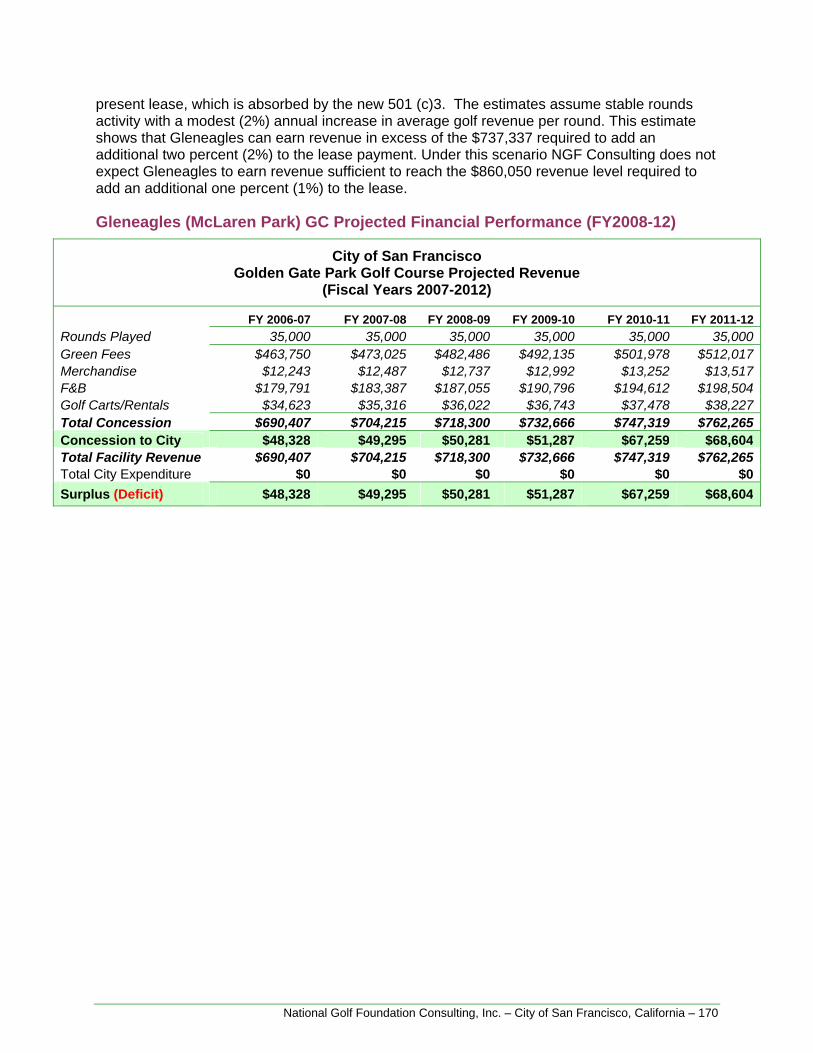
National Golf Foundation Consulting, Inc. – City of San Francisco, California – 170
present lease, which is absorbed by the new 501 (c)3. The estimates assume stable rounds activity with a modest (2%) annual increase in average golf revenue per round. This estimate shows that Gleneagles can earn revenue in excess of the $737,337 required to add an additional two percent (2%) to the lease payment. Under this scenario NGF Consulting does not expect Gleneagles to earn revenue sufficient to reach the $860,050 revenue level required to add an additional one percent (1%) to the lease.
Gleneagles (McLaren Park) GC Projected Financial Performance (FY2008-12)
City of San Francisco Golden Gate Park Golf Course Projected Revenue
(Fiscal Years 2007-2012)
FY 2006-07 FY 2007-08 FY 2008-09 FY 2009-10 FY 2010-11 FY 2011-12 Rounds Played 35,000 35,000 35,000 35,000 35,000 35,000 Green Fees $463,750 $473,025 $482,486 $492,135 $501,978 $512,017 Merchandise $12,243 $12,487 $12,737 $12,992 $13,252 $13,517 F&B $179,791 $183,387 $187,055 $190,796 $194,612 $198,504 Golf Carts/Rentals $34,623 $35,316 $36,022 $36,743 $37,478 $38,227 Total Concession $690,407 $704,215 $718,300 $732,666 $747,319 $762,265Concession to City $48,328 $49,295 $50,281 $51,287 $67,259 $68,604Total Facility Revenue $690,407 $704,215 $718,300 $732,666 $747,319 $762,265Total City Expenditure $0 $0 $0 $0 $0 $0Surplus (Deficit) $48,328 $49,295 $50,281 $51,287 $67,259 $68,604

National Golf Foundation Consulting, Inc. – City of San Francisco, California – 171
SYSTEM-WIDE GOLF OPERATIONS PERFORMANCE
501(c)3 Corporation Complete 4-Course Golf System (FY2008-2012)
Rounds Played FY 2007-08 FY 2008-09 FY 2009-10 FY 2010-11 FY 2011-12Harding 69,000 69,000 69,000 69,000 69,000Fleming 46,000 46,000 46,000 46,000 46,000Sharp 45,000 0 55,000 58,000 58,000Lincoln 0 48,000 50,000 52,000 52,000Gleneagles 35,000 35,000 35,000 35,000 35,000Golden Gate 48,000 52,000 53,000 54,000 54,000Total System Rounds 243,000 250,000 308,000 314,000 314,000 Total Facility Revenue Harding/Fleming $6,946,852 $7,190,217 $7,405,924 $7,628,101 $7,856,944Sharp $1,424,457 $0 $2,904,000 $3,154,272 $3,248,900Lincoln $0 $2,386,800 $2,740,238 $3,010,430 $3,100,743Gleneagles $967,670 $1,079,758 $1,133,539 $1,189,574 $1,225,261Golden Gate $49,295 $50,281 $51,287 $67,259 $68,604Total System Net Revenue $9,388,274 $10,707,057 $14,234,987 $15,049,637 $15,500,453 Expenditure Golf Course Maintenance $4,375,000 $4,601,750 $5,727,758 $5,961,002 $6,203,783 Golf Administration $1,400,000 $1,544,500 $1,854,905 $1,931,857 $2,012,026 Golf Cart Expense $240,000 $276,400 $437,456 $454,954 $473,152 Clubhouse Expense $850,000 $926,500 $1,304,085 $1,356,800 $1,411,650 Food/Beverage Expense $1,100,000 $1,184,500 $1,620,405 $1,685,772 $1,753,782 Contingency (5%) $378,250 $409,213 $552,518 $578,944 $606,643 501(c)3 Corporation $493,750 $507,500 $421,313 $397,691 $406,638 Expenditure Total $8,837,000 $9,450,363 $11,918,439 $12,367,021 $12,867,675 Operations Surplus (Deficit) $551,274 $1,256,694 $2,316,547 $2,682,616 $2,632,778 Open Space Payment $1,417,075 $1,417,075 $1,417,075 $1,417,075 $1,417,075 Net ($865,801) ($160,381) $899,472 $1,265,541 $1,215,703 Cumulative Shortfall/Reserves ($865,801) ($1,026,182) ($126,710) $1,138,831 $2,354,534
NGF Consulting estimate – January 2007 based on assumptions detailed in attached report.

National Golf Foundation Consulting, Inc. – City of San Francisco, California – 172
FINANCIAL PROJECTIONS SUMMARY The results of NGF Consulting’s cash flow model for the municipal golf system under direction of the 501(c)3 corporation, assuming our recommendations are enacted, show the improved golf facilities with enhanced marketing and more efficient maintenance are capable of growing total revenues to $15 million with only slight increases in rounds activity and modest (40% three years after renovation) increases in average revenue per round. Additionally, modest savings (25%) in overall system expenses combined with more efficiency in operations should allow the whole four-course system (excluding Gleneagles) to reach a profitability level of over $2.0 million within three years of 501(c)3 management. This level of surplus would be sufficient for the new 501(c)3 to take over the repayment to Open Space AND allow for excess revenues to be set aside for future capital improvements that will eventually become necessary.

National Golf Foundation Consulting, Inc. – City of San Francisco, California – 173
Summary Statement In summary, NGF Consulting’s inspection of the City of San Francisco municipal golf courses, and our review of the golf system, has revealed an impressive portfolio of beautiful golf course assets that have been neglected and fallen into disrepair. For a variety of reasons enumerated in this report, the golf system now suffers from large operating deficits, and ever-deteriorating assets, with the exception of the flagship Harding Park Golf Course.
However, we have also concluded that the system is salvageable, mainly due to the high quality and potential of these golf courses, which was cited by nearly every golfer and golf industry professional we came in contact with during the course of this study. In order for the assets to be rehabilitated and the system to return to profitability, the golf courses must be managed by people who have the experience and expertise to do so, free of political interference. We believe that a 501(c)3 organization (perhaps one already created) provides the best means of achieving this goal. The non-profit organization will ensure that best business practices are implemented and followed, and that the golf courses will once again offer affordable quality golf for the residents of San Francisco. The Corporation will also be much better equipped to perform the stewardship role for these assets, assuring that they maintain a high standard of quality. However, in order for this to happen, the City must have the political will and foresight, as well as the desire, to preserve these urban jewels, which someday should again reflect well on this proud city.