Operational Recognition of High Precipitation Efficiency...
16
Vitale, J. D., and T. Ryan, 2013: Operational recognition of high precipitation efficiency and low-echo-centroid convection. J. Operational Meteor., 1 (12), 128–143, doi: http://dx.doi.org/10.15191/nwajom.2013.0112. Corresponding author address: Jeffrey Vitale, National Weather Service Forecast Office, 2579 South Loop 289, Suite 100, Lubbock, TX 79423 E-mail: [email protected] 128 Journal of Operational Meteorology Article Operational Recognition of High Precipitation Efficiency and Low-Echo-Centroid Convection JEFFREY D. VITALE National Weather Service Forecast Office, Lubbock, Texas TED RYAN National Weather Service Forecast Office, Fort Worth, Texas (Manuscript received 3 April 2012; in final form 27 September 2012) ABSTRACT A rarely studied cause of flash flooding—the leading cause of weather-related fatalities in the United States—is from a type of convective cell called a low-echo centroid (LEC), where most of the reflectivity is within the warm portion of the cloud-bearing layer. Since the inception of the LEC classification, the definition has remained ambiguous and difficult to quantify. Operational identification of LEC convection is critical to anticipating flash flooding, because rainfall estimates from the Weather Surveillance Radar-1988 Doppler often are too low. Four LEC convective cases are examined in order to refine the definition and to provide the characteristic features of these storms. From the sample events, two types of LEC storms were identified that shared features that would assist in their operational identification. Analyses indicated that radar reflectivity 60 dBZ should exist within the cell, the cell should possess a long-lived steady-state reflectivity of 45–55 dBZ, and the LEC cell should have increasing reflectivity as height decreases. The development of a system to assist operational forecasters in identification of the atmospheric parameters favoring LEC convection, and the real-time recognition of LEC events to support flash-flood-warning decision making, is an important effort to reducing unwarned and/or unexpected flooding events. 1. Introduction Over the last few decades, flash flooding has ranked as the leading cause of fatalities associated with non-tropical convection in the United States (NOAA 2010). Anticipating a flash-flood event is different than forecasting the occurrence of other convective hazards such as tornadoes or large hail because it requires several non-meteorological factors to be present with excessive rainfall rates. Excessive rainfall can be defined operationally as a rainfall rate exceeding flash-flood guidance. These non- meteorological factors include antecedent soil moisture, drainage basin characteristics, and the interaction of runoff with civil infrastructure. Non- meteorological factors often are unknown or approximated, but errors in estimation of the primary meteorological factor—precipitation rates—also can occur. Overestimated rainfall intensity can result in flash-flood warnings issued for events that do not occur (i.e., a false alarm). In contrast, underestimated rainfall intensity can increase the chance for missed events—a flash-flood event occurring with no warning. National flash-flood warning statistics from fiscal year 2011 (October 2010 to September 2011) show a probability of detection of 79%, false alarm ratio of 49%, and an average lead time of 73 min (NOAA 2011). Unwarned flash-flood events are especially counter to the core mission of the National Weather Service (NWS) to protect life and property. Missed events contribute toward a lack of response and may lead to fatalities or property damage that otherwise could have been prevented or mitigated. The deployment of the Weather Surveillance Radar-1988 Doppler (WSR-88D) radar network across the United States in the 1990s has contributed to substantial improvements in the ability to forecast flash floods (Polger et al. 1994). This occurred because the WSR-88D produces real-time rainfall
Transcript of Operational Recognition of High Precipitation Efficiency...

Vitale, J. D., and T. Ryan, 2013: Operational recognition of high precipitation efficiency and low-echo-centroid convection. J.
Operational Meteor., 1 (12), 128–143, doi: http://dx.doi.org/10.15191/nwajom.2013.0112.
Corresponding author address: Jeffrey Vitale, National Weather Service Forecast Office, 2579 South Loop 289, Suite 100, Lubbock, TX
79423
E-mail: [email protected]
128
Journal of Operational Meteorology
Article
Operational Recognition of High Precipitation
Efficiency and Low-Echo-Centroid Convection
JEFFREY D. VITALE
National Weather Service Forecast Office, Lubbock, Texas
TED RYAN
National Weather Service Forecast Office, Fort Worth, Texas
(Manuscript received 3 April 2012; in final form 27 September 2012)
ABSTRACT
A rarely studied cause of flash flooding—the leading cause of weather-related fatalities in the United
States—is from a type of convective cell called a low-echo centroid (LEC), where most of the reflectivity is
within the warm portion of the cloud-bearing layer. Since the inception of the LEC classification, the
definition has remained ambiguous and difficult to quantify. Operational identification of LEC convection is
critical to anticipating flash flooding, because rainfall estimates from the Weather Surveillance Radar-1988
Doppler often are too low. Four LEC convective cases are examined in order to refine the definition and to
provide the characteristic features of these storms. From the sample events, two types of LEC storms were
identified that shared features that would assist in their operational identification. Analyses indicated that
radar reflectivity 60 dBZ should exist within the cell, the cell should possess a long-lived steady-state
reflectivity of 45–55 dBZ, and the LEC cell should have increasing reflectivity as height decreases. The
development of a system to assist operational forecasters in identification of the atmospheric parameters
favoring LEC convection, and the real-time recognition of LEC events to support flash-flood-warning
decision making, is an important effort to reducing unwarned and/or unexpected flooding events.
1. Introduction
Over the last few decades, flash flooding has
ranked as the leading cause of fatalities associated
with non-tropical convection in the United States
(NOAA 2010). Anticipating a flash-flood event is
different than forecasting the occurrence of other
convective hazards such as tornadoes or large hail
because it requires several non-meteorological factors
to be present with excessive rainfall rates. Excessive
rainfall can be defined operationally as a rainfall rate
exceeding flash-flood guidance. These non-
meteorological factors include antecedent soil
moisture, drainage basin characteristics, and the
interaction of runoff with civil infrastructure. Non-
meteorological factors often are unknown or
approximated, but errors in estimation of the primary
meteorological factor—precipitation rates—also can
occur. Overestimated rainfall intensity can result in
flash-flood warnings issued for events that do not
occur (i.e., a false alarm). In contrast, underestimated
rainfall intensity can increase the chance for missed
events—a flash-flood event occurring with no
warning. National flash-flood warning statistics from
fiscal year 2011 (October 2010 to September 2011)
show a probability of detection of 79%, false alarm
ratio of 49%, and an average lead time of 73 min
(NOAA 2011). Unwarned flash-flood events are
especially counter to the core mission of the National
Weather Service (NWS) to protect life and property.
Missed events contribute toward a lack of response
and may lead to fatalities or property damage that
otherwise could have been prevented or mitigated.
The deployment of the Weather Surveillance
Radar-1988 Doppler (WSR-88D) radar network across
the United States in the 1990s has contributed to
substantial improvements in the ability to forecast
flash floods (Polger et al. 1994). This occurred
because the WSR-88D produces real-time rainfall
Vitale and Ryan NWA Journal of Operational Meteorology 9 August 2013
ISSN 2325-6184, Vol. 1, No. 12 129
estimates from computer algorithms that associate
reflectivity values with observed precipitation rates. A
forecaster’s use of rainfall estimates in conjunction
with short-term convective trends is often sufficient to
anticipate a flash-flood event. However, this method
places heavy reliance upon the WSR-88D precip-
itation-estimation algorithms, which unfortunately can
be inaccurate for a number of reasons (Baeck and
Smith 1998)—including its inability to accurately
depict precipitation estimates with different storm
types. One specific storm type, called a low-echo
centroid (LEC), where most of the reflectivity is
within the warm portion of the cloud-bearing layer,
can be especially problematic for precipitation-
estimation algorithms.
This research focused on LEC convective storms
in the central and southern United States to help
identify and characterize the specific meteorological
causes that resulted in radar rainfall-rate under-
estimation. This systematic underestimation results
from cloud microphysical properties typically associ-
ated with convection over continental locations in
tropical and semi-tropical airmass environments when
the convective rainfall estimation algorithm is in
effect. An examination of several flash-flood events
over the south-central United States has identified
common characteristics associated with LEC
convection. These are used to demonstrate how an
operational forecaster, using a more complete
definition and more comprehensive understanding of
an LEC storm, may improve LEC recognition in a
real-time operational setting.
2. Background
a. Radar fundamentals
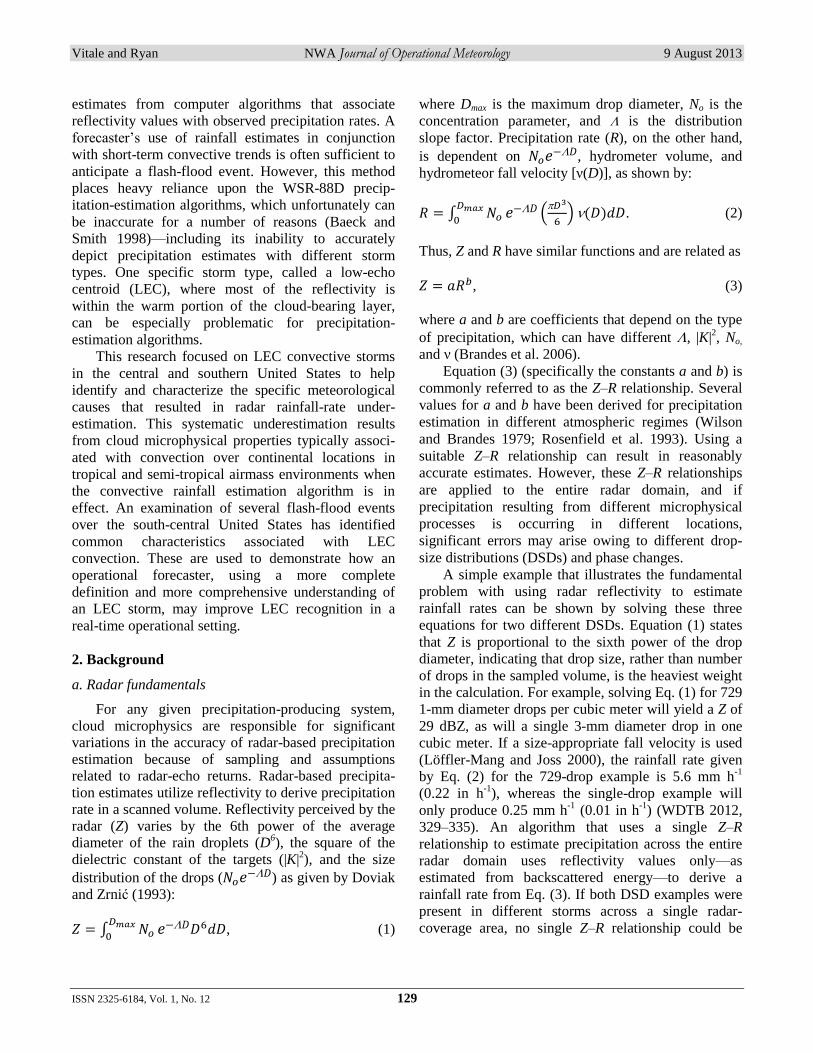
For any given precipitation-producing system,
cloud microphysics are responsible for significant variations in the accuracy of radar-based precipitation
estimation because of sampling and assumptions related to radar-echo returns. Radar-based precipita-
tion estimates utilize reflectivity to derive precipitation rate in a scanned volume. Reflectivity perceived by the
radar (Z) varies by the 6th power of the average diameter of the rain droplets (D
6), the square of the
dielectric constant of the targets (|K|2), and the size
distribution of the drops ( ) as given by Doviak
and Zrnić (1993):
∫
, (1)
where Dmax is the maximum drop diameter, No is the
concentration parameter, and is the distribution
slope factor. Precipitation rate (R), on the other hand,
is dependent on , hydrometer volume, and
hydrometeor fall velocity [ν(D)], as shown by:
∫
(
) . (2)
Thus, Z and R have similar functions and are related as
, (3)
where a and b are coefficients that depend on the type
of precipitation, which can have different , |K|2, No,
and ν (Brandes et al. 2006).
Equation (3) (specifically the constants a and b) is
commonly referred to as the Z–R relationship. Several
values for a and b have been derived for precipitation
estimation in different atmospheric regimes (Wilson
and Brandes 1979; Rosenfield et al. 1993). Using a
suitable Z–R relationship can result in reasonably
accurate estimates. However, these Z–R relationships
are applied to the entire radar domain, and if
precipitation resulting from different microphysical
processes is occurring in different locations,
significant errors may arise owing to different drop-
size distributions (DSDs) and phase changes.
A simple example that illustrates the fundamental
problem with using radar reflectivity to estimate
rainfall rates can be shown by solving these three
equations for two different DSDs. Equation (1) states
that Z is proportional to the sixth power of the drop
diameter, indicating that drop size, rather than number
of drops in the sampled volume, is the heaviest weight
in the calculation. For example, solving Eq. (1) for 729
1-mm diameter drops per cubic meter will yield a Z of
29 dBZ, as will a single 3-mm diameter drop in one
cubic meter. If a size-appropriate fall velocity is used
(Löffler-Mang and Joss 2000), the rainfall rate given
by Eq. (2) for the 729-drop example is 5.6 mm h-1
(0.22 in h-1
), whereas the single-drop example will
only produce 0.25 mm h-1
(0.01 in h-1
) (WDTB 2012,
329–335). An algorithm that uses a single Z–R
relationship to estimate precipitation across the entire
radar domain uses reflectivity values only—as
estimated from backscattered energy—to derive a
rainfall rate from Eq. (3). If both DSD examples were
present in different storms across a single radar-
coverage area, no single Z–R relationship could be

Vitale and Ryan NWA Journal of Operational Meteorology 9 August 2013
ISSN 2325-6184, Vol. 1, No. 12 130
used to accurately estimate rainfall rates for both
storms. This example shows rather dramatically why
many different rainfall-rate values are possible for a
given reflectivity value if there are non-homogeneous
DSDs within the radar domain.
b. Precipitation-production processes
In the real atmosphere, different DSDs are
generated as a result of differing precipitation-
production mechanisms (Marshall and Palmer 1948;
Srivastava 1971; Yuter and Houze 1997; Bringi et al.
2003). Precipitation typically forms from collision-
coalescence (commonly referred to as a warm-rain or
warm-cloud process), the Bergeron process (which
involves water in the ice phase), or a combination of
the two. Convection that relies upon collision-
coalescence to generate rainfall usually is more
efficient at converting available cloud water into
precipitation than the Bergeron process (Lamb 2001).
The collision-coalescence or warm-cloud method
occurs in the absence of water in the ice phase and is
very common at tropical latitudes where the melting
level often is >4 km above mean sea level (Battan and
Braham 1956). In this process, cloud droplets
suspended in the air interact with each other, either by
colliding and bouncing off each other or by combining
to form a larger droplet. The Bergeron process
involves both ice nuclei and supercooled water
droplets and comparatively is a faster but less efficient
way to generate precipitation-sized particles. This
process generally begins at temperatures below –10°C
when naturally occurring ice nuclei activate and allow
ice crystals to form inside a cloud (Wallace and Hobbs
1977).
There is a natural tendency for DSDs produced by
warm-cloud processes to consist of a large number of
small-diameter drops (Squires 1956). Precipitation
from the Bergeron process has a DSD skewed toward
a small number of large-diameter drops. Although the
radar-reflectivity signal may be identical for either
case, the large number of small drops will produce
more rainfall (Ulbrich and Atlas 2008). Therefore,
knowing the mechanism that is producing precipitation
allows for better Z–R approximations. In the absence
of using a dual-polarization radar to sample the mean
drop size, the best way to determine the precipitation
mechanism is to anticipate when the atmosphere will
be favorable for warm-cloud convection.
Identifying the atmospheric conditions that are
favorable for convection where collision-coalescence
can be the dominant rainfall-producing mechanism is
the first step toward recognizing the resulting
convective signatures in real-time. Diagnosing the
presence of ingredients that allow for excessive
rainfall rates has been an effective flash-flood forecast
tool (Doswell et al. 1996). Similarly, an ingredients-
based checklist of the atmospheric conditions required
for warm-cloud convection for use in conjunction with
numerical model guidance would be a valuable way to
anticipate this type of convection. Many of the
ingredients required for warm-cloud convection are
similar to those needed to produce excessive rainfall
rates.
Excessive rainfall events produced from collision-
coalescence processes require
a deep warm-cloud layer,
weak and/or shallow updrafts,
limited cloud-layer wind shear, and
high relative humidity through a deep layer (Davis
2001).
Warm-cloud depth (WCD), defined here as the
layer from the lifted condensation level (LCL) to the
–10°C level, is the area of the cloud where collision-
coalescence can occur provided that all water remains
in liquid phase. The melting level was not used for the
top of the WCD calculation because cloud water
remains in a supercooled phase without the presence
of ice nuclei, which do not become activated until
temperatures are colder than about –10°C (WDTB
2011, 10–12). A shallow warm-cloud layer will limit
the volume available for this process. In the case of a
shallow warm-cloud layer, incoming cloud water
vapor is more likely to be converted into ice in the
subfreezing portions of the clouds where it is
comparatively less efficient at reaching the ground as
precipitation (Lamb 2001). Even though there is no
minimum value of WCD, all of the excessive rainfall
cases presented in section 3 of this investigation had
WCD values >4 km (13 400 ft) as determined from
viewing representative vertical temperature profiles.
The updraft characteristics are important for
several reasons. Shallow updrafts, where the
equilibrium level (EL) is below the –10°C level,
ensure that the Bergeron process will not occur. In
situations where the EL is higher than the –10°C level,
the updraft must have slow vertical velocities through
a deep warm-cloud layer. This is because collision-
coalescence is a relatively time-consuming process,

Vitale and Ryan NWA Journal of Operational Meteorology 9 August 2013
ISSN 2325-6184, Vol. 1, No. 12 131
and a weak updraft gives raindrops the time required
to grow large enough to precipitate before the updraft
adiabatically cools below –10°C. The updraft charac-
teristics can be diagnosed by using either an observed
or forecast sounding that is representative of the
convective environment. A narrow or thin profile of
convective available potential energy (CAPE, com-
puted herein using the most-unstable parcel) on an
observed or forecast sounding provides an indication
of slow updraft velocities (Zipser and LeMone 1980).
Tilting of an updraft owing to vertical wind shear can
extrude embryonic hydrometeors outside of the
saturated cloud where precipitation efficiency can be
reduced because of evaporation (Schoenberg Ferrier et
al. 1996).
Relative humidity, both below the cloud base and
within the mid- and upper-levels of the atmosphere, is
one of the most important variables used to assess the
efficiency of convection in converting available cloud
water into precipitation at the surface. This often is
referred to as precipitation efficiency. The relative
humidity below the base of the cloud/LCL determines
the amount of sub-cloud evaporation that occurs.
Similarly, a cloud naturally will entrain some quantity
of environmental air (Doswell et al. 1996). Midlevel
and sub-cloud evaporation can create negatively
buoyant (i.e., cold) downdrafts, which severely hinder
the ability of warm-cloud convection to produce
excessive rainfall. This is because convection cannot
be sustained in the presence of cold downdrafts unless
the cell has adequate motion, or if vertical wind shear
is present. As already noted, vertical wind shear is
detrimental to weak updrafts that are required for
warm-rain convection. If cell motion is significant, the
effect is to limit the site-specific duration of heavy
rainfall.
c. The low-echo centroid
Many studies of excessive rainfall events often
describe convection as having an LEC (Caracena et al.
1979; Smith et al. 1996; Baeck and Smith 1998). LEC
is the term used to describe the vertical structure
evident on a radar cross section of a cell where the
centroid (i.e., highest reflectivity) of the cell is located
in the lower sections of the cloud—places that
typically are >0°C. Unfortunately, the definition of an
LEC cell has remained vague since the term was first
coined by Caracena et al. (1979) when it was used to
describe the radar characteristics of the cell respon-
sible for the Big Thompson Canyon flood of 1976.
The reason why a mature warm-cloud cell will
have this “bottom heavy” reflectivity structure can be
explained by exploring raindrop development via
collision-coalescence. Raindrop growth in collision-
coalescence tends to occur as the more massive
droplets intersect, and collect, smaller droplets on their
descent through the updraft. Therefore, the largest-
diameter raindrops will be found at the bottom of the
cell, with the more embryonic raindrops located at
progressively higher altitudes. The radar-reflectivity
Eq. (1) states that these larger droplets will reflect
considerably more signal back to the radar, thus
resulting in higher reflectivity values.
Although the LEC definition is vague, it does
address the fundamental radar signature that is
associated with convection where the collision-
coalescence process is responsible for the majority of
the precipitation production. However, the presence of
higher reflectivity in the lower portions of a cell does
not necessarily mean the collision-coalescence process
is the cause. For instance, a radar scan of a cell with a
descending hail core, or during a late phase of a
precipitation cycle, also may have an LEC appearance.
Therefore, additional (but rudimentary) guidelines on
the definition of LEC signatures were informally
proposed. NWS radar-training material suggests the
height of the 30-dBZ echo should remain below the
environmental melting level (WDTB 2012, 329–335).
Another informal rule suggests that tracking the height
of the 50-dBZ echo and ensuring it remains below the
melting level throughout a cell’s lifetime helps identify
an LEC cell. However, these methods offer no aid in
distinguishing between a cell that is steady-state and
precipitating as a result of collision-coalescence, or a
cell that merely is weak or decaying in which
precipitation formed from utilizing ice and super-
cooled water.
Case studies where the LEC structure and warm-
rain process have been identified also noted a low
number of cloud-to-ground (CG) lightning strikes
(Petersen et al. 1999; Bruning et al. 2007). This can be
attributed to a lack of both graupel and large vertical
velocities from strong updrafts within a convective
cell. These two characteristics are the fundamental
ingredients that lead toward charge separation and
lightning discharge (Lucas et al. 1994; Zipser and Lutz
1994).
Inasmuch as these guidelines can help, the LEC
signature remains ill-defined, difficult to recognize,
and easy to overlook, especially in the presence of
Vitale and Ryan NWA Journal of Operational Meteorology 9 August 2013
ISSN 2325-6184, Vol. 1, No. 12 132
continental convection with a high-echo centroid
(HEC)1. The inability to identify the LEC structure in
real-time has resulted in the occurrence of unwarned
flash-flood events during the last couple of decades
(Davis 2004).
One such example of a well-documented LEC
storm that produced flash flooding occurred on 28 July
1997 in Fort Collins, Colorado. The flash flooding
occurred when over 250 mm (10 in) of rain fell in less
than a 6-h period. This storm caused over $200 million
in damage and resulted in five fatalities (Kelsch 1998;
Petersen et al. 1999). Low-level upslope flow from the
east increased the low-level moisture content and
helped lift the air. The moisture was present through a
deep layer of the atmosphere. In addition, weak shear
profiles, warm-topped clouds on satellite images, the
lack of hail reports, and limited amounts of lightning
provide evidence that the warm-rain process was
dominant. A proximity sounding from Denver,
Colorado, at 0000 UTC 29 July 1997 showed the
following characteristics:
relatively small CAPE of 868 J kg-1
;
moderate lifted index of –2.8C°;
high melting level of 3.3 km above ground level
(AGL);
large surface–500-hPa precipitable water (PW) of
33 mm (1.3 in), which is about 179% of normal;
LCL at 764 hPa (855 m AGL), with a level of free
convection at 690 hPa, and a surface pressure of
843 hPa;
light-to-moderate mid-tropospheric winds of 5–10
m s-1
(10–20 kt) from the southwest; and
minimal CG lightning (0.5 flashes min-1
) (Kelsch
1998; Petersen et al. 1999).
The warm-rain process was further identified and
verified through the use of a dual-polarization radar at
Colorado State University; the reader is referred to
Petersen et al. (1999) for additional discussion on this
case.
1 The term high-echo centroid (HEC) was developed within this
study for brevity, and to our knowledge this term has not been used
previously in the refereed literature. An HEC storm (compared to
an LEC storm) has its largest reflectivity values above the melting
level.
3. Case analyses
a. Kansas Turnpike (30 August 2003)
1) OVERVIEW
On the evening of 30 August 2003, an isolated
LEC cell developed over Interstate-35 (Kansas
Turnpike) near Emporia, Kansas. The cell moved very
slowly and persisted for <3 h but inundated Jacob
Creek with 150–200 mm (6–8 in) of rain between
2300–0200 UTC. Jacob Creek greatly exceeded the
capacity of the culvert underneath the interstate and
surged onto the northeast-bound lanes. This flash flood
resulted in six fatalities as water piled up against, and
then washed away, the concrete barriers separating the
two sides of the interstate. It was estimated that
property damage of $250 000 was sustained from this
flash flood (NCDC 2003).
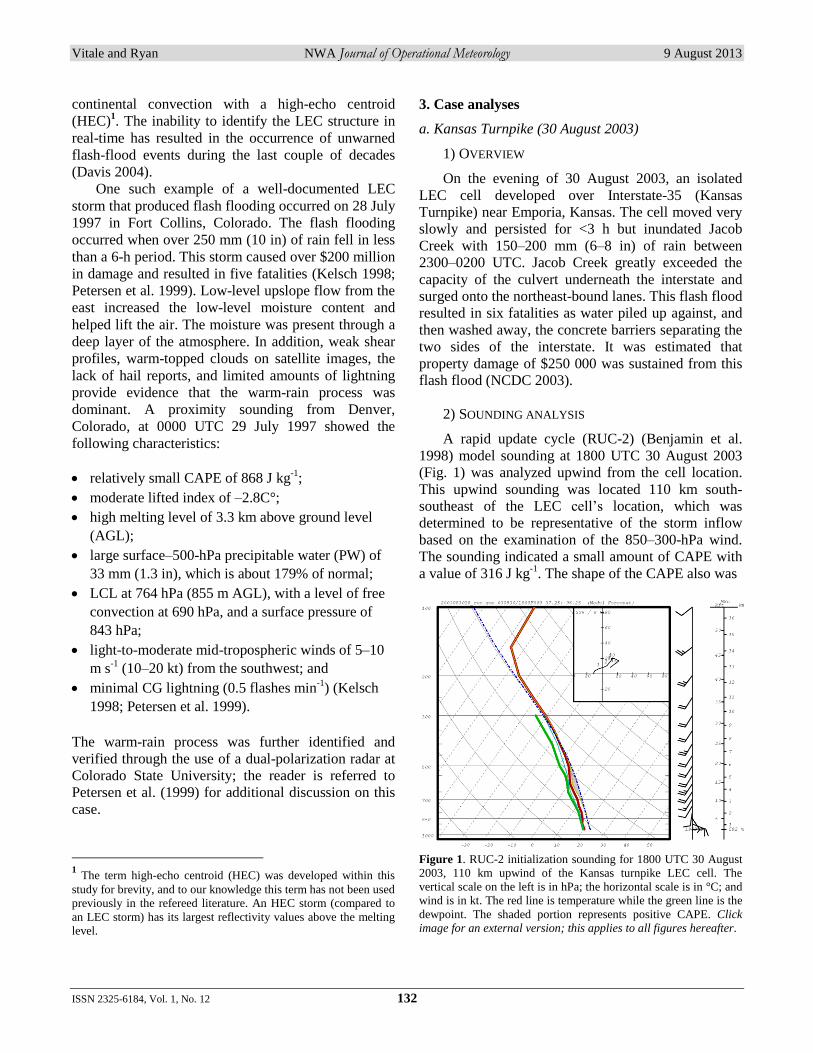
2) SOUNDING ANALYSIS
A rapid update cycle (RUC-2) (Benjamin et al.
1998) model sounding at 1800 UTC 30 August 2003
(Fig. 1) was analyzed upwind from the cell location.
This upwind sounding was located 110 km south-
southeast of the LEC cell’s location, which was
determined to be representative of the storm inflow
based on the examination of the 850–300-hPa wind.
The sounding indicated a small amount of CAPE with
a value of 316 J kg-1
. The shape of the CAPE also was
Figure 1. RUC-2 initialization sounding for 1800 UTC 30 August
2003, 110 km upwind of the Kansas turnpike LEC cell. The
vertical scale on the left is in hPa; the horizontal scale is in °C; and
wind is in kt. The red line is temperature while the green line is the
dewpoint. The shaded portion represents positive CAPE. Click
image for an external version; this applies to all figures hereafter.

Vitale and Ryan NWA Journal of Operational Meteorology 9 August 2013
ISSN 2325-6184, Vol. 1, No. 12 133
“tall and skinny,” with the positive area (gray, Fig. 1)
distributed over a 300-hPa depth of the sounding; but
most of the CAPE was below the –10°C isotherm. The
EL was at a height of 300 hPa while the tropopause
was at a height of 150 hPa (as determined by the
temperature profile). Speed shear was weak with wind
speeds within the WCD ranging between 5–10 m s-1
(10–20 kt). Based on this sounding, the WCD was
exceptionally large and approached 6.4 km (21 900 ft).
Also, the entire sounding was nearly saturated. The
PW for this event was 48 mm (1.90 in), which was
about 120% of normal.
Figure 2. Enhanced GOES-IR satellite image for 0045 UTC 31
August 2003. The location of the LEC storm in Kansas is indicated
by the white arrow. Temperature scale (°C) is at the upper left.
3) RADAR/SATELLITE ANALYSIS
The storm cell formed about 19 km (12 mi) west
of Emporia, Kansas, and reached peak intensity at
0035 UTC 31 August 2003. An examination of the
Geostationary Operational Environmental Satellite
(GOES) infrared (IR) satellite image at 0045 UTC 31
August 2003 (Fig. 2) indicated that the cell coincided
with warm cloud-top temperatures between –30 and
–40°C near the time of peak intensity. These
temperatures corresponded to pressures near 350 hPa,
similar to the EL in the RUC-2 model sounding. To
the south, in Oklahoma and Texas, there were colder
cloud-top temperatures (–60 to –80°C) associated with
thunderstorms that produced high winds, copious
lightning, and hail at the same time of the LEC cell to
the north. Additionally, there were no reports of CG
Figure 3. (a) Topeka, KS (KTWX), WSR-88D composite
reflectivity at 0035 UTC 31 August 2003. The thick line through
the LEC cell indicates the orientation of the cross section in (b). (b)
KTWX reflectivity cross section (northwest-to-southeast) at 0035
UTC 31 August 2003. The thick horizontal white line indicates the
–10°C isotherm.
lightning throughout the lifetime of the LEC cell
(Vitale et al. 2009).
At 0035 UTC 31 August 2003, reflectivity values
were between 50–55 dBZ (Fig. 3a). The reflectivity
cross section indicated by the thin, white line is shown
in Fig. 3b. All reflectivity values were <55 dBZ and
the highest values also were found below the –10°C
isotherm. Radar rainfall estimates had underestimated
precipitation by a factor of 2–3 during this event using
the local NWS default coefficients in Eq. (3) (i.e.,
Z=300R1.4
). Peak vertically integrated liquid (VIL)
values at the same time were around 25–30 kg m-2
.

Vitale and Ryan NWA Journal of Operational Meteorology 9 August 2013
ISSN 2325-6184, Vol. 1, No. 12 134
This, combined with echo-top (ET) values between
10.7–12.2 km (35 000–40 000 ft) AGL, provided VIL
density values of 2.0 kg m-3
. VIL density is defined as
the quotient of VIL and ET.
b. Dallas, Texas (19 March 2006)
1) OVERVIEW
Widespread convection occurred during the day-
time of 19 March 2006 and produced catastrophic
flash flooding over the highly urbanized area of Dallas
County, Texas. A line of LEC convection developed
and trained across Dallas County between 1800–2200
UTC. Rain gauges in Dallas reported rainfall rates
exceeding 75 mm h1
(3 in h-1
) with 3-h totals of 150–
200 mm (6–8 in) being common. One fatality occurred
in downtown Dallas as a result of swift water
overtaking a vehicle that was crossing a flooded
roadway. Damage for this event was estimated at $2
million (NCDC 2006).
2) SOUNDING ANALYSIS
A 1200 UTC upper-air observation from Fort
Worth, Texas [FWD, 45 km (28 mi) to the west of the
flash flood], was unavailable because of equipment
failure. A RUC-2 model sounding at 1200 UTC over
Dallas was used instead for this analysis and suggests
the atmosphere was favorable for the development of
LEC convection (Fig. 4). The nearly saturated profile
resulted in a PW value near 35 mm (1.40 in; 250% of
normal). The WCD was large at 5.3 km (17 400 ft).
The CAPE from a parcel lifted at 900 hPa was 106
J kg-1
and had a narrow profile up to the EL at 490 hPa
(or 5.7 km), where the environmental temperature was
only –14°C. Shear within the WCD was larger than for
the other cases examined. Deep-layer shear values
were near 15 m s-1
(30 kt), but the wind profile lacked
significant directional turning. Since the column was
nearly saturated and radar-echo training was parallel to
the shear vector, the higher shear may not have been a
negating factor in the development of heavy rain and
high precipitation efficiency.
3) RADAR/SATELLITE ANALYSIS
This event presented challenges to the NWS
operational warning program as flash flooding and
severe convection with large hail occurred simulta-
neously within the same radar domain. The severe
convection developed in a more unstable air mass well
Figure 4. As in Fig. 1 except for 1200 UTC 19 March 2006 for the
LEC cell near Dallas, TX.
to the south and east of the area impacted by heavy
rain. Radar-based rainfall estimates obtained while
operating in the standard convective Z–R mode were
reliable in areas where normal continental (or HEC)
convection was occurring; however, rainfall estimates
were 3–4 times too low in locations where LEC
convection was occurring. Even after the radar Z–R
algorithm was switched to the Rosenfield tropical at
1900 UTC, rainfall estimation still ranged from 1.5–2
times below actual rain-gauge reports across Dallas
County through the end of the event.
The composite reflectivity is the maximum
reflectivity scanned by the radar in a vertical column
(Klazura and Imy 1993). Composite reflectivity at
2005 UTC (Fig. 5a) shows maximum values between
50–55 dBZ. A cross section along the training line of
convection over Dallas County at 2005 UTC confirms
the LEC characteristics this convection exhibited for
the duration of the flood event (Fig. 5b). Reflectivity
values were highest in the lower levels of the
convection, with most of the reflectivity that was >35
dBZ confined to below the –10°C level. During the
course of the event, the training line of convection
never displayed reflectivity values >57 dBZ. VIL
generally ranged between 10–20 kg m-2
, and only
twice exceeded 25 kg m-2
. ETs ranged between 10.7–
13.7 km (35 000–45 000 ft) AGL, with VIL density
extraordinarily low, generally 1.0–1.5 kg m-3
.
The LEC convection in this case produced several
hundred CG lightning strikes. The satellite presenta-
tion also was unlike the first case discussed in that a
large shield of very cold cloud tops (colder than
–75°C) developed and expanded during the peak of the

Vitale and Ryan NWA Journal of Operational Meteorology 9 August 2013
ISSN 2325-6184, Vol. 1, No. 12 135
Figure 5. As in Fig. 3 except for Dallas-Fort Worth, TX (KFWS)
at 2005 UTC 19 March 2006. The cross section runs southwest-to-
northeast.
excessive rainfall event (Fig. 6). The high ETs,
satellite presentation, and lightning activity are
indicative that the EL and maximum parcel level
gained significant altitude during the event. Although
numerous CG lightning strikes and cold cloud-top
temperatures seem to contradict the existence of an
LEC cell, the radar signature clearly showed LEC
characteristics. This demonstrates that satellite and CG
lightning signatures must be examined in context with
other data.
c. Union, Missouri (7 May 2000)
1) OVERVIEW
During the overnight hours of 7 May 2000, a
mesoscale convective system (MCS) developed over
east-central Missouri, just west of the St. Louis metro
area. The MCS initiation was due to a mesoscale
convective vortex that resulted from thunderstorm
development the previous night across Oklahoma. The
MCS initially developed around 0200 UTC and lasted
until about 1300 UTC. Union, Missouri, received a
storm-total rainfall of 350 mm (14 in) in 6 h from
0500–1100 UTC. This extreme amount of rainfall led
to $100 million in damage and two fatalities (NCDC
2000; Glass et al. 2001; Schumacher and Johnson
2008).
Figure 6. As in Fig. 2 except for 1900 UTC 19 March 2006 in
Texas. The location of the LEC storm and Dallas County are
outlined in white.
Figure 7. As in Fig. 1 except for 1800 UTC 6 May 2000 for the
LEC cell in eastern Missouri.

Vitale and Ryan NWA Journal of Operational Meteorology 9 August 2013
ISSN 2325-6184, Vol. 1, No. 12 136
2) SOUNDING ANALYSIS
A RUC-2 sounding at 1800 UTC 6 May 2000
(Fig. 7) was generated at the LEC storm location in
eastern Missouri. The CAPE derived from this
sounding was 300 J kg-1
. The EL was at 280 hPa while
the tropopause was at 200 hPa. The wind profile
indicated some veering with height in the positive
CAPE area (gray, Fig. 7). However, speed shear
within this layer was weak as winds ranged from 5–15
m s-1
(10–30 kt), with the strongest winds in the lowest
levels. The WCD in the model sounding was large and
approached 5.9 km (19 300 ft). The cloud-bearing
layer of the sounding was nearly saturated and the PW
was 38 mm (1.49 in; 145% of normal).
3) RADAR/SATELLITE ANALYSIS
An examination of a GOES-IR enhanced satellite
image at 1015 UTC 7 May 2000 (Fig. 8) shows cold
cloud tops associated with this event. Observed cloud-
top temperatures were between –75 and –80°C. The
strong cloud-top temperature gradient on the west-
central flank of the MCS was the point of regeneration
and location of the highest rainfall totals with this
MCS. Additionally, several CG strikes were reported
during the peak of the MCS. As with the Dallas case,
cold cloud tops and CG lightning strikes were
occurring even though there was a clear radar
signature of LEC convection.
Figure 8. As in Fig. 2 except for 1015 UTC 7 May 2000 in
northeastern Missouri. The location of the LEC storm is indicated
by the white arrow and circle.
The LEC storm was determined to be deepest
around 0635 UTC based on examination of radar cross
sections from St. Louis, Missouri (KLSX). Composite
reflectivity at 0635 UTC shows maximum values
between 55–60 dBZ (Fig. 9a). These reflectivity
values remained persistent for many hours during the
storm’s lifecycle. The corresponding cross section
(Fig. 9b) shows the 60-dBZ echo entirely below the
–10°C isotherm. Even though this storm was “bottom-
heavy,” reflectivity values up to 35 dBZ extended
through a deep layer of the atmosphere—reaching 12.0
km (40 000 ft) AGL. The WSR-88D underestimated
rainfall by about 20% using the standard Z–R
relationship. VIL generally ranged between 30–40 kg
m-2
. Corresponding ET values at the same time ranged
from 13.7–15.2 km (40 000–50 000 ft) AGL, resulting
in VIL density values around 2.0 kg m-3
.
Figure 9. As in Fig. 3 except for KLSX, at 0635 UTC 7 May 2000.
The cross section runs southwest-to-northeast.
Vitale and Ryan NWA Journal of Operational Meteorology 9 August 2013
ISSN 2325-6184, Vol. 1, No. 12 137
d. Lancaster, Texas (28–29 July 2004)
1) OVERVIEW
Scattered unorganized convection developed
during the late afternoon around 2100 UTC 28 July
2004 with isolated severe-wind and large-hail reports
associated with thunderstorms that briefly exhibited
supercellular structures. Convection continued to
develop into the evening, and the event began to
transition to a catastrophic flash-flood episode
beginning at 0200 UTC 29 July 2004. The excessive
rainfall rates reached their peak between 0400–0700
UTC and primarily affected the southern Dallas,
Texas, suburb of Lancaster, in south-central Dallas
County. Several rain gauges recorded over 205 mm (8
in) of rain in 2 h, with overnight rainfall totals in
excess of 310 mm (12 in). Almost $26 million in
damage was incurred, and over 120 high-water rescues
were performed. Tragically, three fatalities occurred
when vehicles were driven across flooded roadways
(NCDC 2004).
Figure 10. As in Fig. 1 except for the observed FWD sounding at
0000 UTC 29 July 2004 for the LEC cell near Lancaster, TX.
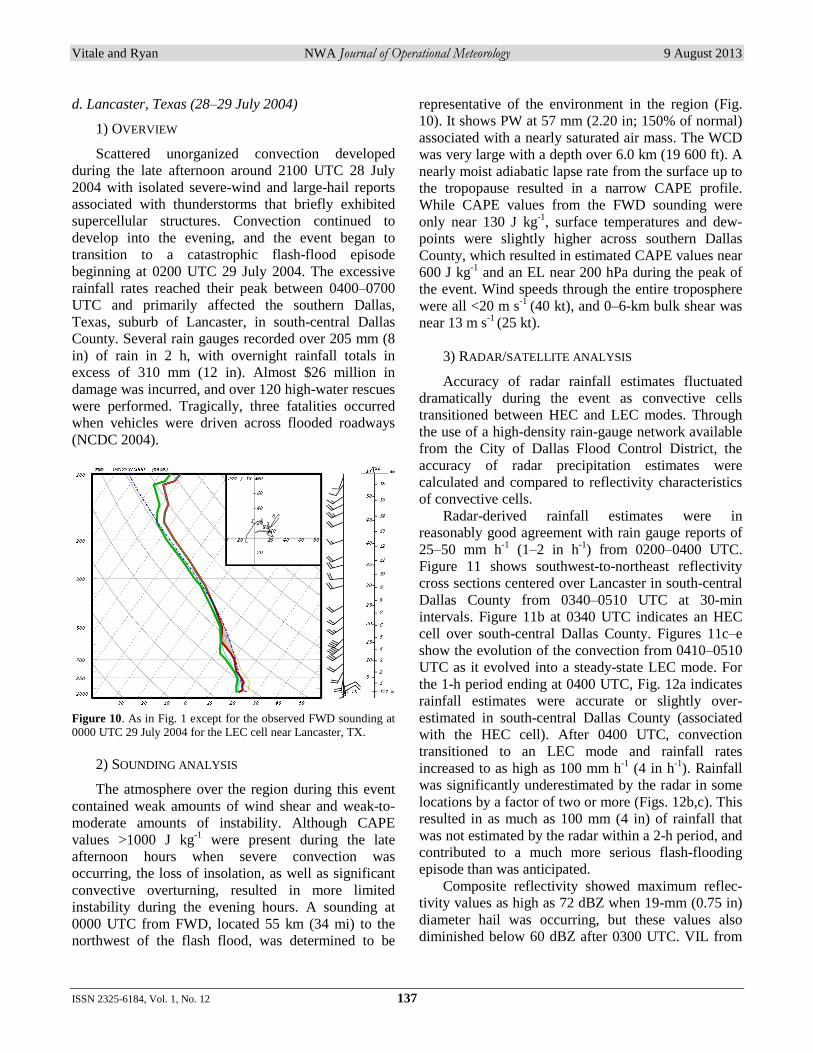
2) SOUNDING ANALYSIS
The atmosphere over the region during this event
contained weak amounts of wind shear and weak-to-
moderate amounts of instability. Although CAPE
values >1000 J kg-1
were present during the late
afternoon hours when severe convection was
occurring, the loss of insolation, as well as significant
convective overturning, resulted in more limited
instability during the evening hours. A sounding at
0000 UTC from FWD, located 55 km (34 mi) to the
northwest of the flash flood, was determined to be
representative of the environment in the region (Fig.
10). It shows PW at 57 mm (2.20 in; 150% of normal)
associated with a nearly saturated air mass. The WCD
was very large with a depth over 6.0 km (19 600 ft). A
nearly moist adiabatic lapse rate from the surface up to
the tropopause resulted in a narrow CAPE profile.
While CAPE values from the FWD sounding were
only near 130 J kg-1
, surface temperatures and dew-
points were slightly higher across southern Dallas
County, which resulted in estimated CAPE values near
600 J kg-1
and an EL near 200 hPa during the peak of
the event. Wind speeds through the entire troposphere
were all <20 m s-1
(40 kt), and 0–6-km bulk shear was
near 13 m s-1
(25 kt).
3) RADAR/SATELLITE ANALYSIS
Accuracy of radar rainfall estimates fluctuated
dramatically during the event as convective cells
transitioned between HEC and LEC modes. Through
the use of a high-density rain-gauge network available
from the City of Dallas Flood Control District, the
accuracy of radar precipitation estimates were
calculated and compared to reflectivity characteristics
of convective cells.
Radar-derived rainfall estimates were in
reasonably good agreement with rain gauge reports of
25–50 mm h-1
(1–2 in h-1
) from 0200–0400 UTC.
Figure 11 shows southwest-to-northeast reflectivity
cross sections centered over Lancaster in south-central
Dallas County from 0340–0510 UTC at 30-min
intervals. Figure 11b at 0340 UTC indicates an HEC
cell over south-central Dallas County. Figures 11c–e
show the evolution of the convection from 0410–0510
UTC as it evolved into a steady-state LEC mode. For
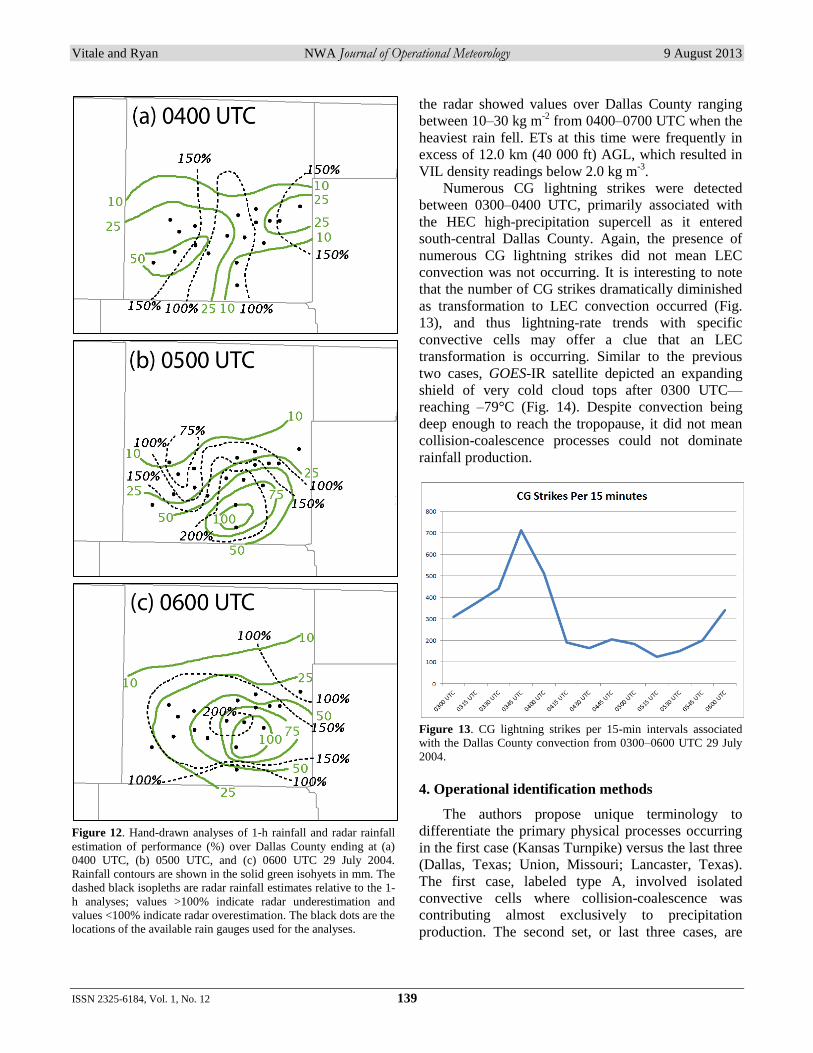
the 1-h period ending at 0400 UTC, Fig. 12a indicates
rainfall estimates were accurate or slightly over-
estimated in south-central Dallas County (associated
with the HEC cell). After 0400 UTC, convection
transitioned to an LEC mode and rainfall rates
increased to as high as 100 mm h-1
(4 in h-1
). Rainfall
was significantly underestimated by the radar in some
locations by a factor of two or more (Figs. 12b,c). This
resulted in as much as 100 mm (4 in) of rainfall that
was not estimated by the radar within a 2-h period, and
contributed to a much more serious flash-flooding
episode than was anticipated.
Composite reflectivity showed maximum reflec-
tivity values as high as 72 dBZ when 19-mm (0.75 in)
diameter hail was occurring, but these values also
diminished below 60 dBZ after 0300 UTC. VIL from

Vitale and Ryan NWA Journal of Operational Meteorology 9 August 2013
ISSN 2325-6184, Vol. 1, No. 12 138
Figure 11. (a) KFWS WSR-88D composite reflectivity at 0509 UTC 29 July 2004. The thick line through the LEC cell indicates
the orientation of the cross sections shown in 11b–e. KFWS reflectivity cross sections from southwest-to-northeast at (b) 0340
UTC, (c) 0410 UTC, (d) 0440 UTC, and (e) 0510 UTC. The thick horizontal white line indicates the –10°C isotherm.
Vitale and Ryan NWA Journal of Operational Meteorology 9 August 2013
ISSN 2325-6184, Vol. 1, No. 12 139
Figure 12. Hand-drawn analyses of 1-h rainfall and radar rainfall
estimation of performance (%) over Dallas County ending at (a)
0400 UTC, (b) 0500 UTC, and (c) 0600 UTC 29 July 2004.
Rainfall contours are shown in the solid green isohyets in mm. The
dashed black isopleths are radar rainfall estimates relative to the 1-
h analyses; values >100% indicate radar underestimation and
values <100% indicate radar overestimation. The black dots are the
locations of the available rain gauges used for the analyses.
the radar showed values over Dallas County ranging
between 10–30 kg m-2
from 0400–0700 UTC when the
heaviest rain fell. ETs at this time were frequently in
excess of 12.0 km (40 000 ft) AGL, which resulted in
VIL density readings below 2.0 kg m3
.
Numerous CG lightning strikes were detected
between 0300–0400 UTC, primarily associated with
the HEC high-precipitation supercell as it entered
south-central Dallas County. Again, the presence of
numerous CG lightning strikes did not mean LEC
convection was not occurring. It is interesting to note
that the number of CG strikes dramatically diminished
as transformation to LEC convection occurred (Fig.
13), and thus lightning-rate trends with specific
convective cells may offer a clue that an LEC
transformation is occurring. Similar to the previous
two cases, GOES-IR satellite depicted an expanding
shield of very cold cloud tops after 0300 UTC—
reaching –79°C (Fig. 14). Despite convection being
deep enough to reach the tropopause, it did not mean
collision-coalescence processes could not dominate
rainfall production.
Figure 13. CG lightning strikes per 15-min intervals associated
with the Dallas County convection from 0300–0600 UTC 29 July
2004.
4. Operational identification methods
The authors propose unique terminology to
differentiate the primary physical processes occurring
in the first case (Kansas Turnpike) versus the last three
(Dallas, Texas; Union, Missouri; Lancaster, Texas).
The first case, labeled type A, involved isolated
convective cells where collision-coalescence was
contributing almost exclusively to precipitation
production. The second set, or last three cases, are

Vitale and Ryan NWA Journal of Operational Meteorology 9 August 2013
ISSN 2325-6184, Vol. 1, No. 12 140
Figure 14. As in Fig. 2 except for 0615 UTC 29 July 2004 in TX.
The location of the LEC storm and Dallas County are outlined in
white.
referred to as type B events. Collision-coalescence
likely dominated the precipitation production, but
some elements of deep continental convection also
were occurring. Specifically, type B cases (i) did not
involve shallow convection, (ii) had stronger updraft
velocities, and (iii) were not devoid of quantities of ice
within the upper portions of convective cells. Despite
this, LEC convection was identified in type B cases.
Table 1 provides a brief comparison between the
meteorological characteristics of all four cases
examined. The values displayed in Table 1 show that
each of the cases shared similarities to tropical
environments. WSR-88D derived values indicate a
unique situation where the warm-rain process was the
dominant precipitation-production mechanism.
By expanding on the definition of LEC
convection, and recognizing the case of HEC
convection, we have created a detailed LEC storm
definition and a classification system that will allow
for better real-time recognition of type A and B events.
The real-time detection of both types of LEC
convection will allow operational forecasters to
improve on flash-flood warning decisions. A common
trait in all of the cases presented is that reflectivity
values >60 dBZ were not observed anywhere in the
cell, which is the most important addition to the
definition of an LEC. This suggests that the ice phase
was limited or confined to the upper portions of the
cells where it did not contribute or interfere with the
collision-coalescence precipitation process. The cell
should have increasing reflectivity as height decreases
and exhibit no tilt in the vertical structure. Reflectivity
Table 1. A comparison of meteorological characteristics between
type A and type B events (see section 4 for a discussion).
Event
Parameter
Type A Type B
Kansas Turnpike
Dallas, Texas
Union, Missouri
Lancaster, Texas
WCD (km) 6.4 5.3 5.9 6.0
CAPE (J kg-1) 316 106 580 600
PW (mm) (% of normal)
48 (120%)
35 (250%)
38 (145%)
57 (150%)
Max composite
reflectivity
(dBZ)
55 57 60 60
VIL (kg m-2) 25–30 10–20 30–40 10–30
ET (km) 10.7–12.2 10.7–13.7 13.7–15.2
13.7–15.2
VIL density
(kg m-3) 1.5–2.0 1.0–1.5 1.5–2.0 1.5–2.0
values <35 dBZ above the –10°C level appear to be
inconsequential to warm-cloud precipitation produc-
tion. In all cases the LEC was identified primarily
through the use of a radar cross section. Whereas the
cross section is an excellent tool in which to identify a
cell with an LEC, it is not feasible to perform cross
sections of all convective cells, particularly if a severe
weather episode is underway. Cross sections can be
utilized as a final test for any suspect LEC cells.
Several faster techniques can be utilized in an
operational setting for the detection of both types of
LEC storms; these may require algorithm development
and/or automation to be more practical in real-time.
Using the technique of comparing maximum VIL
versus maximum ET for LEC cells resulted in low
values of VIL density. All LEC convection in the
cases had VILs <40 kg m-2
and ETs >10.7 km (35 000
ft) AGL, and therefore VIL densities 2.0 kg m-3
. VIL
density was determined to be an excellent way to
eliminate HEC convective cells on a plan view. The 19
March 2006 case was an example where VIL density
was very low with LEC convection (sometimes <1.0
kg m-3
), while severe convection simultaneously had
very large values >4.0 kg m-3
. Even if HEC cells grow
to 18.3 km (60 000 ft) AGL and have a VIL greater
than 40 kg m-2
, they would have a VIL density higher
than the 2.0 kg m-3
threshold. Therefore, a VIL >40
kg m-2
would almost always be associated with HEC
convection.
LEC cells with excessive rain rates displayed a
steady-state maximum reflectivity between 45–55 dBZ
on the composite reflectivity owing to the fact that
updrafts are less intense in LEC cells than in HEC

Vitale and Ryan NWA Journal of Operational Meteorology 9 August 2013
ISSN 2325-6184, Vol. 1, No. 12 141
cells—thus the LEC cells lack significant ice-phase
hydrometeors. Forecasters should be alert for cells that
display a life cycle of maximum reflectivity values
within this range. It is a signal that the mean drop-size
diameter in the DSD may have reached its theoretical
collision-coalescence maximum centered at 2–3 mm
and rainfall may be severely underestimated by normal
convective Z–R relationships. However, cells
containing reflectivity >60 dBZ may have large areas
of reflectivity from 45–55 dBZ too, but the presence of
large-diameter hydrometeors suggests the DSD is
characterized by a small amount of large-diameter
hydrometeors not produced by collision-coalescence.
Using composite reflectivity to find indications of
reflectivity >60 dBZ within a cell over a large area or
for a long duration will allow the forecaster to discard
consideration of convection with too much ice infused
into the precipitation-production process.
If the maximum value of composite reflectivity is
identical to that of the base reflectivity, it suggests a
“bottom-heavy” structure with no tilted structure in the
vertical. In the cases examined, cells that had
reflectivity >60 dBZ produced high rainfall rates, but
those rates were adequately estimated by standard
convective Z–R relationships. It should be noted that
cells with maximum reflectivities <45 dBZ may be
indicative of warm-rain processes and convective Z–R
underestimation but are not likely to produce excessive
rainfall rates that would lead to flash flooding. In areas
with minimal beam blocking, identical-looking
composite reflectivity and base (or 0.5°) reflectivity
products also were an easy way to find LEC cells,
especially among several convective cells occurring
simultaneously. Table 2 provides a summary of these
radar-derived parameters.
CG lightning strikes can occur with LEC
convection, especially in the type B cases. Lightning
strikes should be few in number compared to any
surrounding HEC convection with a deep convective
signature. Because lightning discharges occurred, a
combination of graupel and strong updraft velocities
had been present in the upper portions of the LEC
cells. The presence of CG lightning strikes and cold
cloud tops does not necessarily rule out the presence of
LEC convection (i.e., where the collision-coalescence
process is dominating precipitation production).
5. Conclusion
Four excessive rainfall events in the south-central
United States were studied in order to identify
Table 2. LEC cell identification criterion.
Parameter Value
VIL (kg m-2) ≤40
ET (km AGL) ≥10.7
VIL density (kg m-3) ≤2.0
Reflectivity (dBZ) ≥45; ≤60
common traits and characteristics of LEC convective
events where collision-coalescence is the primary
precipitation-production mechanism. Several atmo-
spheric parameters must be favorable for this type of
precipitation process to organize. Yet, in many cases,
the real-time radar, satellite, and lightning data must
be analyzed for each cell to determine whether
collision-coalescence processes are dominating the
rainfall production. The case studies herein showed
that a cell’s updraft characteristics can change the
mechanism that produces the precipitation. Forecasters
must be able to quickly identify LEC convection with
real-time data sources in order to make accurate and
timely warning decisions.
A more detailed and rigorous LEC definition
(Table 2) has been put forth to make recognition of the
signature more robust for both the type A and the type
B cases. Additional limitations on maximum reflec-
tivity were added to the definition, and it was shown
that weak reflectivity values in sub-freezing parts of
the convection can be overlooked. VIL density, side-
by-side comparison of composite- and base-reflectivity
products, and reflectivity cross sections should be used
to more easily identify LEC storms in real-time. It is
hoped that this research will make recognition of
convection with LEC signatures easier, thereby
reducing the potential for unwarned flash-flood events.
The WSR-88D network has been upgraded to
utilize dual-polarization signals in order to improve the
accuracy of areal precipitation estimation. The most
significant improvement in areal rainfall estimation is
with heavy precipitation that is often mixed with hail
(Ryzhkov et al. 2005). In addition to several new
quantitative precipitation-estimation products, algo-
rithms utilizing dual-polarization radar data will make
a reasonable classification of hydrometeor type (Cifelli
et al. 2011). Of particular relevance to this research is
quantitative rainfall estimation that will use differ-
ential reflectivity to estimate the mean DSD. Although
algorithms using dual-polarization radar data should
outperform the older generation of algorithms, there
are still major limitations in radar sampling that will
produce errors, especially at distances beyond 100 km

Vitale and Ryan NWA Journal of Operational Meteorology 9 August 2013
ISSN 2325-6184, Vol. 1, No. 12 142
from the radar site. Spreading of the radar beam and a
lack of radar sampling in the lowest portions of LEC
convective cells still will result in significant rainfall
underestimation. Thus, it is imperative that a forecaster
recognize the atmospheric potential for, and make a
manual classification of, LEC convection for adequate
warning decisions. It is not known whether these rare
but extreme precipitation events will be captured
adequately by dual-polarization WSR-88Ds until
operational verification and subsequent research of
these events can be performed.
Acknowledgements. The authors thank Dr. Charles
Graves of Saint Louis University (Department of Earth and
Atmospheric Sciences) for providing additional images. We
also thank Steve Cobb (Science and Operations Officer) of
the NWS Forecast Office in Lubbock, Texas; Greg Patrick
(Science and Operations Officer) of the NWS Forecast
Office in Fort Worth, Texas; and Dr. Eric Bruning of the
Texas Tech University Geosciences Department for their
technical edits and suggestions.
REFERENCES
Baeck, M. L., and J. A. Smith, 1998: Rainfall estimation by
the WSR-88D for heavy rainfall events. Wea.
Forecasting, 13, 416–436.
Battan. J. J., and R. R. Braham, 1956: A study of convective
precipitation based on cloud and radar observations. J.
Meteor., 13, 587–591.
Benjamin, S. G., J. M. Brown, K. J. Brundage, B. E.
Schwartz, T. G. Smirnova, and T. L. Smith, 1998: The
operational RUC-2. Preprints, 16th Conf. on Weather
Analysis and Forecasting, Phoenix, AZ, Amer. Meteor.
Soc., 249–252.
Brandes, E. A., G. Zhang, and J. Sun, 2006: On the
influence of assumed drop size distribution form on
radar-retrieved thunderstorm microphysics. J. Appl.
Meteor. Climatol., 45, 259–268.
Bringi, V. N., V. Chandrasekar, J. Hubbert, E. Gorgucci, W.
L. Randeu, and M. Schoenhuber, 2003: Raindrop size
distribution in different climatic regimes from
disdrometer and dual-polarized radar analysis. J. Atmos.
Sci., 60, 354–365.
Bruning, E. C., W. D. Rust, T. J. Schuur, D. R.
MacGorman, P. R. Krehbiel, and W. Rison, 2007:
Electrical and polarimetric radar observations of a
multicell storm in TELEX. Mon. Wea. Rev., 135, 2525–
2544.
Caracena, F., R. A. Maddox, L. R. Hoxit, and C. F.
Chappell, 1979: Mesoanalysis of the Big Thompson
storm. Mon. Wea. Rev., 107, 1–17.
Cifelli, R, V. Chandrasekar, S. Lim, P. C. Kennedy, Y.
Wang, and S. A. Rutledge, 2011: A new dual-
polarization radar rainfall algorithm: Application in
Colorado precipitation events. J. Atmos. Oceanic
Technol., 28, 352–364.
Davis, R. S., 2001: Flash flood forecast and detection
methods. Severe Convective Storms, Meteor. Monogr.,
No. 50, Amer. Meteor. Soc., 481–525.
____, 2004: The impact of tropical rainfall rates on flash
flood detection. Preprints, 22nd Conf. on Severe Local
Storms, Hyannis, MA, Amer. Meteor. Soc., 11B.5.
[Available online at ams.confex.com/ams/pdfpapers/
81521.pdf.]
Doswell, C. A., III, H. E. Brooks, and R. A. Maddox, 1996:
Flash flood forecasting: An ingredients based
methodology. Wea. Forecasting, 11, 560–581.
Doviak, R. J. and D. S. Zrnić, 1993: Doppler Radar and
Weather Observations. Dover Publications, 562 pp.
Glass, F. H., J. P. Gagan, and J. T. Moore, 2001: The
extreme east-central Missouri flash flood of 6–7 May
2000. Preprints, Precipitation Extremes: Prediction,
Impacts, and Responses, Albuquerque, NM, Amer.
Meteor. Soc., P2.22. [Available online at
www.crh.noaa.gov/lsx/?n=franklin_county_flash_flood.]
Kelsch, M., 1998: The Fort Collins flash flood: Exceptional
rainfall and urban runoff. Preprints, 19th Conf. on
Severe Local Storms, Minneapolis, MN, Amer. Meteor.
Soc., 404–407.
Klazura, G. E., and D. A. Imy, 1993: A description of the
initial set of analysis products available from the
NEXRAD WSR-88D system. Bull. Amer. Meteor. Soc.,
74, 1293–1311.
Lamb, D., 2001: Rain production in convective storms.
Severe Convective Storms, Meteor. Monogr., No. 50,
Amer. Meteor. Soc., 299–321.
Löffler-Mang, M., and J. Joss, 2000: An optical disdrometer
for measuring size and velocity of hydrometeors. J.
Atmos. Oceanic Technol., 17, 130–139.
Lucas, C., E. J. Zipser, and M. A. LeMone, 1994: Vertical
velocity in oceanic convection off tropical Australia. J.
Atmos. Sci., 51, 3183–3193.
Marshall, J. S., and W. Mc. K. Palmer, 1948: The
distribution of raindrops with size. J. Meteor., 5, 165–
166.
NCDC, 2000: Storm Data. 2000 Annual Summaries,
National Climatic Data Center, Asheville, NC, 36 pp.
[Available online at www.ncdc.noaa.gov/IPS/sd/sd.html.]
____, 2003: Storm Data. 2003 Annual Summaries, National
Climatic Data Center, Asheville, NC, 34 pp. [Available
online at www.ncdc.noaa.gov/IPS/sd/sd.html.]
____, 2004: Storm Data. 2004 Annual Summaries, National
Climatic Data Center, Asheville, NC, 36 pp. [Available
online at www.ncdc.noaa.gov/IPS/sd/sd.html.]
____, 2006: Storm Data. 2006 Annual Summaries, National
Climatic Data Center, Asheville, NC, 36 pp. [Available
online at www.ncdc.noaa.gov/IPS/sd/sd.html.]
Vitale and Ryan NWA Journal of Operational Meteorology 9 August 2013
ISSN 2325-6184, Vol. 1, No. 12 143
NOAA, cited 2010: Natural Hazard Statistics. National
Weather Service, Silver Spring, MD [Available online
at www.nws.noaa.gov/om/hazstats.shtml].
____, cited 2011: GPRA Metrics Status Report. [Available
online at verification.nws.noaa.gov/services/gpra/index.
aspx].
Petersen, W. A., and Coauthors, 1999: Mesoscale and radar
observations of the Fort Collins flash flood of 28 July
1997. Bull. Amer. Meteor. Soc., 80, 191–216.
Polger, P. D., B. S. Goldsmith, R. C. Przywarty, and J. R.
Bocchieri, 1994: National Weather Service warning
performance based on the WSR-88D. Bull. Amer.
Meteor. Soc., 75, 203–214.
Rosenfield, D., D. B. Wolff, and D. Atlas, 1993: General
probability-matched relations between radar reflectivity
and rain rate. J. Appl. Meteor., 32, 50–72.
Ryzhkov, A. V., S. E. Giangrande, and T. J. Schuur, 2005:
Rainfall estimation with a polarimetric prototype of
WSR-88D. J. Appl. Meteor., 44, 502–515.
Schoenberg Ferrier, B., J. Simpson, and W.-K. Tao, 1996:
Factors responsible for precipitation efficiencies in
midlatitude and tropical squall simulations. Mon. Wea.
Rev., 124, 2100–2125.
Schumacher, R. S., and R. H. Johnson, 2008: Mesoscale
processes contributing to extreme rainfall in a
midlatitude warm-season flash flood. Mon. Wea. Rev.,
136, 3964–3986.
Smith, J. A., M. L. Baeck, M. Steiner, and A. J. Miller,
1996: Catastrophic rainfall from an upslope
thunderstorm in the central Appalachians: The Rapidan
storm of June 27, 1995. Water Resour. Res., 32, 3099–
3113.
Squires, P., 1956: The microstructure of cumuli in maritime
and continental air. Tellus, 8, 443–444.
Srivastava, R. C., 1971: Size distribution of raindrops
generated by their breakup and coalescence. J. Atmos.
Sci., 28, 410–415.
Ulbrich, C. W., and D. Atlas, 2008: Radar measurement of
rainfall with and without polarimetry. J. Appl. Meteor.
Climatol., 47, 1929–1939.
Vitale, J. D., J. T. Moore, C. E. Graves, and M. Kelsch,
2009: Hydrometeorological aspects of the Kansas
Turnpike flash flood of 30-31 August 2003. Natl. Wea.
Dig., 33, 203–218.
Wallace, J. M., and P. V. Hobbs, 1977: Atmospheric
Science: An Introductory Survey. Academic Press, 467
pp.
WDTB, cited 2011: Introduction to the Top-Down
Methodology, Topic 6, Lesson 1, AWOC Winter
Weather Track. Warning Decision Training Branch,
Norman, OK. [Available online at www.wdtb.noaa.gov
/courses/winterawoc/IC6/lesson1/player.html.]
____, cited 2012: Distance Learning Operations Course,
Topic 5: Base and Derived Products. Warning Decision
Training Branch, Norman, OK, 358 pp. [Available
online at wdtb.noaa.gov/courses/dloc/outline.html.]
Wilson, J. W., and E. A. Brandes, 1979: Radar measurement
of rainfall—A summary. Bull. Amer. Meteor. Soc., 60,
1048–1058.
Yuter, S. E., and R. A. Houze Jr., 1997: Measurements of
raindrop size distributions over the Pacific warm pool
and implications for Z–R relations. J. Appl. Meteor., 36,
847–867.
Zipser, E. J., and M. A. LeMone. 1980. Cumulonimbus
vertical velocity events in GATE. Part II: Synthesis and
model core structure. J. Atmos. Sci., 37, 2458–2469.
____, and K. R. Lutz, 1994: The vertical profile of radar
reflectivity of convective cells: A strong indicator of
storm intensity and lightning probability? Mon. Wea.
Rev., 122, 1751–1759.


![Precipitation outlook for South India [Autumn and Winter of 2013 2014]](https://static.fdocuments.in/doc/165x107/61fc819e8d33c02b785df812/precipitation-outlook-for-south-india-autumn-and-winter-of-2013-2014.jpg)