Operational problems in banks – Effects on the settlement ... · Interbank payments are settled...
12
30 NORGES BANK penger og kreditt 3/2011 (årg. 39) 30–41 1. Introduction 1 Norges Bank is the central bank and the ultimate settle- ment bank in Norway. Interbank payments are settled in Norges Bank’s settlement system (NBO), a real time gross settlement (RTGS) system. Such payments are often time-critical and of high value. Operational disruptions that impair the ability of participants to execute payments may therefore pose a threat to financial stability. In this article, we want to quantify the potential effects of such disruptions. In the past 10 years, the development of computational tools for simulating key functions of payment systems has made it easier to quantitatively assess the robustness of these systems. A number of recent international studies have employed simulation tools to measure the effects of operational failures (see Manning et al. (2009) for an overview). However, owing to differences in payment patterns, liquidity level and infrastructure design across countries, the vulnerability of the Norwegian system cannot be assessed simply by employing results from studies in other countries. The ability of a payment system to withstand an interruption is not only dependent on the amount of liquidity in the system as a whole, but also on the distribution of liquidity among banks. In addition, because of market-specific calendar effects, operational problems on certain days during the year will have greater consequences than on days with normal transaction flows. 1 The views expressed in this article are those of the authors and do not necessarily represent the views of Norges Bank. We would like to thank Farooq Akram, Bjørn Bakke, Nathalie Berner, Steinar Guribye, Knut Sandal, Terje Sletbak and Helge Syrstad for their valuable comments. Operational problems in banks – Effects on the settlement of payments in Norges Bank Tor Oddvar Berge, adviser, and Casper Christophersen, senior economist, both at Norges Bank Financial Stability 1 We analyse the robustness of the settlement process in the Norges Bank settlement system (NBO) to operational problems in one of its participating banks. The analysis is based on a large number of simulations using actual payments data. We find that of the 21 banks directly participating in NBO, only four are of systemic importance in the sense that their inability to send payments would have a significant effect on the other banks in the system. Moreover, the level of such sys- temic risk varies substantially, depending on the liquidity available to individual banks and on overall activity in the system. On most days, the systemic effects would be limited due to benign liquidity conditions in the system. Furthermore, we find that the systemic effects can be signifi- cantly reduced if banks react quickly by postponing their outgoing payments to the stricken bank. In this article, we use Norwegian payments data to simulate operational problems in each of the 21 banks that are active in the daily payment settlements in Norges Bank. By simulating the settlement of actual payment flows in the Norwegian RTGS system, we are able to quantitatively assess the systemic effects should opera- tional problems render a bank unable to execute outgoing payments over a prolonged period of time. The rest of this article is organised as follows: Section 2 discusses operational risk and relates it to the key fea- tures of the Norwegian system for interbank payments. Section 3 presents the data and explains the simulation methodology employed in this article. The results of the simulations are presented in Sections 4 to 6. In Section 4, we describe the direct effects of an operational problem in one of the participating banks. As such direct effects do not take into consideration the potential chain reac- tions of problems for other banks, a system-wide per- spective is taken in Section 5 with an analysis of the full systemic effects following an operational problem in one bank. This analysis is complemented in Section 6 and 7, first by the introduction of a reaction pattern for other banks and then with a discussion of the effects on the net settlements. The article’s conclusions are presented in Section 8. 2. Operational risk and the Norwegian interbank system The literature on risks in payment systems has traditio- nally focused on credit and liquidity risk, cf. Manning et al. (2009). As most modern central banks have put in place measures to limit such risks (e.g. by the introduction of RTGS systems to limit credit risk, or throughput rules
Transcript of Operational problems in banks – Effects on the settlement ... · Interbank payments are settled...

30 NORGES BANK penger og kreditt 3/2011 (årg. 39) 30–41
1. Introduction1
Norges Bank is the central bank and the ultimate settle-ment bank in Norway. Interbank payments are settled in Norges Bank’s settlement system (NBO), a real time gross settlement (RTGS) system. Such payments are often time-critical and of high value. Operational disruptions that impair the ability of participants to execute payments may therefore pose a threat to financial stability. In this article, we want to quantify the potential effects of such disruptions.
In the past 10 years, the development of computational tools for simulating key functions of payment systems has made it easier to quantitatively assess the robustness of these systems. A number of recent international studies have employed simulation tools to measure the effects of operational failures (see Manning et al. (2009) for an overview). However, owing to differences in payment patterns, liquidity level and infrastructure design across countries, the vulnerability of the Norwegian system cannot be assessed simply by employing results from studies in other countries. The ability of a payment system to withstand an interruption is not only dependent on the amount of liquidity in the system as a whole, but also on the distribution of liquidity among banks. In addition, because of market-specific calendar effects, operational problems on certain days during the year will have greater consequences than on days with normal transaction flows.
1 The views expressed in this article are those of the authors and do not necessarily represent the views of Norges Bank. We would like to thank Farooq Akram, Bjørn Bakke, Nathalie Berner, Steinar Guribye, Knut Sandal, Terje Sletbak and Helge Syrstad for their valuable comments.
Operational problems in banks – Effects on the settlement of payments in Norges Bank
Tor Oddvar Berge, adviser, and Casper Christophersen, senior economist, both at Norges Bank Financial Stability1
We analyse the robustness of the settlement process in the Norges Bank settlement system (NBO) to operational problems in one of its participating banks. The analysis is based on a large number of simulations using actual payments data. We find that of the 21 banks directly participating in NBO, only four are of systemic importance in the sense that their inability to send payments would have a significant effect on the other banks in the system. Moreover, the level of such sys-temic risk varies substantially, depending on the liquidity available to individual banks and on overall activity in the system. On most days, the systemic effects would be limited due to benign liquidity conditions in the system. Furthermore, we find that the systemic effects can be signifi-cantly reduced if banks react quickly by postponing their outgoing payments to the stricken bank.
In this article, we use Norwegian payments data to simulate operational problems in each of the 21 banks that are active in the daily payment settlements in Norges Bank. By simulating the settlement of actual payment flows in the Norwegian RTGS system, we are able to quantitatively assess the systemic effects should opera-tional problems render a bank unable to execute outgoing payments over a prolonged period of time.
The rest of this article is organised as follows: Section 2 discusses operational risk and relates it to the key fea-tures of the Norwegian system for interbank payments. Section 3 presents the data and explains the simulation methodology employed in this article. The results of the simulations are presented in Sections 4 to 6. In Section 4, we describe the direct effects of an operational problem in one of the participating banks. As such direct effects do not take into consideration the potential chain reac-tions of problems for other banks, a system-wide per-spective is taken in Section 5 with an analysis of the full systemic effects following an operational problem in one bank. This analysis is complemented in Section 6 and 7, first by the introduction of a reaction pattern for other banks and then with a discussion of the effects on the net settlements. The article’s conclusions are presented in Section 8.
2. Operational risk and the Norwegian interbank system
The literature on risks in payment systems has traditio-nally focused on credit and liquidity risk, cf. Manning et al. (2009). As most modern central banks have put in place measures to limit such risks (e.g. by the introduction of RTGS systems to limit credit risk, or throughput rules

NORGES BANK penger og kreditt 3/201131
to limit liquidity risk), focus has also moved to operatio-nal risk. Operational risk is the risk of loss resulting from failed internal systems, from human error or from exter-nal events such as deliberate attacks or natural disasters. As large-value payment systems allow financial institu-tions to settle obligations stemming from financial market transactions, any disruption to normal payment settlement processing could constitute a threat to financial stability; cf. Bedford et al. (2004).
Norges Bank provides an RTGS system for the settle-ment of interbank payments.2 In this system, large value payments between banks and specially marked transac-tions are settled individually (this is referred to as gross settlement). Small value payments, such as consumer payments, are first collected and netted in an auxiliary system (NICS – Norwegian Interbank Clearing System) before being sent to Norges Bank for settlement. Pay-ments for trades in shares, certificates, bonds and deri-vatives are also handled in auxiliary systems dedicated to such transactions (VPS – The Norwegian Central Securities Depository and Oslo Clearing) before the net positions are sent to Norges Bank for settlement.
Potential disruptions to the normal settlement processes may stem from operational problems in the RTGS system itself, in any of the auxiliary systems, or among one or several of the individual participants. This article follows the literature on simulations of participant-level opera-tional outages which render a bank unable to send pay-ments. Such outages may be due to IT failures, adminis-trative errors (a shortage of trained staff), lack of contin-gency measures, or external factors such as power or telecommunication failures, including disruptions stem-ming from natural disasters or from deliberate attacks.
As liquidity conditions in RTGS systems are often benign, it is generally considered unlikely that an opera-tional problem in a participating bank will lead to liqui-dity constraints for other banks, see e.g. Bedford et al. (2004), Schmitz et al. (2006) and Ledrut (2007) for the case in the UK, Austria and Holland respectively. However, in the case of the Swiss RTGS system, Glaser and Haene (2008) find that the effects can be large in systems with a high degree of concentration, such as in Norway. Lublóy and Tanay (2007) find that this may be the case even in liquidity-rich environments. Although the likelihood of operational disruptions remains small, it is difficult a priori to predict the adverse effects such a disruption may have. In this article, we therefore inves-tigate the robustness of the daily settlements in Norges Bank to operational problems in each of the banks that are active in the system on a daily basis.
2 For a more detailed description of the RTGS system and the auxiliary systems mentioned here, see Norges Bank (2010a).
3. Data and simulation methodology
3.1 Data
We have extracted a record of all transactions settled in Norges Bank’s RTGS system between 4 January 2010 and 31 December 2010, 252 settlement days and 289 999 transactions in total.3 Our dataset contains all gross transactions between banks and between banks and Norges Bank which were settled directly in Norges Bank. In the case of transactions which were settled on a net basis, we only consider the final net amounts transferred across bank’s accounts in Norges Bank. Chart 1 shows that the daily value of all gross transactions was generally between NOK 100 and 200 billion, with an average daily value of NOK 175 billion. However, on several days in 2010, the value was much larger, reaching more than NOK 500 billion on five occasions.4
The Norwegian interbank system is tiered in the sense that most large banks (21 banks) settle their net positions and gross payments directly at Norges Bank. Most small banks, however, participate via a private settlement bank.5 Banks that use a private settlement bank may also settle payments directly through Norges Bank, but the volumes
3 We deleted 3 transactions which were erroneously registered in the system, 11 transactions where sender and receiver was the same bank and 51 transactions which were settled outside normal operating hours. As a result, we base our analysis on 289 943 transactions.
4 A new procedure for the settlement of payments to and from the government was introduced in November 2011. This will reduce the number and the value of payments settled on the accounts of private banks and thus lower the effects seen on the rollover dates after November 2011.
5 There are two private settlement banks among the 21 banks in our sample. An operational problem in one of these two would have additional adverse effects as they would also affect the banks for which they act as settlement bank. An analysis of such effects, however, is outside the scope of this article due to lack of data on the payments processed within the private settlement banks.
Chart 1 Value of transactions settled between banks in nBo. 4 January 2010 – 31 december 2010. in billions of nok
0
200
400
600
800
Jan. 2010 Apr. 2010 Jul. 2010 Oct. 2010 Jan. 2011
NORGES BANK penger og kreditt 3/201132
of such payments are low. The daily turnover in NBO shown in Chart 1 is almost exclusively driven by the 21 large banks which constitute the focus of this article.
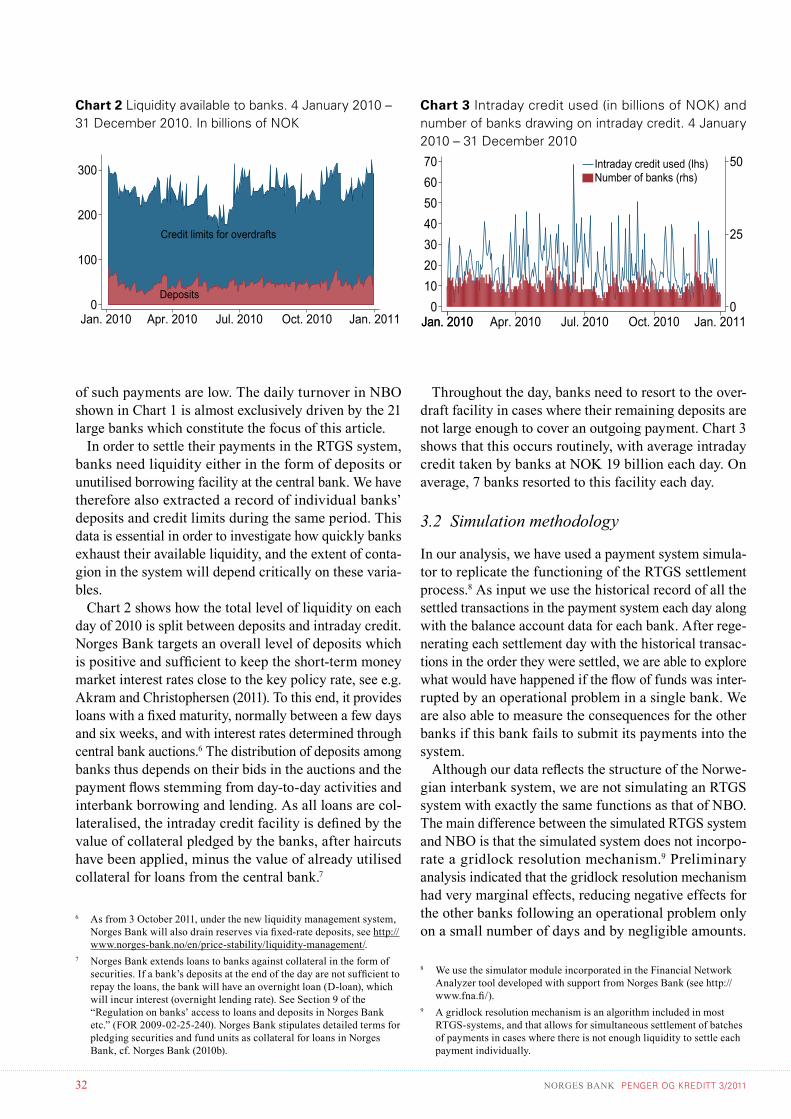
In order to settle their payments in the RTGS system, banks need liquidity either in the form of deposits or unutilised borrowing facility at the central bank. We have therefore also extracted a record of individual banks’ deposits and credit limits during the same period. This data is essential in order to investigate how quickly banks exhaust their available liquidity, and the extent of conta-gion in the system will depend critically on these varia-bles.
Chart 2 shows how the total level of liquidity on each day of 2010 is split between deposits and intraday credit. Norges Bank targets an overall level of deposits which is positive and sufficient to keep the short-term money market interest rates close to the key policy rate, see e.g. Akram and Christophersen (2011). To this end, it provides loans with a fixed maturity, normally between a few days and six weeks, and with interest rates determined through central bank auctions.6 The distribution of deposits among banks thus depends on their bids in the auctions and the payment flows stemming from day-to-day activities and interbank borrowing and lending. As all loans are col-lateralised, the intraday credit facility is defined by the value of collateral pledged by the banks, after haircuts have been applied, minus the value of already utilised collateral for loans from the central bank.7
6 As from 3 October 2011, under the new liquidity management system, Norges Bank will also drain reserves via fixed-rate deposits, see http://www.norges-bank.no/en/price-stability/liquidity-management/.
7 Norges Bank extends loans to banks against collateral in the form of securities. If a bank’s deposits at the end of the day are not sufficient to repay the loans, the bank will have an overnight loan (D-loan), which will incur interest (overnight lending rate). See Section 9 of the “Regulation on banks’ access to loans and deposits in Norges Bank etc.” (FOR 2009-02-25-240). Norges Bank stipulates detailed terms for pledging securities and fund units as collateral for loans in Norges Bank, cf. Norges Bank (2010b).
Throughout the day, banks need to resort to the over-draft facility in cases where their remaining deposits are not large enough to cover an outgoing payment. Chart 3 shows that this occurs routinely, with average intraday credit taken by banks at NOK 19 billion each day. On average, 7 banks resorted to this facility each day.
3.2 Simulation methodology
In our analysis, we have used a payment system simula-tor to replicate the functioning of the RTGS settlement process.8 As input we use the historical record of all the settled transactions in the payment system each day along with the balance account data for each bank. After rege-nerating each settlement day with the historical transac-tions in the order they were settled, we are able to explore what would have happened if the flow of funds was inter-rupted by an operational problem in a single bank. We are also able to measure the consequences for the other banks if this bank fails to submit its payments into the system.
Although our data reflects the structure of the Norwe-gian interbank system, we are not simulating an RTGS system with exactly the same functions as that of NBO. The main difference between the simulated RTGS system and NBO is that the simulated system does not incorpo-rate a gridlock resolution mechanism.9 Preliminary analysis indicated that the gridlock resolution mechanism had very marginal effects, reducing negative effects for the other banks following an operational problem only on a small number of days and by negligible amounts.
8 We use the simulator module incorporated in the Financial Network Analyzer tool developed with support from Norges Bank (see http://www.fna.fi/).
9 A gridlock resolution mechanism is an algorithm included in most RTGS-systems, and that allows for simultaneous settlement of batches of payments in cases where there is not enough liquidity to settle each payment individually.
Chart 2 Liquidity available to banks. 4 January 2010 – 31 december 2010. in billions of nok
Credit limits for overdrafts
Deposits0
100
200
300
Jan. 2010 Apr. 2010 Jul. 2010 Oct. 2010 Jan. 20110
25
50
010203040506070
Jan. 2010Jan. 2010 Jan. 2011Apr. 2010 Jul. 2010 Oct. 2010
Intraday credit used (lhs)Number of banks (rhs)
Chart 3 intraday credit used (in billions of nok) and number of banks drawing on intraday credit. 4 January 2010 – 31 december 2010
NORGES BANK penger og kreditt 3/201133
Since gridlock resolution mechanisms may be implemen-ted in a number of ways, our results are easier to interpret as they relate to a generic RTGS system which would be very similar to the basic structure of the RTGS system used by most central banks.
We define an operational problem as a technical problem within a single bank that renders the bank unable to submit payments to other banks in the system. The immediate effect on the settlement process will be that the other banks will not receive payments when expected from the bank experiencing the operational problem. In the first part of our analysis, we assume that the banks unaffected by the problem will still submit all their out-going payments including those to the bank with the operational problem. As the bank with an operational problem will still receive payments while the problem is ongoing, liquidity will accumulate on the problem bank’s account. The bank with the operational problem will then become a “liquidity sink”, and the liquidity left in the system for other banks will gradually be reduced.
The longer it takes to solve the operational problem and for the bank to resume normal operations, the more liquidity will be absorbed by the problem bank due to incoming payments. The other banks’ liquidity position may be threatened, and in some cases they may not be able to fulfil their obligations due to postponed incoming payments. The consequence will be an increased risk that other banks will not be able to meet their obligations, i.e. causing systemic effects jeopardising the stability of the payment system.
If the operational problem is solved at some point before the end of the settlement day, we assume that the bank submits all its outstanding payments into the system immediately and that all other queued payments will then be settled after liquidity has been redistributed from the stricken bank. However, if the operational problem lasts until the end of the settlement day, both the non-submit-ted payments from the bank with the operational problem and other payments lacking funding will remain unsett-led that day. Since we calculate settlement statistics for each day individually, we do not transfer these non-settled payments to the next settlement day. The implicit assumption is that they will be settled some time before opening on the next settlement day.
Simulations of operational problems in banks partici-pating in NBO are executed for all 21 banks that settle both their net positions and gross payments directly at Norges Bank. For each settlement day we execute appro-ximately 1600 simulations. Each simulation defines an individual bank that experiences an operational problem, the starting-time of the problem and the duration of the problem. The first simulation for a specific day for a specific bank is carried out by setting the starting-time
of the problem at the starting-time of the settlement system, i.e. at 05:29, and then assuming that the problem is resolved after 1 hour. The second simulation assumes that the problem also starts at 05:29, but lasts for 2 hours, the third simulation starts at 05:29 and lasts for 3 hours, etc. until the problem lasts until the end of the settlement day. Normally, NBO closes at 16:35, which means that a problem that lasts the whole settlement day lasts for 11 hours and 6 minutes. After reaching the end of the day, we follow the same patterns as above, but assume that the operational problem starts 1 hour later, at 06:29.
By simulating the payment process for all settlement days in 2010 and varying the starting-times and duration of an operational problem, we are able to draw conclu-sions on how critical an operational failure would be, dependent on i) which bank experiences operational problems, ii) what time it happens, and iii) how long the problem lasts before it is resolved. It should, however, be noted that the impact of an operational outage would also depend on possible contingency arrangements. In cases where back-up facilities are available, banks experiencing operational problems would still be able to send their most important (or largest) payments, thereby reducing the liquidity-sink effects. The analysis in this article assumes that no such contingency measures are in place. The results therefore have to be viewed as worst-case scenarios.
4. Direct effects of an operational problem
The direct effects of an operational problem preventing banks from submitting payments are those that can be immediately traced to the bank with the operational problem, and that could also to a certain extent be calcula-ted by studying the flow of payments to and from that bank.
4.1 Number and value of payments not submitted
Charts 4 and 5 show the total number and value of the payments that were supposed to be submitted to other participants in the payment system for all 21 banks in the analysis. The charts have three sections depending on how long the operational problem lasts (1 hour, 5 hours or 11 hours and 6 minutes). The bars have two parts. The red part reflects average value for all settlement days in 2010 and the blue shows the maximum values found in our sample.
Chart 4 shows that if an operational problem in a bank lasts from the start of the settlement day until the end of the day the average number of not-submitted payments is nearly 300 for the bank with the highest number of

NORGES BANK penger og kreditt 3/201134
not-submitted payments. However, the maximum number for the same bank for a single day is much higher, appro-ximately 700. This compares rather dramatically with an average daily turnover in NBO of approximately 1150 transactions. However, if the operational problem lasts for only 1 hour, the average number of not submitted payments will be less than 50, while the maximum will be over 400 payments.
The same pattern is also evident for the value of the transactions not sent, as shown in Chart 5. With a problem that lasts the whole day, transactions with a value of NOK 50 billion would, on average, not be sent by the bank with the highest value of outgoing payments. However, in a worst case scenario, this value would be almost five times higher, close to NOK 250 billion.
These measures, especially the maximum value of not submitted payments, are heavily influenced by the roll-overs in the so-called “swap arrangement” introduced as a response to the financial crisis in 2008.10 There are four rollover dates in our sample and the values of these rollover payments are extremely high. For example, the maximum value of payments directly affected by an operational problem that lasts the whole settlement day is nearly NOK 250 billion for one of the banks in the sample. This observation stems from a rollover date. The maximum value excluding those days would be appro-ximately NOK 125 billion, while the average value of not submitted payments would have been around NOK 50 billion. Thus, an operational problem could impact the system in a wide variety of ways, and there is a substan-tial difference between a worst case scenario on a market-specific date and a scenario on an average day.
10 As part of the contingency measures introduced during the financial crisis in 2008, the Norwegian parliament provided an arrangement whereby banks could exchange covered bonds for government securities for an agreed period of time, cf. Norges Bank (2008). See also http://www.norges-bank.no/en/price-stability/swap-arrangement/
Chart 4 number of payments directly affected by an operational problem. operational problem that lasts for 1 hour, 5 hours and the whole day. Banks sorted by number of payments not submitted
0
200
400
600
800
01:00:00 05:00:00 11:06:001 . . . . . . . . . 21 1 . . . . . . . . . 21 1 . . . . . . . . . 21
Maximum numberAverage number
Chart 5 Value of payments directly affected by an ope-rational problem. operational problem that lasts for 1 hour, 5 hours and the whole day. Banks sorted by value of payments not submitted. in billions of nok
0
50
100
150
200
250
01:00:00 05:00:00 11:06:001 . . . . . . . . . 21 1 . . . . . . . . . 21 1 . . . . . . . . . 21
Maximum valuesAverage values
4.2 Liquidity absorption in the bank with an operational problem
Another direct effect of an operational problem is that liquidity will accumulate on the problem bank’s account at the central bank. Here we measure the relative liquidity sink, i.e. the stricken bank’s accumulated liquidity during the time of the operational problem relative to the total liquidity in the system at the beginning of the settlement day. The red bars in Chart 6 illustrate, for each bank, the average relative liquidity sink effect depending on the duration of the problem. The longer the problem lasts, the higher the relative liquidity sink effect will be. With a 1-hour problem, only a small percentage of the system’s total liquidity will, on average, accumulate on the problem bank’s account. If the operational problem lasts from the opening to the end of the settlement day, the highest average relative liquidity sink effect for a single bank will be much higher, approximately 20 percent.
Again, the most extreme days in the sample are the
Chart 6. relative liquidity sink. operational problem that lasts for 1 hour, 5 hours and the whole day. Banks sorted by liquidity sink relative to total liquidity at beginning of day
0
.5
1
1.5
01:00:00 05:00:00 11:06:001 . . . . . . . . . 21 1 . . . . . . . . . 21 1 . . . . . . . . . 21
Maximum liquidity sinkAverage liquidity sink

NORGES BANK penger og kreditt 3/201135
rollovers days, when an operational problem would lead to a massive liquidity sink effect. Due to high-value payments between the biggest bank and the government on these days, the measure of relative liquidity sink will exceed 100 percent. This is possible since total liquidity during the day would be higher than at the beginning of the day because of transfers from the government during the day.
However, even if we exclude these rollover days from the sample, the most extreme day would still imply a fairly high relative liquidity sink effect of nearly 50 percent. The maximum relative liquidity sink effect for a 1-hour problem is also high, approximately 30 percent.
5. Systemic effects of an operational problem
The systemic effects of an operational problem in a bank depend on the intricate interaction between all the banks in the system, and their respective liquidity positions. In this analysis we distinguish between whether operational problems are resolved before the end of the settlement day or not.
In the case of an operational problem in a bank that is resolved before the end of the settlement day, we assume that all submitted payments during that day will be settled as soon as the problem is resolved. While the problem lasts, however, the other banks need more liquidity from other sources in order to fulfil their obligations, either in the form of deposits or intraday credit at the central bank. We measure how much more intraday credit the other banks need to draw in order to fulfil their obligations compared with the baseline scenario where the system functions well. In some cases, other banks’ available liquidity will not be sufficient to cover outgoing pay-ments. Payments will then not be settled in NBO and will be placed in a queue waiting to be settled. This will result in delays in the system, which we also measure.
In the case of an operational problem that lasts until the end of the settlement day, both the non-submitted payments from the bank with an operational problem and other payments lacking funding will remain unsettled that day. We measure the total value of payments not settled. An intraday loan from Norges Bank that has not been repaid by the end of the day, will automatically be converted into an overnight overdraft (D-loan). We the-refore report the total value of D-loans extended to the banks at the end of the settlement day.
Overall, our simulations show that operational problems in most banks will only have minor consequences for the settlement process in NBO. The value of one bank’s payments in the course of a day is small compared with
the overall liquidity in the system. An operational inci-dent in one bank will therefore have a limited impact on other banks’ ability to fulfil their obligations. Of the 21 banks in this study, only 4 will cause systemic effects in NBO if an operational problem prevents them from submitting payments into the system. For the 17 other banks in our study, there is barely a single settlement day throughout the whole of 2010 where an operational failure would have caused liquidity problems for the other banks in the system. Chart 7 and 8 shed some light on why this may be the case.
First, the total level of liquidity in NBO is high, on average NOK 250 billion, and usually higher than the daily turnover in the system. Indeed, the maximum liquidity required by most banks in NBO is on average much lower than that available to them in the form of deposits and intraday credit. Chart 7 shows that, for each of the 21 banks that settle their payments directly in NBO, liquidity needs were on average only between 5 and 50 per cent of the available liquidity during 2010. Hence, the effect of not receiving expected payments will, unless these payments are numerous and of high value, in most cases not pose a threat to banks’ liquidity.
Second, liquidity requirements are dependent on the order of incoming and outgoing payments and on each bank’s opening position vis-à-vis the other banks. Trea-ting the opening position as given, a bank would be able to reduce its liquidity requirements if the flows of inco-ming and outgoing payments were better matched, i.e. using liquidity more efficiently by “recycling” it. A system-wide measure can be calculated daily for overall liquidity consumption as in (1):
Chart 7 Liquidity ratio. individual banks’ maximum liqui-dity needs in nBo during a day divided by the banks’ available liquidity in nBo. normal order of transactions. Average values for 2010
0.0
0.1
0.2
0.3
0.4
0.5
1 2 3 4 5 6 7 8 9 101112131415161718192021
NORGES BANK penger og kreditt 3/201136
�� �∑ ������ ���
�� (1)
where lci,t is each bank’s liquidity consumption defined as the difference between its opening balance and its lowest RTGS balance throughout the day (i.e. max [Opening bal.t – Lowest bal.t,0]) and Ot is turnover.
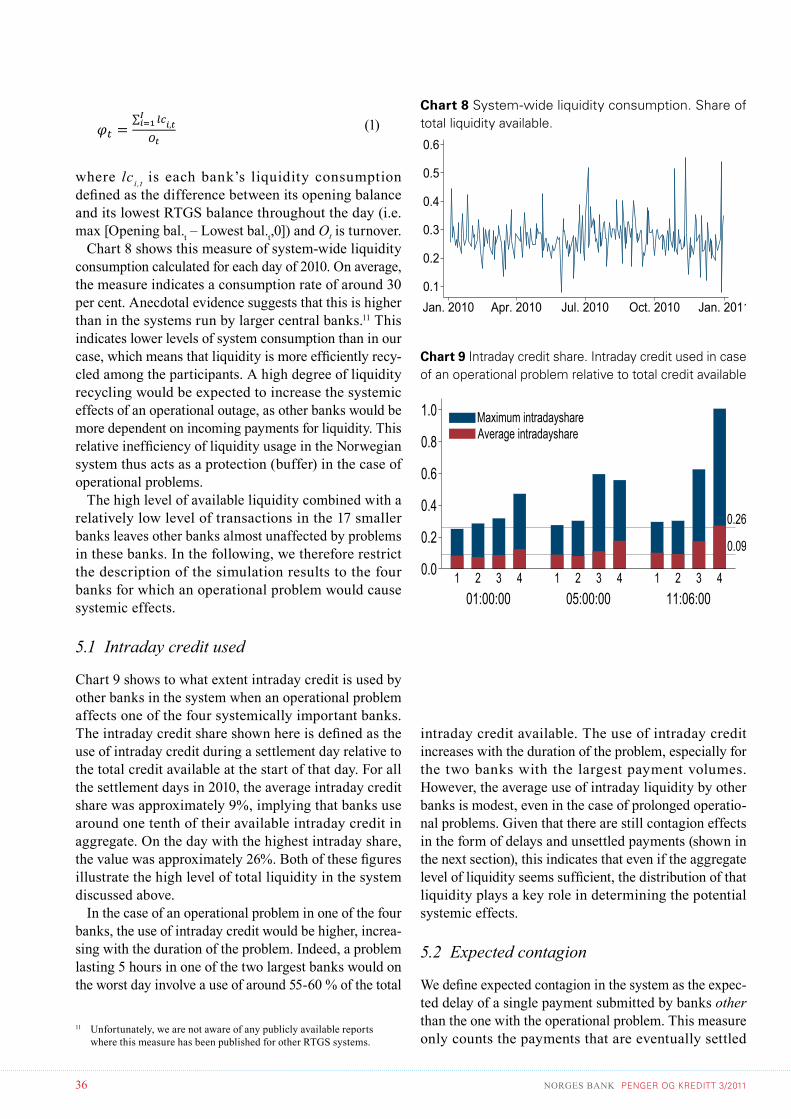
Chart 8 shows this measure of system-wide liquidity consumption calculated for each day of 2010. On average, the measure indicates a consumption rate of around 30 per cent. Anecdotal evidence suggests that this is higher than in the systems run by larger central banks.11 This indicates lower levels of system consumption than in our case, which means that liquidity is more efficiently recy-cled among the participants. A high degree of liquidity recycling would be expected to increase the systemic effects of an operational outage, as other banks would be more dependent on incoming payments for liquidity. This relative inefficiency of liquidity usage in the Norwegian system thus acts as a protection (buffer) in the case of operational problems.
The high level of available liquidity combined with a relatively low level of transactions in the 17 smaller banks leaves other banks almost unaffected by problems in these banks. In the following, we therefore restrict the description of the simulation results to the four banks for which an operational problem would cause systemic effects.
5.1 Intraday credit used
Chart 9 shows to what extent intraday credit is used by other banks in the system when an operational problem affects one of the four systemically important banks. The intraday credit share shown here is defined as the use of intraday credit during a settlement day relative to the total credit available at the start of that day. For all the settlement days in 2010, the average intraday credit share was approximately 9%, implying that banks use around one tenth of their available intraday credit in aggregate. On the day with the highest intraday share, the value was approximately 26%. Both of these figures illustrate the high level of total liquidity in the system discussed above.
In the case of an operational problem in one of the four banks, the use of intraday credit would be higher, increa-sing with the duration of the problem. Indeed, a problem lasting 5 hours in one of the two largest banks would on the worst day involve a use of around 55-60 % of the total
11 Unfortunately, we are not aware of any publicly available reports where this measure has been published for other RTGS systems.
Chart 8 System-wide liquidity consumption. Share of total liquidity available.
0.1
0.2
0.3
0.4
0.5
0.6
Jan. 2010 Apr. 2010 Jul. 2010 Oct. 2010 Jan. 2011
intraday credit available. The use of intraday credit increases with the duration of the problem, especially for the two banks with the largest payment volumes. However, the average use of intraday liquidity by other banks is modest, even in the case of prolonged operatio-nal problems. Given that there are still contagion effects in the form of delays and unsettled payments (shown in the next section), this indicates that even if the aggregate level of liquidity seems sufficient, the distribution of that liquidity plays a key role in determining the potential systemic effects.
5.2 Expected contagion
We define expected contagion in the system as the expec-ted delay of a single payment submitted by banks other than the one with the operational problem. This measure only counts the payments that are eventually settled
Chart 9 intraday credit share. intraday credit used in case of an operational problem relative to total credit available
0.09
0.26
0.0
0.2
0.4
0.6
0.8
1.0
01:00:00 05:00:00 11:06:001 2 3 4 1 2 3 4 1 2 3 4
Maximum intradayshareAverage intradayshare
NORGES BANK penger og kreditt 3/201137
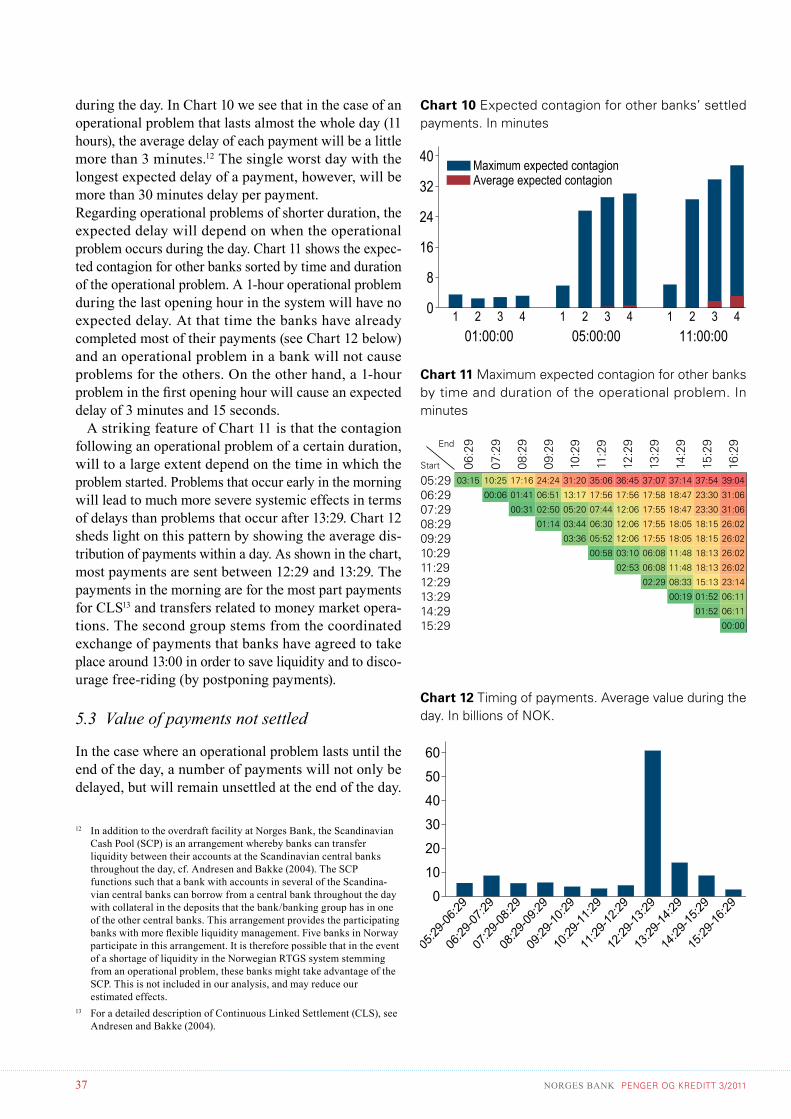
during the day. In Chart 10 we see that in the case of an operational problem that lasts almost the whole day (11 hours), the average delay of each payment will be a little more than 3 minutes.12 The single worst day with the longest expected delay of a payment, however, will be more than 30 minutes delay per payment.Regarding operational problems of shorter duration, the expected delay will depend on when the operational problem occurs during the day. Chart 11 shows the expec-ted contagion for other banks sorted by time and duration of the operational problem. A 1-hour operational problem during the last opening hour in the system will have no expected delay. At that time the banks have already completed most of their payments (see Chart 12 below) and an operational problem in a bank will not cause problems for the others. On the other hand, a 1-hour problem in the first opening hour will cause an expected delay of 3 minutes and 15 seconds.
A striking feature of Chart 11 is that the contagion following an operational problem of a certain duration, will to a large extent depend on the time in which the problem started. Problems that occur early in the morning will lead to much more severe systemic effects in terms of delays than problems that occur after 13:29. Chart 12 sheds light on this pattern by showing the average dis-tribution of payments within a day. As shown in the chart, most payments are sent between 12:29 and 13:29. The payments in the morning are for the most part payments for CLS13 and transfers related to money market opera-tions. The second group stems from the coordinated exchange of payments that banks have agreed to take place around 13:00 in order to save liquidity and to disco-urage free-riding (by postponing payments).
5.3 Value of payments not settled
In the case where an operational problem lasts until the end of the day, a number of payments will not only be delayed, but will remain unsettled at the end of the day.
12 In addition to the overdraft facility at Norges Bank, the Scandinavian Cash Pool (SCP) is an arrangement whereby banks can transfer liquidity between their accounts at the Scandinavian central banks throughout the day, cf. Andresen and Bakke (2004). The SCP functions such that a bank with accounts in several of the Scandina-vian central banks can borrow from a central bank throughout the day with collateral in the deposits that the bank/banking group has in one of the other central banks. This arrangement provides the participating banks with more flexible liquidity management. Five banks in Norway participate in this arrangement. It is therefore possible that in the event of a shortage of liquidity in the Norwegian RTGS system stemming from an operational problem, these banks might take advantage of the SCP. This is not included in our analysis, and may reduce our estimated effects.
13 For a detailed description of Continuous Linked Settlement (CLS), see Andresen and Bakke (2004).
Chart 10 expected contagion for other banks’ settled payments. in minutes
0
8
16
24
32
40
01:00:00 05:00:00 11:00:001 2 3 4 1 2 3 4 1 2 3 4
Maximum expected contagionAverage expected contagion
Chart 11 Maximum expected contagion for other banks by time and duration of the operational problem. in minutes
End Start 06
:29
07:2
9
08:2
9
09:2
9
10:2
9
11:2
9
12:2
9
13:2
9
14:2
9
15:2
9
16:2
9
05:29 03:15 10:25 17:16 24:24 31:20 35:06 36:45 37:07 37:14 37:54 39:04
06:29 00:06 01:41 06:51 13:17 17:56 17:56 17:58 18:47 23:30 31:06
07:29 00:31 02:50 05:20 07:44 12:06 17:55 18:47 23:30 31:06
08:29 01:14 03:44 06:30 12:06 17:55 18:05 18:15 26:02
09:29 03:36 05:52 12:06 17:55 18:05 18:15 26:02
10:29 00:58 03:10 06:08 11:48 18:13 26:02
11:29 02:53 06:08 11:48 18:13 26:02
12:29 02:29 08:33 15:13 23:14
13:29 00:19 01:52 06:11
14:29 01:52 06:11
15:29 00:00
Chart 12 timing of payments. Average value during the day. in billions of nok.
0
10
20
30
40
50
60
05:29
-06:29
06:29
-07:29
07:29
-08:29
08:29
-09:29
09:29
-10:29
10:29
-11:29
11:29
-12:29
12:29
-13:29
13:29
-14:29
14:29
-15:29
15:29
-16:29

NORGES BANK penger og kreditt 3/201138
Chart 14 shows the value of the payments that would not be settled in such circumstances. On average, the numbers are modest, but in a worst-case scenario involving bank with the largest payment volumes, payments worth NOK 80 billion would not be settled. This comes in addition to the value of payments not sent by the problem bank, and is an amount that could also be significant in econo-mic terms.
5.4 Total value of D-loans drawn
When the operational problem lasts until the end of the settlement day, some payments will remain unsettled at the end of that day. This means that some banks will not receive the incoming payments they were expecting. Unless the banks have enough deposits on their accounts, or are able to raise more liquidity in the market before NBO closes, their intraday credit will be converted into overnight overdrafts and they will have to pay an interest rate which is one percentage point higher than the key policy rate.
The earlier in the day the operational problem starts, the higher the risk of having to borrow overnight from
Box 1. Contagion and overall liquidity
The expected delay of a single payment (due to an operational problem) will depend on several factors, including the duration of the problem, the level of liquidity in the system and the value of transactions that day. Equation (2) provides a least squares estimation of the relationship between expected contagion and liquidity and turnover for a problem that lasts 11 hours:
�������������� � ������ � ������ � ���� ���o�� � �� (2)
where c is the expected contagion (on day t with simu-lation number sid), l is total liquidity in the system at the beginning of the settlement day, ot is the value of all the transactions that day and αt is a constant.
The relationship between delay and liquidity is illustra-ted in Chart 13, for an average value of transactions. It shows a clear downward slope for the expected delay of payments as liquidity in the system increases. In the case of liquidity below NOK 200 billion, the typical delay would be above 3 minutes, while liquidity above NOK 300 billion would result in a delay of less than 1 minute. As mentioned above, the liquidity distribution is also of importance here, but the relationship between aggregate liquidity and contagion still implies that a rather substantial liquidity surplus in normal times would be necessary in order to ensure the robustness of the system.
0
2
4
6
8
Exp
ecte
d co
ntag
ion
(min
utes
)
150 200 250 300 350 400Total liquidity (NOK billion)
Chart 13 expected contagion for different levels of liquidity. Average value of transactions. in minutes
Chart 14 Value of payments not settled when an opera-tional problem lasts until end of day. operational problem that lasts for 1 hour, 5 hours and the whole day. in billions of nok
0
20
40
60
80
01:06:00 05:06:00 11:06:001 2 3 4 1 2 3 4 1 2 3 4
Maximum value not settledAverage value not settled

NORGES BANK penger og kreditt 3/201139
the central bank. Chart 15 shows that in the event of an operational problem in a single bank that lasts for just 1 hour before closing, the value of overnight overdrafts required by other banks will be close to zero on average. The maximum value for the most extreme day amounts to approximately NOK 4-8 billion.
However, the value of overnight overdrafts increases dramatically the longer the operational problem remains unresolved. A five-hour problem and an eleven-hour problem in bank 4 that last until the end of the settlement day would result in approximately NOK 25 billion on average in overdrafts, shared by 7 banks on average. The worst-case scenario involves overdrafts in the range of NOK 125 billion, shared by around 20 banks.
If the interest rate on overdrafts were 4 per cent, total interest payments by the banks would be almost NOK 14 million overnight per day. In addition, the banks that would have to pay for the overnight loans would have been in a positive position (i.e. earning interest) if the operational problem had not occurred, adding to the total cost of the outage. In total, these figures hint at potentially substantial costs for the any bank following an operatio-nal problem in one single bank.
6. A reaction pattern for other banks
So far, we have made the assumption that banks do not react to operational problems in another bank by changing their pattern for submitting payment orders. There are good reasons for banks to behave like this; if the banks know for sure that failure by another bank to submit payments is due to technical issues rather than solvency problems, they might consider it to be more important to fulfil their obligations than to save liquidity while the problem lasts.
However, if the problem remains unresolved, it is rea-sonable to expect that banks would postpone their outgo-ing payments to the stricken bank in order to maximise the number of payments they would be able to send to other banks. It is likely that banks would quickly become aware of operational problems, both because such infor-mation may be shared among participants (a stricken bank would want to reassure its counterparties that the pro-blems are purely operational) and because they would notice a lack of incoming payments.
In this section we therefore relax the restriction of unaltered behaviour and investigate how our results are affected if the other banks stop sending payments to the bank with an operational problem. Simulating the same scenarios as before, we now extend the analysis by inclu-ding an assumption that all banks have a stop-sending-payment reaction that is applied whenever a bank runs into operational problems.
To this end, we have extracted a subsample of 15 sett-
Chart 15 Value of d-loans taken due to an operational problem that lasts until end of day. operational problem that lasts for 1 hour, 5 hours and the whole day. in billions of nok
0
50
100
150
01:06:00 05:06:00 11:06:001 2 3 4 1 2 3 4 1 2 3 4
Maximum value of D-loansAverage value of D-loans
lement days in 2010. These settlement days are the most extreme days in 2010 in terms of the level of potential systemic effects. We have chosen the 15 days based on four criteria; two criteria for problems that are solved before end of day (expected contagion in the system and intraday credit used), and two criteria for problems that run until the end of the day (the value of payments not settled and the volume of overnight overdrafts). We re-run the simulations for those days, but allow banks to stop sending payments either immediately or after a certain time (we test the effects of waiting 15 minutes, 30 minutes, 45 minutes, 1 hour, 2 hours or 3 hours before reacting). We then compare the total delay of payments by all the banks, except the problem bank, with the results obtained without the reaction pattern.
Chart 16 shows the effects of a stop-sending reaction for the 15 most extreme settlement days in 2010 for the four banks we find to be systemically important in the payment system, reported as an average across the four banks. It shows the delay of payments when a stop-sen-ding-payments reaction is applied in percentage of delay given that no reaction is implemented. The blue line shows the average delay of payments across all banks except the problem bank, depending on how fast the reaction is implemented. The red line reports in the same way the maximum delay of payments across all banks except the problem bank, depending on how fast the stop-sending-payments reaction is implemented.
The simulations show that the extent to which a stop-sending reaction will improve the liquidity situation and thereby reduce the delay of payments among the other banks will depend critically on the time elapsed between the start of the operational problem and when payments to the problem bank are stopped. It is clear that the effect of a stop-sending-payment reaction is highest if the banks stop sending payments to the problem bank within 30

NORGES BANK penger og kreditt 3/201140
minutes. Reacting any faster than that will not have any additional positive effect on the liquidity level among the other banks in the system, and will therefore not lead to any further reduction in payment delays. On the other hand, reacting later than 30 minutes after the problem starts will significantly reduce the liquidity in the system and delays will increase. If the stop-sending-payments reaction is not applied within 3 hours, then reduction in payment delays will be fairly small compared to the case without such a reaction.
7. Contagion and net settlements
All the results presented so far relate to gross settlements and the effects an operational problem would have on other banks’ gross transactions. However, there are also several settlement cycles in NBO where the payment positions settled are the result of previous netting. Due to insufficient data, we have not been able to simulate how these nettings would actually play out in the case of an operational problem in one of the banks in NBO. However, it might still be of interest to the reader to get at least an impression of what the likely consequences of an operation disruption as described above would be for two important net settlements, the retail and small value net settlement (NICS Net) and the CLS net funding of payment obligations for foreign exchange trades.
First, retail and other small payments (below NOK 25 billion) are netted in an auxiliary system before the final payment positions are settled in Norges Bank. Since a net payment positions is automatically debited a bank’s account, an operational problem in the bank to submit payments would not impair the bank from covering a net debit position. Moreover, a bank with an operational problem will always have enough liquidity since its payment position is always better or equal to what it would have been without an operational problem. However, other banks might have been expecting liquidity (earlier that day) from the stricken bank which never arrived and thus become unable to cover their debit positions in the net settlement. In such cases, the final net positions would not be settled, and the underlying retail payments would be delayed at least until new positions had been calculated in the auxiliary system. For our subsample of 15 days, we find that on 11 days a minimum of one retail net settlement (there have been 2 to 3 settlement cycles daily during our sample period) would have been stopped because one or more banks lacked sufficient liquidity to fulfill their obli-gations in the net settlement.14
Second, foreign settlement members in CLS use cor-
14 Similar reasoning would also apply to the net settlement of payments for trades in securities (equities, equity capital instruments, short-term paper and bonds). However, we find that on only one of the 15 days studied in this section, such a settlement would be stopped.
Chart 16. delay of payments depending on time before a stop-sending-payment reaction is applied. 11-hour problem. in percentage of delay without reaction
Maximum delay
Average delay
0.0
1.0
0.2
0.4
0.6
0.8
15304560120180Reaction time in minutes
respondent banks in Norway (i.e. banks with an account at Norges Bank) to handle their pay-ins to CLS and receive pay-outs from CLS. A problem in one of the cor-respondent banks would make settlement members using that correspondent bank unable to send payments to CLS. Some settlement members (those who have sold more NOK than they have bought) might then not be able to settle some of their payments in CLS. This may have important economic consequences by itself, but is not discussed in this article. Moreover, the changes in banks’ positions would result in altered CLS pay-ins and pay-outs. Therefore, the liquidity distribution among banks might be different than what we have based our simula-tions upon (for operational problems beginning early in the morning). A full treatment of this issue, however, would require more data than we have been able to collect for this article and has been left for possible analysis in future articles.
8. Conclusion
In this article we have analysed the robustness of the settlement process in the Norges Bank large-value payment settlement system (NBO) to operational pro-blems in one of its participating banks. We find that of the 21 banks directly participating in NBO, only four are of systemic importance in the sense that operational problems could have a significant impact on the other banks in the system. Operational problems in any of the other banks in the system will only have negligible effects on the other banks’ ability to fulfil their payments obli-gations in NBO. The level of such systemic risk varies substantially, depending on the liquidity available to individual banks and on overall activity in the system. We also find that the systemic effects can be significant ly reduced if other banks react quickly by postponing their outgoing payments to the stricken bank.

NORGES BANK penger og kreditt 3/201141
References
Akram, Q. F. and C. Christophersen, 2011. “Norwegian Overnight Interbank Interest Rates”, Computational Economics, forthcoming. Published online 8 November 2011
Andresen, I. and B. Bakke, 2004. “Continuous Linked Settlement – valuta for pengene” (Continuous Linked Settlement – value for money). Penger og Kreditt 1/2004 (Norwegian only)
Bedford, P., S. Millard and J. Yang, 2004. “Assessing operational risk in CHAPS Sterling: a simulation approach”, Financial Stability Review, June 2004, pp. 135 – 143, Bank of England
Glaser, M. and P. Haene, 2008. “Operational disruptions in the Swiss payment system”, SPEED, 2(3), 27-31
Ledrut, E., 2007. “Simulating retaliation in payment systems: Can banks control their exposure to a failing participant?”, DNB Working Paper, 133
Lublóy A. and E. Tanay, 2007. “Operational disruption and the Hungarian real-time gross settlement system (VIBER)”, Hungarian Review of Financial Institutions (Hitelintézeti Szemle) 6(4), 324-357
Manning, M., E. Nier, and J. Schanz (editors), 2009. The Economics of Large-value Payments and Settlement: Theory and Policy Issues for Central Banks. Oxford University Press
Norges Bank, 2008. “The arrangement for the exchange of government securities for covered bonds”, Circular no. 7/14 November 2008
Norges Bank, 2010a. Annual Report on Payment Systems 2010, Norges Bank
Norges Bank, 2010b. “Guidelines for pledging securities and fund units as collateral for loans in Norges Bank”, Circular no. 6/23 November 2010
Scmitz, S. W., C. Puhr, H. Moshammer, and U. Elsenhu-ber, 2006. “Operational risk and contagion in the Austrian large-value payment system ARTIS”, Finan-cial Stability Report 11 p. 96-113, Oesterreichische Nationalbank (Austrian Central Bank)