OPERATIONAL PLANS FOR TWO STUDY REGIONS - CORDIS · D71.4_Operational_Plans_For_Two_Study_Regions...
20
Crop Monitoring as an E-agricultural tool in Developing Countries OPERATIONAL PLANS FOR TWO STUDY REGIONS Reference: D71.4_Operational_Plans_For_Two_Study_Regions Author(s): Qinghan Dong Version: 1.0 Date: 28/02/2014
Transcript of OPERATIONAL PLANS FOR TWO STUDY REGIONS - CORDIS · D71.4_Operational_Plans_For_Two_Study_Regions...
Crop Monitoring as an E-agricultural tool in
Developing Countries
OPERATIONAL PLANS FOR
TWO STUDY REGIONS Reference: D71.4_Operational_Plans_For_Two_Study_Regions Author(s): Qinghan Dong Version: 1.0 Date: 28/02/2014
Operational Plans for two Study Regions (E-AGRI GA Nr. 270351)
D71.4_Operational_Plans_For_Two_Study_Regions Page 2 of 20
DOCUMENT CONTROL
Signatures Author(s) : Qinghan Dong Reviewer(s) : Qinghan Dong Approver(s) : Issuing authority :
Change record
Release Date Pages Description Editor(s)/Reviewer(s)
1.0 10/02/2014
Operational Plans for two study regions (E-AGRI GA Nr. 270351)
D71.4_Operational_Plans_For_Two_Study_Regions Page 3 of 20
TABLE OF CONTENT
1. Operational use of remote sensing indicators for crop growth monitoring .......................................... 5 1.1. Pre-processing of remote sensing variables ......................................................................................... 5 1.2. Operational use of remote sensing indices for crop monitoring in Morocco ........................................ 6 1.3. Operational use of remote sensing indices for crop monitoring on the Huaibei Plain .......................... 8 2. CGMS operation plan in Morocco ........................................................................................................ 11 2.1. Meteorological data acquisition and interpolation ............................................................................. 11 2.2. Operation for crop simulation ............................................................................................................. 12 2.3. Forecasting crop yields using on CGMS output .................................................................................... 13 2.4. Visualizing and analysing crop growth status through CGMSMAROC viewer ...................................... 13 3. BioMA Operational Plan on Jianghuai Plain......................................................................................... 15 3.1. Current status of the monitoring system ............................................................................................. 15 3.2. Steps needed to make the system operational .................................................................................... 15
3.2.1. Installation .................................................................................................................................... 15 3.2.2. Linking BioMA to a source of updated weather data ................................................................... 16 3.2.3. Linking BioMA to a source of remote sensing products (optional) .............................................. 16 3.2.4. Resources needed to make the system operational .................................................................... 16
3.3. Resources needed to operationally provide the monitoring/forecasting service ................................. 17 3.4. Possibility to maintain/extend the system in the future ..................................................................... 17 4. Wheat monitoring and yield forecasting in Morocco ........................................................................... 19 5. Conclusions ......................................................................................................................................... 20
Operational Plans for two study regions (E-AGRI GA Nr. 270351)
D71.4_Operational_Plans_For_Two_Study_Regions Page 4 of 20
EXECUTIVE SUMMARY
The principal objective of this E-AGRI project is transfer the most advanced crop monitoring technology into the two developing regions and establishment of the infrastructure for crop monitoring activities at pilot (pre-operational) level. Once local input information, mainly phenological and meteorological data, is available, the operationalization of the different components can be straightforward. At the end of implementation in January 2014, the main technological components targeted in this project are already run in operational level including CGMS in Morocco, crop monitoring based on remote sensing indicators in Morocco and on Huaibei Plain. Some components are ready to be set in operation such as the BioMA platform for rice monitoring on Jianghuai plain. This document describes the schemes of the operations that are running for supporting local or policymaking will be set up in the sustainable way, when the local governments will properly support the target operations.
Operational Plans for two study regions (E-AGRI GA Nr. 270351)
D71.4_Operational_Plans_For_Two_Study_Regions Page 5 of 20
1. Operational use of remote sensing indicators for crop growth monitoring
1.1. Pre-processing of remote sensing variables Compared to weather data, bio-physical-variables derived from satellite sensors, such as NDVI, have some advantages to be used as crop growth indicators. They express the effects of the main environmental factors affecting yields (rainfall, temperature, soils, diseases, cropping practices, etc.). Furthermore, they are continuously available at the extent of country and at high spatial and temporal resolution. As described elsewhere, the crop growth monitoring and yield prediction is carried out in the country using these remote sensing variables (mainly NDVI and DMP), by means of multiple regression models. The indicator NDVI, the simplest and most used vegetation indicator, can describe closely the vegetation growth status impacted by various environmental factors. The raw SPOT-VGT datasets, called VGT-P product, are calibrated and geo-corrected. No atmospheric correction is performed. From there we have the name of top-of-atmosphere (TOC) reflectance. By selecting the best available observation for each pixel, the 10 daily TOC reflectance are composited and a layer of this 10 daily NDVI layer is generated. The digital numbers are rescaled to NDVI value by using the formula:
NDVI = -0.08 + 0.04*V, with V=0-250
The upper range values (V=251-255) are used to label pixels with aberrant observations (251=error/missing, 252=cloud, 253=snow, 254=water, 255=other exception). This information is extracted from the Status Mask and from the GLC2000 land cover map for differencing land and sea pixels. The pre-processing will be carried out to compute the smoothed version of NDVI, using a modified version of the Swets-algorithm, which inspects each pixel’s time profile, detects all the cloudy observations and interpolates to values that are more appropriate.

Operational Plans for two study regions (E-AGRI GA Nr. 270351)
D71.4_Operational_Plans_For_Two_Study_Regions Page 6 of 20
1.2. Operational use of remote sensing indices for crop monitoring in Morocco
Wheat yields can be forecasted, based on linear regression models, with coefficients of determination (R2) greater than 80%, using average dekadal NDVI from 1st February till end March (. Coefficient of determination exceeds 90%, when using average dekadal NDVI from 1st February till end April. For barley, the forecast is more accurate till the 2nd dekad of April. Besides, the relationship between cereal yields and NDVI is likely to improve gradually as time series become longer. The pre-processed NDVI data will be projected under the projection system INSPIRE-LAEA with a resolution of 1 km. Only the part of the country where the agriculture is present will be monitored. It is bounded as follows:
X: from 2 275 000 m to 3 385 000 m
Y: from 765 000 m to 1 575 000 m
Nr. of columns=1110, nr. of records=810, nr. of pixels=899 100.
Figure 1: Morocco (blue) and its provinces (red) and the analysed image block, in this case with the cropland AFI. The 38 considered provinces and the Region-IDs. 1: AGADIR; 2: TAROUDAN; 3: AL HOCEI; 4: AZILAL; 5: BEN SLIM; 6: BENI MEL; 7: BOULEMAN; 8: CASABLAN; 9: CHEFCHAO;10: EL HAJEB;11: EL JADID; 12: EL KELAA;13: ERRACHID;14: ESSAOUIR;15: FES; 16: FIGUIG;17: GUELMIM; 18: FRANE; 19: KENITRA; 20: KHEMISSE; 21: KHENIFRA; 22: KHOURIBG; 23: LARACHE; 24: MARRAKEC; 25: MEKNES; 26: NADOR; 27: OUARZAZA; 28: OUJDA; 29: RABAT;30: SAFI; 31: SETTAT; 32: TANGIER; 33: TAOUNATE; 34: TATA; 35: TAZA; 36: TETOUAN; 37: TIZNIT; 38: LAAYOUNE
The targeted region from auxiliary dataset GLC2000, GTOPO30 and the cropland AFI (GlCropV2) are extracted. The province boundaries are transformed into raster format with the corresponding REG_ID number (1-38) The RUM-database for the variable NDVI is established by computing the mean values of for all “cropland pixels” in each of the 38 provinces. The “cropland” pixels are those having an area fraction of 100% in the cropland Area Fraction Images.
Operational Plans for two study regions (E-AGRI GA Nr. 270351)
D71.4_Operational_Plans_For_Two_Study_Regions Page 7 of 20
Cereal yields can be forecasted at province level, based on linear regression models, and using average dekadal NDVI (SPOT-VEGETATION) as predictor from February till March, or with higher accuracy from February till April. R2 higher than 62% are statistically very highly significant (probability level < 0.001). Those between 45 and 62% and between 30 and 45% are highly significant (probability level < 0.01) and significant (probability level < 0.05), respectively. R2, lower than 30%, is considered not statistically significant. The cereal yield forecasting approach, based on multiple regression models and using a combination of predictors (rainfall, NDVI or temperature), improves accuracy at fine spatial scales. Forecasts will be performed operationally at the levels of the provinces, agro-ecological zones and country. Regression models will be updated separately, for each province or agro-ecological zone. Forecasted yield for each province can even be aggregated to national level, proportionally to their respective cropped areas, for providing yield forecast for the entire country, with more computational workload but with better accuracy. These regression models are relatively stable, since their coefficients of determination in cross-validation (Rp2) are between 59 and 94%. Furthermore, forecasts will be relatively accurate and early, from two months before harvests. Among the all remote sensing variables available, NDVI explains the largest share (partial R2>40%) of yield variation for wheat in 14 out of 23 provinces targeted, i.e. in provinces which account for more than 69.4 % of the total national production. Rainfall explains most of yield variation in the provinces of Larache, Agadir, Oujda, Beni Mellal, Tangier, Marrakech and Ouarzazate. Temperature explained most of yield variation only in Tangier and Tetouan, which are located in wet environment. In these two provinces, temperature affects negatively wheat yields, because it increases evapotranspiration and reduces period of growth. This parametric approach is already in operation and will be combined with agro-meteorological approach described in the following sections during the upcoming crop yield forecasting campaigns.
Operational Plans for two study regions (E-AGRI GA Nr. 270351)
D71.4_Operational_Plans_For_Two_Study_Regions Page 8 of 20
1.3. Operational use of remote sensing indices for crop monitoring on the Huaibei Plain
The remote sensing indices used for crop yield forecasting on the Huaibei Plain include two variables, NDVI and DMP. As described in the previous section, NDVI will be derived directly from the raw data VGT-P product, after the ten daily composite according to the formula:
Where NIR is the reflectance of channel near infrared and the RED is the reflectance of the channel red provided by the SPOT-VGT sensor. In order to compute the variable DMP, another important biophysical variable, fAPAR needs to be calculated. fAPAR represents fraction of the photosynthetic active radiation (400-700 nm) absorbed by the green vegetation. It is calculated as the difference between the PAR absorbed by the top of the vegetation canopy (1-ρ1) minus the PAR absorbed by the soil (1-ρ2). ρ1 is estimated using the RED surface reflectance. ρ2 is calculated from the single scattering term that is reflected by the soil and that passes through the canopy without further scattering. In this equation, the soil reflectance is assumed constant per soil type and a look-up table is used together with a soil map to derive this reflectance. To estimate the transmission of the soil reflectance through the vegetation canopy an exponential function of the LAI is assumed, which also depends on the solar zenith angle θs. The use of the effective LAI (LE) ensures consistency between fAPAR and LAI. with G(θ) the global light extinction coefficient = 0.5 β the coefficient for canopy multiple scattering = 0.9 The standard smoothing procedure will be applied during the operational phase. DMP or “Dry Matter Productivity” is a variable describing the daily growth of standing biomass. In other words, biomass accumulation is correlated with the amount of radiation absorbed or intercepted by green foliage (APAR), multiplied by a conversion efficiency constant є, and integrated over the season (DMP=∫є*APAR). The approach led to the equation proposed by Monteith by expressing DMP in terms of external influences (incoming solar radiation) and conversion efficiencies, which account for the conversion of radiation during photosynthesis and for the losses of autotrophic respiration.
DMP = R 0.48 fAPAR (T12, T24)
sELGAPAR ef
cos/21 11
Operational Plans for two study regions (E-AGRI GA Nr. 270351)
D71.4_Operational_Plans_For_Two_Study_Regions Page 9 of 20
With
R, the incoming shortwave solar radiation which on the average comprises 48% of PAR (Photo-synthetically Active Radiation)
fAPAR, the PAR-fraction absorbed by the green vegetation
, the efficiency-term =1.2
1, photosynthetic efficiency
2, respiration. More concretely, the DMP will be computed compute using a series of programmes:
MET2IMG: The three requested variables of the meteo-database (temperatures Tmin/Tmax and solar radiation R) are converted to image form.
PRODmax: This tool applies the above Monteith-equation on the meteo-images, but assuming fAPAR=1 for all meteo-cells. This results in an image NPPmax,1. The subscript 1 indicates the image still contains daily values.
COMPOSIT: All DMPmax,1 scenes of a certain dekad are composited using a mean filter to a dekadal image DMPmax,10.
VISMOOTH: The time series of dekadal fAPAR data is smoothed with the modified Swets-method prior to DMP calculation. The result is a time series of fAPAR10 images. The smoothing at the level of fAPAR is justified, since this variable only changes gradually over time.
PROD: the final result is computed via the multiplication: DMP10 = fAPAR10 * DMPmax,10.
o fAPAR10 is derived from remote sensing. o NPPmax,10: dekadal DMP, holding for fAPAR=1. The program internally
resamples this Very Low Resolution image to the resolution of fAPAR10 by means of bilinear interpolation.
The ancillary data including GLC2000, GTOPO30 and the cropland AFI (GlCropV2) will be used with the following boundaries:
Longitude: from 114.799107° to 119.799107°
Latitude: from 29.2991071° to 34.8080357° y-DMP values are computed using smoothed fAPAR and the daily global meteorological data from the JRC of the European Commission. The Regional Unmixed Mean database containing the remote sensing and meteorological variables will be extended with the cumulative values of these variables. The accumulation will be calculated for every possible consecutive 2 to 9 dekads growth period of crop (between the 10th October and 20th June the following year), as a phenological stage for winter wheat could last till 9 dekads.

Operational Plans for two study regions (E-AGRI GA Nr. 270351)
D71.4_Operational_Plans_For_Two_Study_Regions Page 10 of 20
The step-wise regression and will be performed ever two months during the growth season and yield forecasting models for six prefectures on the Huaibei plain will be updated accordingly.
Operational Plans for two study regions (E-AGRI GA Nr. 270351)
D71.4_Operational_Plans_For_Two_Study_Regions Page 11 of 20
2. CGMS operation plan in Morocco CGMS has been already running in an operational way in Morocco. It has been established thanks to the collaboration with two other Moroccan organizations outside of E-AGRI consortium, the National Meteorological Department (DMN) and the Department of Statistics and Strategy (DSS) of the Ministry of Agriculture.
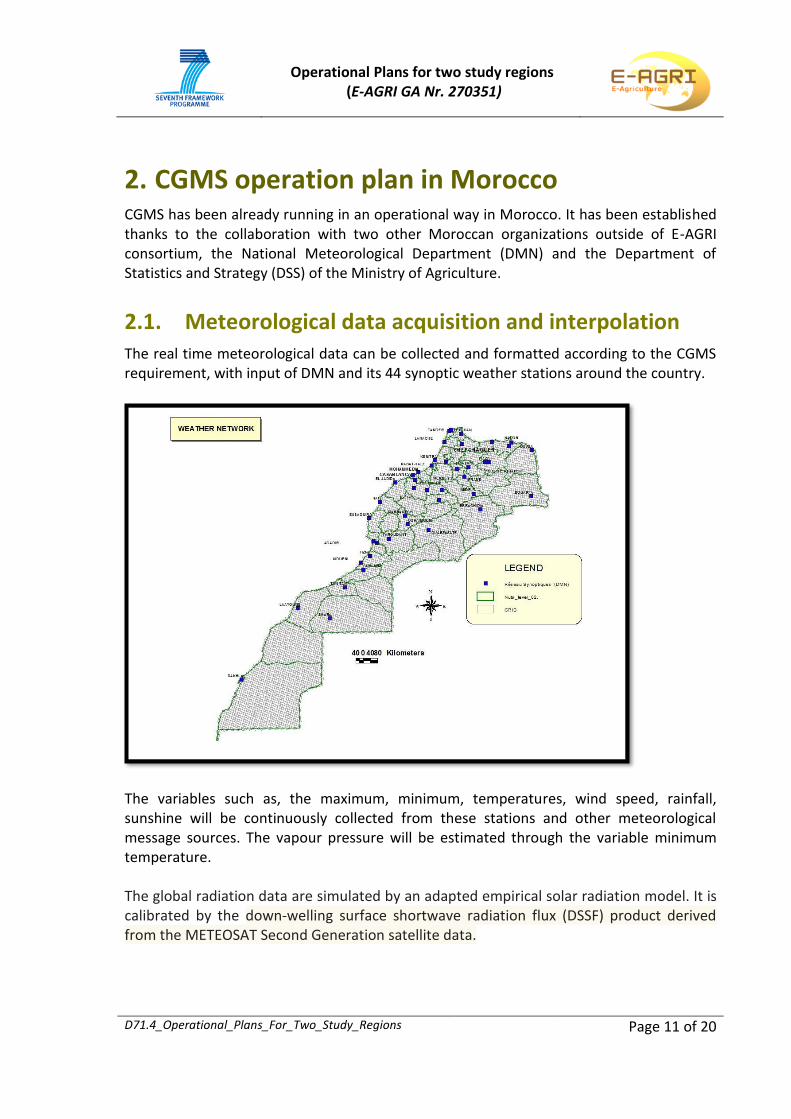
2.1. Meteorological data acquisition and interpolation The real time meteorological data can be collected and formatted according to the CGMS requirement, with input of DMN and its 44 synoptic weather stations around the country.
The variables such as, the maximum, minimum, temperatures, wind speed, rainfall, sunshine will be continuously collected from these stations and other meteorological message sources. The vapour pressure will be estimated through the variable minimum temperature. The global radiation data are simulated by an adapted empirical solar radiation model. It is calibrated by the down-welling surface shortwave radiation flux (DSSF) product derived from the METEOSAT Second Generation satellite data.

Operational Plans for two study regions (E-AGRI GA Nr. 270351)
D71.4_Operational_Plans_For_Two_Study_Regions Page 12 of 20
The operation of the CGMS level 1 to spatialize the weather data follows:
METDATA is daily updated by processing SYNOP and METAG Messages at 11h00.
A FORTRAN executable checks automatically the last day from the table GRID_WEATHER and compares it with the last available day in METDATA. If the date in GRID_WEATHER is earlier than the date in METDATA, the program updates SYSCON table, which defines the parameters for spatial interpolation, with the related current_year.
The program generates automatically the configuration file for running CGMS in batch mode. The configuration file contains the last day.METDATA as the start & end dates of interpolation. The calculated weather option is also activated for global radiation and evapo-transpiration calculation.
The program runs CGMS in batch mode, then the table GRID_WEATHER is updated by the real time values at 13h00.
2.2. Operation for crop simulation The crop simulation step is operated at the CGMS level 2. It consists of the WOFOST model simulation at Elementary Mapping Unit (EMU). The EMU is resulted from intersection of two geographic layers (climatic grid cell and soil mapping unit), where, of course, meteorological data, soil characteristics and crop parameters are considered homogeneous. Simulated crop indicators of the EMU’s are spatially aggregated to the smallest administrative unit (district / commune). Operationally, the crop simulation step includes the calibration of the crop parameters related to phenology for soft-wheat and durum-wheat. Other crop parameters will be updated using results from WP3 where a new calibration has been carried out using newly collected data for soft-wheat and durum-wheat in Morocco. Furthermore, the crop calendar was defined with a fixed sowing date on the 1st of December and letting the model run up until maturity. The estimation of the initial soil water will be set by starting the simulation on the 1st of June with a completely dry soil profile. This approach allows 6 months to accumulate water in the soil profile before the crop simulation starts on the 1st of December. It has been demonstrated that the predictive capabilities of the system strongly improved using this simple approach. The operational implementation of the CGMS level 2 is currently still a manual process where an operator is needed to run the CGMS executable, start the aggregation of crop simulation results to grid and regional level and finally export the aggregated results to the CGMS-Maroc viewer. This process will be automated on dekadal time-steps, by implementing an adapted CGMS configuration file and running the CGMS executable using a scheduled procedure.
Operational Plans for two study regions (E-AGRI GA Nr. 270351)
D71.4_Operational_Plans_For_Two_Study_Regions Page 13 of 20
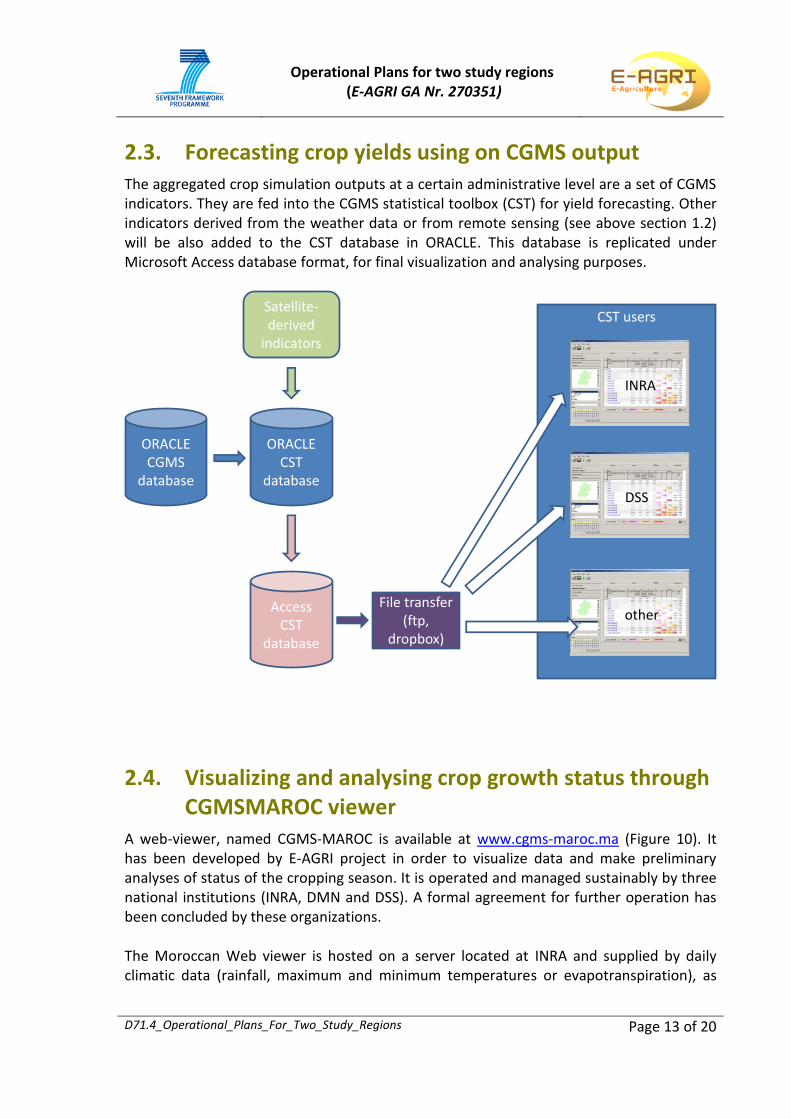
2.3. Forecasting crop yields using on CGMS output The aggregated crop simulation outputs at a certain administrative level are a set of CGMS indicators. They are fed into the CGMS statistical toolbox (CST) for yield forecasting. Other indicators derived from the weather data or from remote sensing (see above section 1.2) will be also added to the CST database in ORACLE. This database is replicated under Microsoft Access database format, for final visualization and analysing purposes.
2.4. Visualizing and analysing crop growth status through CGMSMAROC viewer
A web-viewer, named CGMS-MAROC is available at www.cgms-maroc.ma (Figure 10). It has been developed by E-AGRI project in order to visualize data and make preliminary analyses of status of the cropping season. It is operated and managed sustainably by three national institutions (INRA, DMN and DSS). A formal agreement for further operation has been concluded by these organizations. The Moroccan Web viewer is hosted on a server located at INRA and supplied by daily climatic data (rainfall, maximum and minimum temperatures or evapotranspiration), as
ORACLECGMS
database
ORACLECST
database
Satellite-derived
indicators
AccessCST
database
File transfer(ftp,
dropbox)
CST users
INRA
DSS
other

Operational Plans for two study regions (E-AGRI GA Nr. 270351)
D71.4_Operational_Plans_For_Two_Study_Regions Page 14 of 20
well as main outputs of crop simulation performed at DMN, together with remote sensing indicators delivered every 10 days by VITO. All data are aggregated at common uniform grid cells of 9.14x9.14 km. This particular grid size is a result of compromise between spatial forecasting accuracy and the error generated from interpolating 43 synoptic stations’ data. Further operation will reduce the size of the grid when new synoptic stations are available for CGMS-MAROC.
Figure 1: The web viewer of CGMS-MAROC enables bio-climatic monitoring of cereals, and preliminary statistical analysis of the cropping season. On the left window the cumulated rainfall over the season on croplands (9.14x9.14 km grid) is displayed. On the right window, the similarity analysis using cumulated
rainfall, in the administrative Commune of Ben Ahmed (Province of Settat) is shown.
The end users of CGMS-MAROC are mainly the analyzers and statisticians from local and central governments, supported by INRA and DMN. A public version of the web viewer is available at www.cgms-maroc.ma with limited capabilities, and can be used for season monitoring. One of the most useful analyses is based on profile similarity of crop indicator between the cropping seasons. It predicts that a cropping season of similar agro-climatic conditions to past ones would result in similar crop yields, all other factors assumed to be equal. Similarity analysis could be performed at national, provincial and even sub-provincial level. One of the direct applications of CGMS MAROC is an application on agriculture insurance. The system will be updated and operated to forecast cereal yields at Commune administrative level in main cereal areas of Morocco. An operational use by commercial insurance companies could be supported by the Ministry of Agriculture.
Operational Plans for two study regions (E-AGRI GA Nr. 270351)
D71.4_Operational_Plans_For_Two_Study_Regions Page 15 of 20
3. BioMA Operational Plan on Jianghuai Plain
3.1. Current status of the monitoring system The status of the monitoring and forecasting system developed for rice in Jiangsu allows considering it as ready for being transferred to an operational service. Deliverables D33.2 “Assessment report on multi-model approach for rice monitoring” and D33.3 “Evaluation report on integration of RS data” demonstrate the good performances obtained by the monitoring and forecasting system, its reliability and the absence of behaviours leading to hypothesize insufficient robustness in case of operational use. Three configurations of the systems were developed and tested:
Base: multi-model (WARM, CropSyst, WOFOST) approach to rice monitoring;
Diseases: the impact of diseases on crop yields is also considered;
RS-assimilation: the assimilation of remote sensing information is also considered.
All the configurations allowed to properly monitoring rice in the Province – as well as to forecast yields – in different moments during the season. However, the configurations Diseases and RS-assimilation presented slightly better performances compared to the Base one. For this reason, the operational plan is presented and discussed separately for the three configurations.
3.2. Steps needed to make the system operational
3.2.1. Installation The first step to make the system operational is the installation of the BioMA platform. The hardware (operative system more recent than Windows XP, both at 32 and 64 bit) and software (NET 3.5 Framework; SQLServer Compact Edition) pre-requisites for the installation are detailed in Deliverables D33.4 “Guide of BioMA platform for local rice monitoring application in China”. The same deliverable provides details on all the information needed (and step to follow) to install and customize the application. Of course, the best performances of the platform – in terms of time needed to run the simulations – are achieved (i) when the application is installed on a server and (ii) when a high potential database is used. However, in case the frequency of the forecasting events is not high, the release based on a portable database can be run on standard computers without problems.
Operational Plans for two study regions (E-AGRI GA Nr. 270351)
D71.4_Operational_Plans_For_Two_Study_Regions Page 16 of 20
3.2.2. Linking BioMA to a source of updated weather data The most important step in the transfer of the monitoring system to operational services is related with linking the table where weather data are stored to a source of data dynamically updated. Indeed, ECMWF ERA-Interim data (European Centre for Medium‐Range Weather Forecasts with 25 × 25 km grid resolution) were used for the development and evaluation of the monitoring system. This kind of databases is updated with frequencies that are not compatible with in season monitoring and forecasting activities, thus leading to the need of using other sources of data. The first option is surely to get access to the weather data recorded and processed in real time by the China Meteorological Administration, although local partners indicated that this sources could be difficult to access for Province administrations. The alternative, discussed during the E-AGRI meetings, is the use of NOAA data (http://www.ncdc.noaa.gov/). The source of updated weather data should be linked to the CGMS database, where a spatial resolution of 25 km × 25 km is currently defined for the grid weather table. This spatial resolution is coherent with those used within some of the most widespread agrometeorological databases (e.g., EC-JRC MARS, ECMWF). However, it can be easily changed according to the specific resolution of the weather source via dedicated options in the platform Regional settings, as detailed in Deliverable D33.4 “Guide of BioMA platform for local rice monitoring application in China”.
3.2.3. Linking BioMA to a source of remote sensing products (optional)
Only in case of the BioMA configuration RS-assimilation, the platform should be linked to a source of remote sensing products to provide spatially-distributed, season specific sowing dates and maximum leaf area index (LAI), according to the procedure detailed in Deliverable D33.3 “Evaluation report on integration of RS data”. The BioMA monitoring and forecasting system does not include dedicated facilities to derive sowing dates and maximum LAI from NDVI (normalized difference vegetation index) time profiles. Remote sensing data should therefore be processed outside the BioMA environment, and results should be provided to the platform.
3.2.4. Resources needed to make the system operational According (i) to the BioMA configuration selected (see section 1.1 “Current status of the monitoring system” of this document), (ii) to the desired frequency of forecasting events, and (iii) to the weather source, the resources needed to make the system operational could vary in a relevant way. In case of selecting (i) one of the configurations Base and Diseases, (ii) of using a weather source with a spatial resolution coherent with the one used (25 km × 25 km), and (iii) of performing three/four forecasts during the season, a standard computer is enough, and there’s no need to link the platform to a high potential database, since the portable
Operational Plans for two study regions (E-AGRI GA Nr. 270351)
D71.4_Operational_Plans_For_Two_Study_Regions Page 17 of 20
version provided with the current release is enough to properly store both input and output data. This solution is the cheapest (there’s no need of buying and managing servers), although it assured too satisfactory performances during the evaluation activities carried out within the project. In case of frequent monitoring/forecasting events and/or of high spatial resolution weather sources, the portable database included in the current BioMA release would not be enough, thus leading to the need of installing the database on a server. In this case, the cost of the operationalization of the monitoring system will increase. Additional resources would be also needed in case of selecting the configuration RS-assimilation, since in this case the setup of an operational processing chain for NDVI data would be needed. In any case, al the activities involved with transferring the system to an operational service could not exceed 20-30 thousand dollars, including the server purchase and the setup of the operational NDVI processing chain.
3.3. Resources needed to operationally provide the monitoring/forecasting service
Concerning the operational run of the monitoring/system, the resources needed are related with the cost of a trained analyst and of an IT person with the role of supporting/supervising the analyst. For the analyst, 20% of his/her time will be likely needed (checking the automatic routines for updating the database, running the simulations, producing the forecasts, commenting/presenting results). For the IT person, the allocation of time on this activity will depend on the BioMA configuration adopted and, thus, on the possible need of managing a server. In case of installing the platform on a standard computer (configurations Base and Diseases), the role of the IT person would be limited to support the installation of the platform and to link the BioMA database to the proper weather data source. In case the platform would be installed on a server, the IT person would have a key role in maintaining the server itself, as well as the database.
3.4. Possibility to maintain/extend the system in the future
Regardless of the BioMA configuration selected, the most demanding activity to properly maintain the system is involved with the adaptation of the parameters of the three models to allow them reproducing the behaviour of ne (improved) genotypes that will likely be present in the future. This activity requires high-level specific skills. However, the calibrations carried out during the project will ensure the system to be operational without further parameterizations for several years.
Operational Plans for two study regions (E-AGRI GA Nr. 270351)
D71.4_Operational_Plans_For_Two_Study_Regions Page 18 of 20
In case of using the BioMA configurations Base and Diseases, the crop calendars (i.e., the sowing dates) should be updated periodically (each 5-6 years) to ensure the system to be coherent with changes in the way the underlying system is managed. This activity is not needed in case of using the configuration RS-assimilation, since in this case spatially distributed sowing dates are derived each year using NDVI profiles. The design of the BioMA platform has been developed by targeting the extensibility of the system, even by third parties. Both the application and the database could be improved in the future (e.g., for the simulation of specific processes, or via refined calibrations) and/or extended by including the simulation of processes currently not included (e.g., pests). However, these kind of activities – although made possible by the BioMA software architecture – require a deep knowledge of the platform and of the way framework and components interact.
Operational Plans for two study regions (E-AGRI GA Nr. 270351)
D71.4_Operational_Plans_For_Two_Study_Regions Page 19 of 20
4. Wheat monitoring and yield forecasting in Morocco
The tests performed using BioMA for monitoring/forecasting wheat yields in Morocco provided performances slightly less satisfying than those achieved for rice in Jiangsu at National level (see Deliverables D35.2 “Assessment report on the multi‐model approach for wheat monitoring and yield forecasting in Morocco” and D35.3 “Evaluation report on the integration of RS data in BioMA models”). However, the reliability of in season predictions – especially for some of the Moroccan regions where existing forecasting systems already operational in Morocco are unsatisfying – suggests a pre-operational implementation of the service, to be run in parallel with the others. This would allow to benefit for the conditions where available systems are affected by a high level of uncertainty while refining BioMA in view of a fully operational use of the platform. This is what Moroccan partners asked at the end of the project. The procedure for the installation of the platform is detailed – together with all the information needed to link to local data sources – in the Deliverable D35.4 “Guide of BioMA platform for local wheat monitoring application in Morocco”. The source of weather updated data used during the project comes from the EC-JRC MARS database. This source can be used for a pre-operational use of the platform. However, Moroccan partners suggested to improve the spatial resolution and the quality of the weather information by linking the Moroccan release of the BioMA platform to the weather data collected and interpolated by the new Moroccan agrometeorological network of stations. This activity would not require additional resource, since the Moroccan database is already operational and database administrators are already dedicated to its maintenance. The same situation can be discussed in case of using the BioMA configuration based on the assimilation of remote sensing data: even in this case, the operational chain for processing NDVI data is already in place.
Operational Plans for two study regions (E-AGRI GA Nr. 270351)
D71.4_Operational_Plans_For_Two_Study_Regions Page 20 of 20
5. Conclusions The E-AGRI project aims to transfer and adapt the European Crop Monitoring Technologies in to two developing regions. The project targets a development goal at pre-piloting level. Practically, all transferred technologies will be operational when the local input data and institutional support are available. However, several technologies have already become operational, thanks to the support from local governments and the collaboration between the local scientific and technical institutes. These are the cases for CGMS application in Morocco, BioMA application on Jianghuai Plain, the crop yield forecasting using remote sensing in both Morocco and Huaibei Plain. Other application at operational level needs to be further supported by local government, or by collaboration between local institutions, such as the case for CGMS operation in Anhui. The application of BioMA in Morocco showed important progress but it needs more regional approach. In some agro-environmental zones or provinces, the BioMA application performs better than other technologies such as remote sensing based forecasting or CGMS agro-meteorological prediction.