Operational plan: McDonald Lake escapement and limnology ... · Piston, A. W., and M. T. Brunette....
24
Regional Operational Plan CF.1J.2013.06 Operational Plan: McDonald Lake Escapement and Limnology Sampling, 2013 by Andrew W. Piston and Malika T. Brunette August 2013 Alaska Department of Fish and Game Divisions of Sport Fish and Commercial Fisheries 1
Transcript of Operational plan: McDonald Lake escapement and limnology ... · Piston, A. W., and M. T. Brunette....
Regional Operational Plan CF.1J.2013.06
Operational Plan: McDonald Lake Escapement and Limnology Sampling, 2013
by
Andrew W. Piston
and
Malika T. Brunette
August 2013
Alaska Department of Fish and Game Divisions of Sport Fish and Commercial Fisheries
1
Symbols and Abbreviations The following symbols and abbreviations, and others approved for the Système International d'Unités (SI), are used without definition in the following reports by the Divisions of Sport Fish and of Commercial Fisheries: Fishery Manuscripts, Fishery Data Series Reports, Fishery Management Reports, and Special Publications. All others, including deviations from definitions listed below, are noted in the text at first mention, as well as in the titles or footnotes of tables, and in figure or figure captions. Weights and measures (metric) centimeter cm deciliter dL gram g hectare ha kilogram kg kilometer km liter L meter m milliliter mL millimeter mm Weights and measures (English) cubic feet per second ft3/s foot ft gallon gal inch in mile mi nautical mile nmi ounce oz pound lb quart qt yard yd Time and temperature day d degrees Celsius °C degrees Fahrenheit °F degrees kelvin K hour h minute min second s Physics and chemistry all atomic symbols alternating current AC ampere A calorie cal direct current DC hertz Hz horsepower hp hydrogen ion activity pH (negative log of) parts per million ppm parts per thousand ppt, ‰ volts V watts W
General Alaska Administrative Code AAC all commonly accepted abbreviations e.g., Mr., Mrs.,
AM, PM, etc. all commonly accepted professional titles e.g., Dr., Ph.D., R.N., etc. at @ compass directions:
east E north N south S west W
copyright corporate suffixes:
Company Co. Corporation Corp. Incorporated Inc. Limited Ltd.
District of Columbia D.C. et alii (and others) et al. et cetera (and so forth) etc. exempli gratia (for example) e.g. Federal Information Code FIC id est (that is) i.e. latitude or longitude lat. or long. monetary symbols (U.S.) $, ¢ months (tables and figures): first three letters Jan,...,Dec registered trademark trademark United States (adjective) U.S. United States of America (noun) USA U.S.C. United States
Code U.S. state use two-letter
abbreviations (e.g., AK, WA)
Mathematics, statistics all standard mathematical signs, symbols and abbreviations alternate hypothesis HA base of natural logarithm e catch per unit effort CPUE coefficient of variation CV common test statistics (F, t, χ2, etc.) confidence interval CI correlation coefficient (multiple) R correlation coefficient (simple) r covariance cov degree (angular ) ° degrees of freedom df expected value E greater than > greater than or equal to ≥ harvest per unit effort HPUE less than < less than or equal to ≤ logarithm (natural) ln logarithm (base 10) log logarithm (specify base) log2, etc. minute (angular) ' not significant NS null hypothesis HO percent % probability P probability of a type I error (rejection of the null hypothesis when true) α probability of a type II error (acceptance of the null hypothesis when false) β second (angular) " standard deviation SD standard error SE variance population Var sample var
REGIONAL OPERATIONAL PLAN CF.1J.2013.06
OPERATIONAL PLAN: MCDONALD LAKE ESCAPEMENT AND LIMNOLOGY SAMPLING, 2013
by
Andrew W. Piston and Malika T. Brunette
Alaska Department of Fish and Game, Division of Commercial Fisheries, Ketchikan
Alaska Department of Fish and Game Division of Commercial Fisheries
August 2013
The Regional Operational Plan Series was established in 2012 to archive and provide public access to operational plans for fisheries projects of the Divisions of Commercial Fisheries and Sport Fish, as per joint-divisional Operational Planning Policy. Documents in this series are planning documents that may contain raw data, preliminary data analyses and results, and describe operational aspects of fisheries projects that may not actually be implemented. All documents in this series are subject to a technical review process and receive varying degrees of regional, divisional, and biometric approval, but do not generally receive editorial review. Results from the implementation of the operational plan described in this series may be subsequently finalized and published in a different department reporting series or in the formal literature. Please contact the author if you have any questions regarding the information provided in this plan. Regional Operational Plans are available on the Internet at: http://www.adfg.alaska.gov/sf/publications/
Andrew W. Piston and Malika T. Brunette, Alaska Department of Fish and Game, Division of Commercial Fisheries,
2030 Sea Level Drive, Suite 205, Ketchikan, Alaska 99901
This document should be cited as: Piston, A. W., and M. T. Brunette. 2013. Operational plan: McDonald Lake escapement and limnology sampling
2013. Alaska Department of Fish and Game, Division of Commercial Fisheries, Regional Operational Plan ROP.CF1J.2013.06, Ketchikan.
The Alaska Department of Fish and Game (ADF&G) administers all programs and activities free from discrimination based on race, color, national origin, age, sex, religion, marital status, pregnancy, parenthood, or disability. The department administers all programs and activities in compliance with Title VI of the Civil Rights Act of 1964, Section 504 of the Rehabilitation Act of 1973, Title II of the Americans with Disabilities Act (ADA) of 1990, the Age Discrimination Act of 1975, and Title IX of the Education Amendments of 1972.
If you believe you have been discriminated against in any program, activity, or facility please write: ADF&G ADA Coordinator, P.O. Box 115526, Juneau, AK 99811-5526
U.S. Fish and Wildlife Service, 4401 N. Fairfax Drive, MS 2042, Arlington, VA 22203 Office of Equal Opportunity, U.S. Department of the Interior, 1849 C Street NW MS 5230, Washington DC 20240
The department’s ADA Coordinator can be reached via phone at the following numbers: (VOICE) 907-465-6077, (Statewide Telecommunication Device for the Deaf) 1-800-478-3648,
(Juneau TDD) 907-465-3646, or (FAX) 907-465-6078 For information on alternative formats and questions on this publication, please contact:
ADF&G, Division of Sport Fish, Research and Technical Services, 333 Raspberry Rd, Anchorage AK 99518 (907) 267-2375
25
i

ii
TABLE OF CONTENTS LIST OF TABLES........................................................................................................................................................iii
LIST OF FIGURES ......................................................................................................................................................iii
LIST OF APPENDICES .............................................................................................................................................. iv
PURPOSE...................................................................................................................................................................... 1
OBJECTIVES ................................................................................................................................................................ 1 BACKGROUND ........................................................................................................................................................... 1
STUDY SITE ................................................................................................................................................................ 2
METHODS .................................................................................................................................................................... 4
Escapement Estimate ..................................................................................................................................................... 4 Age, Sex, and Length Sampling: ................................................................................................................................... 4 Otolith Sampling............................................................................................................................................................ 4 McDonald Lake Juvenile Sockeye Population Estimate ............................................................................................... 7 Limnological Sampling ................................................................................................................................................. 8
Water Temperature, Clarity, and Chemistry Sampling ............................................................................................. 8 Zooplankton Sampling .............................................................................................................................................. 8
DATA ANALYSIS ....................................................................................................................................................... 8
Escapement Estimate ..................................................................................................................................................... 8 Length, Sex, and Scale Sampling: ................................................................................................................................. 9 Otolith Sampling............................................................................................................................................................ 9 McDonald Lake Juvenile Sockeye Population Estimate ............................................................................................. 10 Limnology sampling .................................................................................................................................................... 10
Water Temperature, Clarity, and Chemistry Sampling ........................................................................................... 10 Zooplankton Sampling ............................................................................................................................................ 11
SCHEDULE AND DELIVERABLES ........................................................................................................................ 11
RESPONSIBILITIES .................................................................................................................................................. 11
REFERENCES CITED ............................................................................................................................................... 12
LIST OF TABLES Table Page 1. Annual foot survey counts of sockeye salmon at McDonald Lake, 1979–2007. ............................................. 7
LIST OF FIGURES Figure Page 1. Map of McDonald Lake and its location with respect to Ketchikan and Southeast Alaska, and the
location of limnology sampling stations A, B, C, and D. ................................................................................ 3 2. Mean timing of McDonald Lake sockeye salmon spawning based on historic foot survey estimates,
1979–2007. ...................................................................................................................................................... 6
iii

LIST OF APPENDICES Appendix Page A. Escapement sampling data analysis. .............................................................................................................. 16
iv

PURPOSE The primary purpose of this project will be to estimate the spawning escapement of sockeye salmon at McDonald Lake. We will also estimate the proportion of otolith-marked, stocked fish on the spawning grounds at Hatchery Creek, which is critical for assessment of Southern Southeast Regional Aquaculture Association’s (SSRAA) sentinel fish stocking program. This stocking program was intended to provide estimates of the timing, location, and magnitude of the commercial harvest of McDonald Lake sockeye salmon in southern Southeast Alaska fisheries. This project also supports collection of water chemistry and zooplankton data at the lake, and fall hydroacoustic surveys to estimate juvenile sockeye salmon abundance. Key words: Hatchery Creek, hydroacoustic survey, lake stocking, McDonald Lake, Oncorhynchus nerka, otolith,
sockeye salmon, zooplankton.
OBJECTIVES 1. Estimate the sockeye salmon spawning escapement at McDonald Lake using a calibrated
peak foot survey estimate. 2. Estimate the age, length, and sex composition of adult sockeye salmon at McDonald
Lake so that the estimated proportion of each age class is within 5% of the true value with at least 95% probability.
3. Estimate the proportion of wild and stocked adult sockeye salmon on the spawning grounds in Hatchery Creek so that the point estimate of the proportion of hatchery fish in the escapement will be in error by less than 5% of the true value with at least 95% probability.
4. Test whether stocked fish are evenly distributed throughout the stream at a 5% level of significance.
5. Estimate the rearing fall fry population at McDonald Lake through a species-apportioned hydroacoustic estimate of fish abundance such that the estimated coefficient of variation of estimated total fish targets in the lake is no greater than 15%.
6. Record water temperatures from the lake surface to 50 m, collect light intensity profiles, and collect water samples for chemical analysis on a monthly basis at McDonald Lake from May to October using established ADF&G limnology sampling procedures.
7. Estimate seasonal zooplankton abundance and species composition using established ADF&G limnological sampling procedures.
BACKGROUND The McDonald Lake sockeye salmon (Oncorhynchus nerka) run is one of the largest in southern Southeast Alaska and contributes substantially to the commercial net fisheries in Sumner Strait, Clarence Strait, and West Behm Canal (Johnson et al. 2005). McDonald Lake sockeye salmon are also harvested in a personal-use fishery near the mouth of Wolverine Creek (the outlet stream), in Yes Bay, and in the fresh water sport fishery. Sockeye salmon escapements to McDonald Lake averaged more than 90,000 fish a year in the 1980s and 1990s (Johnson et al. 2005). From 1982 to 2004, McDonald Lake was enhanced through lake fertilization (Johnson et al. 2005).
The sockeye salmon escapement to McDonald Lake was estimated through weir counts from 1981 to 1984, and, from 1985 to 2007, through a foot-survey method based on calibrations from
1
the 1983 and 1984 weir counts (Johnson et al. 2005). From 2005 to 2007, the department conducted a project to improve the escapement estimation at McDonald Lake through comparison of weir counts (1981, 1983, and 1984) and mark-recapture estimates (2005, 2006, and 2007) to peak foot surveys conducted in those years (Heinl et al. 2008 and 2009). These new studies allowed the department to re-cast estimated escapements based on the peak annual foot survey, and to update the escapement goal using spawner-recruit methods (Eggers et al. 2009). The current sustainable escapement goal at McDonald Lake is 55,000–120,000 sockeye salmon.
McDonald Lake escapements were within or above the current escapement goal range in all but two years from 1980 to 2001. From 2001 to 2008 the run declined, despite lake fertilization, and estimated escapements were below the sustainable escapement goal range in six of eight years. In 2009, the Alaska Board of Fisheries formally recognized McDonald Lake sockeye salmon as a stock of management concern based on recommendations by the Alaska Department of Fish and Game (Eggers et al. 2009). The board adopted an action plan (Bergmann et al. 2009) to reduce harvests of McDonald Lake sockeye salmon through time and area closures in nearby commercial fisheries. The action plan also outlined potential research projects designed to improve stock assessment of McDonald Lake sockeye salmon. Escapements increased from 2009 to 2012, including escapements within the escapement goal range in 2010 and 2011 (Heinl et al. 2011), and the McDonald Lake run was de-listed as a stock of management concern at the 2012 Alaska Board of Fisheries meeting.
The impact of the 1982–2004 lake fertilization project at McDonald Lake is unknown. Only two years of comprehensive limnological data exist from pre-fertilization years (1980 and 1981)—not enough information with which to adequately assess the affect lake fertilization might have had on sockeye salmon production (Olson 1989, Johnson et al. 2005, Eggers et al. 2009). In order to obtain information about the lake water chemistry and zooplankton populations in an unfertilized state, basic limnological data were again collected annually starting in 2009.
Prior to the stock of concern designation, Southern Southeast Regional Aquaculture Association (SSRAA) initiated a stocking program designed to update and improve estimates of the timing, location, and magnitude of the commercial harvest of McDonald Lake sockeye salmon. ADF&G permitted SSRAA to take up to 450,000 eggs annually from the McDonald Lake sockeye salmon run for three years, 2007–2009. These fish were reared to full-term smolt at SSRAA’s Burnett Inlet Hatchery and returned to McDonald Lake in the springs of 2009–2011. The full-term smolt were placed into net pens located at the mouth of Hatchery Creek and held for up to one day prior to release. The fish were expected to immediately smolt after imprinting on the spawning creek. All stocked fish were thermally marked, allowing them to be tracked through the fisheries when they return as adults in 2011–2014. (Sampling fisheries for otolith-marked McDonald Lake sockeye salmon will be conducted through a separate study.) Here we outline our sampling methods for estimating the size and age-length-sex composition of the sockeye salmon escapement, estimating the proportion of otolith-marked fish in the escapement, and for conducting limnological sampling at McDonald Lake.
STUDY SITE McDonald Lake (55° 58’ N, 131° 50’ W; Orth 1967) is located on the northeast side of Cleveland Peninsula, 70 km north of Ketchikan, Southeast Alaska (Figure 1). The lake is organically stained with a surface area of 420 ha, mean depth of 45.6 m, maximum depth of 110 m, and volume of 197×106 m3. The primary spawning stream, Hatchery Creek (ADF&G
2
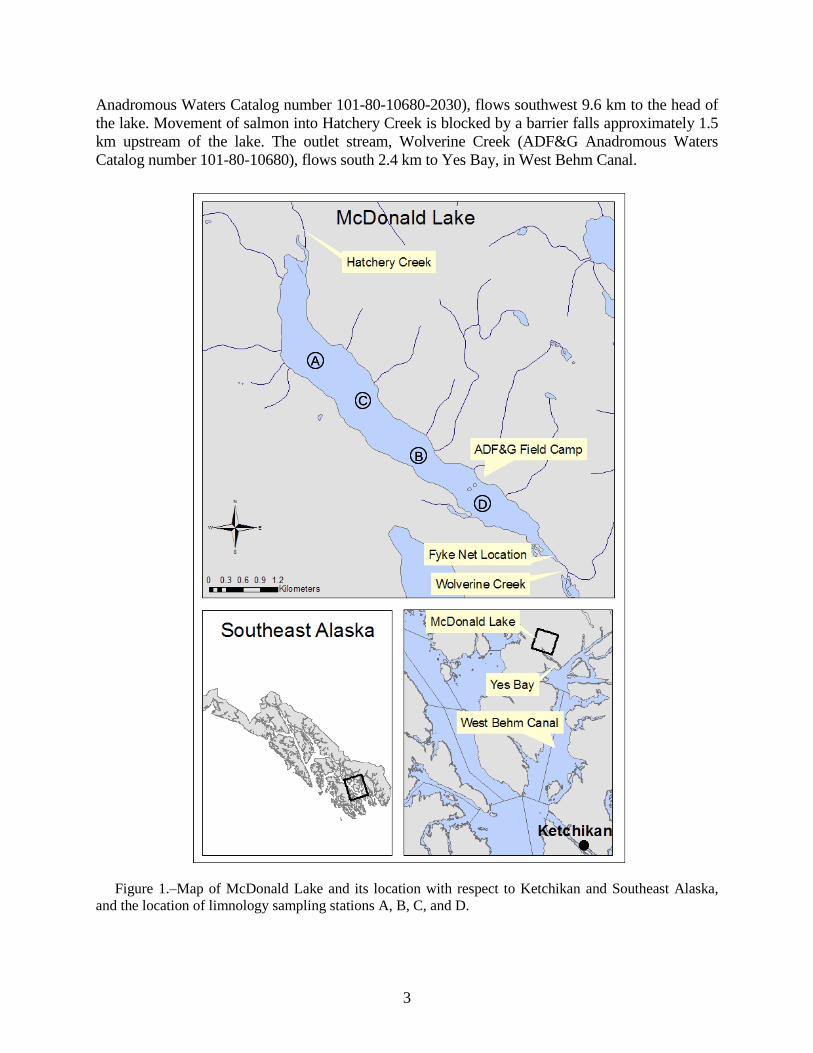
Anadromous Waters Catalog number 101-80-10680-2030), flows southwest 9.6 km to the head of the lake. Movement of salmon into Hatchery Creek is blocked by a barrier falls approximately 1.5 km upstream of the lake. The outlet stream, Wolverine Creek (ADF&G Anadromous Waters Catalog number 101-80-10680), flows south 2.4 km to Yes Bay, in West Behm Canal.
Figure 1.–Map of McDonald Lake and its location with respect to Ketchikan and Southeast Alaska,
and the location of limnology sampling stations A, B, C, and D.
D
C
A
B
D
C
A
B
D
C
A
B
3
METHODS ESCAPEMENT ESTIMATE The McDonald Lake sockeye salmon escapement will be estimated using a peak foot survey model outlined in Heinl et al. (2009; Model P1). The peak survey count will be determined from three foot surveys of the spawning grounds conducted on approximately the 10th, 20th, and 28th of September; additional foot surveys will be conducted on sampling trips to collect scales and otoliths. The spawning area is defined as 1.5 km of Hatchery Creek from just upstream of the mouth (GPS coordinates: 55.992° N, 131.844° W) to a location just downstream of the barrier falls (GPS coordinates: 56.002° N, 131.840° W) and includes the old hatchery side channel on the lower section of the creek. Two or three experienced observers will conduct the surveys simultaneously and estimate the number of live and dead fish (of all species) in the study area. The number of live sockeye salmon present will be estimated as the average of the counts of all experienced surveyors. Survey data will be entered into the ADF&G Southeast Integrated Fisheries database at the end of the field season.
AGE, SEX, AND LENGTH SAMPLING: The age composition of the sockeye salmon escapement at McDonald Lake will be determined from a minimum of 800 scale samples collected from live and dead fish in Hatchery Creek over the course of the spawning season. The sample size was selected based on work by Thompson (1992) for calculating a sample size to estimate several proportions simultaneously. A sample size of 510 fish is needed to ensure the estimated proportion of each adult sockeye salmon age class would be within 5% of the true value with at least 95% probability. We increased our scale sampling goal to 800 samples to ensure the sample size target would be met, even if approximately 35% of the samples are unreadable. Length, from mideye to tail fork, and sex will be recorded for each fish sampled. Three scales will be collected from the preferred area of the fish (i.e., the left side of the fish, two scale rows above the lateral line on the diagonal from the posterior insertion of the dorsal fin to the anterior insertion of the anal fin; INPFC 1963), placed on a gum card, and prepared for analysis as described by Clutter and Whitesel (1956).
OTOLITH SAMPLING We will estimate the proportion of stocked fish in the escapement at Hatchery Creek, the primary spawning tributary at McDonald Lake. Otolith samples will be collected from carcasses throughout the spawning season and the length of the stream, which will be divided into two sampling areas. The lower stream section will extend from the mouth of Hatchery Creek to a point approximately 0.5 km upstream (to the area where egg takes occurred in the fall). The remaining 1.0 km of the stream above that point will be considered the upper stream section. We will test for differences in the proportion of stocked fish in upper and lower Hatchery Creek to determine if stocked fish are distributed throughout the stream. We will also conduct opportunistic surveys of the lake and outlet stream to look for evidence of sockeye salmon milling about in unsuitable spawning habitat. It is possible that some stocked fish may not home to the spawning stream as was observed during a similar stocking project at Hugh Smith Lake (Piston et al. 2007). Although it will be impossible to determine the ultimate fate of any stocked fish that do not return to Hatchery Creek, the equal distribution of stocked fish in the creek and lack of any visual evidence of ripe fish milling in unsuitable spawning areas would provide some level of confidence that the majority of stocked fish returned to and spawned in Hatchery Creek
4
as anticipated. If stocked fish appear to be distributed similarly to wild fish we will be able to calculate the number of stocked fish in the escapement and use this information, in conjunction with data from the fisheries sampling program, to calculate harvest and survival rates for stocked fish. In addition, the harvest rates on stocked fish could be used as a proxy for harvest rates of wild fish.
The left and right sagittal otoliths will be removed from each fish and placed into a single cell of a labeled, plastic, 96-cell tray. Otoliths will later be cleaned by soaking in a 0.5% chlorine solution for no more than eight minutes, followed by a rinse in dechlorinating solution, and a rinse in tap water Hagen et al. (1995). Otolith samples will be processed and decoded by personnel of the ADF&G Commercial Fisheries Mark Laboratory, Juneau.
We want to estimate the proportion of hatchery fish in the escapement at Hatchery Creek so that we are 95% confident that the point estimate of the proportion of hatchery fish in the escapement will be in error by less than 5%. Sample size (n) for each of the two sampling regions will be calculated using methods described in Thompson (1992) by ignoring the finite population correction factor, because the sample size is small relative to population size:
( )2
2 1d
ppzn −= . (1)
The value of z will be 1.96, which is the upper 0.025 limit of the normal distribution, and d will be our maximum error tolerance of 5%. The proportion of hatchery fish in the escapement is unknown, so we use p = 0.5, which will ensure a sample size sufficient to meet our criteria no matter what the true proportion of hatchery fish is. Using this formula, we obtained a sample size of 384 fish per sampling area and 768 otoliths overall. We rounded the sampling goal to 400 otoliths per sampling area, which will ensure we meet our goal even if a small number of samples are unreadable.
Samples will be collected approximately every ten days, from the second week of September through the second week of October. We used historic foot survey counts of live sockeye salmon to apportion the samples by sampling date (Figure 2, Table 1). From 1979 to 2007, standardized foot surveys of Hatchery Creek were conducted to count live sockeye salmon over the entire spawning season, with surveys conducted on or near the same dates each year. The weekly otolith sample size was calculated by multiplying total sample size by the historic average proportion of fish counted for the sampling date. Because the weighting of samples was based on counts of live fish, we then shifted the otolith sampling goals later by one survey date to ensure the availability of dead fish to sample. Sampling goals for each sampling area on each sampling date are as follows: 36 samples on 10 September; 104 samples on 20 September; 128 samples on 28 September; 108 samples on 10 October; and 24 samples on 20 October.
5
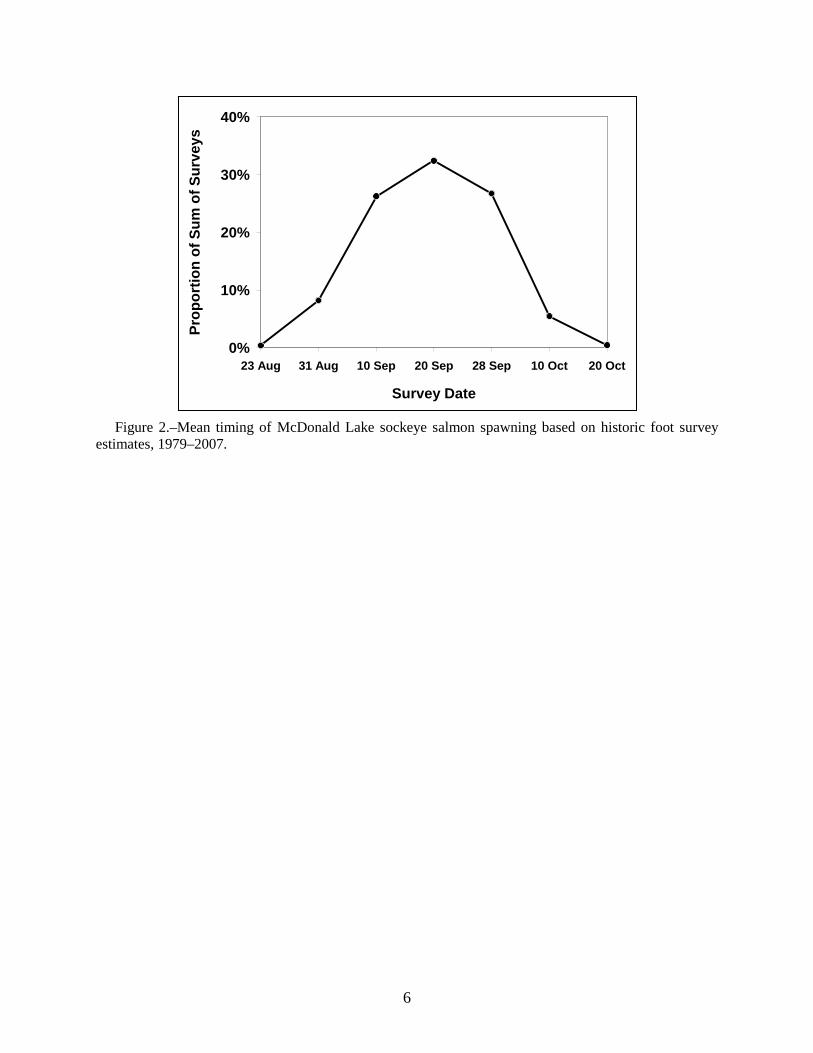
Figure 2.–Mean timing of McDonald Lake sockeye salmon spawning based on historic foot survey
estimates, 1979–2007.
0%
10%
20%
30%
40%
23 Aug 31 Aug 10 Sep 20 Sep 28 Sep 10 Oct 20 Oct
Survey Date
Prop
ortio
n of
Sum
of S
urve
ys
6
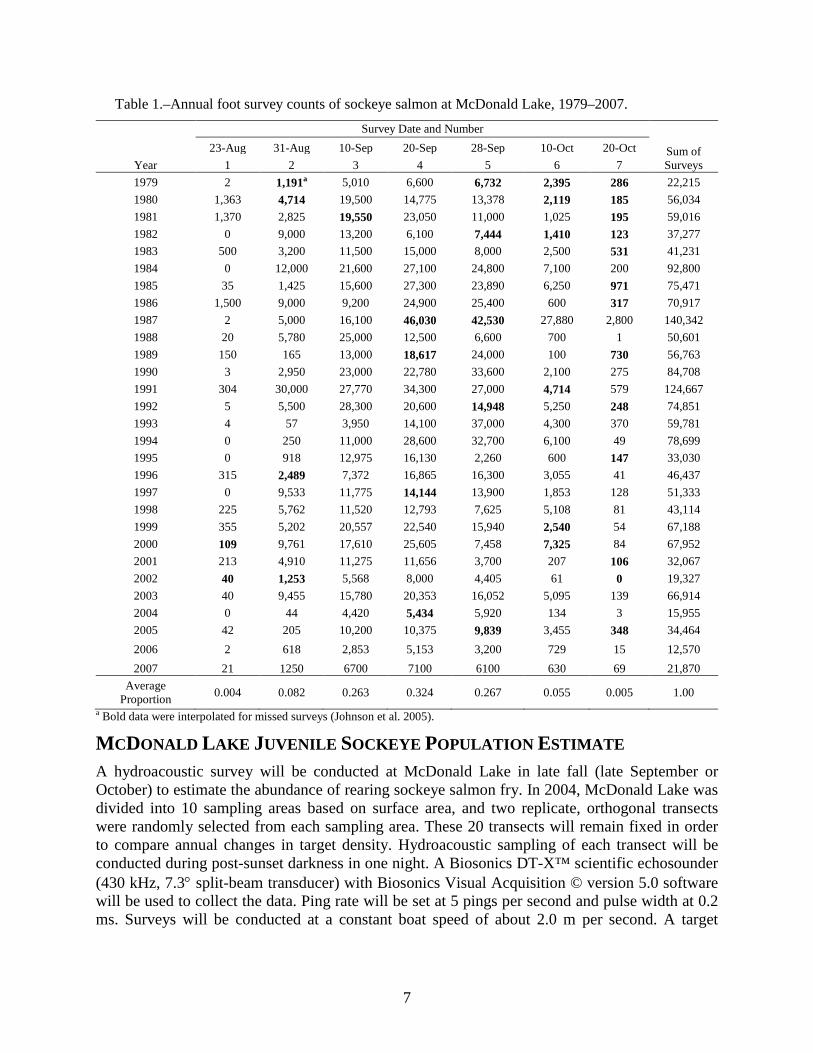
Table 1.–Annual foot survey counts of sockeye salmon at McDonald Lake, 1979–2007.
Year
Survey Date and Number
Sum of Surveys
23-Aug 31-Aug 10-Sep 20-Sep 28-Sep 10-Oct 20-Oct 1 2 3 4 5 6 7
1979 2 1,191a 5,010 6,600 6,732 2,395 286 22,215 1980 1,363 4,714 19,500 14,775 13,378 2,119 185 56,034 1981 1,370 2,825 19,550 23,050 11,000 1,025 195 59,016 1982 0 9,000 13,200 6,100 7,444 1,410 123 37,277 1983 500 3,200 11,500 15,000 8,000 2,500 531 41,231 1984 0 12,000 21,600 27,100 24,800 7,100 200 92,800 1985 35 1,425 15,600 27,300 23,890 6,250 971 75,471 1986 1,500 9,000 9,200 24,900 25,400 600 317 70,917 1987 2 5,000 16,100 46,030 42,530 27,880 2,800 140,342 1988 20 5,780 25,000 12,500 6,600 700 1 50,601 1989 150 165 13,000 18,617 24,000 100 730 56,763 1990 3 2,950 23,000 22,780 33,600 2,100 275 84,708 1991 304 30,000 27,770 34,300 27,000 4,714 579 124,667 1992 5 5,500 28,300 20,600 14,948 5,250 248 74,851 1993 4 57 3,950 14,100 37,000 4,300 370 59,781 1994 0 250 11,000 28,600 32,700 6,100 49 78,699 1995 0 918 12,975 16,130 2,260 600 147 33,030 1996 315 2,489 7,372 16,865 16,300 3,055 41 46,437 1997 0 9,533 11,775 14,144 13,900 1,853 128 51,333 1998 225 5,762 11,520 12,793 7,625 5,108 81 43,114 1999 355 5,202 20,557 22,540 15,940 2,540 54 67,188 2000 109 9,761 17,610 25,605 7,458 7,325 84 67,952 2001 213 4,910 11,275 11,656 3,700 207 106 32,067 2002 40 1,253 5,568 8,000 4,405 61 0 19,327 2003 40 9,455 15,780 20,353 16,052 5,095 139 66,914 2004 0 44 4,420 5,434 5,920 134 3 15,955 2005 42 205 10,200 10,375 9,839 3,455 348 34,464 2006 2 618 2,853 5,153 3,200 729 15 12,570 2007 21 1250 6700 7100 6100 630 69 21,870
Average Proportion 0.004 0.082 0.263 0.324 0.267 0.055 0.005 1.00
a Bold data were interpolated for missed surveys (Johnson et al. 2005).
MCDONALD LAKE JUVENILE SOCKEYE POPULATION ESTIMATE A hydroacoustic survey will be conducted at McDonald Lake in late fall (late September or October) to estimate the abundance of rearing sockeye salmon fry. In 2004, McDonald Lake was divided into 10 sampling areas based on surface area, and two replicate, orthogonal transects were randomly selected from each sampling area. These 20 transects will remain fixed in order to compare annual changes in target density. Hydroacoustic sampling of each transect will be conducted during post-sunset darkness in one night. A Biosonics DT-X™ scientific echosounder (430 kHz, 7.3° split-beam transducer) with Biosonics Visual Acquisition © version 5.0 software will be used to collect the data. Ping rate will be set at 5 pings per second and pulse width at 0.2 ms. Surveys will be conducted at a constant boat speed of about 2.0 m per second. A target
7
strength of –40 dB to –70 dB will be used to represent fish within the size range of juvenile sockeye salmon and other small pelagic fish.
A 2 m × 2 m elongated trawl net will be used for pelagic fish sampling. We will conduct at least two trawls at four different depths, ranging from near surface to 15 m, for a total of eight trawls at depth. The trawl depths and duration will be determined from observations of fish densities and distributions throughout the lake during the hydroacoustic survey. Fish will be counted by species and released.
LIMNOLOGICAL SAMPLING Limnological sampling (water temperature, clarity, and chemistry, and zooplankton) will be conducted on a monthly basis from May to October at four sampling stations in the lake (stations A, B, C, and D; Figure 1). All four sampling stations at McDonald Lake have been maintained in the same locations since 1979 (Zadina and Heinl 1999). Methods and protocols for sample collection and analysis were outlined by Koenings et al. (1987).
Water Temperature, Clarity, and Chemistry Sampling Water sampling will be conducted at stations A and B. Water temperature will be recorded at 1-m intervals from the lake surface to a depth of 50 m using a Handy Polaris meter. Measurements of underwater light penetration (in footcandles) will be taken at 0.5-m intervals from the surface to a depth equivalent to one percent of the subsurface (5 cm) light reading using an International Light submarine photometer. A Van Dorn sampler will be used to collect water quality samples from the epilimnion at the 1-m depth, and from the mid-hypolimnion. Five liters of water will be collected from each depth, stored in pre-cleaned polyethylene carboys, transported to Ketchikan, and frozen for laboratory analysis.
Zooplankton Sampling Zooplankton samples will be collected at stations A, B, C, and D using a 0.5-m diameter, 153-µm mesh conical net. Vertical zooplankton tows will be pulled from 50 m depth to the surface at a constant speed of 0.5 m per sec. The net will be rinsed prior to removing the organisms, and all specimens will be preserved in neutralized 10% formalin (Koenings et al. 1987).
DATA ANALYSIS ESCAPEMENT ESTIMATE The McDonald Lake escapement will be estimated using a simple peak survey model that is based on calibrating peak foot survey counts to six years of observed escapement (weir counts in 1981, 1983, and 1984; mark-recapture estimates 2005–2007; Heinl et al. 2009). The conversion factor from peak survey count to total escapement based on these years was approximately 4.8. The model was used to produce hind-cast estimates (or predictions) of the escapements in 1981, 1983, 1984, 2005, 2006, and 2007. We will calculate 80% confidence intervals for the estimated escapement (Zar 2010).
8
LENGTH, SEX, AND SCALE SAMPLING: Scale samples will be analyzed at the ADF&G salmon-aging laboratory in Douglas, Alaska. The weekly age distribution, the seasonal age distribution weighted by week, and the mean length by age and sex weighted by week will be calculated using equations from Cochran (1977; Appendix A).
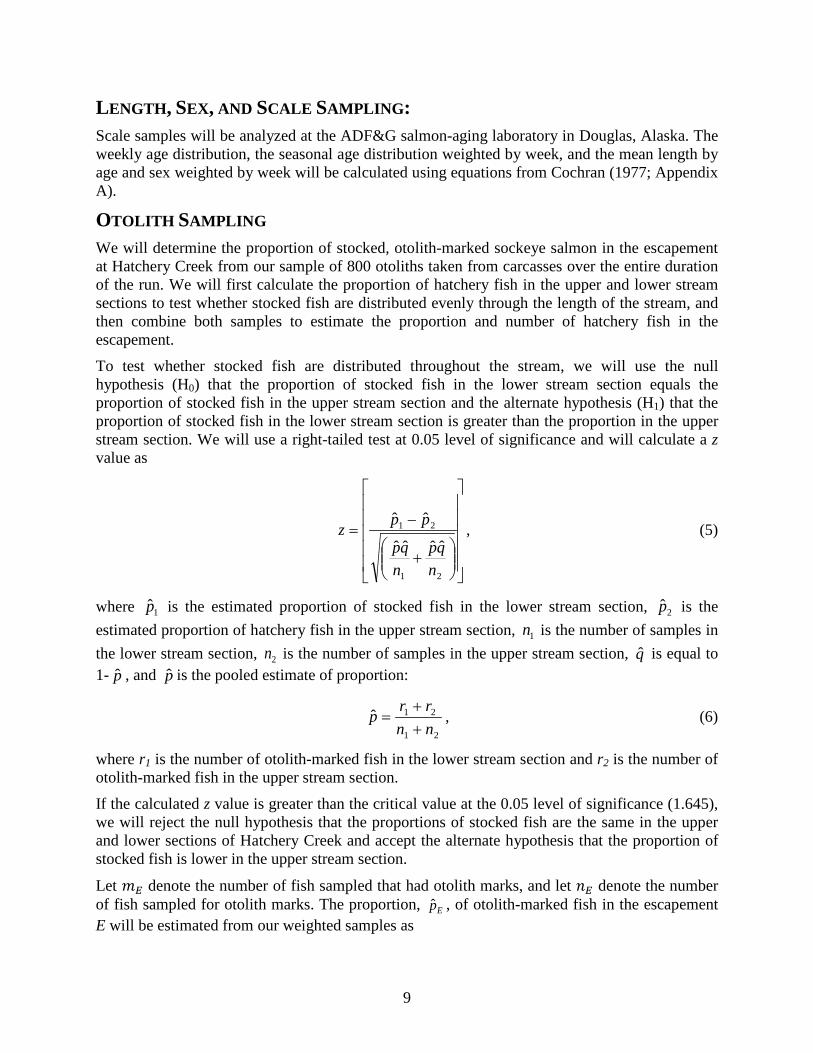
OTOLITH SAMPLING We will determine the proportion of stocked, otolith-marked sockeye salmon in the escapement at Hatchery Creek from our sample of 800 otoliths taken from carcasses over the entire duration of the run. We will first calculate the proportion of hatchery fish in the upper and lower stream sections to test whether stocked fish are distributed evenly through the length of the stream, and then combine both samples to estimate the proportion and number of hatchery fish in the escapement.
To test whether stocked fish are distributed throughout the stream, we will use the null hypothesis (H0) that the proportion of stocked fish in the lower stream section equals the proportion of stocked fish in the upper stream section and the alternate hypothesis (H1) that the proportion of stocked fish in the lower stream section is greater than the proportion in the upper stream section. We will use a right-tailed test at 0.05 level of significance and will calculate a z value as
+
−=
21
21
ˆˆˆˆ
ˆˆ
nqp
nqp
ppz , (5)
where 1p is the estimated proportion of stocked fish in the lower stream section, 2p is the estimated proportion of hatchery fish in the upper stream section, 1n is the number of samples in the lower stream section, 2n is the number of samples in the upper stream section, q is equal to 1- p , and p is the pooled estimate of proportion:
21
21ˆnnrrp
++
= , (6)
where r1 is the number of otolith-marked fish in the lower stream section and r2 is the number of otolith-marked fish in the upper stream section.
If the calculated z value is greater than the critical value at the 0.05 level of significance (1.645), we will reject the null hypothesis that the proportions of stocked fish are the same in the upper and lower sections of Hatchery Creek and accept the alternate hypothesis that the proportion of stocked fish is lower in the upper stream section.
Let 𝑚𝐸 denote the number of fish sampled that had otolith marks, and let 𝑛𝐸 denote the number of fish sampled for otolith marks. The proportion, Ep , of otolith-marked fish in the escapement E will be estimated from our weighted samples as
9
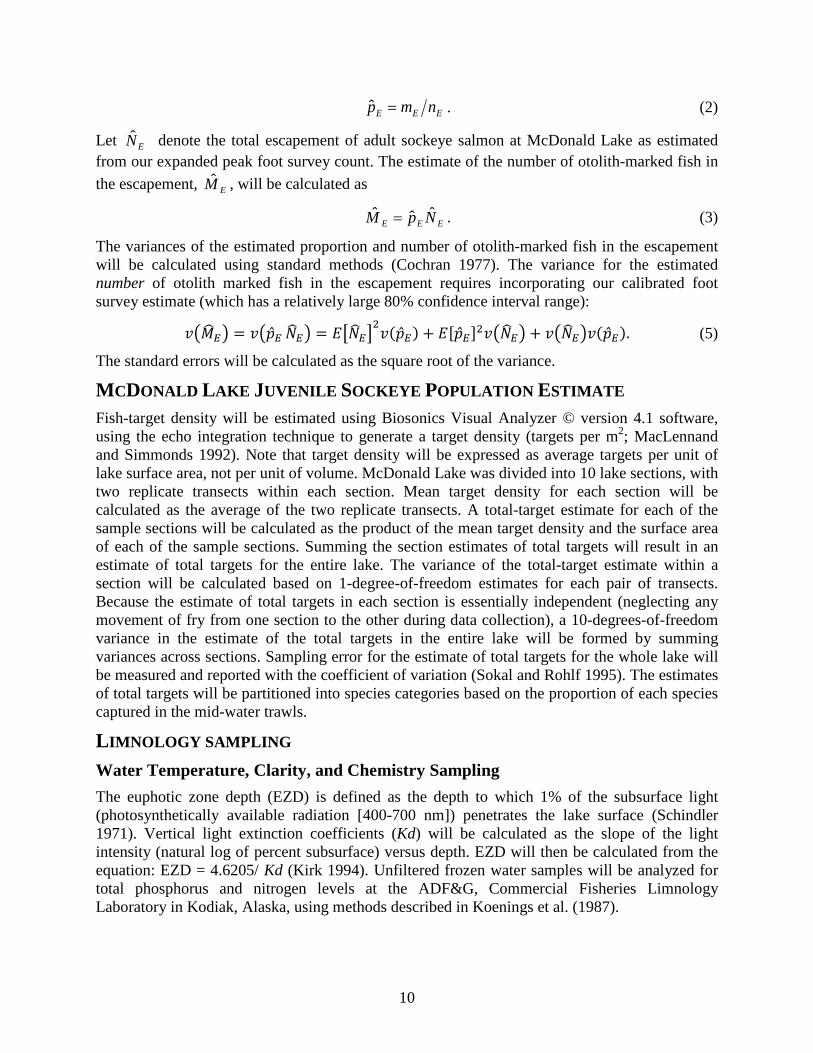
EEE nmp =ˆ . (2)
Let EN denote the total escapement of adult sockeye salmon at McDonald Lake as estimated from our expanded peak foot survey count. The estimate of the number of otolith-marked fish in the escapement, EM , will be calculated as
EEE NpM ˆˆˆ = . (3)
The variances of the estimated proportion and number of otolith-marked fish in the escapement will be calculated using standard methods (Cochran 1977). The variance for the estimated number of otolith marked fish in the escapement requires incorporating our calibrated foot survey estimate (which has a relatively large 80% confidence interval range):
𝑣�𝑀�𝐸� = 𝑣���𝐸 𝑁�𝐸� = 𝐸�𝑁�𝐸�2𝑣(��𝐸) + 𝐸[��𝐸]2𝑣�𝑁�𝐸� + 𝑣�𝑁�𝐸�𝑣(��𝐸). (5)
The standard errors will be calculated as the square root of the variance.
MCDONALD LAKE JUVENILE SOCKEYE POPULATION ESTIMATE Fish-target density will be estimated using Biosonics Visual Analyzer © version 4.1 software, using the echo integration technique to generate a target density (targets per m2; MacLennand and Simmonds 1992). Note that target density will be expressed as average targets per unit of lake surface area, not per unit of volume. McDonald Lake was divided into 10 lake sections, with two replicate transects within each section. Mean target density for each section will be calculated as the average of the two replicate transects. A total-target estimate for each of the sample sections will be calculated as the product of the mean target density and the surface area of each of the sample sections. Summing the section estimates of total targets will result in an estimate of total targets for the entire lake. The variance of the total-target estimate within a section will be calculated based on 1-degree-of-freedom estimates for each pair of transects. Because the estimate of total targets in each section is essentially independent (neglecting any movement of fry from one section to the other during data collection), a 10-degrees-of-freedom variance in the estimate of the total targets in the entire lake will be formed by summing variances across sections. Sampling error for the estimate of total targets for the whole lake will be measured and reported with the coefficient of variation (Sokal and Rohlf 1995). The estimates of total targets will be partitioned into species categories based on the proportion of each species captured in the mid-water trawls.
LIMNOLOGY SAMPLING Water Temperature, Clarity, and Chemistry Sampling The euphotic zone depth (EZD) is defined as the depth to which 1% of the subsurface light (photosynthetically available radiation [400-700 nm]) penetrates the lake surface (Schindler 1971). Vertical light extinction coefficients (Kd) will be calculated as the slope of the light intensity (natural log of percent subsurface) versus depth. EZD will then be calculated from the equation: EZD = 4.6205/ Kd (Kirk 1994). Unfiltered frozen water samples will be analyzed for total phosphorus and nitrogen levels at the ADF&G, Commercial Fisheries Limnology Laboratory in Kodiak, Alaska, using methods described in Koenings et al. (1987).
10
Zooplankton Sampling Zooplankton samples will be analyzed at the ADF&G, Commercial Fisheries Limnology Laboratory in Kodiak, Alaska. Cladocerans and copepods will be identified using the taxonomic keys of Brooks (1957), Pennak (1978), Wilson (1959), and Yeatman (1959). Zooplankton will be enumerated from three separate 1-ml subsamples taken with a Hensen-Stemple pipette and placed in a 1-ml Sedgewick-Rafter counting chamber. Zooplankton body length will be measured to the nearest 0.01 mm from at least 10 organisms of each species along a transect in each of the 1-ml subsamples using a calibrated ocular micrometer (Koenings et al. 1987). Zooplankton biomass will be estimated using species-specific dry weight versus zooplankter length regression equations (Koenings et al. 1987). The seasonal mean density and body size will be used to calculate the seasonal zooplankton biomass for each species. Macro-zooplankters will be further separated by sexual maturity where ovigorous (egg bearing) adults will also be identified.
SCHEDULE AND DELIVERABLES Water and zooplankton sampling will be conducted monthly from May through October. Escapement surveys and scale and otolith sampling on the spawning grounds will take place from early September through late October. The hydroacoustic survey will take place between late September and late October. A final report in the ADF&G Fisheries Data Series will be completed by the principle investigator when the project is completed in 2014. Information derived from this project will also be used in a stock status report on sockeye salmon in the form of an ADF&G Special Publication that will be produced at 3-year intervals (next due in fall 2014). These reports will be co-authored by Piston, Heinl, and Brunette; other co-authors may be added.
RESPONSIBILITIES Andrew W. Piston, Fishery Biologist III, Project Leader. Oversight of all aspects of project,
including planning, budgeting, sample design, permits, equipment, personnel, and training. Analyzes data and reports project results. Assists with fieldwork.
Malika T. Brunette, Fishery Biologist II, Project Leader. Assists with all aspects of the project, including operational planning, field work, data analysis, and technical report writing.
Kimberly A. Vicchy, Fish and Game Program Technician. Provides administrative support to the project and assists with field work.
Steven C. Heinl, Regional Research Coordinator. Assists with project operational planning, field work, and review of project report.
Haixue Shen, Biometrician II. Provides biometric review for the project.
11
REFERENCES CITED Bergmann, W .R, S. N. Forbes, S. C. Heinl, B. L. Meredith, A. W. Piston, and S. B. Walker. 2009. McDonald Lake
sockeye salmon action plan, 2009. Alaska Department of Fish and Game, Regional Information Report Series No. 1J09-03, Douglas, Alaska.
Brooks, J. L. 1957. The systematics of North American Daphnia. Mem. Conn. Acad. Arts. Sci. 13: 1–180.
Clutter, R., and L. Whitesel. 1956. Collection and interpretation of sockeye salmon scales. Bulletin of the International Pacific Salmon Fisheries Commission 9, New Westminster, British Columbia.
Cochran, W.G. 1977. Sampling techniques, 3rd Ed. John Wiley and Sons, New York.
Eggers, D. M., S. C. Heinl, and A. W. Piston. 2009. McDonald Lake: stock status and escapement goal recommendations, 2008. Alaska Department of Fish and Game, Fishery Data Series, No. 09-31, Anchorage.
Hagen, P, K. Munk, B. Van Alen, and B. White. 1995. Thermal mark technology for inseason fisheries management: a case study. Alaska Fishery Research Bulletin 2:143–155.
Heinl, S. C., A. W. Piston, T. A. Johnson, and H. J. Geiger. 2008. Sockeye salmon mark-recapture and radio-telemetry studies at McDonald Lake, 2005–2006. Alaska Department of Fish and Game, Fishery Data Series No. 08-42, Anchorage.
Heinl, S. C., D. M. Eggers, and A. W. Piston. 2009. Sockeye salmon mark-recapture and radio-telemetry studies at McDonald Lake in 2007. Alaska Department of Fish and Game, Fishery Data Series No. 09-42, Anchorage.
Heinl, S. C., R. L. Bachman, and K. Jensen. 2011. Sockeye salmon stock status and escapement goals in Southeast Alaska. Alaska Department of Fish and Game, Special Publication No. 11-20, Anchorage.
INPFC (International North Pacific Fisheries Commission). 1963. Annual report 1961. Vancouver, British Columbia.
Johnson T. A., S. C. Heinl, and H. J. Geiger. 2005. McDonald Lake: Stock status and escapement goal recommendations. Alaska Department of Fish and Game, Fishery Manuscript No. 05-07, Anchorage.
Kirk, J. T. O. 1994. Light and photosynthesis in aquatic ecosystems. Cambridge University Press. England.
Koenings, J. P., J. A. Edmundson, G. B. Kyle, and J. M. Edmundson. 1987. Limnology field and laboratory manual: methods for assessing aquatic production. Alaska Department of Fish and Game, Division of Fisheries Rehabilitation, Enhancement, and Development, Report No. 71, Juneau.
MacLennand, D. N., and E. J. Simmonds. 1992. Fisheries acoustics. Van Nostrand-Reinhold, New York.
Olson, R. P. 1989. Effects of lake fertilization on growth of juvenile sockeye salmon (Oncorhynchus nerka) in Lake McDonald, Tongass National Forest, Alaska. M.S. Thesis, Humboldt State University, Arcata.
Orth, D. J. 1967. Dictionary of Alaska place names. Geological Survey Professional Paper 567. United States Government Printing Office, Washington.
Pennak, R. W. 1978. Fresh-water invertebrates of the United States, 2nd ed., John Wiley and Sons, New York.
Piston, A. W., S. C. Heinl, and H. J. Geiger. 2007. Hugh Smith Lake sockeye salmon adult and juvenile studies, 2006. Alaska Department of Fish and Game, Fishery Data Series No. 07-58, Anchorage.
Sokal, R., and F. J. Rohlf. 1995. Biometry: the principles and practice of statistics in biological research. Freeman. New York.
Thompson, S. K. 2002. Sampling. Wiley-Interscience, New York.
Wilson, M. S. 1959. Calanoida. p. 738–794. In: W.T. Edmondson [ed.], Freshwater biology, 2nd ed., John Wiley and Sons, New York.
Yeatman, H. C. 1959. Cyclopoida. p. 795–815. In: W.T. Edmondson [ed.], Freshwater biology, 2nd ed., John Wiley and Sons, New York.
12

REFERENCES CITED (Continued) Zadina, T. P., and S. C. Heinl. 1999. Limnological and fisheries investigations at McDonald Lake, Southeast
Alaska, 1998. Alaska Department of Fish and Game, Division of Commercial Fisheries Regional Information Report No. 1J99-15.
13

14

APPENDIX
15

Appendix A.–Escapement sampling data analysis.
The weekly age-sex distribution, the seasonal age-sex distribution weighted by week, and the mean length by age and sex weighted by week, for smolt and adults, will be calculated using equations from Cochran (1977; pages 52, 107–108, and 142–144). Let
h = index of the stratum (week),
j = index of the age class,
phj = proportion of the sample taken during stratum h that is age j,
nh = number of fish sampled in week h, and
nhj = number observed in class j, week h.
Then the age distribution was estimated for each week of the escapement in the usual manner:
hhjhj nnp =ˆ . (1)
If Nh equals the number of fish in the escapement in week h, standard errors of the weekly age class proportions will be calculated in the usual manner (Cochran 1977, page 52, equation 3.12):
( ) ( )( ) [ ]hhh
hjhjhj Nn
npp
pSE −
−
−= 1
1ˆ1ˆ
ˆ . (2)
The age distributions for the total escapement will be estimated as a weighted sum (by stratum size) of the weekly proportions. That is,
( )NNpp hh
hjj ∑=ˆ , (3)
such that N equals the total escapement. The standard error of a seasonal proportion is the square root of the weighted sum of the weekly variances (Cochran 1977, pages 107–108):
( ) ( )[ ] ( )∑=h
jhhjj NNpSEpSE 22ˆˆ . (4)
The mean length, by sex and age class (weighted by week of escapement), and the variance of the weighted mean length, will be calculated using the following equations from Cochran (1977, pages 142–144) for estimating means over subpopulations. That is, let i equal the index of the individual fish in the age-sex class j, and yhij equal the length of the ith fish in class j, week h, so that,
( )
( )∑∑ ∑
=
hhjhh
h ihijhh
j nnN
ynNY , and (5)
( )( ) ( )
−
−+−
−−
=
∑∑
ijhj
h
hjhjhjhij
h hh
hhh
jj Yy
nn
nyynn
NnNN
YV2
22
2ˆ1
11
ˆ1ˆˆ .
16