Operational Evaluation of a New Acoustic Technique for … Filler Identification ESTCP Project...
30
FINAL REPORT Operational Evaluation of a New Acoustic Technique for UXO Filler Identification ESTCP Project MM-0740 OCTOBER 2009 Dr. Wesley Cobb University of Denver Approved for public release; distribution unlimited.
-
Upload
nguyenphuc -
Category
Documents
-
view
213 -
download
0
Transcript of Operational Evaluation of a New Acoustic Technique for … Filler Identification ESTCP Project...

FINAL REPORT Operational Evaluation of a New Acoustic Technique for
UXO Filler Identification
ESTCP Project MM-0740
OCTOBER 2009
Dr. Wesley Cobb University of Denver Approved for public release; distribution unlimited.

������������� ������ �� ������������� ��������������
�������������������������� ����������������
������������������� �������������������
������������
�������������������������������������������
�������������!����������������������������������
"����������������������������������������
�#���������!�������$�����������
�%��������������������
���������������!&�����������������
� ��������
�������'���������
�"���������������������������
� �����������������������������
������������ (�������� )����������
����������������������������
�*�+,�-,��.-/�� "����������������������� � ���������
������������������������������������������� ������ ����������� ����� !�� ������������������" ���������������������!��#���������������"�� �������$������� � �������"� ������� ��� ��� ��������� � ������" ������������ ����!��#������������������������ ����� �������������� �������������������� ���� ������ ����������������������� ������ ����" ��������� ����������� ��� �������� ��� ������" �� %�� ������ �� %������" & �������� '� �(� ����� ��!����" %������� �� ��� ������ ���� )��� ����� �� *������+,-,./,���0"�1�23��������% !��'���# " �����1,."���������"4�111,1/.�,1�*������������������ # ���� ����#����� ����� ���������!�������� #"���������� �������5����� ���� ������ ������������#��� ������������������ �������������������� ��������! ���)67��������������
���������������������������������������&���������
%���������&���������������
�(��������������
�)������������������������
�,������'����������
�0�����1�������
�2���3��1������������
�����������!�������$������������������������
����������������������������4
� (���������������������������������
October 14, 2009 Final February 2007 - October 2009
Operational Evaluation of a New Acoustic Technique for UXO FillerIdentification
ESTCP Project MM-0740
Univ. of Denver: 36347A
Wesley Cobb
University of Denver
Environmental Security Technology Certification Program901 North Stuart Street, Suite 303Arlington, VA 22203Phone: (703) 696-2117Fax: (703) 696-2114
Approved for public release: distribution is unlimited
The objective of this work is to demonstrate and validate a new technology to identify the filler material in UXO. Field tests wereconducted at an active test site (Vieques, Puerto Rico) to validate filler identification (ID) under field conditions. Unfortunately,these tests were disappointing because, even with the three month “set-aside” effort, the number of ordnance items in the correct sizerange was very limited. Over a total of about 10 field sites with smaller ordnance, we were able to test about 20 items.Unfortunately, many of these were very corroded and no acoustic signals were received at all through these items. The multi-yearESTCP field tests showed that, although the technology will not identify all ordnance types and filler materials, it provides a simple,low-cost way to ID some of the most common inert filler materials.
UXO, acoustic, filler, identification, remediation, ordance, munitions, clean-up
Unlimited Unlimited Unlimited UnlimitedDr. Wes Cobb
303 871-3140

1
Table of Contents
1.0 INTRODUCTION .................................................................................................................................. 4 1.1 BACKGROUND .............................................................................................................................. 4 1.3 REGULATORY DRIVERS ......................................................................................................... 5
2.0 TECHNOLOGY .............................................................................................................................. 5 2.1 TECHNOLOGY DESCRIPTION ................................................................................................ 5 2.2 ADVANTAGES AND LIMITATIONS OF THE TECHNOLOGY ............................................ 7
3.0 PERFORMANCE OBJECTIVES ................................................................................................... 9 3.1 OBJECTIVE: DETECTION OF GOOD SIGNALS FOR FILLER ID ........................................ 9
3.1.1 Metric ................................................................................................................................ 9 3.1.2 Data Requirements ............................................................................................................ 9 3.1.3 Success Criteria ................................................................................................................. 9
3.2 OBJECTIVE: CORRECT ID OF INERT-FILLED ITEMS ....................................................... 10 3.2.1 Metric .............................................................................................................................. 10 3.2.2 Data Requirements .......................................................................................................... 10 3.2.3 Success Criteria ............................................................................................................... 10
3.3 OBJECTIVE: EASE OF MOUNTING SENSORS .................................................................... 10 3.3.1 Metric .............................................................................................................................. 10 3.3.2 Data Requirements .......................................................................................................... 10 3.3.3 Success Criteria ............................................................................................................... 10
4.0 SITE DESCRIPTION ........................................................................................................................... 11 4.1 SITE SELECTION .......................................................................................................................... 11 4.2 SITE HISTORY (taken from reference [4]) ............................................................................... 11 4.3 MUNITIONS CONTAMINATION ........................................................................................... 12
5.0 TEST DESIGN ............................................................................................................................. 13 5.1 CONCEPTUAL EXPERIMENTAL DESIGN ........................................................................... 14 5.2 SITE PREPARATION ................................................................................................................ 14 5.3 SYSTEM SPECIFICATION ...................................................................................................... 14 5.4 CALIBRATION ACTIVITIES ....................................................................................................... 15 5.5 DATA COLLECTION PROCEDURES .................................................................................... 16 5.6 VALIDATION ............................................................................................................................ 16
6.0 DATA ANALYSIS PLAN ................................................................................................................... 17 6.1 PARAMETER ESTIMATION ................................................................................................... 17 6.4 TRAINING ...................................................................................................................................... 18 6.5 CLASSIFICATION .................................................................................................................... 18
7.0 PERFORMANCE ASSESSMENT ................................................................................................. 18 8.0 COST ASSESSMENT ......................................................................................................................... 25 9.0 IMPLEMENTATION ISSUES ....................................................................................................... 25 Appendix A: Points of Contact ................................................................................................................... 26 Appendix B: Sample data table ................................................................................................................... 27 10.0 REFERENCES ........................................................................................................................... 28
List of Tables
Table 1. Performance Objectives ............................................................................................................ 9 Table 2. Examples of ordnance types set aside for the acoustic tests ................................................... 13 Table 3. Summary of Operational Parameters ...................................................................................... 15 Table 4. Acoustic Test Results .............................................................................................................. 21 Table 5. Cost Model for the Acoustic Filler ID Technology ................................................................ 25

2
List of Figures
Figure 1 Sketch of the acoustic system for UXO filler identification ...................................................... 5 Figure 2 Sketch of the filler-identification system shown attached to an artillery shell .......................... 6 Figure 3 Example acoustic signal transmitted through the case of a cement filled, corroded 60 mm mortar ....................................................................................................................................................... 7 Figure 4. Location of the VNTR site .................................................................................................... 11 Figure 5 Munitions Response areas of VNTR ...................................................................................... 12 Figure 6 Photo of the sensor clamp attached to an 81mm inert-filled mortar. ....................................... 14 Figure 7 Data recording system with piggyback acoustic electronics ................................................... 15 Figure 8 Schematic of sensors attached to projectile body and ultrasonic waves passing through the case and filler ......................................................................................................................................... 17 Figure 9 EOD personnel clamping the acoustic sensors to a corroded 2.75” warhead. ......................... 18 Figure 10 Comparison of the average time taken to properly clamp the sensors to the ordnance items 19 Figure 11 Filler ID testing at an active response site (Vieques, PR) .................................................... 20 Figure 12 Number 8 - 2.75 inch shell found to be plaster filled. .......................................................... 21 Figure 13 Acoustic signal for plaster filled shell #8 ............................................................................. 22 Figure 14 Photograph of 18" diameter cement filled bomb (MK82, BDU-45) .................................... 22 Figure 15 Acoustic signal for 18" BDU-45 showing arrival at 136 microseconds .............................. 23 Figure 16 Plot of measured filler velocity for several ordnance items with varying sizes. .................. 23 Figure 17 Heavily corroded 76mm shell #12....................................................................................... 24 Figure 18 Illustration of the metal walls and flaking of a corroded case that has "burst open" ............ 24
List of Acronyms
ATC Aberdeen Test Center cm/usec centimeters per microsecond (sound velocity) COTS Commercial Off the Shelf DoD Department of Defense EOD Explosives Ordnance Disposal ESTCP Environmental Security Technology Certification Program HASP Health and Safety Plan HE high explosive HERO Hazard of Electromagnetic Radiation to Ordnance ID filler identification mm Millimeter m/sec meter per second MHz megahertz NSWC Naval Surface Warfare Center NAVEODTECHDIV Navy Explosive Ordnance Technology Division PELAN Pulsed Elemental Analysis with Neutrons PI Principle Investigator POP Plaster of Paris SERDP Strategic Environmental Research and Development Program UXO Unexploded ordnance VNTR Vieques Naval Training Range

3
ACKNOWLEDGMENTS Development of the acoustic identification technology under this project was performed by the staff at The University of Denver, Denver Research Institute. Key personnel included Dr. Wes Cobb, Sr. Research Scientist and Justin Wiley, Technical Specialist. Key government personnel included Dr. Jeffrey Marqusee, ESTCP executive director, Dr. Anne Andrews, ESTCP deputy director, Dr. Herb Nelson, Munitions Management Program Manager and their staff. Special thanks go to Mr. Tom Douglas, Lead Program Analyst at NAVEODTECHDIV for his help with the field testing of the technology. Mr. Larry Overbay and the staff at APG were responsible for the operation of the APG demonstration site. EXECUTIVE SUMMARY
The objective of this work is to demonstrate and validate a new technology to identify the filler material in UXO. This technology, developed under a two-year Strategic Environmental Research and Development Program (SERDP) program, has been tested at several Department of Defense (DoD) lab and range facilities. The ability to correctly identify important, inert, filler-types has been demonstrated on actual ordnance. The purpose of this ESTCP demonstration was to conduct field tests at an active test site to validate filler identification (ID) under field conditions. The acoustic technique was tested in March 2009 at an active remediation site in Vieques, Puerto Rico. Unfortunately, these tests were disappointing because, even with the three month “set-aside” effort, the number of ordnance items in the correct size range was very limited. During the test week, the acoustic system was moved from one site to another testing any items that were near the targeted size range. Over a total of about 10 field sites with smaller ordnance, we were able to test about 20 items. Unfortunately, many of these were very corroded and no acoustic signals were received at all through these items. The multi-year ESTCP field tests showed that, although the technology will not identify all ordnance types and filler materials, it provides a simple, low-cost way to ID some of the most common inert filler materials. The technology works best on fillers that are cast into the shell body and are intimately bonded to the metal walls. Thus, Plaster of Paris (POP), wax and cement fillers provide good signals for identification, whereas loose sand and gravel do not. Although signals for other cast filler materials have been measured, high explosive fillers do not provide strong signals for ID. Although corrosion reduces the amplitude of the received signals, good signals were received in the laboratory for a number of highly corroded items filled with cement and POP. However, as learned during the Vieques tests, the acoustic technique will not work for heavily corroded shells where the case has burst and swollen beyond the nominal outer diameter.
4
1.0 INTRODUCTION The objective of this work is to demonstrate and validate a new technology to identify the filler material in UXO. This technology, developed under a two-year Strategic Environmental Research and Development Program (SERDP) program, has been tested at several Department of Defense (DoD) lab and range facilities. The ability to correctly identify important, inert, filler-types has already been demonstrated on actual ordnance. During this demonstration, we conducted key field tests at the active test site to validate filler identification under field conditions for an non-intrusive investigation (e.g. surface UXO only). This report describes the objectives, technology description, demonstration design and performance assessment parameters for demonstrations conducted at the former Vieques Naval Training Range, Vieques, Puerto Rico (VNTR). 1.1 BACKGROUND The Department of Defense (DoD) needs better tools to help its personnel involved in remediation of unexploded ordnance (UXO) and non-hazardous items to more quickly and safely identify filler materials. This ability would significantly lower the dangers to personnel and the cost of remediation. This new filler identification (ID) technology utilizes acoustic waves to identify the materials inside sealed UXO. Acoustic waves are high-frequency pressure fluctuations that travel through materials (sound). Small sensors clamped to the outside of the ordnance item send low-energy acoustic waves through the shell walls and filler material. The received signals are processed to determine the characteristic acoustic properties of the filler material. These properties are then compared to a database of properties for known filler materials. Currently, no cost effective instrument is in routine use to identify the fillers in UXO. The proposed technology would permit personnel to quickly identify hazardous items, and optimize remediation efforts. Significant cost savings can be achieved through more efficient procedures and reduction of false identifications. Currently, 75 % of the costs associated with remediation of UXO contaminated sites are derived from excavating and mitigating non-hazardous targets. The only known technology being developed for filler identification relies on detection of gamma rays emitted by stimulating the ordnance item with a neutron beam. One system that uses this technology is termed Pulsed Elemental Analysis with Neutrons (PELAN). PELAN is a man-portable system for explosives detection, based on the principle that explosives contain various chemical elements such as H, C, N, O, etc. in quantities and ratios that differentiate them from other innocuous substances. Although PELAN can provide accurate filler identification for larger UXO, it often gives false readings for smaller ordnance because the signal from the explosive is overwhelmed by signals from the surrounding environment [1].

5
1.3 REGULATORY DRIVERS The Department of Defense is faced with significant costs for environmental restoration and compliance with environmental regulations for UXO. To remediate DOD sites, better tools are needed to discriminate between UXO and non-hazardous items. Although great effort has been expended to detect and localize UXO in the ground and underwater, there are currently few devices that can inspect and identify the filler materials. The ability to make a quick and safe identification would significantly lower the risks to personnel and the cost of remediation. In addition to improved speed and safety, the filler identification method must be non-intrusive and operate while the ordnance item is partially or completely uncovered. 2.0 TECHNOLOGY 2.1 TECHNOLOGY DESCRIPTION The filler ID technology utilizes acoustic waves to identify the materials inside sealed UXO. Acoustic waves are high frequency pressure fluctuations (sound) that travel through materials. As illustrated in Figure 1, small sensors clamped to the outside of the ordnance item send low-energy acoustic waves through the shell walls and filler material. The spring clamp holds the two acoustic sensors on either side of the casing while the waves are emitted and travel through the case and filler. The portable electronics receive the transmitted wave signal, make the acoustic measurements, and identify the filler material using a preset discrimination model.
Figure 1 Sketch of the acoustic system for UXO filler identification
Identity:Plaster
Handheld Meter
Acoustic Sensors
Filler Material
Separation Transducer
Spring Clamp
Filler Material
Ordnance Case
Identity:Plaster
Handheld Meter
Acoustic Sensors
Filler Material
Separation Transducer
Spring Clamp
Filler Material
Ordnance Case
6
As illustrated in Figure 2, the identification method works by matching field measurements of acoustic properties to those in a database of known filler materials. The best reliability is achieved when the filler properties are very specific, and do not vary significantly with manufacture or aging. The measurement of velocity and attenuation must also be accurate so that the acoustic properties of the material can be discriminated. The known properties of the case are also used in these calculations to remove the influence of the case. That way, the acoustic properties of the filler can be measured independently of the container.
Figure 2 Sketch of the filler-identification system shown attached to an artillery shell
The filler ID technology is based on non-invasive acoustic technology developed to characterize fluids traveling through pipes used in manufacturing processes [2]. Through an earlier SERDP project (UXO-1382, 2003-2005), this technology was adapted for use on solid-filled ordnance shells and the capability for material identification was demonstrated. The acoustic filler ID technology has been proven during a two-year SERDP program of device development and lab/test-site evaluation [3]. This project was a response to a Statement of Need for filler ID technology identified by SERDP for FY 2003. After the first prototype ID devices were developed, they were tested at three DOD test sites including the Naval Surface Warfare Center (NSWC Crane), Army Aberdeen Test Center (ATC), and the Navy Explosive Ordnance Technology Division (NAVEODTECHDIV). Ordnance items used in these tests included a wide variety of mortars and shells ranging in size from 60mm to 5"-38. Fillers included both inert and high explosive (HE) materials. Recently, the ability to identify buried, partially uncovered items was tested at NAVEODTECHDIV in November 2008. During the current ESTCP project, the sensor has been redesigned and the technology field-hardened for use on UXO for the demonstrations described here.
``````
Measure transit-time and signal
amplitude
Calculate filler velocityand attenuation
Match measured properties with
database
Sender Receiver
Top view ordnance case
Filler
AcousticWaves
diameter
thickness
sound speed
CASE
diameter
thickness
sound speed
CASE
Vel
ocity
Attenuation
Vel
ocity
Attenuation
Wax
Concrete
Plaster
MATCH
7
2.2 ADVANTAGES AND LIMITATIONS OF THE TECHNOLOGY The earlier SERDP tests showed that the technology provides a simple, low-cost way to identify some of the most common, small-ordnance filler materials. The technology works best on fillers that are cast into the shell body and are intimately bonded to the metal walls. In this case, the sound waves easily travel from one side of the shell, through the walls and center of the filler, and can be received on the opposite side. Thus, Plaster of Paris (POP) and cement fillers provide good signals for identification, whereas loose sand and gravel do not. A filler ID is only provided when signals with these characteristics are received. A “good” signal has characteristic features that distinguish it from noise signals. For inert materials, the signal received through the filler has characteristics that clearly differentiate it from the “case noise” that will always be present. Case noise is caused by acoustic waves that travel through the case walls only and do not enter the filler. These waves are considered noise because they do not provide any information useful to filler identification. There are two characteristics of a “good” received signal through the filler. First, the time signal must rapidly increase in amplitude from the baseline noise level to some high amplitude oscillation of at least a few cycles at the center frequency of the sensor. Figure 3 shows a good received signal for the 60 mm shell filled with cement. There is a very small amount of case noise just before the clear, abrupt rise in the signal when the filler waves arrive at the receiver (near 1600 samples). Second, the received signal often has the form of multiple echoes occurring at equal time delays after the first cycles of the filler wave. These multiple echoes are caused by waves that reflect within the walls of the case near the transmitting sensor. As the waves reflect, some wave energy is transmitted into the filler and follow after the direct wave. In contrast, case-noise signals never have the unique “equal time spacing” characteristic of the “good” filler signal.
Figure 3 Example acoustic signal transmitted through the case of a cement filled, corroded 60 mm mortar
Time (samples)
8
A filler ID is only provided when clear signals of this type are received. In the case of a high-explosive filler, we have never received good signals. The HE filler is too attenuative to allow a strong signal to pass through the filler. Only case-noise is received for explosive filler. Thus, because of the unique shape of the good signals for inert fillers, there is very low chance that an HE filler would be identified as a cement or POP filler. Although corrosion reduces the amplitude of the received signals, good signals were received for a number of highly corroded items filled with cement and POP. Although this technology is new, the earlier SERDP study provided a great deal of information on the ultimate capabilities and reliability of the technology. First, the current acoustic technique shows good identification accuracy for inert fillers based on data clusters for velocity and attenuation. Second, acoustic technology operates best for smaller shells that do not significantly attenuate the signal traveling through the filler (40 mm to 81 mm). Third, if a good quality signal is received through the item, the identification is highly accurate. In all cases, a good quality signal is easily distinguished from a poor quality signal. Filler identification should not be attempted on the basis of a poor quality signal. Fourth, several new techniques to improve signal quality have been developed and tested. Each of these techniques shows promise for improving the signal quality for curved shells, corroded items and highly attenuating fillers. Finally, throughout this study, no safety issues have developed, even with fused items. The only know alternative technology is PELAN, which was discussed earlier in Section 1.1, and which has the disadvantage of only being accurate for large UXO. This acoustic technology fills the need to identify filler material in small ordnance.
9
3.0 PERFORMANCE OBJECTIVES Table 1 lists the performance objectives for the acoustic testing at VNTR. These objectives are considered critical to the eventual utility of the technique. As stated earlier, the VNTR tests were considered important because they could provide the first indications of performance for many actual fired–and-recovered UXO items.
Table 1. Performance Objectives
Performance Objective
Metric Data Required Success Criteria
Quantitative Performance Objectives Detection of good signals for filler ID
Percentage of inert items with good signals received
Acoustic signals received for multiple sensor placements on items
> 80%
Correct ID of inert-filled items
Accuracy of filler ID for items with good signals
Acoustic signals received for multiple sensor placements on items
> 95%
Qualitative Performance Objectives Ease of mounting sensors to various items
Ease of clamping sensors on item at pre-selected location
Evaluation sheet (Appendix B) completed by technician
Sensor clamp does not have to be re-positioned on item
3.1 OBJECTIVE: DETECTION OF GOOD SIGNALS FOR FILLER ID
3.1.1 Metric A good signal is one that is consistent and one that clearly distinguishes it from other signals and from noise signals (see Section 2.2). The metric is the percentage of good signals over other signals.
3.1.2 Data Requirements The required data is shown as the signal examples on the table of Appendix B. In addition, full digital signals through the inert items will be recorded for multiple sensor locations. These signal records can be reviewed after the tests to confirm the presence of “good signals.”
3.1.3 Success Criteria We consider a success rate of 80% to be reasonable at this stage of the technology demonstration. That is, 80% of the items give “good signals” independent of sensor clamping, difficulties in clamping on the buried item, condition of shell wall, etc.

10
3.2 OBJECTIVE: CORRECT ID OF INERT-FILLED ITEMS
3.2.1 Metric The metric is the percent accuracy of inert fills that are correctly identified after processing of the acoustic signals, compared to the incorrect identifications.
3.2.2 Data Requirements The required data is shown as the acoustic velocity and attenuation data table of Appendix B. Multiple readings will be taken on each item with “good signals” and analyzed using the linear-discriminant classifier (see Section 6.5).
3.2.3 Success Criteria We expect a correct filler ID accuracy of 95% or better for items with “good signals” 3.3 OBJECTIVE: EASE OF MOUNTING SENSORS
3.3.1 Metric The metric is the time required for the operator to clamp the sensors on an item at pre-selected locations (see Section 5.5).
3.3.2 Data Requirements We will take stopwatch measurements of the time taken to attach the sensor clamp. We will then view the resulting signals and determine if they are “good.” If the signals are not “good,” we will also record how many times the clamp had to be re-positioned in order to provide a good signal for the item.
3.3.3 Success Criteria The sensor clamping will be judged successful if good signals are recorded after three attempts to clamp onto the item. In general, the clamping will not be successful if the operator has to take additional time.

11
4.0 SITE DESCRIPTION 4.1 SITE SELECTION
VNTR was selected because it is an active UXO remediation site where demonstration of a new technology could be arranged [4]. In addition, because of the wide variety of ordnance fired here over the many years of operation, we expected to find items in the required size range for the acoustic tests (< 90mm). Other DOD active sites were considered, but did not appear to have the required size, range or type of ordnance items.
Figure 4. Location of the VNTR site
4.2 SITE HISTORY (taken from reference [4]) Vieques Island has a land area of approximately 33,000 acres, and is located in the Caribbean Sea approximately 7 miles southeast of the eastern coast of the main island of Puerto Rico (Figure 4). The former Naval facilities are located on the eastern one-third (i.e., former VNTR) and western one-third (i.e., former NASD) of the island, with the communities of Isabel Segunda and Esperanza located in the center of the island. The former VNTR, which comprised approximately 14,573 acres, provided ground warfare and amphibious training for Marines, naval gunfire support training, and air to ground training. The former VNTR is also described as four separate operational areas, which comprised from west to east: the EMA, the Surface Impact Area (SIA), the Live Impact Area (LIA), and the Eastern Conservation Area (ECA) at the easternmost tip of the island (see vertical markers in Figure 5).

12
4.3 MUNITIONS CONTAMINATION
Figure 5 Munitions Response areas of VNTR
In 1965, air-to-ground training activity began in the MRA-LIA where several mockups, such as old tanks and vehicles, were used as targets for aerial bombing. Beginning in the mid-1970s, naval gunfire was practiced at the MRA-LIA, where several point and area targets for ships were constructed. The MRA-LIA is currently undergoing a time-critical removal action to remove munitions from the surface. The MRA-SIA was established in the 1950s, when several Marine targets were constructed. Marine artillery ranging from 76-millimeter (mm) to 175-mm rounds were directed toward these targets from artillery gun positions within the MRA-SIA and MRA-EMA. Remediation activity is just starting in the MRA-SIA. All of the items for the acoustic tests came from the Live Impact Area (LIA). As part of normal UXO operations, test ordnance items were removed from the surface, and if judged “safe to move”, transported to the “demolition sites.” We asked VNTR operations to begin collecting smaller ordnance items that are judged to be inert filled starting January 2009. To avoid possible damage and interference with the acoustic tests, these items were not be “demoed” until after the acoustic tests. Table 2 shows examples of the type of ordnance to be set aside at VNTR.

13
Table 2. Examples of ordnance types set aside for the acoustic tests
5.0 TEST DESIGN This section describes the field procedures, equipment settings, and data requirement forms that were used for the demonstration tests at Former Naval Facilities Vieques. The objective of these tests was to demonstrate the acoustic technology on recovered UXO. Unlike testing at the prior controlled sites, the active site provided a source of actual UXO shells with original fill materials and with various degrees of corrosion and dents. In addition, by testing many items, practical limitation for the technology were identified. The types of ordnance items desired for the active-site testing are listed below: a) Shells that have a known inert fill or the fill can be identified later by destructive testing, b) Recovered (and set-aside/stored) items, c) Shell diameters from 40mm to 81mm, d) Shells that are completely sealed and have solid fill materials (e.g. plaster, wax and cement),
not sand, loose gravel or burster tubes, e) Items that have various degrees of corrosion but are not significantly dented in the area near
the maximum diameter. The primary restriction on the ordnance test items was that the size must be 81mm or less. This is due to the high acoustic attenuation in most inert-fill materials and the losses in the acoustic signal strength as it travels through large shells. Although large shells may be workable in the future with improved sensors, the technology to be tested was limited to 81mm and below.
QUANTITY TO TEST
ITEM# TESTED AT 5
ORIENT.CLAMP LOCATION PHOTO/DRAWING
4 60mm M50A2 TP / M49A2 HE Mortar 2 3.5 CM BELOW FUZE ON GAS CHECK BAND
4 81mm M375 WP Mortar wo/fin shroud - 90mm fuze 2 7.6 CM BELOW FUZE
6 2.75" (70MM) M230 Rocket Warhead 2 20 CM BELOW FUZE
6 76mm Mk 201 Projectile w/fuze - no inert lettering 2 4.3 CM BELOW FUZE
20 TOTALS 8

14
5.1 CONCEPTUAL EXPERIMENTAL DESIGN The acoustic testing took place at several “demo sites” located within the LIA of VNTR. Actual item testing took most of the time and involved locating and marking the ordnance item for the collection area, clamping the acoustic sensors, and recording the data. All items were tested using the procedures detailed below. The various items were tested at or near the locations where they were collected. All power for the acoustic instruments was provided by an AC inverter attached to a truck battery. At the conclusion of testing at each site, the items were replaced back in the collection pile for later demolition. Note that each item had a number painted onto body for later identification after demo. 5.2 SITE PREPARATION Since all testing will take place at the demo sites, little site preparation was required. Listed below are the setup preparations that needed to be made before the testing:
1. Collect ordnance items to be tested at the demo sites. 2. Locate a portable tent in case of poor weather during testing. 3. Setup and test the shear cutting tool available at the Central Processing Center.
5.3 SYSTEM SPECIFICATION
A key objective of the current ESTCP project was the development of a clamp-on sensor and a portable electronic system to make the acoustic measurements. The clamp is an important part of the filler identification system and has been designed so that it can be attached from only one side of the shell. It must hold the acoustic sensors rigidly to the sides of deformed, corroded ordnance bodies while maintaining good alignment. Figure 6 shows the clamp attached to a 81mm projectile body. Note that this clamp can be attached while working from one side of the shell. The soil does not have to be removed all the way around the shell case. In addition, the shell only needs to be exposed in a central area near the maximum outer diameter, often near the obturating ring.
Figure 6 Photo of the sensor clamp attached to an 81mm inert-filled mortar.

15
The portable electronics system was developed to record and store acoustic signals taken using the clamp-on sensors. Figure 7 shows a photograph of the portable system which consists of a hardened touch-panel computer and piggyback acoustic electronics. The cables from the sensor clamp attach directly to the electronics case mounted on the back of the computer. The data acquisition system processes the received acoustic signals and measures the acoustic velocity through the filled test body.
Figure 7 Data recording system with piggyback acoustic electronics
Table 3 lists the operational parameters of the data acquisition system to be used during the tests. Most of these parameters are controlled from the operators screen (see example data table in Appendix B).
Table 3. Summary of Operational Parameters Sensor Frequency (MHz)
Sensor Type
Gate On-time (usec)
Gate Off-time (usec)
Signal Gain
Filtering Pulse amplitude
2.25 Flat with Caps or Curved
10 50 Adjustable On Acquisition Screen
Off High
5.4 CALIBRATION ACTIVITIES A series of test shells has been developed to verify consistent response of the sensors during the demonstration tests. After each set of 5 items, the operator performed a test calibration using the sensor clamps and the calibration shells. Calibration shells have been developed to verify consistent response of the sensors during the demonstration tests. They consist of inert plaster or wax inside a cylindrical metal case (60mm, 76mm and 81mm). By clamping to these test shells, the system operator can ensure that the peak amplitude response of the sensors is consistent with nominal values and has not degraded for some reason. If significant decrease in sensor response is noted, then the sensors would be replaced and the readings discarded.

16
5.5 DATA COLLECTION PROCEDURES Procedure for recovered/set aside items: 1. If necessary, move the item from the collection area to a nearby location on the ground. 2. Clean the item around the specified clamp location with water and apply acoustic gel 3. Select the proper clamp for the ordnance item size 4. Clamp sensors to the specified location on the item (circumferential position A) 5. Photograph the clamp and ordnance item showing general orientation of the clamp 6. Move to system location, connect sensor cables 7. Enter test ID and start signal recording 8. Observe signal quality and determine if a “good” signal is present (see above) 9. Wait for a standard series of six readings to be recorded and stop recording 10. Repeat 7-12 at two other clamping locations around the circumference of the item (circumferential position B and C) 11. Stop testing and wipe/clean the sensor faces. 12. Move the item to the “demo” pile and begin again with the next item. 13. Upload recorded data to a “flash drive” for safekeeping. After each set of 5 items, perform a test calibration using the sensor clamps in the calibration shells described in section 5.4. At this time, also upload recorded data to a “flash drive” for safekeeping. 5.6 VALIDATION For these demonstration tests, the only validation was to determine the actual filler type in the inert items used for the tests. This was done soon after the tests using a mechanical shearing device located at the Central Processing Center. Each item was marked with a painted number so that the filler type (wax, plaster, etc.) could be visually identified and recorded against this number on the test matrix after shearing (see Table 4).
17
6.0 DATA ANALYSIS PLAN
6.1 PARAMETER ESTIMATION Appendix B shows an example of the data table that was produced for each test item. The acoustic velocity and attenuation values to be used in the discrimination model for filler ID will came from this data record. The velocity of the filler material, FillerV , is computed from the
following variables (see Figure 8):
DTotal is the total distance between acoustic sensors (i.e. OD of container) as measured with a caliper.
TTotal is the travel time through the total container as measured by the acoustic clamp system.
TWall is the travel time through both container walls as measured by pulse-echo acoustic time-of-flight.
VWall is the velocity in the container walls and is known from the material type and tabulated values.
Figure 8 Schematic of sensors attached to projectile body and ultrasonic waves passing through the case and filler
Using this model, the relationships between the measured variables are expressed by the following equations:
Filler
FillerWallTotal V
DTT
WallWallTotalFiller VTDD
WallTotal
WallWallTotalFiller TT
VTDV
D T o ta l
Send
Sen
sor
Rec
eive
Sen
sor
D W a ll
V W a llV F iller

18
6.4 TRAINING There is no training data required for the linear-discriminant analysis method described below. 6.5 CLASSIFICATION A linear discriminant analysis has been developed to provide a filler identification based on the acoustic velocity readings. Discriminant analysis predicts classification variables (filler-type) based on a known continuous response (measured velocity). Discriminant analysis can be regarded as an inverse prediction from a multivariate analysis of variance. The analysis looks at the range of velocity variance for groups of each filler type, and then classifies each item by filler type based on each reading. For this analysis, we use only the measured velocity values from ordnance test items that provided a good filler signal. For the other test items, only noise is measured, and there will be no velocity reading to use. 7.0 PERFORMANCE ASSESSMENT
This section summarizes performance testing at the controlled site (NAVEODTECHDIV) and the active site (Vieques, PR). Subsections below address specific objectives detailed in Section 3.
7.1 EASE OF MOUNTING SENSORS TO VARIOUS ITEMS
Controlled site tests of the acoustic technique were made during November 18-21, 2008 at NAVEODTECHDIV (Indian Head, MD). The objective was to confirm proper operation of the field devices on inert items in a more representative field situation than is available at a laboratory. Filled ordnance items were partially buried and then uncovered to simulate operations by remediation personnel at a response site (see Figure 9). The inert fills included plaster, wax, cement and liquid. In addition, several shells were empty or had loose fills (i.e. not case bonded). The items were placed in various orientations in the ground to test for difficulties in clamping the acoustic sensors.
Figure 9 EOD personnel clamping the acoustic sensors to a corroded 2.75” warhead.

19
Throughout the testing, similar signals were measured for the shell in-ground and aboveground (table top). For 95% of the shells, good in-ground readings were obtained. In addition, we measured only a small 3% difference in acoustic velocity between the in-ground and table measurements. Thus these tests showed that clamping the acoustic sensors to a shell should be possible for most active site conditions. In addition, we found that the average time to clamp to a shell and receive a good signal was 1.2 minutes. This time seems practical for UXO cleanup application. Figure 10 shows the distribution of clamping times for the 22 items tested.
Figure 10 Comparison of the average time taken to properly clamp the sensors to the ordnance items
7.2 DETECTION OF GOOD SIGNALS FOR FILLER ID
Testing of the acoustic technique at an active test site in Vieques, Puerto Rico was completed during the week of March 30, 2009. The objective of this test was to confirm that good acoustic signals could be obtained for realistic field conditions on actual fired and recovered ordnance. Because small (<90mm) UXO items are needed for the acoustic tests, and we learned that only a few small items were currently being recovered at Vieques, we had made arrangements with the UXO supervisor to collect smaller items after they are uncovered and moved to the “demo sites”. Acoustic testing took place at these sites before the items were damaged by the demolition charges. In addition to the small, “set-aside” items we tested large, cement-filled, MK82 bombs. Recent studies suggested that, due to the very low attenuation in cement, the acoustic waves should be able to penetrate the 18” diameter cement and allow filler identification.
0
1
2
3
4
5
6
7
8
9
0 1 2 3 4 5
Mor
e
Time to Clamp (Minutes)
Sh
ell
Ite
m C
ou
nt

20
Figure 11 Filler ID testing at an active response site (Vieques, PR)
Unfortunately these tests were disappointing because, even with the three month “set-aside” effort, the number of items in the correct size range was very limited. This was the case despite the fact that small items were routinely uncovered when this test site was selected in 2006.
During the test week, we moved the acoustic system from one demo site to another testing any items that were near the targeted size range. Over a total of about 10 field sites with smaller ordnance, we were able to test about 20 items. Unfortunately, many of these were very corroded and no acoustic signals were received at all through these items. After acoustic testing, the items were demolished using explosive charges and the filler identified thought visual inspection.

21
Table 4. Acoustic Test Results
Table 4 shows the acoustic test results for the 23 items. Note that only 11 of these items were in the target size range for the improved acoustic sensor clamps (60-81mm). The larger items were tested using the older, unimproved sensor clamps developed during the SERDP study [5]. Of these 11 correctly sized items, only one shell turned out to be filled with an inert, plaster material suitable for acoustic testing (photo in Figure 12). As shown in Figure 13, this plaster filled shell (#8) did provide a good acoustic signal with an arrival time indicative of a plaster fill.
Figure 12 Number 8 - 2.75 inch shell found to be plaster filled.
Item # Item Nomenclature Grid location Filler (Verified) Comments1 5 inch (HE?) K2D0F6 HE No Readable Signal2 5 inch K2D0F6 HE No Readable Signal3 5 inch rocket K2D0F6 wax No Readable Signal4 5 inch (HE?) K2D0F6 HE5 4.5 inch (HE?) K2D0F6 HE No Readable Signal6 75 mm (HE? K2D0F6 HE No Readable Signal7 75 mm empty K2D0F6 empty(hollow) No Readable Signal8 2.75 inch C7 plaster Good Acoustic Signal and ID9 BDU 45 Conslidation Pile Near CPC cement Good Acoustic Signal and ID10 81 mm MRS 9 - PIKA No Readable Signal11 75 mm J2E7G7 HE No Readable Signal12 76 mm J2E7G7 HE No Readable Signal13 2.75 inch J2F0A2 HE No Readable Signal14 90 mm flare canister J2F0A2 ILLUM No Readable Signal15 2.75 inch J3F2C8 empty(hollow) No Readable Signal16 2.75 inch J3F2C8 empty(hollow) No Readable Signal17 2.75 inch J3F2C8 empty(hollow) No Readable Signal18 2.75 inch J3I3B3 No Readable Signal19 105 mm J3E3A4 No Readable Signal20 105 mm J3E3A4 No Readable Signal21 BDU 45 Conslidation Pile Near CPC cement Good Acoustic Signal and ID22 BDU 45 Conslidation Pile Near CPC cement Good Acoustic Signal and ID23 BDU 45 Conslidation Pile Near CPC cement Good Acoustic Signal and ID
22
Figure 13 Acoustic signal for plaster filled shell #8
All of the other items that were empty or filled with high explosive (HE) gave acoustic signals indicative of “case noise” only, as expected (see Section 2.2). Recall that the acoustic technique does not read HE because of the very high attenuation in these materials, and that only inert fills (wax, plaster and cement) can be identified.
7.3 CORRECT ID OF INERT FILLED ITEMS
Besides the one plaster filled shell, the only other items with good acoustic signals were the four cement-filled 18” diameter MK82 bombs. For these very large items, magnetic sensor clamps were attached to opposite sides near the middle of the case (Figure 14). As shown in Figure 15 the acoustic signal for the bomb arrives at the correct time for the path length through the case and cement filler.
Arrival time for signal through plaster-filled 2.75” shell
Magnetically coupled Acoustic Sensor
Figure 14 Photograph of 18" diameter cement filled bomb (MK82, BDU-45)
23
Figure 15 Acoustic signal for 18" BDU-45 showing arrival at 136 microseconds
With the use of the equations in Section 6.3, the measured time of flight (136 uSec) and the case dimensions, the velocity of the acoustic waves in the filler can be calculated. The calculated velocity is shown as the large X in Figure 17. This figure was taken from an earlier report detailing material velocity measurements for various ordnance shell sizes [3]. Note that the measured value for the cement fill in the MK72 bombs is in excellent agreement with the other shell items. This illustrates the identification accuracy of the acoustic technique for large cement-filled items.
Figure 16 Plot of measured filler velocity for several ordnance items with varying sizes.
0.1
0.15
0.2
0.25
0.3
0.35
0.4
0.1 0.15 0.2 0.25 0.3 0.35 0.4
Sample Velocity Readings (cm/usec)
Fill
er
Ve
loc
ity
Re
ad
ing
s (
cm
/uS
ec
)
5"-38
76mm
60mm
81mm
2.75"
Wat
er Eth
yle
ne
Gly
col
Gly
cerin
Wa
x
Pla
ster
Cem
ent
0.1
0.15
0.2
0.25
0.3
0.35
0.4
0.1 0.15 0.2 0.25 0.3 0.35 0.4
Sample Velocity Readings (cm/usec)
Fill
er
Ve
loc
ity
Re
ad
ing
s (
cm
/uS
ec
)
5"-38
76mm
60mm
81mm
2.75"
Wat
er Eth
yle
ne
Gly
col
Gly
cerin
Wa
x
Pla
ster
Cem
ent
X

24
During the active site testing, many items were found that could not be tested because of extreme corrosion. We believe that this severe corrosion is due to the saltwater environment of Vieques, PR. One example of extreme corrosion is shown in Figure 18 for a 76mm shell. Note that the walls of the case seem to have “burst open” due to corrosion. For all these items, the outer diameter is greater than the diameter of the original gas bands. In addition, the metal walls could be peeled away as flakes by hand.
No acoustic signal could be received through cases with this degree of corrosion; not even “case noise”. The acoustic waves appear to be blocked by air trapped with the metal “flakes” as illustrated in Figure 18. For all items with severe corrosion, the flaking case prevented sound from entering the shell filler. This means that the acoustic technique cannot be applied for ordnance items that have extreme corrosion that has “burst open” the case.
Figure 17 Heavily corroded 76mm shell #12
Figure 18 Illustration of the metal walls and flaking of a corroded case that has "burst open"
25
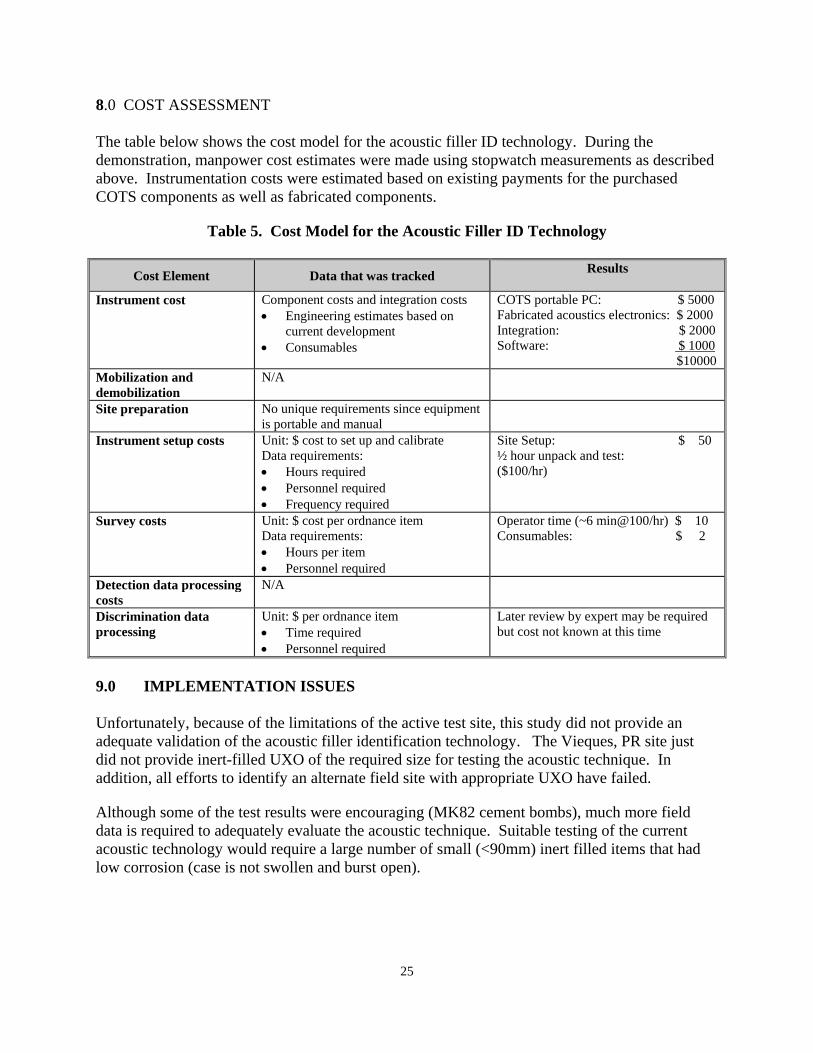
8.0 COST ASSESSMENT The table below shows the cost model for the acoustic filler ID technology. During the demonstration, manpower cost estimates were made using stopwatch measurements as described above. Instrumentation costs were estimated based on existing payments for the purchased COTS components as well as fabricated components.
Table 5. Cost Model for the Acoustic Filler ID Technology
Cost Element Data that was tracked Results
Instrument cost Component costs and integration costs Engineering estimates based on
current development Consumables
COTS portable PC: $ 5000 Fabricated acoustics electronics: $ 2000 Integration: $ 2000 Software: $ 1000 $10000
Mobilization and demobilization
N/A
Site preparation No unique requirements since equipment is portable and manual
Instrument setup costs Unit: $ cost to set up and calibrate Data requirements: Hours required Personnel required Frequency required
Site Setup: $ 50 ½ hour unpack and test: ($100/hr)
Survey costs Unit: $ cost per ordnance item Data requirements: Hours per item Personnel required
Operator time (~6 min@100/hr) $ 10 Consumables: $ 2
Detection data processing costs
N/A
Discrimination data processing
Unit: $ per ordnance item Time required Personnel required
Later review by expert may be required but cost not known at this time
9.0 IMPLEMENTATION ISSUES Unfortunately, because of the limitations of the active test site, this study did not provide an adequate validation of the acoustic filler identification technology. The Vieques, PR site just did not provide inert-filled UXO of the required size for testing the acoustic technique. In addition, all efforts to identify an alternate field site with appropriate UXO have failed.
Although some of the test results were encouraging (MK82 cement bombs), much more field data is required to adequately evaluate the acoustic technique. Suitable testing of the current acoustic technology would require a large number of small (<90mm) inert filled items that had low corrosion (case is not swollen and burst open).

26
Appendix A: Points of Contact POINT OF CONTACT
Name
ORGANIZATION Name
Address
Phone Fax
E-mail Role in Project
Dr. Wes Cobb
University of Denver Research Inst.
2050 E. Iliff Avenue Denver, CO 80208
Ph: (303) 871-3140 (303) 871-2716 [email protected]
LEAD P.I.
Mr. Tom Douglas
NAVEODTECHDIV Code 521J, Bldg 2195
2008 Stump Neck Road Indian Head, MD 20640
Ph: (301) 744-6858, Ext. 243 (301) 744-6981
CONTRACT OFFICER REPRESENTATIVE,
LEAD PROGRAM ANALYST
Dr. Herb Nelson
SERDP/ESTCP, 901 N. Stuart Street, Ste 303 Arlington, VA 22203
Ph: 703-696-8726 Fax: 703-696-2114 [email protected]
Munitions Management Program Manager

27
Appendix B: Sample data table

28
10.0 REFERENCES 1 Applied Physics Institute, Western Kentucky University, “Unexploded Ordnance (UXO)
Environmental Cleanup Systems,” (http://www.wku.edu/API/research/en/uxo.html) 2 Cobb, W.N., "Ultrasonic Measurement of Fluid Composition,” 25th Annual Review of
Progress in Qualitative Nondestructive Evaluation, July 19-24, Snowbird, Utah, 1998 (http://www.du.edu/~dri/ultrasonics/files/QNDE-compostion.pdf)
3 Cobb, W. N., “Acoustic Identification of Filler Materials in Unexploded Ordnance,” Final
report on SERDP Project UXO-1382 , April 2006 4 CH2M HILL, Site Management Plan FY 2008-2009, Former Naval Facilities
Vieques, Puerto Rico. (http://www.epa.gov/region02/vieques/sitemanagementplan.pdf), October 2008
5 Cobb, W. N., “Acoustic Identification of Filler Materials in Unexploded Ordnance,” SERDP
Conference: 2005 Partners in Environmental Technology Technical Symposium & Workshop, November 29-December 1, Washington, DC