Operation, Modeling and Analysis of the Reverse Water Gas Shift Process Jonathan Whitlow Florida...
41
Operation, Modeling and Analysis of the Reverse Water Gas Shift Process Jonathan Whitlow Florida Institute of Technology NASA/ASEE Summer Faculty Program August 1, 2001
-
Upload
nancy-holt -
Category
Documents
-
view
213 -
download
0
Transcript of Operation, Modeling and Analysis of the Reverse Water Gas Shift Process Jonathan Whitlow Florida...

Operation, Modeling and Analysis of the Reverse Water
Gas Shift Process
Jonathan Whitlow
Florida Institute of Technology
NASA/ASEE Summer Faculty Program
August 1, 2001
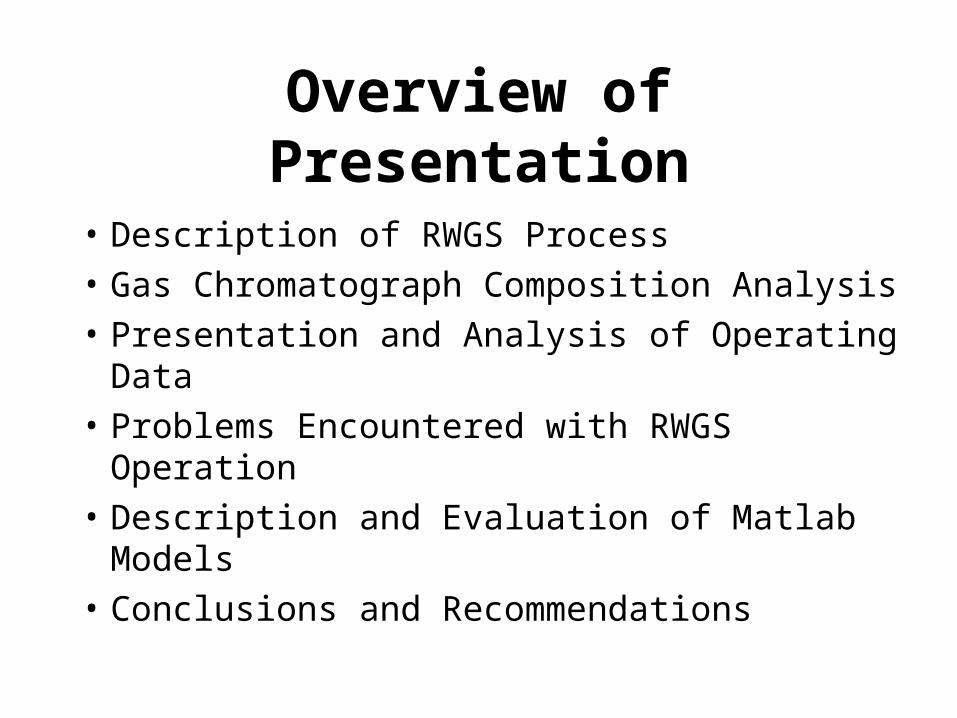
Overview of Presentation
• Description of RWGS Process
• Gas Chromatograph Composition Analysis
• Presentation and Analysis of Operating Data
• Problems Encountered with RWGS Operation
• Description and Evaluation of Matlab Models
• Conclusions and Recommendations

RWGS Photo

CO2
CondenserCatalyticReactor
MembraneSeparator
2
2
2O
2
in Q
F 1
W
2 3 4
R
Electrolysis
RecycleCompressor
2
2O
2
H
H
CO
CO
H
H
H
CO
CO
Q out
H
O2
2
RWGS Process Flow DiagramRWGS Process Flow Diagram

RWGS Flow Schematic

Composition Analysis
• Analysis is Key to Mass Balance Models
• Insufficient Calibration for use of Mass Spectrophotometer
• Gas Chromatograph utilized for Analysis– TCD for CO and CO2
– HID for H2

0.00 20000.00 40000.00 60000.00 80000.00 100000.00
0
10
20
30
40
50
60
CO2 Data CO2 Calculated
% C
arbo
n D
ioxi
de
GC Area Count (TCD)
Carbon Dioxide GC Calibration
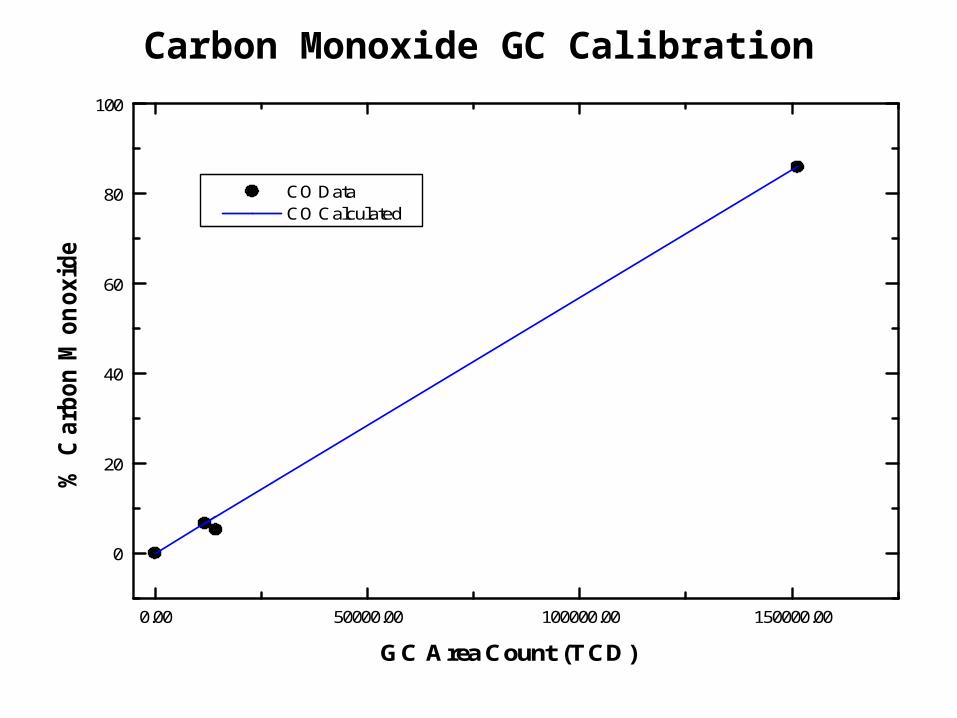
0.00 50000.00 100000.00 150000.00
0
20
40
60
80
100
CO Data CO Calculated
% C
arbo
n M
onox
ide
GC Area Count (TCD)
Carbon Monoxide GC Calibration

Hydrogen GC Calibration
0.0 2.0x10⁶ 4.0x10⁶ 6.0x10⁶ 8.0x10⁶ 1.0x10⁷ 1.2x10⁷ 1.4x10⁷
0
10
20
30
40
50 H2 Data H2 Calculated
% H
ydro
gen
GC Area Count (HID)

Summary of RWGS Operating Data
Date # Steady States GC Analysis Electrolysis Sample Frequency7/2/2001 1 ?? no yes 60 seconds7/3/2001 1 ?? no yes 60 seconds7/5/2001 1 ?? no yes 60 seconds7/9/2001 1 partial no 60 seconds7/18/2001 3 yes no 10 seconds7/19/2001 3 yes no 10 seconds
7/27/2001 2 yes no 10 seconds
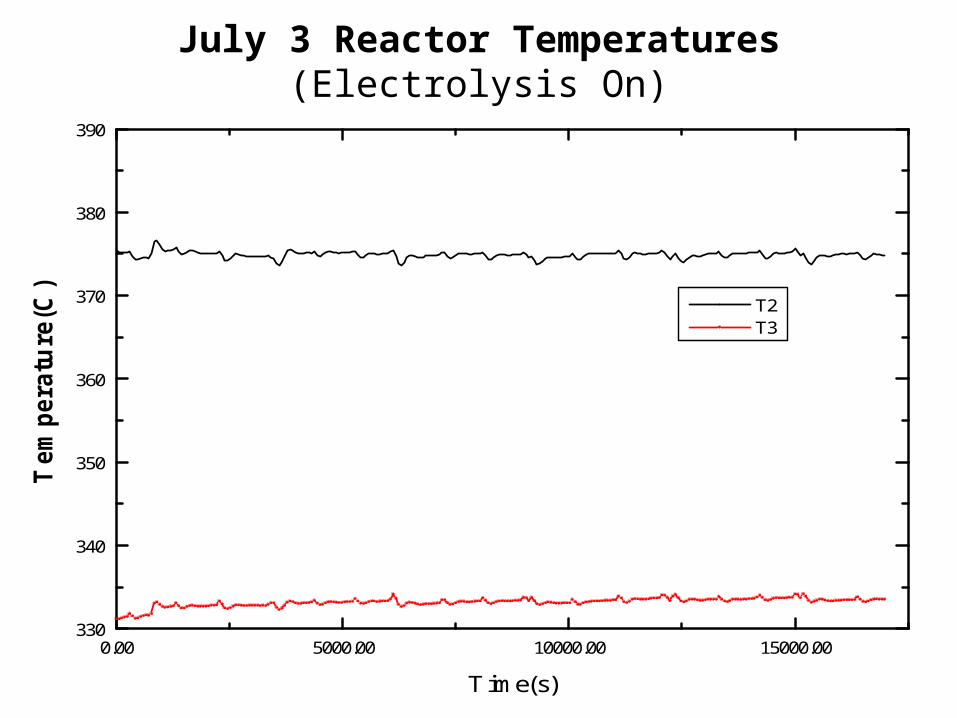
July 3 Reactor Temperatures (Electrolysis On)
0.00 5000.00 10000.00 15000.00330
340
350
360
370
380
390
T2 T3
Tem
pera
ture
(C)
Time(s)

0.00 5000.00 10000.00 15000.00 20000.00
330
340
350
360
370
380
390
PC1=44 psiaPC1=60 psiaPC1=53 psia
T2 T3
Tem
pera
ture
(C)
Time(s)
July 19 Reactor Temperatures

July 3 CO Vent {R9} Flow (Electrolysis On)
0.00 5000.00 10000.00 15000.000.0
0.4
0.8
1.2
1.6
2.0
2.4
2.8
3.2
PC1=44 psia
Feed Flow = 2 slpm CO2 & 0.1 slpm H2
R9
Flo
w (
slpm
)
Time(s)

July 18 CO Vent {R9} Flow PC1 Set Point = 53 psia
0.00 5000.00 10000.00 15000.00 20000.00 25000.000.0
0.2
0.4
0.6
0.8
1.0
1.2
1.4
1.6
Feed Flow = 1.0 slpm H2 & CO2
Feed Flow = 1.2 slpm H2 & CO2
R9
Flo
w (
splm
)
Time(s)

0.00 5000.00 10000.00 15000.00 20000.000.0
0.2
0.4
0.6
0.8
1.0
1.2
1.4
1.6
1.8
2.0
2.2
2.4
2.6
2.8
3.0
3.2
3.4
PC1=53 psiaPC1=44 psia
PC1=60 psia
R9
Flo
w (
slpm
)
Time(s)
July 19 CO Vent {R9} Flow Feed Flow=1.3 slpm CO2 & H2

July 27 CO Vent {R9} Flow Feed Flow=1.1 slpm CO2 & H2
0.00 5000.00 10000.00 15000.000.0
0.5
1.0
1.5
2.0
2.5
3.0
PC1=60 psiaPC1=53 psia
R9
Flo
w (
slpm
)
Time(s)

July 3 Membrane P (Electrolysis On)
0.00 5000.00 10000.00 15000.0025
26
27
28
29
30
PC1=44 psia
Feed Flow = 2slpm CO2 & 0.1 slpm H2
Mem
bran
e P
ress
ure
Dro
p (p
si)
Time(s)

July 18 Membrane PPC1 Set Point = 53 psia
0.00 5000.00 10000.00 15000.00 20000.00 25000.0034.0
34.5
35.0
35.5
36.0
36.5
37.0
37.5
38.0
Feed Flow = 1.0 slpm H2 & CO2
Feed Flow = 1.2 slpm H2 & CO2
Mem
bran
e P
ress
ue
Dro
p (p
si)
Time(s)

0.00 5000.00 10000.00 15000.00 20000.00
26
28
30
32
34
36
38
40
42
PC1=44 psia
PC1=60 psia
PC1=53 psia
Mem
bran
e P
ress
ure
Dro
p (p
si)
Time(s)
July 19 Membrane PFeed Flow=1.3 slpm CO2 & H2

July 27 Membrane PFeed Flow=1.1 slpm CO2 & H2
0.00 5000.00 10000.00 15000.00
34
36
38
40
42
44
46
PC1=60 psia
PC1=53 psia
Mem
bran
e P
ress
ure
Dro
p (p
si)
Time(s)

July 3 Recycle {R12} Flow & Membrane Feed (R8) (Electrolysis On)
0.00 5000.00 10000.00 15000.0028
30
32
34
36
38
40
42
Feed Flow = 2slpm CO2 & 0.1 slpm H2
PC1=44 psia
R8 R12
Flo
w (
slpm
)
Time(s)

July 18 Recycle {R12}PC1 Set Point = 53 psia
0.00 5000.00 10000.00 15000.00 20000.00 25000.00
26
28
30
32
34
36
38 Feed Flow = 1.2 slpm H2 & CO2
Feed Flow = 1.0 slpm H2 & CO2
Time(s)
R12
Flo
w (
slpm
)
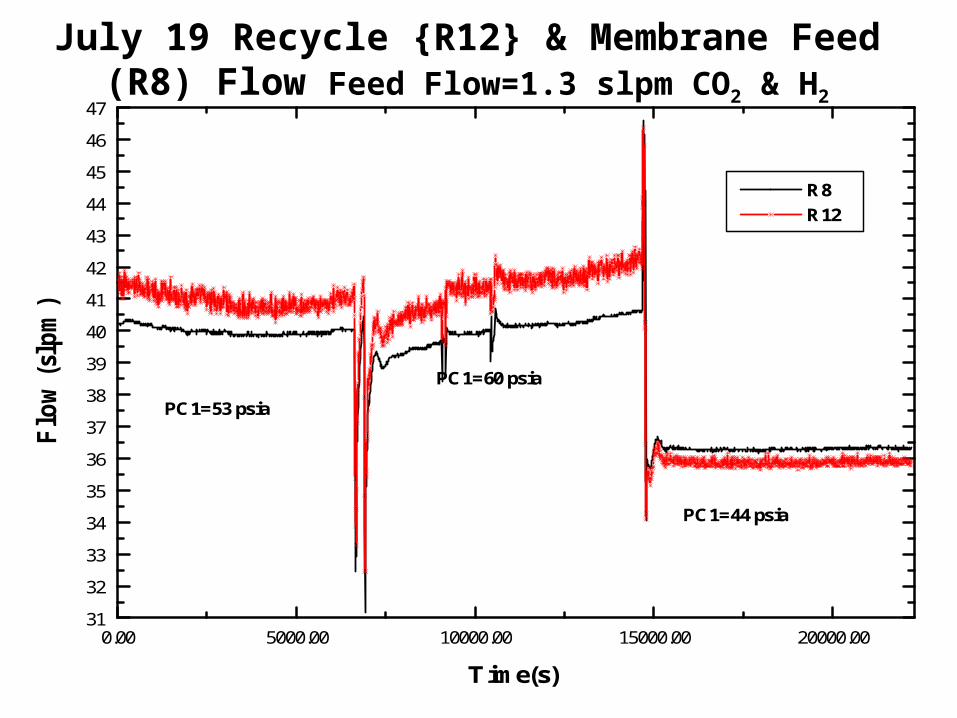
July 19 Recycle {R12} & Membrane Feed (R8) Flow Feed Flow=1.3 slpm CO2 & H2
0.00 5000.00 10000.00 15000.00 20000.0031
32
33
34
35
36
37
38
39
40
41
42
43
44
45
46
47
PC1=44 psia
PC1=60 psia
PC1=53 psia
R8 R12
Flo
w (
slpm
)
Time(s)

July 27 Membrane Feed (R8) Flow Feed Flow=1.1 slpm CO2 & H2
0.00 5000.00 10000.00 15000.0022
24
26
28
30
32
34
36
38
PC1=60 psia
PC1=53 psia
R8
Flo
w (
slpm
)
Time(s)

RWGS July 18 Mass Balance Summary
Date Port Time %H2 %CO2 %CO Port 2 Port 3 Port 4 Port 7 Feed
7/18/2001 3 9:30 2.48 2.97 94.55 Flow Flow Flow Flow Flow
7/18/2001 3 9:50 2.70 2.83 94.47 30.608 1.022 30.541 32.541 2.000 slpm 0.96 MB. Errror (slpm)7/18/2001 2 10:10 70.85 22.67 6.49 1.2517 0.0418 1.2489 1.3307 0.0818 gmole/min 3.12 %Error7/18/2001 2 10:25 70.08 23.17 6.75 28.784 1.015 28.595 30.595 2.000 CO2 adjusted 0.83 Adjusted CO2 Errror7/18/2001 4 10:40 71.91 24.50 3.58 1.1771 0.0415 1.1694 1.2511 0.0818 gmole/min 2.87 %Error
7/18/2001 7 10:55 69.83 26.71 3.47Comp. Bal. H2 CO2 CO
In 2 20.864 6.786 1.960 Overall Balance ErrorOut 3 0.026 0.029 0.959 Added to port 2Out 4 20.564 7.007 1.024Error 0.273 -0.250 -0.023
Date Port Time %H2 %CO2 %CO Port 2 Port 3 Port 4 Port 7 Feed
7/18/2001 3 1:15 1.16 1.44 97.41 Flow Flow Flow Flow Flow
7/18/2001 3 1:40 1.90 1.22 96.88 27.723 1.018 27.612 29.612 2.000 slpm 0.91 MB. Errror (slpm)7/18/2001 3 2:00 0.89 1.25 97.86 1.1337 0.0416 1.1291 1.2109 0.0818 gmole/min 3.27 %Error7/18/2001 2 2:10 63.79 28.16 8.05 25.677 1.014 25.486 27.486 2.000 CO2 adjusted 0.82 Adjusted CO2 Errror7/18/2001 2 2:20 63.47 28.61 7.92 1.0500 0.0415 1.0422 1.1240 0.0818 gmole/min 3.20 %Error
7/18/2001 4 2:35 66.26 29.41 4.337/18/2001 4 2:45 65.67 29.82 4.51 Comp. Bal. H2 CO2 CO7/18/2001 7 3:00 64.46 31.45 4.10 In 2 16.861 7.522 2.116 Overall Balance Error7/18/2001 7 3:10 63.84 31.95 4.21 Out 3 0.013 0.013 0.988 Added to port 27/18/2001 7 3:20 63.59 32.18 4.23 Out 4 16.812 7.547 1.1267/18/2001 3 3:35 1.34 1.44 97.22 Error 0.036 -0.038 0.0027/18/2001 3 3:45 1.20 1.42 97.38
Date Port Time %H2 %CO2 %CO Port 2 Port 3 Port 4 Port 7 Feed
7/18/2001 3 4:00 4.30 5.69 90.01 Flow Flow Flow Flow Flow
7/18/2001 3 4:15 5.00 6.19 88.81 35.880 1.299 36.021 38.421 2.400 slpm 1.44 MB. Errror (slpm)7/18/2001 2 4:25 71.02 23.65 5.33 1.4672 0.0531 1.4730 1.5712 0.0981 gmole/min 4.02 %Error7/18/2001 2 4:35 72.42 22.36 5.22 33.734 1.279 34.043 36.443 2.400 CO2 adjusted 1.59 Adjusted CO2 Errror7/18/2001 4 4:50 76.68 21.43 1.89 1.3795 0.0523 1.3922 1.4903 0.0981 gmole/min 4.71 %Error
7/18/2001 4 5:00 77.27 20.80 1.937/18/2001 7 5:15 75.76 22.55 1.69 Comp. Bal. H2 CO2 CO7/18/2001 7 5:25 75.75 22.57 1.67 In 2 25.333 8.126 1.864 Overall Balance Error
Out 3 0.059 0.076 1.144 Added to port 2Out 4 26.205 7.189 0.650Error -0.932 0.861 0.071
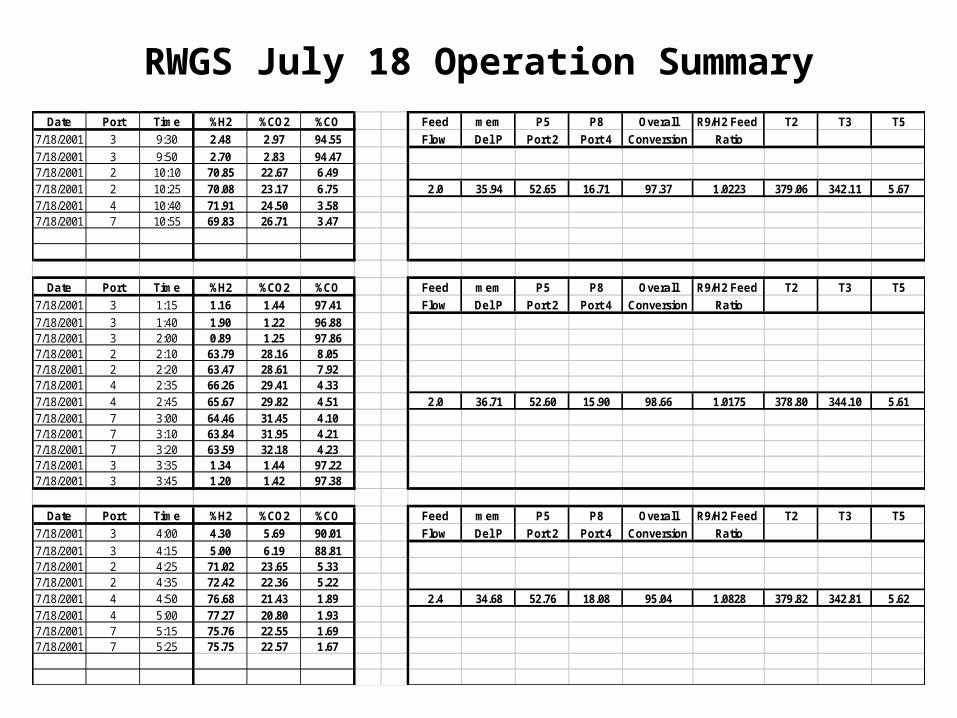
RWGS July 18 Operation SummaryDate Port Time %H2 %CO2 %CO Feed mem P5 P8 Overall R9/H2 Feed T2 T3 T5
7/18/2001 3 9:30 2.48 2.97 94.55 Flow Del P Port 2 Port 4 Conversion Ratio
7/18/2001 3 9:50 2.70 2.83 94.477/18/2001 2 10:10 70.85 22.67 6.497/18/2001 2 10:25 70.08 23.17 6.75 2.0 35.94 52.65 16.71 97.37 1.0223 379.06 342.11 5.677/18/2001 4 10:40 71.91 24.50 3.587/18/2001 7 10:55 69.83 26.71 3.47
Date Port Time %H2 %CO2 %CO Feed mem P5 P8 Overall R9/H2 Feed T2 T3 T5
7/18/2001 3 1:15 1.16 1.44 97.41 Flow Del P Port 2 Port 4 Conversion Ratio
7/18/2001 3 1:40 1.90 1.22 96.887/18/2001 3 2:00 0.89 1.25 97.867/18/2001 2 2:10 63.79 28.16 8.057/18/2001 2 2:20 63.47 28.61 7.927/18/2001 4 2:35 66.26 29.41 4.337/18/2001 4 2:45 65.67 29.82 4.51 2.0 36.71 52.60 15.90 98.66 1.0175 378.80 344.10 5.617/18/2001 7 3:00 64.46 31.45 4.107/18/2001 7 3:10 63.84 31.95 4.217/18/2001 7 3:20 63.59 32.18 4.237/18/2001 3 3:35 1.34 1.44 97.227/18/2001 3 3:45 1.20 1.42 97.38
Date Port Time %H2 %CO2 %CO Feed mem P5 P8 Overall R9/H2 Feed T2 T3 T5
7/18/2001 3 4:00 4.30 5.69 90.01 Flow Del P Port 2 Port 4 Conversion Ratio
7/18/2001 3 4:15 5.00 6.19 88.817/18/2001 2 4:25 71.02 23.65 5.337/18/2001 2 4:35 72.42 22.36 5.227/18/2001 4 4:50 76.68 21.43 1.89 2.4 34.68 52.76 18.08 95.04 1.0828 379.82 342.81 5.627/18/2001 4 5:00 77.27 20.80 1.937/18/2001 7 5:15 75.76 22.55 1.697/18/2001 7 5:25 75.75 22.57 1.67

Date Port Time %H2 %CO2 %CO Port 2 Port 3 Port 4 Port 7 Feed
7/19/2001 3 10:15 18.85 12.88 68.27
7/19/2001 3 10:30 17.90 12.78 69.32 39.993 1.496 40.962 43.562 2.600 slpm 2.46 MB. Errror (slpm)7/19/2001 3 10:40 18.62 12.47 68.92 1.6355 0.0612 1.6751 1.7814 0.1063 gmole/min 6.16 %Error7/19/2001 2 10:55 75.99 20.00 4.01 37.909 1.447 38.822 41.422 2.600 CO2 adjusted 2.36 Adjusted CO2 Errror7/19/2001 2 11:05 75.77 20.08 4.15 1.5502 0.0592 1.5876 1.6939 0.1063 6.22 %Error
7/19/2001 4 11:25 78.63 19.97 1.407/19/2001 4 11:35 78.40 20.22 1.38 Comp. Bal. H2 CO2 CO7/19/2001 7 11:50 76.42 22.29 1.28 In 2 30.555 8.070 1.644 Overall Balance Error7/19/2001 7 12:00 76.46 22.16 1.38 Out 3 0.267 0.184 0.996 Added to port 2
Out 4 30.480 7.801 0.541Error -0.193 0.086 0.107
Date Port Time %H2 %CO2 %CO Port 2 Port 3 Port 4 Port 7 Feed
7/19/2001 3 12:30 6.26 5.94 87.80 Flow Flow Flow Flow Flow
7/19/2001 3 12:40 7.03 6.25 88.81 39.858 1.374 41.169 43.769 2.600 slpm 2.69 MB. Errror (slpm)7/19/2001 2 12:55 73.17 21.69 5.14 1.6299 0.0562 1.6835 1.7899 0.1063 gmole/min 6.74 %Error7/19/2001 2 1:05 73.34 21.60 5.05 37.614 1.352 38.819 41.419 2.600 CO2 adjusted 2.56 Adjusted CO2 Errror7/19/2001 4 1:20 75.88 21.97 2.14 1.5382 0.0553 1.5874 1.6938 0.1063 6.80 %Error
7/19/2001 4 1:30 75.91 21.93 2.157/19/2001 7 1:45 74.79 23.28 1.94 Comp. Bal. H2 CO2 CO7/19/2001 7 1:55 74.33 23.73 1.94 In 2 29.428 8.696 2.047 Overall Balance Error
Out 3 0.090 0.082 1.194 Added to port 2Out 4 29.463 8.523 0.834Error -0.124 0.091 0.019
Date Port Time %H2 %CO2 %CO
7/19/2001 3 2:15 7.88 6.80 85.32 Bad Analysis7/19/2001 3 2:25 2.95 6.89 90.167/19/2001 3 4:20 4.18 11.47 84.35
RWGS July 19 Mass Balance Summary

RWGS July 19 Operation SummaryDate Port Time %H2 %CO2 %CO Feed mem P5 P8 Overall R9/H2 Feed T2 T3
7/19/2001 3 10:15 18.85 12.88 68.27 Flow Del P Port 2 Port 4 Conversion Ratio
7/19/2001 3 10:30 17.90 12.78 69.327/19/2001 3 10:40 18.62 12.47 68.927/19/2001 2 10:55 75.99 20.00 4.017/19/2001 2 11:05 75.77 20.08 4.15 2.6 33.54 52.87 19.32 79.46 1.1508 378.75 341.327/19/2001 4 11:25 78.63 19.97 1.407/19/2001 4 11:35 78.40 20.22 1.387/19/2001 7 11:50 76.42 22.29 1.287/19/2001 7 12:00 76.46 22.16 1.38
Date Port Time %H2 %CO2 %CO Feed mem P5 P8 Overall R9/H2 Feed T2 T3
7/19/2001 3 12:30 6.26 5.94 87.80 Flow Del P Port 2 Port 4 Conversion Ratio
7/19/2001 3 12:40 7.03 6.25 88.817/19/2001 2 12:55 73.17 21.69 5.147/19/2001 2 1:05 73.34 21.60 5.057/19/2001 4 1:20 75.88 21.97 2.14 2.6 39.42 59.69 20.27 93.09 1.0570 378.97 341.427/19/2001 4 1:30 75.91 21.93 2.157/19/2001 7 1:45 74.79 23.28 1.947/19/2001 7 1:55 74.33 23.73 1.94
Date Port Time %H2 %CO2 %CO Feed mem P5 P8 Overall R9/H2 Feed T2 T3
7/19/2001 3 2:15 7.88 6.80 85.32 Flow Del P Port 2 Port 4 Conversion Ratio
7/19/2001 3 2:25 2.95 6.89 90.167/19/2001 3 4:20 4.18 11.47 84.35 2.6 27.11 44.08 16.97 94.62 1.2870 378.19 342.23

RWGS July 27 Mass Balance Summary
Date Port Time %H2 %CO2 %CO Port 2 Port 3 Port 4 Port 7 Feed
7/27/2001 3 12:30 4.57 7.22 88.22 Flow Flow Flow Flow Flow
7/27/2001 3 12:40 2.43 6.05 91.52 35.038 1.161 35.189 37.389 2.200 slpm 1.31 MB. Errror (slpm)7/27/2001 2 1:05 72.93 21.30 5.77 1.4328 0.0475 1.4390 1.5290 0.0900 gmole/min 3.75 %Error7/27/2001 4 1:20 76.86 20.91 2.23 33.097 1.141 33.276 35.476 2.200 CO2 adjusted 1.32 Adjusted CO2 Errror7/27/2001 4 1:35 76.78 20.92 2.30 1.3534 0.0467 1.3608 1.4507 0.0900 3.99 %Error
Comp. Bal. H2 CO2 COIn 2 25.099 7.332 1.986 Overall Balance Error
Out 3 0.040 0.076 1.026 Added to port 2Out 4 25.563 6.960 0.753Error -0.504 0.297 0.207
Date Port Time %H2 %CO2 %CO Port 2 Port 3 Port 4 Port 7 Feed
7/27/2001 3 3:20 0.33 1.11 98.56 Flow Flow Flow Flow Flow
7/27/2001 3 3:30 1.00 1.06 97.94 29.437 1.109 29.328 31.528 2.200 slpm 1.00 MB. Errror (slpm)7/27/2001 2 3:55 62.16 29.57 8.27 1.2038 0.0453 1.1993 1.2893 0.0900 gmole/min 3.40 %Error7/27/2001 2 4:05 61.50 30.09 8.41 27.154 1.106 26.793 28.993 2.200 CO2 adjusted 0.74 Adjusted CO2 Errror7/27/2001 4 4:30 62.01 32.97 5.02 1.1104 0.0452 1.0956 1.1856 0.0900 2.74 %Error7/27/2001 4 4:40 61.16 33.54 5.317/27/2001 3 4:55 1.47 1.06 97.47 Comp. Bal. H2 CO2 CO7/27/2001 3 5:05 0.93 0.83 98.24 In 2 17.248 8.323 2.327 Overall Balance Error
Out 3 0.007 0.012 1.086 Added to port 2Out 4 16.500 8.909 1.384Error 0.741 -0.598 -0.143

RWGS July 27 Operation Summary
Port Time %H2 %CO2 %CO Feed mem P5 P8 Overall R9/H2 Feed T2 T3 T5
3 12:30 4.57 7.22 88.22 Flow Del P Port 2 Port 4 Conversion Ratio
3 12:40 2.43 6.05 91.522 1:05 72.93 21.30 5.774 1:20 76.86 20.91 2.234 1:35 76.78 20.92 2.30 2.20 34.73 52.63 17.90 96.37 1.0559 378.77 344.15 5.46
Port Time %H2 %CO2 %CO Feed mem P5 P8 Overall R9/Feed T2 T3 T5
3 3:20 0.33 1.11 98.56 Flow Del P Port 2 Port 4 Conversion Ratio
3 3:30 1.00 1.06 97.942 3:55 62.16 29.57 8.272 4:05 61.50 30.09 8.414 4:30 62.01 32.97 5.02 2.20 42.06 59.40 17.34 99.34 1.0079 378.18 344.92 5.834 4:40 61.16 33.54 5.313 4:55 1.47 1.06 97.473 5:05 0.93 0.83 98.24

Experimental Feed mem P5 P8 Overall R9/H2 Feed T2 T3 T5Run Flow P Port 2 Port 4 Conversion Ratio
7/18/01 9:30-10:55 2.0 35.94 52.65 16.71 97.37 1.0146 379.06 342.11 5.677/18/01 1:15-3:45 2.0 36.71 52.60 15.90 98.66 1.0175 378.80 344.10 5.617/18/01 4:00-5:25 2.4 34.68 52.76 18.08 95.04 1.0828 379.82 342.81 5.627/19/01 1:15-12:00 2.6 33.54 52.87 19.32 79.46 1.1508 378.97 341.42 5.887/19/01 12:30-1:55 2.6 39.42 59.69 20.27 93.09 1.0570 378.97 341.42 5.887/19/01 2:15-4:20 2.6 27.11 44.08 16.97 94.62 1.2870 378.19 342.23 5.757/27/01 12:30-1:35 2.2 34.73 52.63 17.90 96.37 1.0559 378.77 344.15 5.467/27/01 3:20-5:05 2.2 42.06 59.40 17.34 99.34 1.0079 378.18 344.92 5.83
RWGS Operation Summary
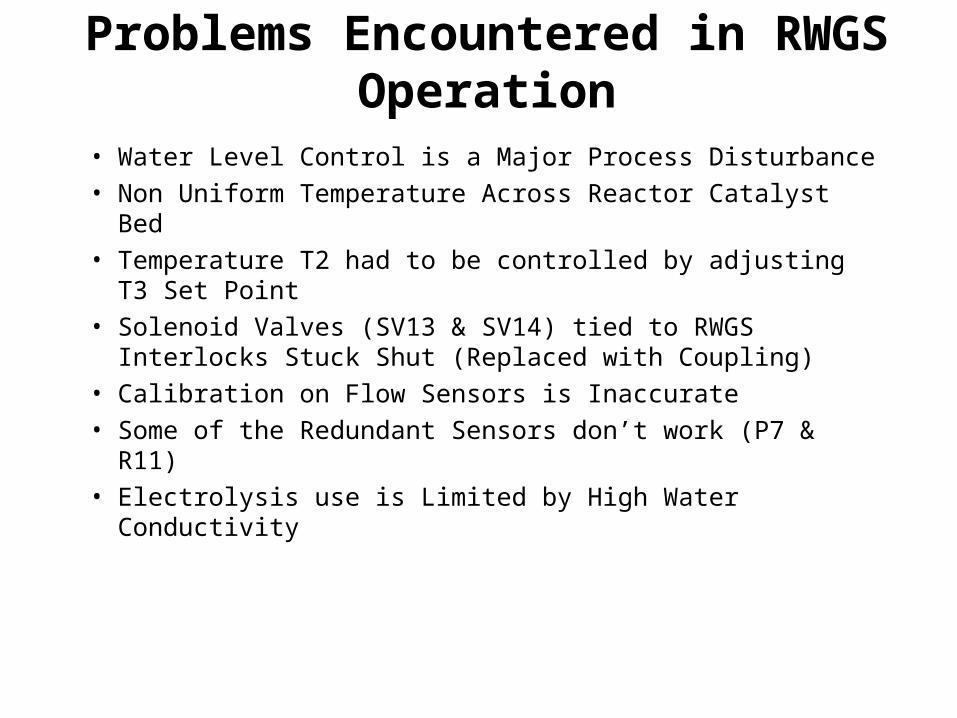
Problems Encountered in RWGS Operation
• Water Level Control is a Major Process Disturbance
• Non Uniform Temperature Across Reactor Catalyst Bed
• Temperature T2 had to be controlled by adjusting T3 Set Point
• Solenoid Valves (SV13 & SV14) tied to RWGS Interlocks Stuck Shut (Replaced with Coupling)
• Calibration on Flow Sensors is Inaccurate
• Some of the Redundant Sensors don’t work (P7 & R11)
• Electrolysis use is Limited by High Water Conductivity

Set Temperatures, Pressures, Conversion & Recycle Molar Flow Rates
Set Temperatures, Pressures, Conversion & Recycle Molar Flow Rates
Solve for Reactor Entrance & Exit Molar Flow Rates
Solve for Reactor Entrance & Exit Molar Flow Rates
Perform Isothermal & Isobaric Phase Equilibrium Calculations for the Condenser
Perform Isothermal & Isobaric Phase Equilibrium Calculations for the Condenser
Solve Equations for Membrane SeparationSolve Equations for Membrane Separation
Are Recycle Molar Flows Equal to Starting Values ?Are Recycle Molar Flows Equal to Starting Values ?
No
Yes Exit
Update Recycle Molar Flow Rates
Start
RWGS Model Development(Mass Balance Algorithm)
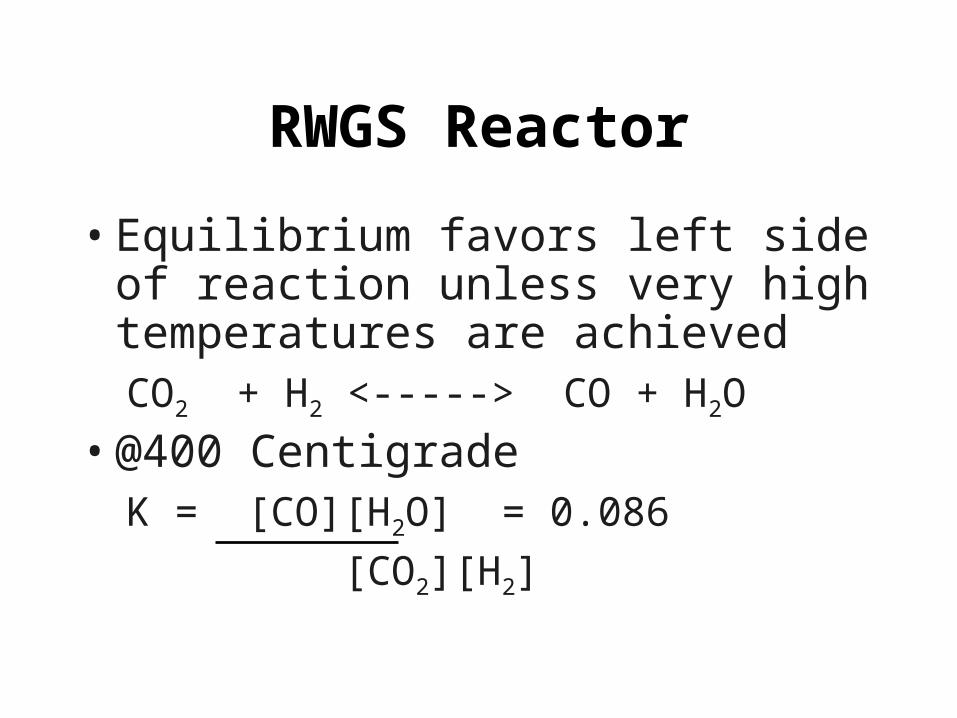
• Equilibrium favors left side of reaction unless very high temperatures are achievedCO2 + H2 <-----> CO + H2O
• @400 CentigradeK = [CO][H2O] = 0.086
[CO2][H2]
RWGS Reactor

• Reactor analysis assumes that equilibrium conversion is achieved.
• Conversion is found by solving a quadratic equation.
RWGS Reactor
K = [CO] [ H O]
[ CO ] [ H ] =
( + x ) ( + x )
( - x ) (1 - x )2
2 2
CO eq H O eq
CO eq eq
2
2

Condenser• Condenser is used to remove water
from the reactor exit stream • Ideal cases are assumed in modeling
the condenser Raoult’s Law for water in vapor phase
Partial Pressure = Vapor Pressure Henry’s Law for dissolved gases in liquid phase
Solubility is a function of temperature in pure H2O
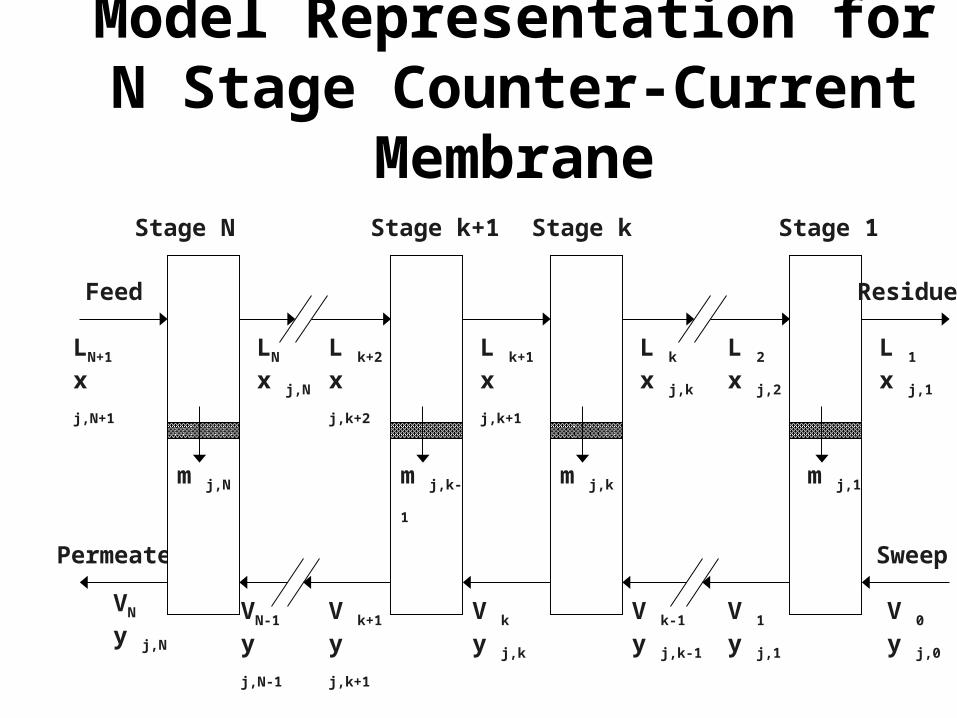
Model Representation for N Stage Counter-Current Membrane
Feed
Permeate
VN-1
y j,N-1
V k+1
y j,k+1
VN
y j,N
LN+1
x j,N+1
L k+2
x j,k+2
L k+1
x j,k+1
V k
y j,k
L k
x j,k
L 2
x j,2
L 1
x j,1
V k-1
y j,k-1
V 1
y j,1
V 0
y j,0
m j,N m j,k-1 m j,k m j,1
Residue
Sweep
Stage N Stage k+1 Stage k Stage 1
LN
x j,N

Summary of Membrane ModelingCalculated Actual Absolute Calculated Actual Absolute Calculated Actual Absolute
7/18/01 9:30-10:55 H2 H2 Difference CO2 CO2 Difference CO CO DifferenceFeed 20.591 20.864 0.273 7.036 6.786 0.25 1.983 1.96 0.023
Permeate 20.552 20.564 0.012 7.008 7.007 0.001 0.952 1.024 0.072Reject 0.039 0.026 0.013 0.028 0.029 0.001 1.031 0.959 0.072
7/18/01 1:15-3:45Feed 16.825 16.861 0.036 7.56 7.522 0.038 2.114 2.116 0.002
Permeate 16.812 16.812 0 7.547 7.547 0 1.126 1.126 0Reject 0.013 0.013 0 0.013 0.013 0 0.988 0.988 0
7/18/01 4:00-5:25Feed 26.265 25.333 0.932 7.265 8.126 0.861 1.793 1.864 0.071
Permeate 26.058 26.205 0.147 7.162 7.189 0.027 0.64 0.65 0.01Reject 0.207 0.059 0.148 0.103 0.076 0.027 1.153 1.144 0.009
7/19/01 1:15-12:00Feed 30.748 30.555 0.193 7.984 8.07 0.086 1.537 1.644 0.107
Permeate 30.011 30.48 0.469 7.681 7.801 0.12 0.3831 0.541 0.1579Reject 0.737 0.267 0.47 0.303 0.184 0.119 1.154 0.996 0.158
7/19/01 12:30-1:55Feed 29.552 29.428 0.124 8.605 8.696 0.091 2.028 2.047 0.019
Permeate 29.324 29.463 0.139 8.486 8.523 0.037 0.723 0.834 0.111Reject 0.228 0.09 0.138 0.119 0.082 0.037 1.305 1.194 0.111
7/27/01 12:30-1:35Feed 25.603 25.099 0.504 7.035 7.332 0.297 1.986 1.779 0.207
Permeate 25.515 25.563 0.048 6.987 6.96 0.027 0.753 0.747 0.006Reject 0.088 0.04 0.048 0.048 0.076 0.028 1.026 1.032 0.006
7/27/01 3:20-5:05Feed 16.507 17.248 0.741 8.921 8.323 0.598 2.47 2.327 0.143
Permeate 16.43 16.5 0.07 8.843 8.909 0.066 1.032 1.384 0.352Reject 0.077 0.007 0.07 0.078 0.012 0.066 1.438 1.086 0.352
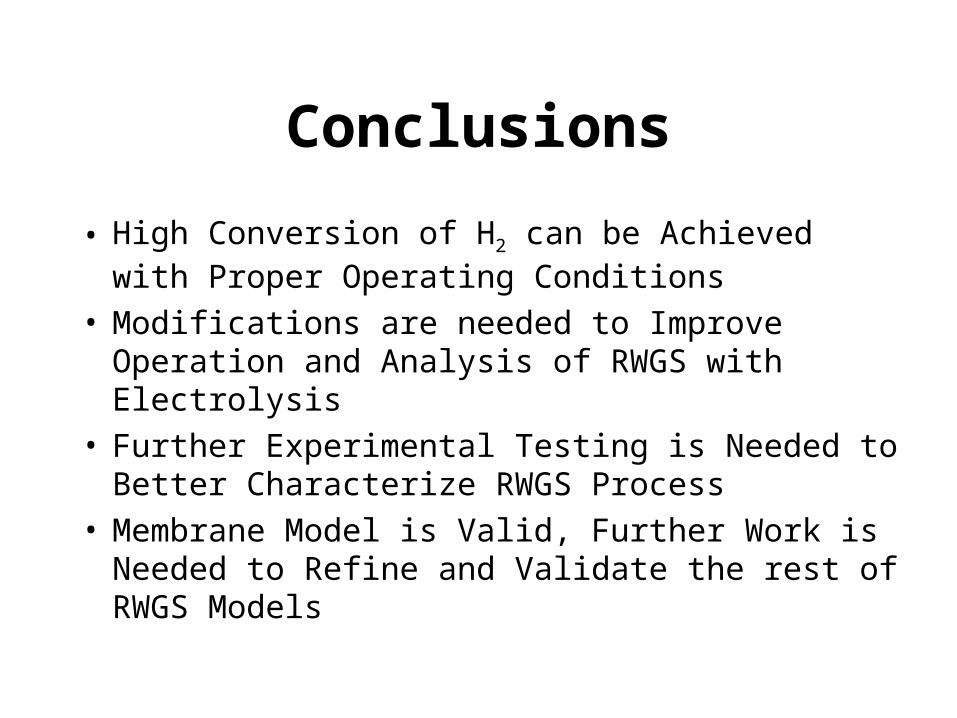
Conclusions
• High Conversion of H2 can be Achieved with Proper Operating Conditions
• Modifications are needed to Improve Operation and Analysis of RWGS with Electrolysis
• Further Experimental Testing is Needed to Better Characterize RWGS Process
• Membrane Model is Valid, Further Work is Needed to Refine and Validate the rest of RWGS Models

Recommended Modifications• Make Modifications to Sampling System
• Evaluate Other Methods for H2 Analysis– Calibrate Mass Spec
– GC using TCD with Argon Carrier
• Install Low Pressure Drop Bleed Valves for Water Level Control
• Recalibrate Flow Sensors Around Membrane (R8 & R12)
• Control Reactor Temperature with T2
• Add Integral Action to Pressure & Temperature Controller

Further Experimental Tests
• Examine Additional Steady States at Different System Pressures/Membrane P (@ Constant Temperature & Feed Ratio)
• Examine Additional Steady States at Different Feed Rates (@ Constant Temperature & Feed Ratio)
• Examine Effects of Varying Reactor Temperature• Examine Effects of Varying Fresh Feed Ratios