Operating subsidies (both direct payments ... - ec.europa.eu · 1 Operating subsidies (both direct...
17
1 Operating subsidies (both direct payments and rural development except investment support) 8 March 2018 This contribution gives an overview of the share of "operating subsidies" in farm income by different dimensions. The operating subsidies cover not only direct payments but also all rural developments measures which are not investments supports (Less Favoured Areas/Areas facing Natural Constraints, environmental measures and other measures which are not support to investments). The operating subsidies cover also the possible national aids and top-ups. The statistics presented in this section are mainly based on 2013-2015 data, i.e. before the implementation of the previous reform. Table of Contents Farm income, wages in the whole economy and share of operating subsidies ...................................................................................................................................................... 3 Income and share of the different operating subsidies by Member State .............................................................................................................................................................. 5 Income and share of the different operating subsidies by farm size ...................................................................................................................................................................... 7 Income and share of the different operating subsidies by income class ................................................................................................................................................................ 8 Income and share of the different operating subsidies by type of less favoured areas (LFA) ............................................................................................................................. 10 Income and share of the different operating subsidies by class of intensification ............................................................................................................................................... 12 Income and share of the different operating subsidies by class of labour intensity............................................................................................................................................. 13 Trend in income and operating subsidies by type of farming 2007-2015 ........................................................................................................................................................... 15 This document does not necessarily represent the official views of the European Commission Contact: DG Agriculture and Rural Development, Unit Farm Economics Tel: +32-2-29 91111 / E-mail: AGRI-[email protected] © European Union, 2018 - Reproduction authorised provided the source is acknowledged
Transcript of Operating subsidies (both direct payments ... - ec.europa.eu · 1 Operating subsidies (both direct...
1
Operating subsidies
(both direct payments and rural development except investment support) 8 March 2018
This contribution gives an overview of the share of "operating subsidies" in farm income by different dimensions. The operating subsidies cover not only direct payments
but also all rural developments measures which are not investments supports (Less Favoured Areas/Areas facing Natural Constraints, environmental measures and other
measures which are not support to investments). The operating subsidies cover also the possible national aids and top-ups.
The statistics presented in this section are mainly based on 2013-2015 data, i.e. before the implementation of the previous reform.
Table of Contents Farm income, wages in the whole economy and share of operating subsidies ...................................................................................................................................................... 3
Income and share of the different operating subsidies by Member State .............................................................................................................................................................. 5
Income and share of the different operating subsidies by farm size ...................................................................................................................................................................... 7
Income and share of the different operating subsidies by income class ................................................................................................................................................................ 8
Income and share of the different operating subsidies by type of less favoured areas (LFA) ............................................................................................................................. 10
Income and share of the different operating subsidies by class of intensification ............................................................................................................................................... 12
Income and share of the different operating subsidies by class of labour intensity ............................................................................................................................................. 13
Trend in income and operating subsidies by type of farming 2007-2015 ........................................................................................................................................................... 15
This document does not necessarily represent the official views of the European Commission
Contact: DG Agriculture and Rural Development, Unit Farm Economics
Tel: +32-2-29 91111 / E-mail: [email protected]
© European Union, 2018 - Reproduction authorised provided the source is acknowledged

2
Figures
Figure 1: Comparison of farm income with average wages and share of income support - EUROSTAT ............................................................................................................ 4
Figure 2: Comparison of farm income with average wages and share of income support - FADN ...................................................................................................................... 4
Figure 3: Farm income and operating subsidies by Member State in 2013-2015 ................................................................................................................................................. 6
Figure 4: Farm income and operating subsidies by physical size class in 2013-2015 ........................................................................................................................................... 7
Figure 5: Farm income and operating subsidies by economic size class in 2013-2015 ........................................................................................................................................ 7
Figure 6: Farm income and operating subsidies by income class in 2013-2015 ................................................................................................................................................... 9
Figure 7: Farm income and operating subsidies by LFA in 2013-2015 .............................................................................................................................................................. 10
Figure 8: Share of direct payments and LFA/ANC in income in ANC-Mountain by Member State .................................................................................................................. 11
Figure 9: Share of direct payments and LFA/ANC in income in areas facing natural constraints other than mountain by Member State ........................................................ 11
Figure 10: Farm income and operating subsidies by intensity class in 2013-2015 ............................................................................................................................................. 12
Figure 11: Farm income and operating subsidies by labour intensity class in 2013-2015 .................................................................................................................................. 14
Figure 12: Cereals, oilseeds and protein crops .................................................................................................................................................................................................... 15
Figure 13: Other fieldcrops .................................................................................................................................................................................................................................. 15
Figure 14: Dairy ................................................................................................................................................................................................................................................... 16
Figure 15: Cattle .................................................................................................................................................................................................................................................. 16
Figure 16: Sheep and goats .................................................................................................................................................................................................................................. 16
Figure 17: Pigs and poultry .................................................................................................................................................................................................................................. 16
Figure 18: Horticulture ........................................................................................................................................................................................................................................ 17
Figure 19: Fruits .................................................................................................................................................................................................................................................. 17
Figure 20: Wine ................................................................................................................................................................................................................................................... 17
Figure 21: Olives ................................................................................................................................................................................................................................................. 17
3
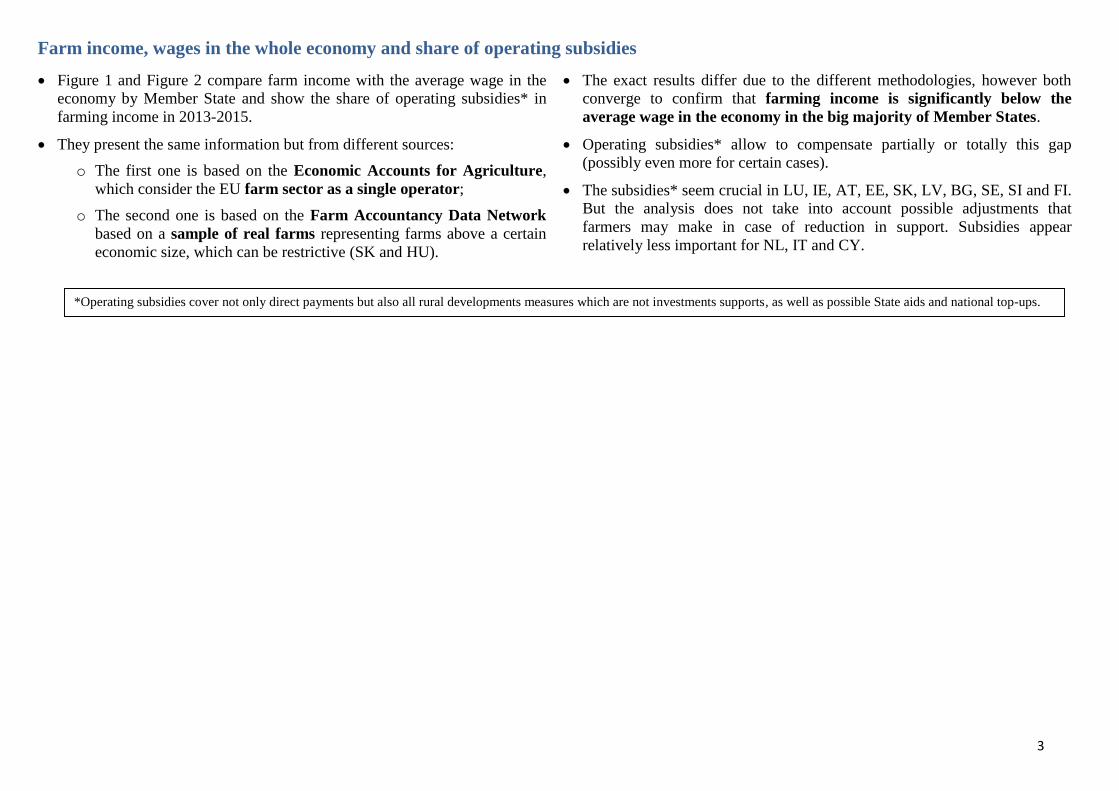
Farm income, wages in the whole economy and share of operating subsidies
Figure 1 and Figure 2 compare farm income with the average wage in the
economy by Member State and show the share of operating subsidies* in
farming income in 2013-2015.
They present the same information but from different sources:
o The first one is based on the Economic Accounts for Agriculture,
which consider the EU farm sector as a single operator;
o The second one is based on the Farm Accountancy Data Network
based on a sample of real farms representing farms above a certain
economic size, which can be restrictive (SK and HU).
The exact results differ due to the different methodologies, however both
converge to confirm that farming income is significantly below the
average wage in the economy in the big majority of Member States.
Operating subsidies* allow to compensate partially or totally this gap
(possibly even more for certain cases).
The subsidies* seem crucial in LU, IE, AT, EE, SK, LV, BG, SE, SI and FI.
But the analysis does not take into account possible adjustments that
farmers may make in case of reduction in support. Subsidies appear
relatively less important for NL, IT and CY.
*Operating subsidies cover not only direct payments but also all rural developments measures which are not investments supports, as well as possible State aids and national top-ups.

4
Figure 1: Comparison of farm income with average wages and share of income support - EUROSTAT
NB: Income indicator=Entrepreneurial income plus compensation of employees by total annual work units.
Source: EAA, ESTAT 2013-2015, EU FADN for number of hours worked
Figure 2: Comparison of farm income with average wages and share of income support - FADN
NB: Income indicator = Farm Net Income plus wages by total annual work units, i.e. amount remaining for remunerating all labour (paid and family labour).
Source: FADN 2013-2015 for farms' information and ESTAT for the wages in the whole economy.
-20 000
0
20 000
40 000
60 000
80 000
100 000
LU DK IE NL BE DE AT UK SE FI FR IT ES EL PT SI CY MT EE CZ SK HU PL LT LV RO BG HR
EU-15 EU-13
EUR/AWU Operating subsidies* per worker (including support covering possible negative marketincome)Market income (without support) per worker
Gross wages and salaries in the total economy (in current prices)
-20 000
0
20 000
40 000
60 000
80 000
100 000
LU DK IE NL BE DE AT UK SE FI FR IT ES EL PT SI CY MT EE CZ SK HU PL LT LV RO BG HR
EU-15 EU-13
EUR/AWU Operating subsidies* per worker (including support covering possible negative marketincome)"Operating subsidies* per worker (including support covering possible negative marketincome)"Gross wages and salaries in the total economy (in current prices)

5
Income and share of the different operating subsidies by Member State
Direct Payments have a function of income support as it is their
first objective.
However other operating subsidies also support income from an
accountancy point of view:
o Rural Development payments granted as "cost incurred
income foregone" (RD except investments support1);
o Possible national top-ups and State aids.
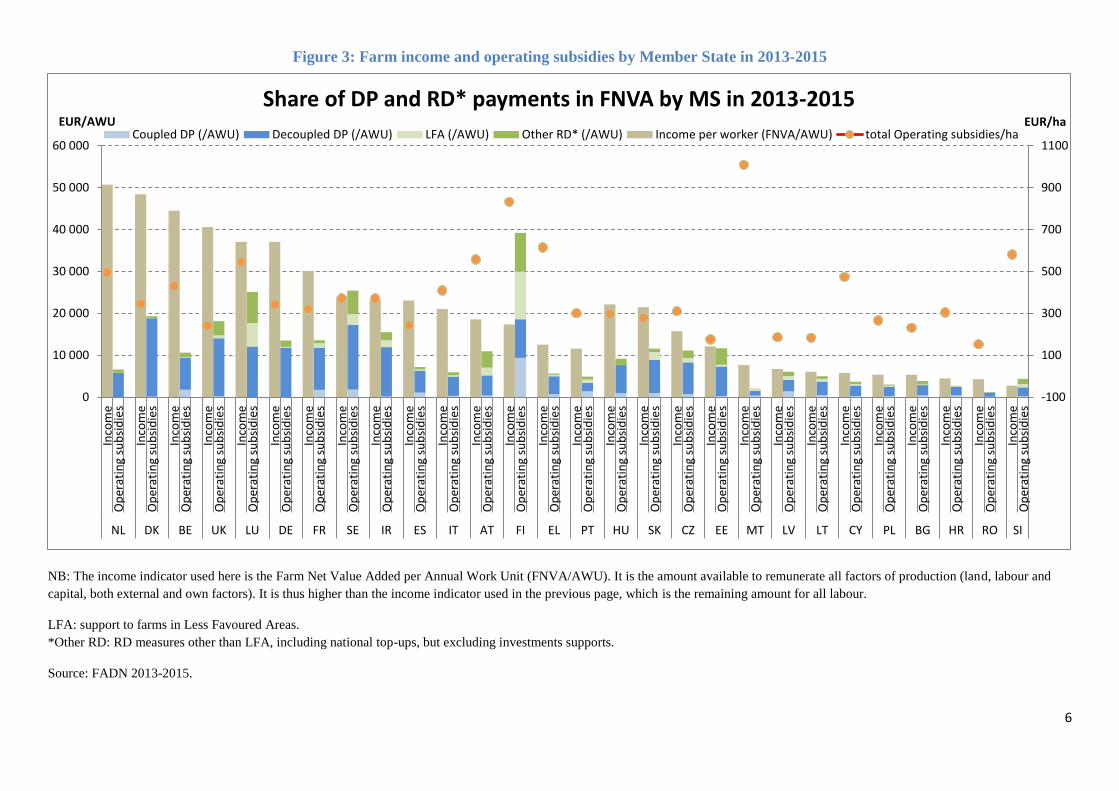
Figure 3 shows that farm income is heavily dependent on
operating subsidies especially in FI, SI, SK, SE and EE (here
another indicator is used, see note below the graph). On the
contrary, the average share of operating subsidies in income is low
in NL, MT , RO, BE and DK.
1 Investments may of course contribute to income indirectly at a later stage,
but investments supports are not considered in the FNVA.
We can also derive the relative importance of the different supports
in income:
o In DK, NL, DE and RO, decoupled direct payments are
predominant in support.
o Coupled direct payments represent a relative big share in
operating subsidies in FI, LV and PT in particular.
o The support to Less Favoured Areas (LFAs) plays a very
important role in farm income especially in FI, LU and MT.
o Other rural development measures (environmental measures
and also national top-ups) make up a relative big share of
support in AT, EE, LU and SI.
It is also important to note that, because of very different farms
structures and income, high operating subsidies per hectare do not
necessarily mean a high share of support in income and vice versa.
6
Figure 3: Farm income and operating subsidies by Member State in 2013-2015
NB: The income indicator used here is the Farm Net Value Added per Annual Work Unit (FNVA/AWU). It is the amount available to remunerate all factors of production (land, labour and
capital, both external and own factors). It is thus higher than the income indicator used in the previous page, which is the remaining amount for all labour.
LFA: support to farms in Less Favoured Areas.
*Other RD: RD measures other than LFA, including national top-ups, but excluding investments supports.
Source: FADN 2013-2015.
-100
100
300
500
700
900
1100
0
10 000
20 000
30 000
40 000
50 000
60 000
Inco
me
Op
erat
ing
sub
sid
ies
Inco
me
Op
erat
ing
sub
sid
ies
Inco
me
Op
erat
ing
sub
sid
ies
Inco
me
Op
erat
ing
sub
sid
ies
Inco
me
Op
erat
ing
sub
sid
ies
Inco
me
Op
erat
ing
sub
sid
ies
Inco
me
Op
erat
ing
sub
sid
ies
Inco
me
Op
erat
ing
sub
sid
ies
Inco
me
Op
erat
ing
sub
sid
ies
Inco
me
Op
erat
ing
sub
sid
ies
Inco
me
Op
erat
ing
sub
sid
ies
Inco
me
Op
erat
ing
sub
sid
ies
Inco
me
Op
erat
ing
sub
sid
ies
Inco
me
Op
erat
ing
sub
sid
ies
Inco
me
Op
erat
ing
sub
sid
ies
Inco
me
Op
erat
ing
sub
sid
ies
Inco
me
Op
erat
ing
sub
sid
ies
Inco
me
Op
erat
ing
sub
sid
ies
Inco
me
Op
erat
ing
sub
sid
ies
Inco
me
Op
erat
ing
sub
sid
ies
Inco
me
Op
erat
ing
sub
sid
ies
Inco
me
Op
erat
ing
sub
sid
ies
Inco
me
Op
erat
ing
sub
sid
ies
Inco
me
Op
erat
ing
sub
sid
ies
Inco
me
Op
erat
ing
sub
sid
ies
Inco
me
Op
erat
ing
sub
sid
ies
Inco
me
Op
erat
ing
sub
sid
ies
Inco
me
Op
erat
ing
sub
sid
ies
NL DK BE UK LU DE FR SE IR ES IT AT FI EL PT HU SK CZ EE MT LV LT CY PL BG HR RO SI
EUR/ha EUR/AWU
Share of DP and RD* payments in FNVA by MS in 2013-2015
Coupled DP (/AWU) Decoupled DP (/AWU) LFA (/AWU) Other RD* (/AWU) Income per worker (FNVA/AWU) total Operating subsidies/ha
7
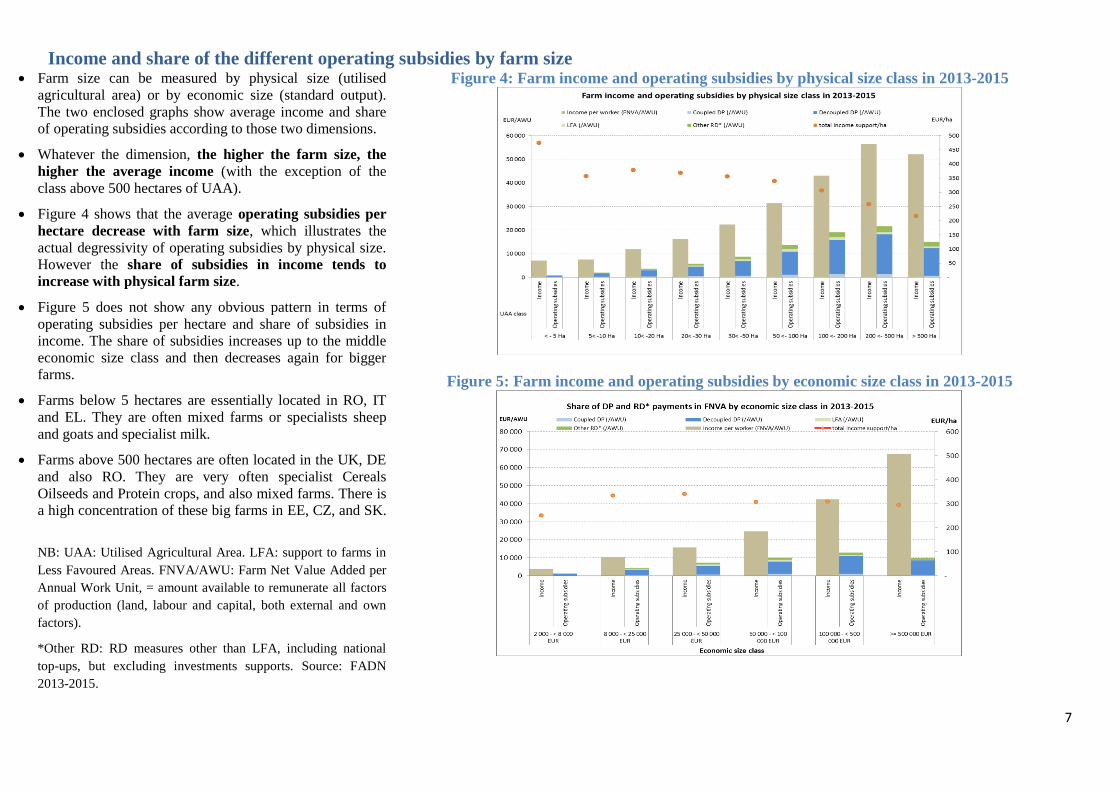
Income and share of the different operating subsidies by farm size Farm size can be measured by physical size (utilised
agricultural area) or by economic size (standard output).
The two enclosed graphs show average income and share
of operating subsidies according to those two dimensions.
Whatever the dimension, the higher the farm size, the
higher the average income (with the exception of the
class above 500 hectares of UAA).
Figure 4 shows that the average operating subsidies per
hectare decrease with farm size, which illustrates the
actual degressivity of operating subsidies by physical size.
However the share of subsidies in income tends to
increase with physical farm size.
Figure 5 does not show any obvious pattern in terms of
operating subsidies per hectare and share of subsidies in
income. The share of subsidies increases up to the middle
economic size class and then decreases again for bigger
farms.
Farms below 5 hectares are essentially located in RO, IT
and EL. They are often mixed farms or specialists sheep
and goats and specialist milk.
Farms above 500 hectares are often located in the UK, DE
and also RO. They are very often specialist Cereals
Oilseeds and Protein crops, and also mixed farms. There is
a high concentration of these big farms in EE, CZ, and SK.
NB: UAA: Utilised Agricultural Area. LFA: support to farms in
Less Favoured Areas. FNVA/AWU: Farm Net Value Added per
Annual Work Unit, = amount available to remunerate all factors
of production (land, labour and capital, both external and own
factors).
*Other RD: RD measures other than LFA, including national
top-ups, but excluding investments supports. Source: FADN
2013-2015.
Figure 4: Farm income and operating subsidies by physical size class in 2013-2015
Figure 5: Farm income and operating subsidies by economic size class in 2013-2015
8
Income and share of the different operating subsidies by income class
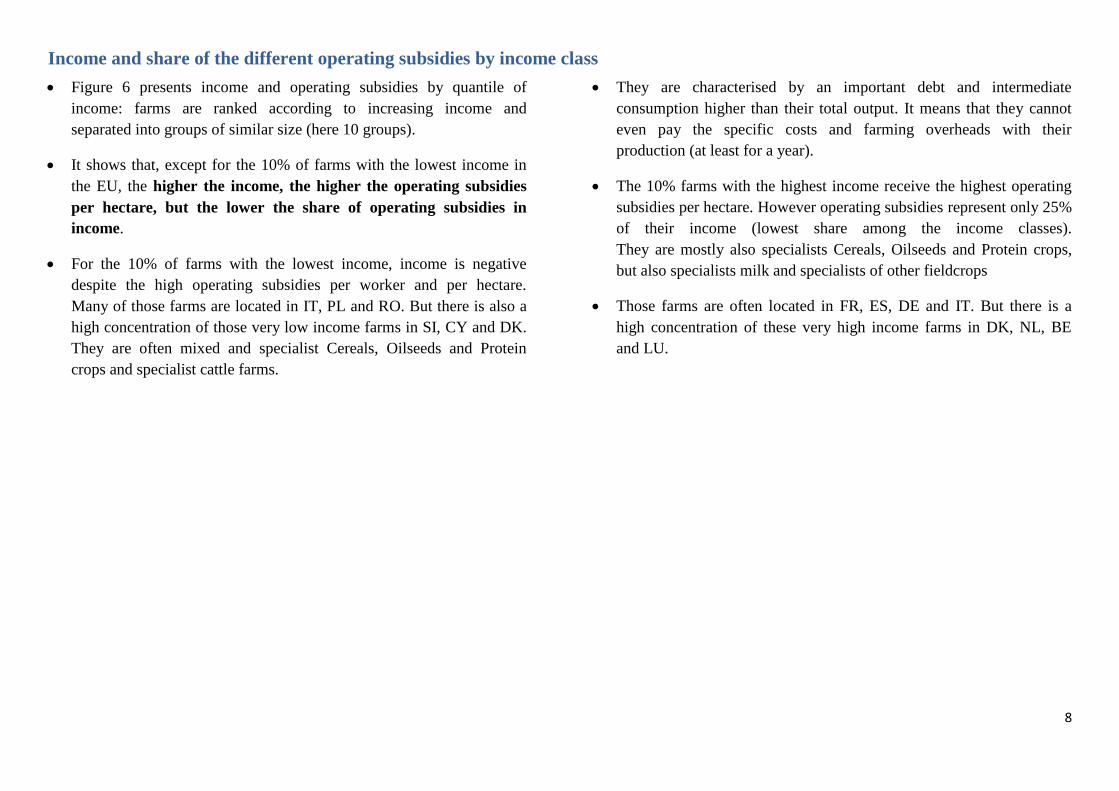
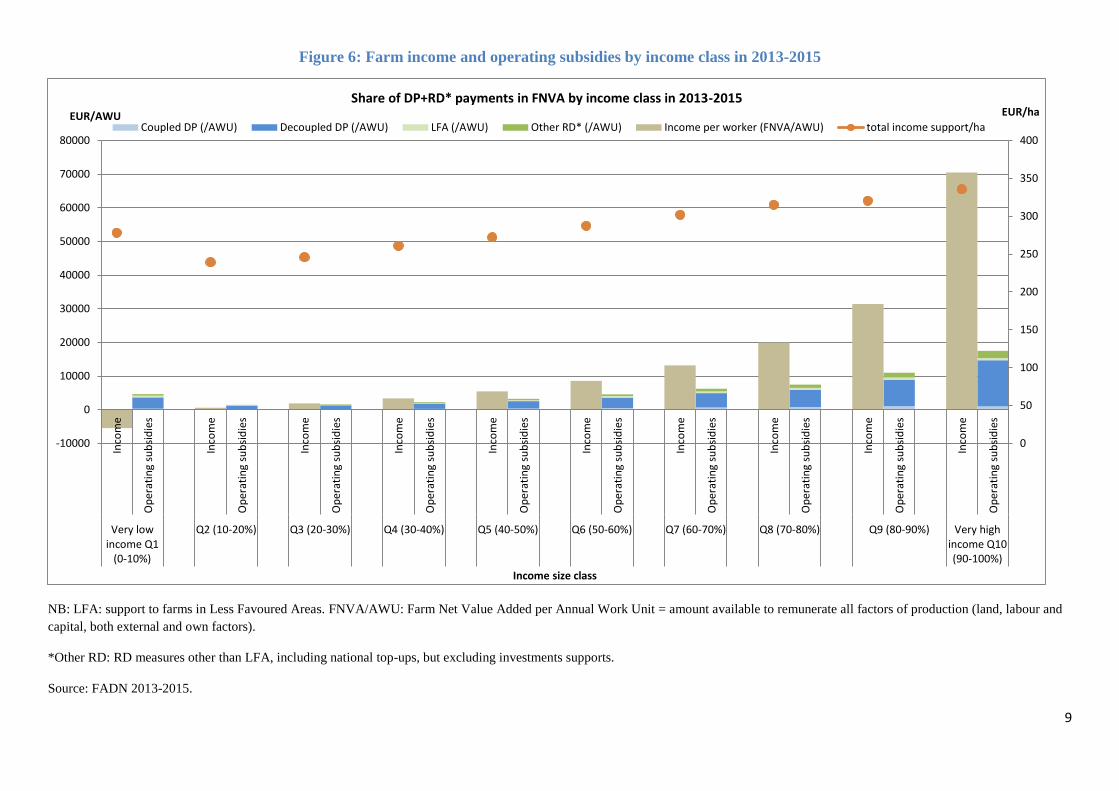
Figure 6 presents income and operating subsidies by quantile of
income: farms are ranked according to increasing income and
separated into groups of similar size (here 10 groups).
It shows that, except for the 10% of farms with the lowest income in
the EU, the higher the income, the higher the operating subsidies
per hectare, but the lower the share of operating subsidies in
income.
For the 10% of farms with the lowest income, income is negative
despite the high operating subsidies per worker and per hectare.
Many of those farms are located in IT, PL and RO. But there is also a
high concentration of those very low income farms in SI, CY and DK.
They are often mixed and specialist Cereals, Oilseeds and Protein
crops and specialist cattle farms.
They are characterised by an important debt and intermediate
consumption higher than their total output. It means that they cannot
even pay the specific costs and farming overheads with their
production (at least for a year).
The 10% farms with the highest income receive the highest operating
subsidies per hectare. However operating subsidies represent only 25%
of their income (lowest share among the income classes).
They are mostly also specialists Cereals, Oilseeds and Protein crops,
but also specialists milk and specialists of other fieldcrops
Those farms are often located in FR, ES, DE and IT. But there is a
high concentration of these very high income farms in DK, NL, BE
and LU.
9
Figure 6: Farm income and operating subsidies by income class in 2013-2015
NB: LFA: support to farms in Less Favoured Areas. FNVA/AWU: Farm Net Value Added per Annual Work Unit = amount available to remunerate all factors of production (land, labour and
capital, both external and own factors).
*Other RD: RD measures other than LFA, including national top-ups, but excluding investments supports.
Source: FADN 2013-2015.
0
50
100
150
200
250
300
350
400
-10000
0
10000
20000
30000
40000
50000
60000
70000
80000
Inco
me
Op
erat
ing
sub
sid
ies
Inco
me
Op
erat
ing
sub
sid
ies
Inco
me
Op
erat
ing
sub
sid
ies
Inco
me
Op
erat
ing
sub
sid
ies
Inco
me
Op
erat
ing
sub
sid
ies
Inco
me
Op
erat
ing
sub
sid
ies
Inco
me
Op
erat
ing
sub
sid
ies
Inco
me
Op
erat
ing
sub
sid
ies
Inco
me
Op
erat
ing
sub
sid
ies
Inco
me
Op
erat
ing
sub
sid
ies
Very lowincome Q1
(0-10%)
Q2 (10-20%) Q3 (20-30%) Q4 (30-40%) Q5 (40-50%) Q6 (50-60%) Q7 (60-70%) Q8 (70-80%) Q9 (80-90%) Very highincome Q10(90-100%)
EUR/ha EUR/AWU
Income size class
Share of DP+RD* payments in FNVA by income class in 2013-2015
Coupled DP (/AWU) Decoupled DP (/AWU) LFA (/AWU) Other RD* (/AWU) Income per worker (FNVA/AWU) total income support/ha
10
Income and share of the different operating subsidies by type of less favoured areas (LFA)
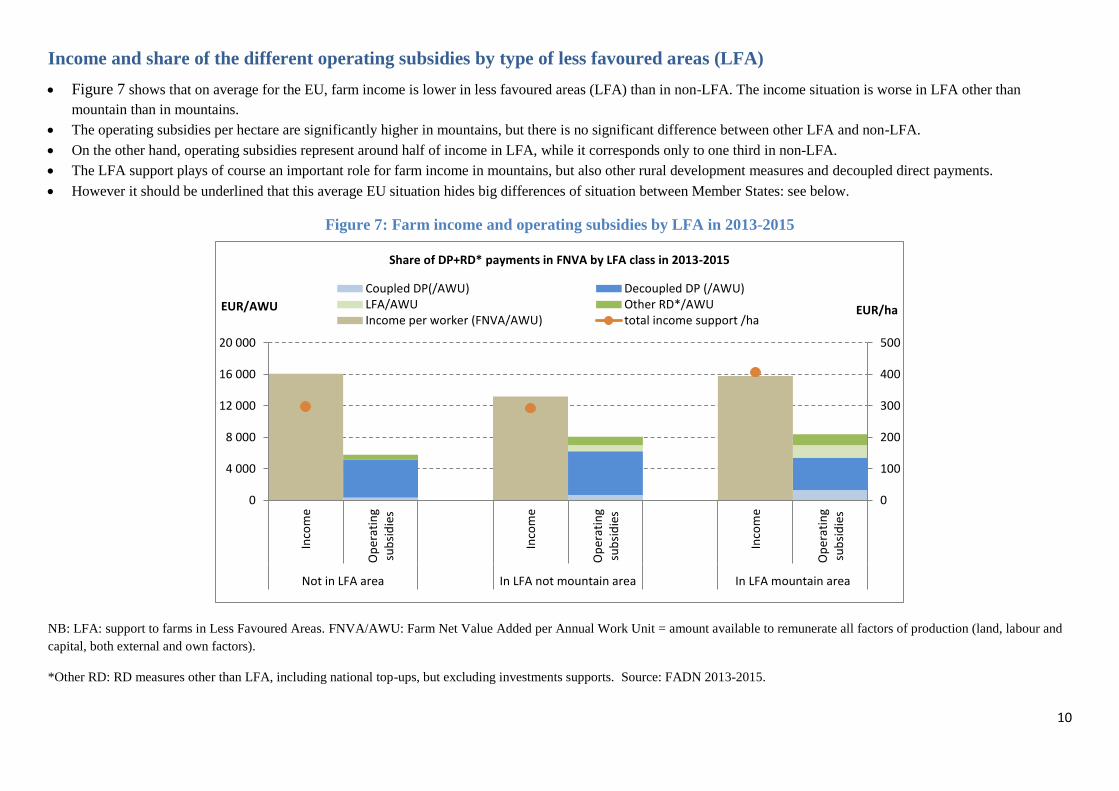
Figure 7 shows that on average for the EU, farm income is lower in less favoured areas (LFA) than in non-LFA. The income situation is worse in LFA other than
mountain than in mountains.
The operating subsidies per hectare are significantly higher in mountains, but there is no significant difference between other LFA and non-LFA.
On the other hand, operating subsidies represent around half of income in LFA, while it corresponds only to one third in non-LFA.
The LFA support plays of course an important role for farm income in mountains, but also other rural development measures and decoupled direct payments.
However it should be underlined that this average EU situation hides big differences of situation between Member States: see below.
Figure 7: Farm income and operating subsidies by LFA in 2013-2015
NB: LFA: support to farms in Less Favoured Areas. FNVA/AWU: Farm Net Value Added per Annual Work Unit = amount available to remunerate all factors of production (land, labour and
capital, both external and own factors).
*Other RD: RD measures other than LFA, including national top-ups, but excluding investments supports. Source: FADN 2013-2015.
0
100
200
300
400
500
0
4 000
8 000
12 000
16 000
20 000
Inco
me
Op
erat
ing
sub
sid
ies
Inco
me
Op
erat
ing
sub
sid
ies
Inco
me
Op
erat
ing
sub
sid
ies
Not in LFA area In LFA not mountain area In LFA mountain area
EUR/ha EUR/AWU
Share of DP+RD* payments in FNVA by LFA class in 2013-2015
Coupled DP(/AWU) Decoupled DP (/AWU)LFA/AWU Other RD*/AWUIncome per worker (FNVA/AWU) total income support /ha

11
Figure 8 and Figure 9 compare the income
situation in LFA (bars) compared to non-LFA
(dots). They also illustrate the share of direct
payments and LFA (or ANC) support in income.
For mountains, the compensation of the income
gap seems total in CZ and EL, while it remains
very low in AT, SE, BG, CY, DE, SI, SK and PL.
However this might arise because of differences in
main productions between mountains and non-LFA
(predominance of Cattle, Sheep and Goat and
Olive farms in mountains). It can also be noted that
in the Southern Member States (IT, ES, EL and
PT) where the difference in income between
mountains and non-LFA is in general not high, the
share of LFA support in income is normally low.
For other LFA, in many cases, the income is lower
than in non-LFA. But it is not always true (NL,
HU, LT). NL has actually ceased paying LFA in
the next period. The share of LFA payments in
income in other ANC is indeed generally low
(except in FI and LT), notably compared to this
share in mountains.
This illustrates the very different national
approaches to the LFA/ANC scheme.
NB: LFA: Less Favoured Areas. ANC: Areas under Natural
Constraint. Income indicator: Farm Net Value Added
per Annual Work Unit = amount available to remunerate
all factors of production (land, labour and capital, both
external and own factors).
Source: FADN - DG AGRI. Based on 2012 data, with
estimated 2019 direct payments (DP) (but no change of
farms structures and price environment)
Figure 8: Share of direct payments and LFA/ANC in income in ANC-Mountain by Member
State
Figure 9: Share of direct payments and LFA/ANC in income in areas facing natural constraints
other than mountain by Member State

12
Income and share of the different operating subsidies by class of intensification
Figure 10 presents income and subsidies by quantile of intensity: farms are ranked according to increasing intensity and separated into 10 groups of similar size.
Intensity has been measured as the ratio between the intermediate consumption (specific costs like fertilisers, pesticides and farming overheads e.g. water, electricity…)
and the utilised agricultural area. This has been identified as the best possible method to compare all farms.
Extensive classes have on average lower income than intensive classes, but up to a certain limit and with certain nuances. The most extensive class has a higher income
than the next four classes.
The more intensive the farm, the higher the operating subsidies per hectare.
It is interesting to note that the level of subsidies per worker is relatively stable (but lower for the most intensives).
However the share of direct payments and
rural development in income is higher for the
extensive classes than in very intensives classes:
o Direct payments represent some 45% of
income for the most extensive farms and
7% for the most intensive.
o Rural development measures (other than
for investments) represent 16% of
income for most extensive and 1% for the
most intensive.
There is a high share of very extensive farms in
the Baltic States and PT. Specialists in cereals,
oilseeds and protein crops (COP), specialists
olives, permanent crops combined, specialists
sheep and goats, mixed crops and specialists
cattle have higher shares of very extensive farms.
In NL, MT, BG, BE and CY there is a high
concentration of very intensive farms. Specialists
horticulture and pigs and poultry are often very
intensive.
Finally it is interesting to note that BG, HU, ES,
IT, PO and RO have both high share of very
extensive and very intensive farms, illustrating
the diversity of farming systems.
Figure 10: Farm income and operating subsidies by intensity class in 2013-2015
NB: LFA: support to farms in Less Favoured Areas. FNVA/AWU: Farm Net Value Added per Annual Work Unit = amount
available to remunerate all factors of production (land, labour and capital, both external and own factors).
*Other RD: RD measures other than LFA, including national top-ups, but excluding investments supports. Source: FADN
2013-2015.
13
Income and share of the different operating subsidies by class of labour intensity
Figure 11 presents income and operating subsidies by decile of labour
intensity: farms are ranked according to increasing labour intensity and
separated into 10 groups of similar size.
Labour intensity is evaluated by the ratio between the total annual work
units and the utilised agricultural area.
The higher the labour intensity, the lower the average income up to
a certain level of income intensity. Above 0.16 annual work unit per
hectare, the average income does not change much with higher labour
intensity.
The operating subsidies per hectare do not change much according
to labour intensity, except for the two marginal classes: support per
hectare is lower for the lowest labour intensive and very high for the
most labour intensive.
The share of subsidies (both direct payments and rural development
measures) in income is constantly decreasing with increasing labour
intensity.
Many farms with the lowest labour intensity are located in FR, ES and
UK. They are mostly specialised in the production of cereals, oilseeds
and protein crops (COP) or of cattle. In DK, FI, SE, UK, there is a high
concentration of those farms (but their total absolute number is lower
than in the above-mentioned Member States).
The most labour intensive farms are located in RO. They are often also
specialised in the production of cereals, oilseeds and protein crops
(COP) but also in milk production or in cattle. In BG, MT and CY there
is a high concentration of those farms.
NB: LFA: support to farms in Less Favoured Areas. FNVA/AWU: Farm Net Value Added per Annual Work Unit = amount available to remunerate all factors of production
(land, labour and capital, both external and own factors).

14
Figure 11: Farm income and operating subsidies by labour intensity class in 2013-2015
* Other RD: RD measures other than LFA, including national top-ups, but excluding investments supports.
Source: FADN 2013-2015
0
200
400
600
800
1000
1200
1400
0
5000
10000
15000
20000
25000
30000
35000
40000
45000
50000
Inco
me
Op
erating su
bsid
ies
Inco
me
Op
erating su
bsid
ies
Inco
me
Op
erating su
bsid
ies
Inco
me
Op
erating su
bsid
ies
Inco
me
Op
erating su
bsid
ies
Inco
me
Op
erating su
bsid
ies
Inco
me
Op
erating su
bsid
ies
Inco
me
Op
erating su
bsid
ies
Inco
me
Op
erating su
bsid
ies
Inco
me
Op
erating su
bsid
ies
Very lowlabour
intensityQ1 (0-10%)
Q2 (10-20%)
Q3 (20-30%)
Q4 (30-40%)
Q5 (40-50%)
Q6 (50-60%)
Q7 (60-70%)
Q8 (70-80%)
Q9 (80-90%)
Very highlabour
intensityQ10 (90-
100%)
EUR/ha EUR/AWU
Share of DP+RD* payments in FNVA by labour intensity class in 2013-2015
Coupled DP (/AWU) Decoupled DP (/AWU) LFA (/AWU)
Other RD*/AWU Income per worker (FNVA/AWU) Total income support/ha
15
Trend in income and operating subsidies by type of farming 2007-2015
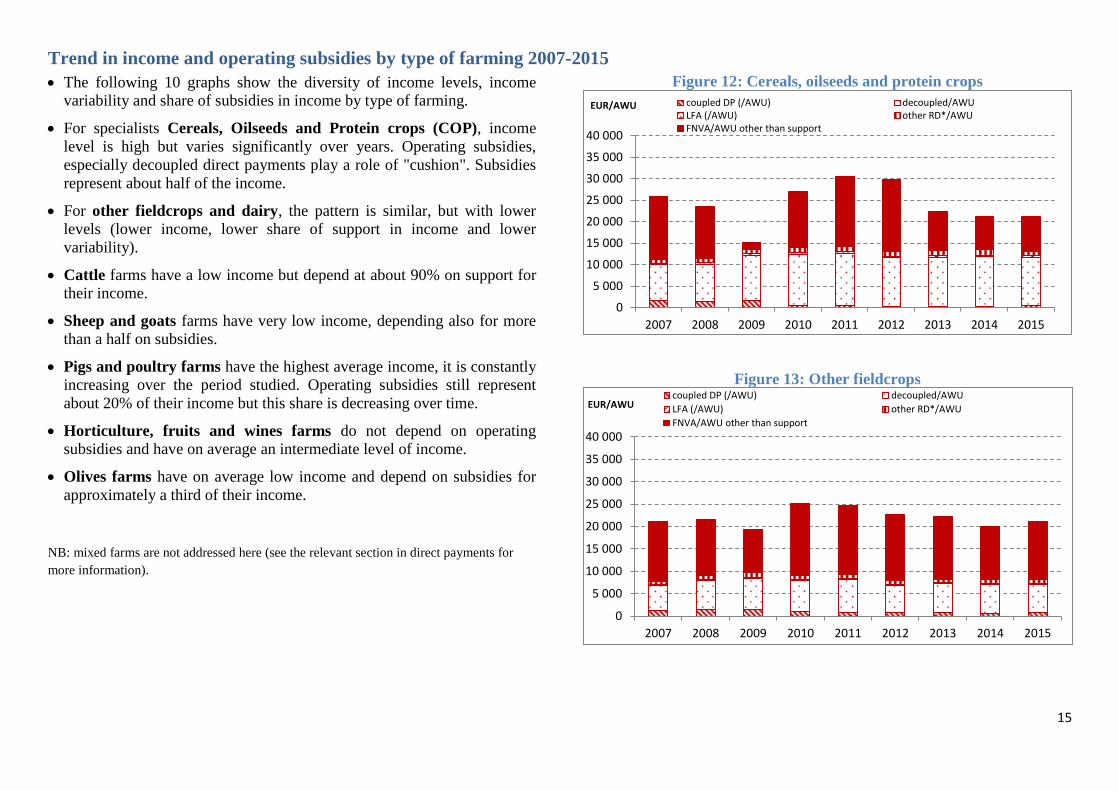
The following 10 graphs show the diversity of income levels, income
variability and share of subsidies in income by type of farming.
For specialists Cereals, Oilseeds and Protein crops (COP), income
level is high but varies significantly over years. Operating subsidies,
especially decoupled direct payments play a role of "cushion". Subsidies
represent about half of the income.
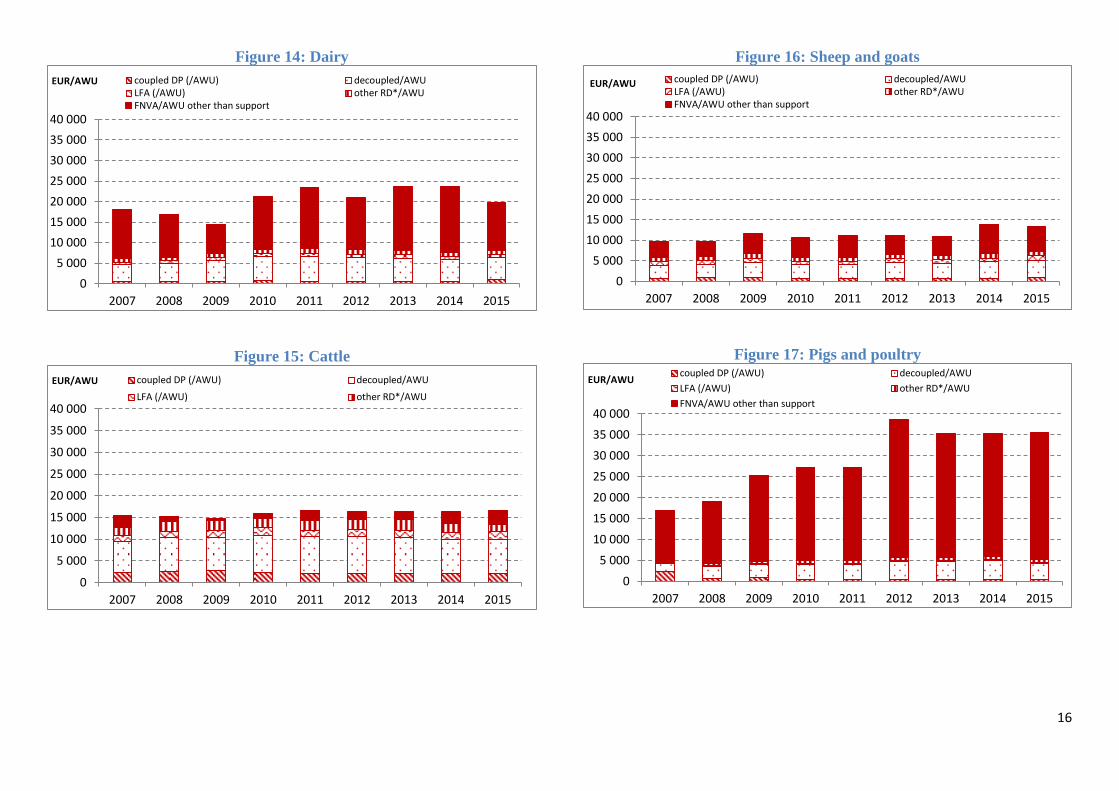
For other fieldcrops and dairy, the pattern is similar, but with lower
levels (lower income, lower share of support in income and lower
variability).
Cattle farms have a low income but depend at about 90% on support for
their income.
Sheep and goats farms have very low income, depending also for more
than a half on subsidies.
Pigs and poultry farms have the highest average income, it is constantly
increasing over the period studied. Operating subsidies still represent
about 20% of their income but this share is decreasing over time.
Horticulture, fruits and wines farms do not depend on operating
subsidies and have on average an intermediate level of income.
Olives farms have on average low income and depend on subsidies for
approximately a third of their income.
NB: mixed farms are not addressed here (see the relevant section in direct payments for
more information).
Figure 12: Cereals, oilseeds and protein crops
Figure 13: Other fieldcrops
0
5 000
10 000
15 000
20 000
25 000
30 000
35 000
40 000
2007 2008 2009 2010 2011 2012 2013 2014 2015
EUR/AWU coupled DP (/AWU) decoupled/AWULFA (/AWU) other RD*/AWUFNVA/AWU other than support
0
5 000
10 000
15 000
20 000
25 000
30 000
35 000
40 000
2007 2008 2009 2010 2011 2012 2013 2014 2015
EUR/AWU coupled DP (/AWU) decoupled/AWU
LFA (/AWU) other RD*/AWU
FNVA/AWU other than support
16
Figure 14: Dairy
Figure 15: Cattle
Figure 16: Sheep and goats
Figure 17: Pigs and poultry
0
5 000
10 000
15 000
20 000
25 000
30 000
35 000
40 000
2007 2008 2009 2010 2011 2012 2013 2014 2015
EUR/AWU coupled DP (/AWU) decoupled/AWULFA (/AWU) other RD*/AWUFNVA/AWU other than support
0
5 000
10 000
15 000
20 000
25 000
30 000
35 000
40 000
2007 2008 2009 2010 2011 2012 2013 2014 2015
EUR/AWU coupled DP (/AWU) decoupled/AWU
LFA (/AWU) other RD*/AWU
0
5 000
10 000
15 000
20 000
25 000
30 000
35 000
40 000
2007 2008 2009 2010 2011 2012 2013 2014 2015
EUR/AWU coupled DP (/AWU) decoupled/AWULFA (/AWU) other RD*/AWUFNVA/AWU other than support
0
5 000
10 000
15 000
20 000
25 000
30 000
35 000
40 000
2007 2008 2009 2010 2011 2012 2013 2014 2015
EUR/AWU coupled DP (/AWU) decoupled/AWU
LFA (/AWU) other RD*/AWU
FNVA/AWU other than support

17
Figure 18: Horticulture
Figure 19: Fruits
Figure 20: Wine
Figure 21: Olives
NB: LFA: support to farms in Less Favoured Areas. FNVA/AWU: Farm Net Value Added per Annual Work Unit = amount available to remunerate all factors of production (land, labour and
capital, both external and own factors).
*Other RD: RD measures other than LFA, including national top-ups, but excluding investments supports. Source: FADN 2007-2015.
0
5 000
10 000
15 000
20 000
25 000
30 000
35 000
40 000
2007 2008 2009 2010 2011 2012 2013 2014 2015
EUR/AWU coupled DP (/AWU) decoupled/AWULFA (/AWU) other RD*/AWUFNVA/AWU other than support
0
5 000
10 000
15 000
20 000
25 000
30 000
35 000
40 000
2007 2008 2009 2010 2011 2012 2013 2014 2015
EUR/AWU coupled DP (/AWU) decoupled/AWULFA (/AWU) other RD*/AWUFNVA/AWU other than support
0
5 000
10 000
15 000
20 000
25 000
30 000
35 000
40 000
2007 2008 2009 2010 2011 2012 2013 2014 2015
EUR/AWU coupled DP (/AWU) decoupled/AWULFA (/AWU) other RD*/AWUFNVA/AWU other than support
0
5 000
10 000
15 000
20 000
25 000
30 000
35 000
40 000
2007 2008 2009 2010 2011 2012 2013 2014 2015
EUR/AWU coupled DP (/AWU) decoupled/AWU
LFA (/AWU) other RD*/AWU
FNVA/AWU other than support