Operating Expenditure Forecasting Methodology R - Opex Modelling... · forecasting approach for...
30
ElectraNet Corporate Headquarters 52-55 East Terrace, Adelaide, South Australia 5000 • PO Box, 7096, Hutt Street Post Office, Adelaide, South Australia 5000 Tel: (08) 8404 7966 • Fax: (08) 8404 7104 • Toll Free: 1800 243 853 Operating Expenditure Forecasting Methodology Regulatory Period 2013 - 2018 June 2012 Version 1.1
Transcript of Operating Expenditure Forecasting Methodology R - Opex Modelling... · forecasting approach for...

ElectraNet Corporate Headquarters 52-55 East Terrace, Adelaide, South Australia 5000 • PO Box, 7096, Hutt Street Post Office, Adelaide, South Australia 5000
Tel: (08) 8404 7966 • Fax: (08) 8404 7104 • Toll Free: 1800 243 853
Operating Expenditure Forecasting Methodology
Regulatory Period 2013 - 2018
June 2012
Version 1.1

OPERATING EXPENDITURE FORECASTING METHODOLOGY June 2012
Version 1.1 Page 2 of 30
Copyright and Disclaimer
Copyright in this material is owned by or licensed to ElectraNet. Permission to publish, modify, commercialise or alter this material must be sought directly from ElectraNet.
Reasonable endeavours have been used to ensure that the information contained in this report is accurate at the time of writing however ElectraNet gives no warranty and accepts no liability for any loss or damage incurred in reliance on this information.
Revision Record
Date Version Description Author Checked By Approved By
May 12 1.0 Initial version Andrew Gniel Regulatory Consultant
Simon Appleby Senior Manager Regulatory Affairs
Rainer Korte Executive Manager Network Strategy & Regulatory Affairs
June 12 1.1 Updated opex methodology flowchart

OPERATING EXPENDITURE FORECASTING METHODOLOGY June 2012
Version 1.1 Page 3 of 30
Contents
1. INTRODUCTION ................................................................................................................. 5
2. OPERATING COST CATEGORIES .................................................................................... 5
3. FORECASTING METHODOLOGY ..................................................................................... 6
3.1 EFFICIENT BASE YEAR ................................................................................................................. 7
3.2 ADJUSTMENT OF BASE YEAR ........................................................................................................ 7
3.2.1 One-off costs ............................................................................................................................ 7
3.2.2 Zero-based costs ...................................................................................................................... 7
4. DIRECT OPERATING AND MAINTENANCE EXPENDITURE ........................................... 8
4.1 FIELD MAINTENANCE ................................................................................................................... 8
4.1.1 Routine Maintenance ................................................................................................................ 9
4.1.2 Corrective Maintenance .......................................................................................................... 12
4.1.3 Operational Refurbishment ..................................................................................................... 13
4.2 NETWORK OPTIMISATION .......................................................................................................... 15
4.3 MAINTENANCE SUPPORT ........................................................................................................... 15
4.3.1 Land Tax ................................................................................................................................. 15
4.4 NETWORK OPERATIONS ............................................................................................................ 16
5. OTHER CONTROLLABLE COSTS .................................................................................. 16
5.1 ASSET MANAGER SUPPORT....................................................................................................... 16
5.1.1 Revenue reset costs ............................................................................................................... 16
5.2 CORPORATE SUPPORT .............................................................................................................. 17
5.2.1 Insurance ................................................................................................................................ 17
5.3 SUPERANNUATION CONTRIBUTION SHORTFALL ........................................................................... 17
6. OTHER OPERATING COSTS .......................................................................................... 17
6.1 SELF-INSURANCE ...................................................................................................................... 17
6.2 NETWORK SUPPORT .................................................................................................................. 18
6.3 DEBT RAISING COSTS ................................................................................................................ 19
7. SCOPE CHANGES ........................................................................................................... 20
7.1 NETWORK OPTIMISATION .......................................................................................................... 20
7.2 ACCOMMODATION REQUIREMENTS ............................................................................................ 21
7.3 SUPERANNUATION COSTS ......................................................................................................... 22
7.4 OTHER SCOPE CHANGES ........................................................................................................... 23
8. ESCALATION ................................................................................................................... 23
8.1 ASSET GROWTH ....................................................................................................................... 23
8.1.1 Base year cost categories ...................................................................................................... 23
8.1.2 Zero base cost categories ...................................................................................................... 24

OPERATING EXPENDITURE FORECASTING METHODOLOGY June 2012
Version 1.1 Page 4 of 30
8.2 SCALE EFFICIENCY ................................................................................................................... 24
8.3 COST ESCALATION .................................................................................................................... 25
8.3.1 Wages growth ......................................................................................................................... 26
8.3.2 Non-labour escalation ............................................................................................................. 27
9. BENCHMARKING ............................................................................................................ 27
9.1 RATIO ANALYSIS ....................................................................................................................... 27
9.2 INDUSTRY BENCHMARKS ........................................................................................................... 27
APPENDIX A ELECTRANET’S FORECAST OPERATNG EXPENDITURE METHODOLOGY ... 28
APPENDIX B ELECTRANET’S FORECAST OPERATING EXPENDITURE ESCALATION METHODOLOGY .................................................................................................. 29

OPERATING EXPENDITURE FORECASTING METHODOLOGY June 2012
Version 1.1 Page 5 of 30
1. Introduction
This document describes ElectraNet’s operating expenditure forecasting methodology as required by clause 6A.1.2 of the Rules.
2. Operating Cost Categories
ElectraNet’s operating expenditure forecast methodology separates operating expenditure into three clearly defined high-level cost categories:
direct operating and maintenance;
other controllable costs; and
other operating costs.
The composition of these major cost categories is illustrated in Figure 1 below:
Total Operating
Expenditure
Controllable
Operating
Expenditure
Direct Operating
and Maintenance
Field Maintenance
Maintenance
Support
Network Operations
Asset Manager
Support
Corporate Support
Self Insurance
Network Support
Debt Raising
Other Controllable
Costs
Other Operating
Costs
Other Operating
Costs
Network
Optimisation
Figure 1: ElectraNet’s operating cost categories

OPERATING EXPENDITURE FORECASTING METHODOLOGY June 2012
Version 1.1 Page 6 of 30
3. Forecasting Methodology
The operating expenditure forecasting methodology follows a base year approach, as shown diagrammatically in Figure 2.
Figure 2: Operating expenditure forecasting methodology
As illustrated in the Figure 2 above, the base year forecasting methodology involves:
selecting an efficient base year;
removing one-off costs and zero-based costs from the base year;
developing ‘bottom up’ forecasts for zero-based cost categories;
adding the cost of scope changes that are not represented in the base year;
escalating costs for asset growth;
applying efficiency factors; and
applying escalation for growth in wages and non-labour costs.
Table 1 sets out the forecast approach adopted for each operating expenditure category in ElectraNet’s forecasting methodology.
Table 1: Operating expenditure cost category forecasting approach
Expenditure Category Base Year Zero Based
Routine Maintenance
Corrective Maintenance*
Operational Refurbishment
Network Optimisation
Maintenance Support
Efficient base
year costs
2011-12
Remove Zero
Base and One-off
Costs
Add Scope
Changes from
Base Year
Apply Asset
Growth Model
and efficiency
factors
OPEX Model
Apply CAPEX
asset changes
Routine
Maintenance
Model
Identify
refurbishment
projects and
network
optimisation
Scope and
estimate projects
Opex
Forecast
Maintenance tasks
Contract rates
Condition
assessment
Risk analysis
Capex program
Capex Growth factors
Scale efficiency factors
e.g.
maintenance
costs
e.g. land tax, other
scope changesWages growth,
inflation, productivity
gains
Identify corrective
maintenance
requirements
Defect rates,
Risk analysis
Develop
projection based
on defect rates
Labour & non-
labour escalation

OPERATING EXPENDITURE FORECASTING METHODOLOGY June 2012
Version 1.1 Page 7 of 30
Expenditure Category Base Year Zero Based
Operations
Asset Management Support
Corporate Support
Insurances
Network Support
Debt Raising
* hybrid approach utilising zero base forecast of current incoming corrective effort extrapolated
The following sections of this report provide a more detailed description of ElectraNet’s forecasting approach for each cost category based on the application of the steps outlined above.
The detailed application of the modelling methodology within the operating expenditure forecasting model is outlined in Appendix A.
3.1 Efficient base year
The current financial year 2011-12 has been adopted as an efficient base year for estimating future costs, as it contains the latest actual cost information available to the business.
ElectraNet also considers that its expected 2011-12 opex outcomes are representative of current costs, and provide an efficient base level from which to forecast future expenditure requirements, with the exception of a number of cost components identified below which are subject to base year adjustments.
3.2 Adjustment of base year
The base year is adjusted by removing one-off costs and zero-based costs for which the base year is not representative of future expenditure requirements.
3.2.1 One-off costs
One-off costs are removed from the base year costs as part of the forecasting methodology. These comprise:
Revenue Reset costs
3.2.2 Zero-based costs
Those cost components for which a zero based forecasting methodology has been applied are also removed from the controllable base year costs as part of the forecasting methodology, and a separate bottom-up forecast developed to provide an accurate reflection of expected future costs:
routine maintenance
corrective maintenance
OPERATING EXPENDITURE FORECASTING METHODOLOGY June 2012
Version 1.1 Page 8 of 30
operational refurbishment
network optimisation
insurance costs
superannuation costs
land tax liabilities
Other non-controllable cost components are removed and forecast separately to the base year approach comprising:
self-insurance
benchmark debt raising costs
network support
4. Direct Operating and Maintenance Expenditure
4.1 Field Maintenance
Field maintenance refers to expenditure associated with all field-based activities undertaken by ElectraNet and comprises routine, corrective and refurbishment expenditure. ElectraNet is continuing to implement its established asset management strategies, informed by detailed information now available on the condition and performance of its assets. Current expenditure levels are not fully representative of the extent of these future requirements. A forecast has therefore been developed from a detailed model of maintenance tasks, outsourced contract rates and equipment head counts.
These functions comprise:
Routine maintenance: Field inspections and maintenance activities that are completed to a predetermined schedule and scope;
Corrective maintenance: Field activities to mitigate short term risks and restore the condition or function of a transmission system asset, or component, to a satisfactory operational state; and
Operational refurbishment: Planned maintenance project activities to mitigate medium term risks identified through asset condition assessments and to provide asset information required to manage compliance with legal obligations and good electricity industry practice.
ElectraNet competitively outsources all field maintenance activities. Field maintenance contracts are performance-based with financial incentives linked to the achievement of specified targets. ElectraNet has recently undertaken a competitive process to engage contractors for the delivery of its maintenance program. Costs generally include all labour and materials required to perform these activities.
Costs for field maintenance are driven by the need to appropriately manage asset risk. As these activities are predominantly labour-based, labour cost movements have a significant impact on this cost component.

OPERATING EXPENDITURE FORECASTING METHODOLOGY June 2012
Version 1.1 Page 9 of 30
The Asset Management Plan provides the basis for the forecast for routine, corrective and maintenance projects for the new regulatory control period 2013-14 to 2017-18.
The Asset Management Plan recognises ElectraNet’s understanding of and management of risks associated with the operation and management of the asset base based on its Asset Management Planning Framework. The Asset Management Planning Framework provides a systemic and documented understanding of asset condition and overall asset risk within the regulatory period and long term network development context. Specifically the Asset Management Planning Framework provides a structure for asset condition data collection and analysis including;
Documented risk framework;
A framework for assessing overall asset condition during the asset life cycle; and
Asset condition reporting information requirements, tools and processes.
ElectraNet’s enterprise management system (based on the SAP suite of software) is the Asset Management System which provides the framework for development and management of field maintenance activities including short term and long term maintenance plans, asset refurbishment and asset replacement projects.
The forecasting methodology for each of these components is as follows.
4.1.1 Routine Maintenance
ElectraNet has used a detailed routine maintenance model to develop its routine maintenance forecast. ElectraNet’s routine maintenance forecast considers a number of activity drivers including:
detailed information on the size and condition of the asset base;
the capital expenditure program;
maintenance standards; and
maintenance service contracts.
Figure 3 below diagrammatically depicts the ElectraNet’s approach to forecasting routine maintenance:

OPERATING EXPENDITURE FORECASTING METHODOLOGY June 2012
Version 1.1 Page 10 of 30
Maintenance Service
Contracts (Work Unit
Rates)
Capital Expenditure
Program
Asset
Information
Maintenance Standards
Routine Maintenance
Forecast
Asset Management
Framework
Figure 3: Procedure Routine Maintenance Forecasting
ElectraNet has been progressively implementing a maintenance regime better suited to understanding and managing asset risk associated with substations and transmission lines. This regime places greater emphasis on building asset condition assessment into normal maintenance practices, enabling ElectraNet to better forecast and manage asset risk.
ElectraNet has developed a detailed routine maintenance model based on SAP maintenance plans. This model is linked to ElectraNet’s capital expenditure plans for the network, to provide an accurate forecast of the required routine maintenance expenditure for new and existing equipment.
The routine maintenance model is driven by ElectraNet’s Asset Management framework. Key inputs include maintenance tasks, standard pricing from outsourced maintenance agreements and equipment head counts from ElectraNet’s SAP asset register together with asset growth from ElectraNet’s capital expenditure plans.
The majority of the routine maintenance forecast is calculated based on the level of maintenance effort required to perform each task (defined as work unit) multiplied by the work unit rate and the frequency of the work as defined below.
No. standard routine work units to perform a task x routine work unit rate x frequency = total opex to perform the specified maintenance task
Standard routine work unit
A standard work unit was calculated as a representation of routine work effort per day (i.e. 8 hours). The work unit is a means with which to express the effort required for a task, irrespective of the type or location of the asset being maintained. Each specific routine maintenance task has been allocated a specified number of work units irrespective of where the task is undertaken to establish the required work effort.

OPERATING EXPENDITURE FORECASTING METHODOLOGY June 2012
Version 1.1 Page 11 of 30
The number of standard routine work units required to perform each specific routine maintenance task are set out task lists in ElectraNet’s outsourced maintenance agreements.
Routine work unit rate
The work unit rate used in the operating expenditure modelling reflects the actual contractor cost of a standard routine work unit to ElectraNet as set out in ElectraNet’s Transmission Asset Maintenance Services Contract.
The base work unit rate reflects the cost of one tradesperson plus basic tools and consumables for one day of eight hours. Indirect charges and overheads have been allocated to the base work unit rate in alignment with the Transmission Asset Maintenance Services contract to establish a routine work unit rate including;
Contractor corporate overhead;
Contractor profit margin;
Fixed management fee;
Fixed management vehicles;
Maintenance supervision; and
Other plant, vehicle and equipment.
Task frequency
The frequency represents the times during a period that a routine maintenance task is required to be undertaken, based on established maintenance policies and standards.
Maintenance forecast
Escalation and factors have been applied to routine maintenance costs based on existing contractual agreements and the escalation factors provided by BIS Shrapnel.
The remaining specific routine maintenance tasks are contracted on a fee for service basis.
Specific priorities in the implementation of the routine maintenance program in the forthcoming period include:
Continued rollout of the established maintenance regime for primary plant and secondary systems and the extension of these tasks to new substation assets commissioned in the current period;
Progressive implementation of the maintenance regime for transmission lines, including new ground and aerial based inspection and testing procedures, and maintenance tasks for new cable assets;
Consolidation of vegetation clearance activities following the introduction of increased regulatory requirements in the current period; and
Progressive implementation of a best practice maintenance program for communication assets.

OPERATING EXPENDITURE FORECASTING METHODOLOGY June 2012
Version 1.1 Page 12 of 30
4.1.2 Corrective Maintenance
Corrective maintenance is a response to those assets identified as having an unacceptable risk of failure.
ElectraNet has established a structured and comprehensive risk-based process for assessing and coding the condition of an asset through the System Condition and Asset Risk (SCAR) management process.
SCAR is designed to maximise efficient cost by grouping as many asset defects as possible to future maintenance or capital projects. Defect notifications are SCAR coded for substation, secondary system and transmission lines. This system of coding has allows ElectraNet to analyse the incoming rate of defects allowing it to estimate and efficiently risk manage future corrective maintenance requirements.
Figure 4 below outlines ElectraNet’s approach to forecasting of corrective maintenance:
Figure 4: Procedure Corrective Maintenance Forecasting
The progressive implementation of this approach has provided ElectraNet with a comprehensive data set on the condition and risks associated with its substation assets, and is progressively revealing the full condition of its transmission line assets.
Improved asset condition data linked to a clear risk framework has placed ElectraNet in a better position to analyse the incoming rate of defects, allowing it to estimate forward asset risk of failure and thus corrective maintenance requirements.
This has revealed a large number of defects that have exceeded available resources to respond (being progressively managed to 2015-16) and confirmed the need for a significant ongoing increase in corrective maintenance effort, particularly in relation to line assets.
For substations and secondary systems the analysis has shown the following:
Defect InflowExpenditure Residual Δ
Cumulative
Requirement
Delay
$ $ $
What is the
current
spend level?
How many new
defects are reported
each month?
How much funding is left to
deal with the cumulative
requirements?
How big is the
cumulative
requirement?
How long is the response
delayed beyond the required
response time given the
available spend level?
- =
OPERATING EXPENDITURE FORECASTING METHODOLOGY June 2012
Version 1.1 Page 13 of 30
The current level of expenditure is adequate to address the defect inflow rate; and
Additional expenditure is required to address the cumulative requirement.
For transmission lines the analysis has shown the following:
The current level of expenditure is adequate to deal with the Operational, Safety & Environmental (urgent high risk defect notifications) defect inflow rate only;
An ongoing increase in expenditure is required to offset the incoming asset risk (R) defect rate; and
Additional expenditure is required to address the Operational corrective cumulative requirement.
Examples of priority corrective maintenance tasks to be managed in the forthcoming period include:
Correction of asset defects (e.g. such as broken insulator assemblies that could cause a conductor to fall to the ground);
Correction of high risk defects (e.g. third party unauthorised building or temporary structures or objects close to transmission line assets that may breach safety clearances to high voltage conductors);
Correction of assets or components that have been functionally impaired (e.g. broken conductor or earth wire components); and
Correction of assets or components at material risk of failure (e.g. advanced tower corrosion).
4.1.3 Operational Refurbishment
Operational refurbishment projects are generally required where the need for additional maintenance effort, over and above routine maintenance, has been identified.
ElectraNet has relied upon detailed asset condition and risk information to develop specific plans for operational refurbishment projects for different asset categories and key risk areas, such as asset operational integrity, safety and environmental issues. Efficiencies are also achieved through this approach by packaging individual works into larger projects.
Where a need is identified, an operating expenditure project brief is developed for the purpose of:
determining the most efficient project framework and timing;
developing a project scope and cost estimate; and
scheduling and allocating the work for completion.
Figure 5 below outlines ElectraNet’s approach to forecasting operational refurbishment:

OPERATING EXPENDITURE FORECASTING METHODOLOGY June 2012
Version 1.1 Page 14 of 30
SCAR Code
Framework
Field Inspection
Risk Review
(Monthly)
Corrective
Maintenance
Monthly SAP
Notification
Categorisation
Plant Maintenance
Next Scheduled
Outage
OPEX
Maintenance
Projects
Capital Projects
SAP Defect List
RISK MATRIX to
define response time
and cost estimate
Not immediate
(>12 months)
Immediate
(<12 months)
SAP DEFECT NOTI CATEGORISATION
NOTI Categorisation
(efficient allocation or
alignment with other works)
Figure 5: Procedure Operational Refurbishment Forecasting
ElectraNet has a structured process for assessing and coding the condition of an asset which includes the decision making process for classification of asset risk.
ElectraNet has confined its refurbishment forecast to high priority projects that must be delivered in the forthcoming regulatory period in order to address critical risk areas and defer the need for significant capital investments. Major priorities include:
Condition assessment – prioritised assessments of the detailed asset condition of transmission lines through aerial and ground based assessments;
Refurbishment and replacement projects – prioritised works to address risks on high risk plant including isolator refurbishment, transformer oil containment and transmission line tower, footing and insulator refurbishments;
Asset overhauls – one-off major activities typically undertaken mid-life to ensure asset performance to end of technical life, including gas insulation switchgear refurbishment, remedial civil and drainage works at substation sites and substation building rectification works;
Asset decommissioning – removal of high risk de-energised and surplus equipment, including disused transmission lines in urban areas and oil filled cables; and

OPERATING EXPENDITURE FORECASTING METHODOLOGY June 2012
Version 1.1 Page 15 of 30
Network risk mitigation – works to address network management risks, including review of aerial line hazard marker identification against Australian Standards to ensure mandated safety of aerial inspection tasks.
4.2 Network Optimisation
This represents a new category of expenditure driven by the objective of improving the capability of the transmission network in order to release additional capacity and defer the need for capital investment.
It includes those assets, asset information systems and asset management practices required to improve power flows, asset utilisation and asset management.
The methodology applied to develop the forecast for this expenditure is outlined in the scope changes section below.
4.3 Maintenance Support
This cost category relates to all of ElectraNet’s internal costs of managing field operating and maintenance contracts, environment and safety management, asset condition monitoring and analysis, works planning and coordination.
Field support costs also include expenditure associated with business processes and systems that directly support the field maintenance activities such as geospatial information systems, maintenance management systems and maintenance field tools, and the direct costs associated with the management and support of external maintenance service contracts and direct charges such as land taxes, water and council rates.
As base year costs are expected to be representative of future costs, projected expenditure requirements are determined through a base year extrapolated forecast, with the exception of the land tax component discussed below.
4.3.1 Land Tax
Based on long-term historical trends, land values continue to increase at a rate above CPI. ElectraNet engaged independent expert Maloney Field Services (MFS) to forecast land value escalation factors based on statistics from the ABS on unimproved land values in South Australia.
The use of extrapolated long-term ABS data in deriving nominal land escalators is consistent with the methodology most recently approved in the Powerlink Transmission Determination.
MFS determined that the ABS ‘Total Land’ factor, derived from a time series on value and broken down into categories of use (residential, commercial, rural and other) represents the most reliable escalator for site values of the ElectraNet portfolio.
MFS reviewed the average annual nominal increase in residential, commercial and rural land values over the period from June 1989 to June 2010, to establish an average ‘Total Land’ factor to be applied in the operating expenditure forecast.
These escalated land valuations were applied to the land tax rates applicable to determine the total land tax payable in accordance with the Land Tax Act (SA) 1936.

OPERATING EXPENDITURE FORECASTING METHODOLOGY June 2012
Version 1.1 Page 16 of 30
Land tax is calculated using a fixed formula linked to unimproved land values as defined by the Valuer General. The formula for Land Tax is a sliding scale up to $10,695 for the first $1.052m of a land holding portfolio, and 3.7% over the $1.052m threshold.
4.4 Network Operations
These are costs associated with the control centre function and other network operations activities. The costs included in this category include:
Real-time control room function – this is a 24-hour continuous requirement. Network operators provide the functions of network operation, coordination and switching sheet preparation for all plant outages;
Off-line system security support – this function involves network security analysis, including an ongoing need to perform contingency planning;
Technical support for the Energy Management System (EMS) and SCADA systems – support functions such as EMS configuration, upgrade, hardware installation, software upgrade and maintenance; and
Asset Monitoring – Monitoring asset performance and condition, which includes auditing network configurations and performing fault diagnosis and response management. The key cost drivers in this category are labour-based. As the network increases in size and complexity, the required amount of switching, analysis, support and monitoring increases requiring a higher resourcing requirement.
As base year costs are expected to be representative of future costs, projected expenditure requirements are determined through a base year extrapolated forecast.
5. Other Controllable Costs
Other controllable costs are those associated with the management of the network business which are not directly attributable to maintaining or operating the transmission network. These comprise two primary cost categories, as described below.
5.1 Asset Manager Support
Asset manager support includes the cost of functional activities that support the strategic development and ongoing management of the network, including network planning, network support, customer and regulatory support and IT support.
As base year costs are expected to be representative of future costs, projected expenditure requirements are determined through a base year extrapolated forecast, with the exception of revenue reset costs discussed below.
5.1.1 Revenue reset costs
The costs incurred in preparing for ElectraNet’s Revenue Proposal have been removed from the base year costs as they are not an ongoing expenditure during the period. ElectraNet has estimated revenue reset costs for the forthcoming regulatory period based on the actual and expected costs of its current revenue reset process, and a corresponding adjustment has been included in the relevant years of the forecast period.

OPERATING EXPENDITURE FORECASTING METHODOLOGY June 2012
Version 1.1 Page 17 of 30
5.2 Corporate Support
Corporate support includes the cost of activities required to ensure adequate and effective corporate governance and business administration, including finance, accounting, administration, legal counsel, employee relations, OHS and internal audit.
Insurance costs are also included. Insurance expenditure includes insurance premiums and the associated costs of commercially available insurance cover obtained from external sources by ElectraNet for its assets and other key risk exposures.
As base year costs are expected to be representative of future costs, projected expenditure requirements are determined through a base year extrapolated forecast, with the exception of insurance costs discussed below.
5.2.1 Insurance
Variations in insurance premiums do not necessarily follow similar escalation profiles to other costs and are influenced by a range of factors beyond the control of ElectraNet.
For this reason, ElectraNet has not projected forward base year costs but has sourced an expert estimate of the forecast premiums from a qualified insurance broker, taking into account ElectraNet’s insurance renewals, claims history, risk profile, recent trends in the insurance market and forecast business growth.
ElectraNet have included to the zero based forecast an annual insurance management fee and broker administration fee based on ElectraNet’s historical expenditure.
5.3 Superannuation Contribution Shortfall
A portion of ElectraNet’s workforce is subject to a defined benefits superannuation scheme. The unfunded liabilities for ElectraNet have increased in the current market environment. These additional costs have also been factored into the forecast based on expert actuarial assessment.
The forecast shortfall over and above current employer contribution levels established following the actuarial investigation of the Scheme as at 30 June 2011 over the period July 2013 to 30 June 2018. These costs have been allocated across the relevant cost categories involving an internal labour cost component.
6. Other Operating Costs
6.1 Self-insurance
Where external insurance cover is not available or not cost effective for certain risk events, ElectraNet manages the risk exposure and cost impact of these events internally through a self-insurance allowance based on the identification and quantification of the asymmetric risks faced by the business. As these costs relate to risk factors beyond its direct control, ElectraNet has re-categorised this as non-controllable expenditure for the purposes of its forecast allowances, consistent with the accepted treatment of these costs by other TNSPs.

OPERATING EXPENDITURE FORECASTING METHODOLOGY June 2012
Version 1.1 Page 18 of 30
The AER’s submission guidelines require the following information to be provided in relation to proposed self-insurance costs for the regulatory control period:
Details of all amounts, values and other inputs used by the TNSP to calculate its proposed self-insurance costs;
An explanation of the TNSP’s calculation of these amounts, values and inputs;
A Board resolution to self-insure (i.e. copy of the signed minutes recording the resolution made by the Board);
Confirmation that the TNSP is in a position to undertake credibly self-insurance for those events;
Self-insurance details setting out the specific risks which the TNSP has resolved to self-insure;
A report from an appropriately qualified actuary or risk specialist verifying the calculation of risks and corresponding insurance premiums;
The annual regulatory accounts must record the cost of self-insurance as an operating expense and establish a self-insurance reserve; and
When a claim against self-insurance is made, an appropriate deduction to the self-insurance reserve must be recorded.
The ElectraNet Board has resolved to self-insure against the following specific risks;
Network related events greater than $20,000 as defined below;
- Losses for which insurance is commercially unavailable, uneconomic or excluded under a policy of insurance (e.g. transmission lines);
- Loss events for insured risks below the existing property insurance policy deductible, and deductible payments;
- Costs incurred through emergency actions to mitigate losses;
- Losses exceeding insurance limits;
Non-network property risks such as vandalism, theft and damage (loss events for insured risks below existing insurance policy deductibles, and deductible payments); and
Workers compensation costs (ElectraNet is a WorkCover SA exempt employer).
ElectraNet engaged a qualified insurance broker Aon Risk Solutions to undertake an actuarial assessment to calculate the above risks (except workers compensation) and the corresponding self-insurance premium. Brett and Watson consulting actuaries were engaged to assess the risks for workers compensation losses.
It should be noted that the estimated self-insurance costs do not include margins for estimated risk, expense and profit margins.
6.2 Network support
Network support payments fund non-network solutions contracted by ElectraNet as cost-effective alternatives to network augmentation, such as local generation or demand

OPERATING EXPENDITURE FORECASTING METHODOLOGY June 2012
Version 1.1 Page 19 of 30
management arrangements. The Rules require the pass through of network support costs subject to the relevant factors set out in clause 6A.7.2 of the NER.
ElectraNet’s network support forecast for the regulatory period is based on a forecast of the cost of network support services contracted to be provided at Port Lincoln on the Eyre Peninsula. Key inputs and assumptions underpinning this forecast comprise:
Planning assumptions over the frequency and duration of generation support required to meet peak lopping, unplanned network outage management and voltage support requirements in the region based on planning studies;
Maintenance assumptions over the frequency and duration of generation support required for planned outage management and service testing; and
Service costs and escalation rates agreed under the service contract.
ElectraNet has not at this stage identified any other network support services that could defer capital investment during the regulatory period. However, ElectraNet is required through the Regulatory RIT-T Test process under the Rules and the ETC to consider non-network options before committing to any capital investment in the network. Should a viable and cost effective non-network alternative to a capital project included in the capital expenditure forecast be identified during the regulatory period then ElectraNet will be required to:
Enter into a network support agreement for the provision of the relevant network support services; and
Fund the cost of these network support services from the revenue cap provided by the AER for delivery of such services in accordance with the original capital project timeframe – ElectraNet will not be able to seek a pass through of these costs.
Therefore, no ‘double dipping’ has occurred between the capital expenditure forecast and network support forecast or will occur between capital and operating expenditure.
6.3 Debt raising Costs
In order to raise debt to fund its capital investments, a company has to incur debt financing costs or transaction costs over and above the debt margin allowed in the cost of capital. Such costs tend to vary between each debt issue are dependent on market conditions, and have risen substantially since the Global Financial Crisis. The Debt Raising cost category therefore provides an allowance for the costs incurred by ElectraNet when new debt is raised, or current lines of credit are refinanced or extended.
The AER allows benchmark debt raising costs based on a methodology developed by the Allen consulting Group. The calculation of this allowance is included in the AER’s Post Tax Revenue Model.
In its recent Powerlink Transmission Determination, the AER has made updates to certain inputs to reflect current costs. On this basis, it has determined that a benchmark debt raising unit rate of 9.2 bppa represents the efficient and prudent costs under current market conditions.
Accordingly, ElectraNet has applied this unit rate for estimating its allowance for debt raising costs for the forthcoming regulatory period.

OPERATING EXPENDITURE FORECASTING METHODOLOGY June 2012
Version 1.1 Page 20 of 30
7. Scope changes
ElectraNet over the next regulatory control period will be subjected to changes in regulatory obligations and the operating environment which will impact on expenditure requirements over and above the FY2012 base year. It is necessary to make adjustments for these requirements to ensure ElectraNet meets its regulatory and transmission service obligations. It is noted that as required under clause 6A.6.6(c), proposed step changes have been prepared on the basis of the efficient cost of a prudent TNSP.
Figure 1.4 below illustrates ElectraNet’s internal process for assessing potential scope changes:
Figure 6: Procedure for identifying operating expenditure scope changes
Forecast step changes have been identified taking account of the following key considerations including:
Whether the cost estimate is consistent with the operating costs incurred by an efficient TNSP;
Any substitution possibilities between operating and capital expenditure;
Whether the step change should appropriately be defined as a contingent project; and
Where applicable, whether any consideration or provision has been made for efficient or prudent non-network alternatives.
7.1 Network Optimisation
ElectraNet understands the need to improve network utilisation and performance in order to deliver reliable transmission services at lowest long-run cost.
Network optimisation is a new expenditure category and includes those assets, asset information systems or asset management practices required to improve the operation and management of transmission power flows, asset utilisation or asset management. This allows improved efficiency of network operation and enables the efficient deferral of augmentation expenditure.
A number of projects have been identified to improve network optimisation and risk management in the next regulatory period. High priority projects include:
Improvement in the management of network power flows by improving automation of voltage control schemes;
New regulatory
obligation exists or
change in operating
environment?
Is the scope change
impact likely to be
material?
Is it demonstrable that
costs fall outside or are
additional to the base
year?
Not a scope
change
Not a scope
change
Not a scope
change
Determine efficient costs for
achieving step change opex
objectives
No
Yes
No
Yes
No
Yes

OPERATING EXPENDITURE FORECASTING METHODOLOGY June 2012
Version 1.1 Page 21 of 30
Improvement in network asset utilisation by improving automation of transformer dynamic ratings and carrying out minor primary plant and secondary systems (protection) works to remove ‘bottlenecks’, thereby releasing additional capacity and deferring the need for capital investment; and
Improvements in transmission line asset utilisation by improving the static/dynamic line rating process and addressing line rating non-compliance issues using a risk-based approach on high impact assets, in order to improve available capacity and defer large capital investments.
These investments have only become possible in recent years with the advent of technological advancements in remote sensing, now available to the business on a cost effective basis, such as digital imaging, and Light Detection and Ranging (LiDAR) data collection and analysis.
Once the high priority tasks outlined above are addressed in the forthcoming period, it is envisaged that ongoing network optimisation and risk management expenditure will be relatively minor in nature, and become fully incorporated into business-as-usual processes.
7.2 Accommodation Requirements
Increases in demand for office accommodation space over and above the capacity of ElectraNet’s existing office accommodation have been managed to date using a number of options including:
reconfiguration and refit of existing office space;
converting and utilising commercial buildings obtained in the course of a substation land acquisition for office accommodation;
expanding site accommodation through temporary ‘hut-style’ accommodation; and
leasing additional office space.
ElectraNet believes this has been a prudent and efficient means of accommodating its expanding workforce at lowest long-run cost. ElectraNet plans to meet its additional office accommodation requirements during the next regulatory period through ongoing leasing of additional office space, as this is the most cost effective and efficient approach.
During the current regulatory period ElectraNet’s internal workforce exceeded the capacity of the available office accommodation. To alleviate the shortage ElectraNet recently entered a lease agreement for accommodation at a site adjacent to an existing office site. As this agreement was entered into part way through the year, the bulk of these lease costs fall outside the base year of 2011-12.
To meet projected accommodation requirements during for the forthcoming regulatory period, ElectraNet engaged an independent expert (Think 180) to assess likely costs for leasing additional office space to accommodate additional staff beyond the current capacity.
Additional accommodation costs are based on leasing additional accommodation in a CBD location in proximity to ElectraNet’s current headquarters. Office and carpark lease rates are based on external estimates for CBD existing accommodation.

OPERATING EXPENDITURE FORECASTING METHODOLOGY June 2012
Version 1.1 Page 22 of 30
The incremental accommodation forecast therefore comprises:
the net annual increase in accommodation costs incurred under the lease of additional accommodation entered into in 2011-12; and
additional leasing costs to be incurred in 2015-16 as available office capacity is exceeded.
These additional accommodation costs have been apportioned to operating expenditure based on the estimated proportion of capital and operating activities.
7.3 Superannuation Costs
Recent changes to the Superannuation Guarantee (Administration) Act 1992 will see the current superannuation guarantee (SG) contribution rate of 9 per cent increase in increments from 1 July 2013 to 1 July 2019 when the SG rate will be set at 12 per cent. The legislated timeline for SG contribution increases is shown in Table 2.
Table 2: Superannuation Guarantee Legislative Increases
Financial Year Rate Increase % New SG Rate %
2013-14 0.25 9.25
2014-15 0.25 9.5
2015-16 0.50 10.0
2016-17 0.50 10.5
2017-18 0.50 11.0
2018-19 0.50 11.5
2019-20 0.50 12.0
Source: www.futuretax.gov.au
ElectraNet successfully negotiated a new Enterprise Agreement which entitles all employees covered by the Agreement to a 4.5 per cent per annum wage increase effective from 2012 through until 2014-15. Negotiations for the Agreement were conducted prior to the changes to the Act, and therefore additional superannuation contributions were not factored into the agreed wage outcomes.
We note in the AER’s recent Powerlink Draft Determination that it is the view of the AER that changes to the superannuation guarantee rate will not meaningfully impact on labour costs. The Australian Government has stated that as the increases are implemented gradually, therefore there will be a sufficient lead time for employers to take increased SG contributions into account when negotiating future wage settlements.
Whilst SG contributions can be taken into account in future wage settlements, the changes to superannuation legislation will increase ElectraNet’s labour costs for the period of the current EBA. ElectraNet has therefore included the incremental changes in the SG contribution in its labour escalation rates for the remaining term of the current EBA ending in 2014-15. This will equate an additional 0.25% labour cost increase in 2013-14 and 2014-15 over and above the 4.5% per annum wage increase under the EBA.

OPERATING EXPENDITURE FORECASTING METHODOLOGY June 2012
Version 1.1 Page 23 of 30
7.4 Other scope changes
ElectraNet has included in its operating expenditure forecasts only material scope changes that are increasing the efficient level of costs based on new regulatory obligations and changes in the external operating environment, as outlined above.
ElectraNet has absorbed the cost impact of remaining scope changes in its forecasts. An example is the harmonisation of work health and safety legislation as part of the Council of Australian Governments (COAG) National Reform Agenda. These reforms will abolish the existing old employee/employer relationship under State law, and extend ElectraNet’s formal obligations to include contractors, sub-contractors, employees of contractors and sub-contractors, visitors and volunteers.
ElectraNet will require additional internal resources of approximately 2-3 FTEs to comply with the impending legislation1, specifically to undertake the following;
an increased inspection regime to ensure health and safety across all of ElectraNet’s sites for all persons for which it will be held responsible; and
expanded auditing requirements to ensure ElectraNet will meet its obligations to all workers as a ‘person conducting a business or undertaking’.
8. Escalation
ElectraNet’s operating expenditure forecast has accounted for changes in network size and cost movements in labour and materials markets. Various escalation factors have been applied in establishing the forecast for each cost category. The application of these escalators in developing the forecast is described in the following section and summarised in Appendix B.
8.1 Asset Growth
Operating expenditure is directly related to the size of the network. As the network grows in size there is a requirement for more maintenance and supporting activities. The impact of this network growth on operating expenditure requirements has been factored into both the base year and zero base cost categories.
8.1.1 Base year cost categories
ElectraNet has prepared asset growth factors on the basis of year on year percentage increase in the RAB attributed to network asset growth by asset category from the capital expenditure forecast.
The asset growth factor applied is derived for base year cost categories by dividing the load driven capital expenditure during the period by total asset replacement cost and multiplying by the relevant scale factor identified in Table 3 in section 8.2. Load driven capital expenditure excludes asset replacement to ensure that only additional assets are accounted for when applying the asset growth factors to reflect the growth in the size of the network.
1 The Work Health and Safety Bill (SA) 2011 is currently before the South Australian Parliament
OPERATING EXPENDITURE FORECASTING METHODOLOGY June 2012
Version 1.1 Page 24 of 30
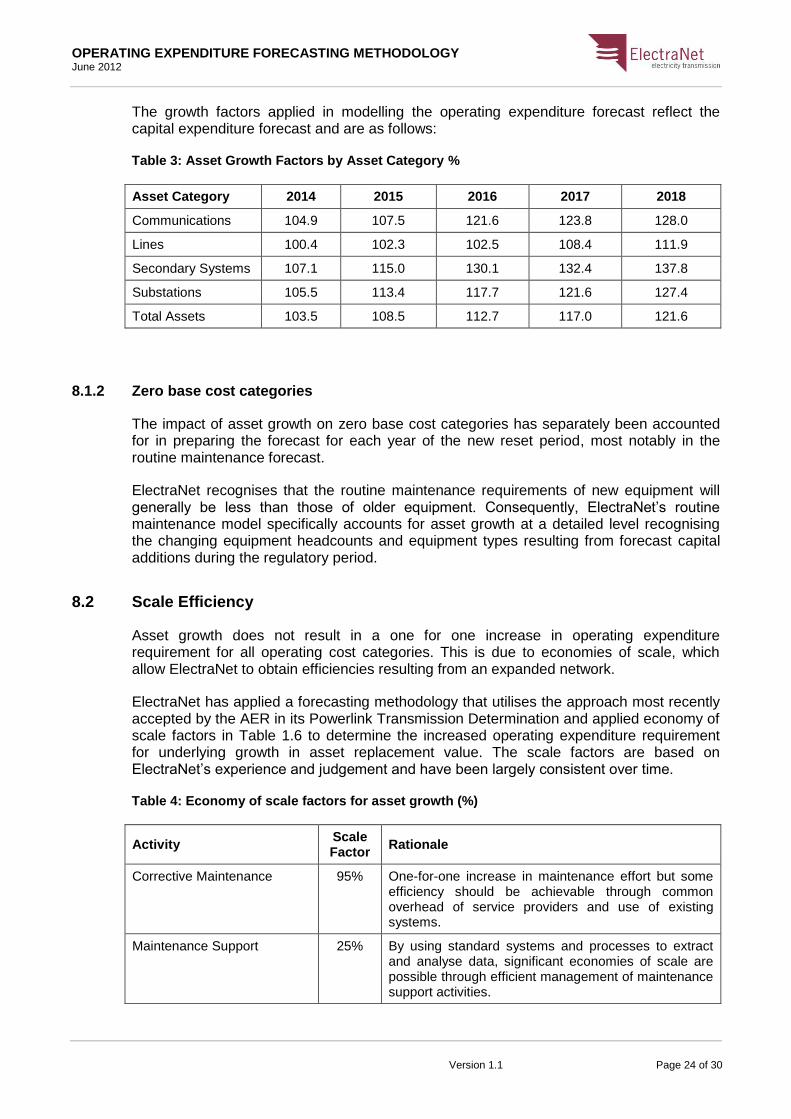
The growth factors applied in modelling the operating expenditure forecast reflect the capital expenditure forecast and are as follows:
Table 3: Asset Growth Factors by Asset Category %
Asset Category 2014 2015 2016 2017 2018
Communications 104.9 107.5 121.6 123.8 128.0
Lines 100.4 102.3 102.5 108.4 111.9
Secondary Systems 107.1 115.0 130.1 132.4 137.8
Substations 105.5 113.4 117.7 121.6 127.4
Total Assets 103.5 108.5 112.7 117.0 121.6
8.1.2 Zero base cost categories
The impact of asset growth on zero base cost categories has separately been accounted for in preparing the forecast for each year of the new reset period, most notably in the routine maintenance forecast.
ElectraNet recognises that the routine maintenance requirements of new equipment will generally be less than those of older equipment. Consequently, ElectraNet’s routine maintenance model specifically accounts for asset growth at a detailed level recognising the changing equipment headcounts and equipment types resulting from forecast capital additions during the regulatory period.
8.2 Scale Efficiency
Asset growth does not result in a one for one increase in operating expenditure requirement for all operating cost categories. This is due to economies of scale, which allow ElectraNet to obtain efficiencies resulting from an expanded network.
ElectraNet has applied a forecasting methodology that utilises the approach most recently accepted by the AER in its Powerlink Transmission Determination and applied economy of scale factors in Table 1.6 to determine the increased operating expenditure requirement for underlying growth in asset replacement value. The scale factors are based on ElectraNet’s experience and judgement and have been largely consistent over time.
Table 4: Economy of scale factors for asset growth (%)
Activity Scale Factor
Rationale
Corrective Maintenance 95% One-for-one increase in maintenance effort but some efficiency should be achievable through common overhead of service providers and use of existing systems.
Maintenance Support 25% By using standard systems and processes to extract and analyse data, significant economies of scale are possible through efficient management of maintenance support activities.

OPERATING EXPENDITURE FORECASTING METHODOLOGY June 2012
Version 1.1 Page 25 of 30
Activity Scale Factor
Rationale
Direct charges 100% Direct charges such as land tax have no efficiencies available as they are externally driven and directly proportional to asset growth.
Operations 40% Increased planned and corrective maintenance activities impact directly on the level of switching, and outage co-ordination that is required to gain access to plant. Significant economies of scale are possible through efficient management of this activity.
Asset Manager Support 25% Large economies of scale and efficiencies are available and recognised.
Insurances – Not applicable as costs are based on an external broker estimate.
Corporate Support 10% For corporate support large economies of scale are available and recognised.
Other Operational Expenditure
– Not applicable as other operational expenditure such as network support forecasts are based on a zero based estimate
These efficiency factors are considered to be conservatively low (i.e. resulting in a greater scale adjustment) for a small TNSP, on the basis that the relative cost efficiency of ElectraNet is less than larger network businesses due to ElectraNet’s smaller scale, lower energy density, lower load factor and high proportion of lower voltage radial lines.
8.3 Cost Escalation
ElectraNet’s proposed approach to cost escalation for the operating expenditure forecast is discussed below, as summarised in Figure 7.
Input 2013-14 2014-15 2015-16 2016-17 2017-18
Operating
Expenditure
Internal Labour
External Labour
Non-labour
Enterprise Agreement
Labour cost forecast
Maintenance contract rates
Labour cost forecast
Inflation forecast
Figure 7: Cost escalation drivers
OPERATING EXPENDITURE FORECASTING METHODOLOGY June 2012
Version 1.1 Page 26 of 30
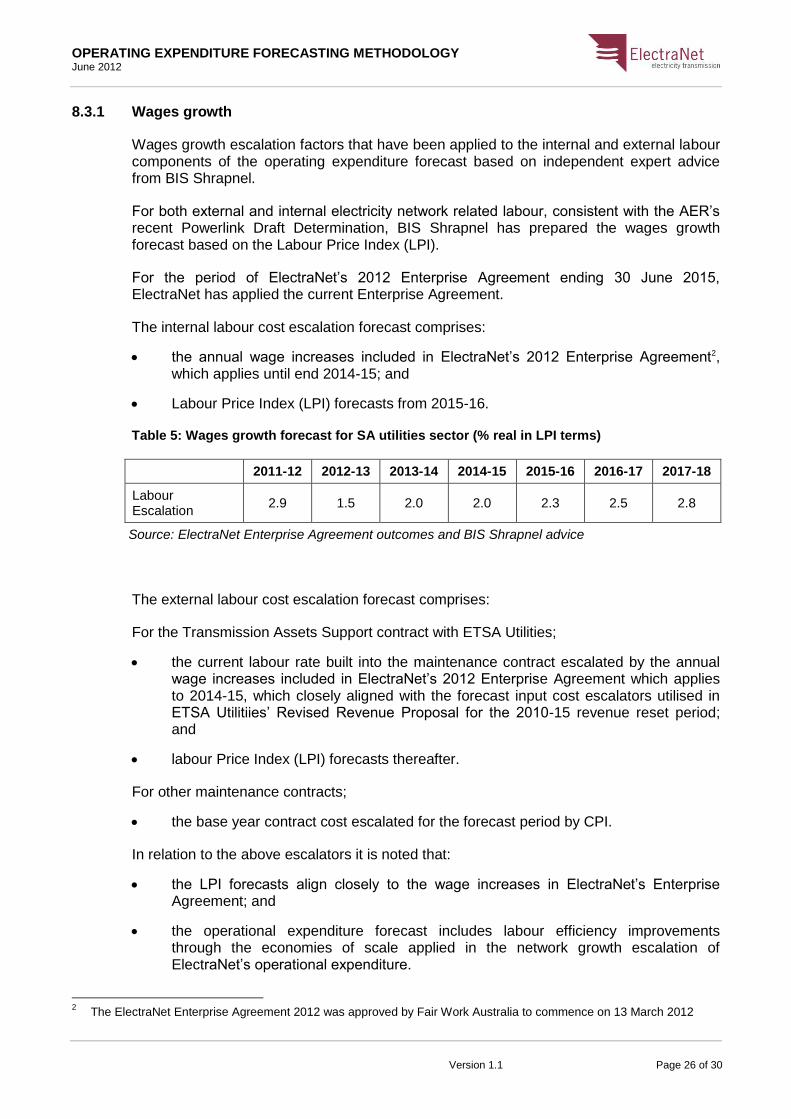
8.3.1 Wages growth
Wages growth escalation factors that have been applied to the internal and external labour components of the operating expenditure forecast based on independent expert advice from BIS Shrapnel.
For both external and internal electricity network related labour, consistent with the AER’s recent Powerlink Draft Determination, BIS Shrapnel has prepared the wages growth forecast based on the Labour Price Index (LPI).
For the period of ElectraNet’s 2012 Enterprise Agreement ending 30 June 2015, ElectraNet has applied the current Enterprise Agreement.
The internal labour cost escalation forecast comprises:
the annual wage increases included in ElectraNet’s 2012 Enterprise Agreement2, which applies until end 2014-15; and
Labour Price Index (LPI) forecasts from 2015-16.
Table 5: Wages growth forecast for SA utilities sector (% real in LPI terms)
2011-12 2012-13 2013-14 2014-15 2015-16 2016-17 2017-18
Labour Escalation
2.9 1.5 2.0 2.0 2.3 2.5 2.8
Source: ElectraNet Enterprise Agreement outcomes and BIS Shrapnel advice
The external labour cost escalation forecast comprises:
For the Transmission Assets Support contract with ETSA Utilities;
the current labour rate built into the maintenance contract escalated by the annual wage increases included in ElectraNet’s 2012 Enterprise Agreement which applies to 2014-15, which closely aligned with the forecast input cost escalators utilised in ETSA Utilitiies’ Revised Revenue Proposal for the 2010-15 revenue reset period; and
labour Price Index (LPI) forecasts thereafter.
For other maintenance contracts;
the base year contract cost escalated for the forecast period by CPI.
In relation to the above escalators it is noted that:
the LPI forecasts align closely to the wage increases in ElectraNet’s Enterprise Agreement; and
the operational expenditure forecast includes labour efficiency improvements through the economies of scale applied in the network growth escalation of ElectraNet’s operational expenditure.
2 The ElectraNet Enterprise Agreement 2012 was approved by Fair Work Australia to commence on 13 March 2012

OPERATING EXPENDITURE FORECASTING METHODOLOGY June 2012
Version 1.1 Page 27 of 30
8.3.2 Non-labour escalation
Non-labour costs reflect a range of costs and materials associated with operating expenditure activities. ElectraNet has applied a consumer price index (CPI) measure to escalate the non-labour component of operating expenditure.
9. Benchmarking
To determine the relative efficiency of ElectraNet’s forecast operating expenditure, ratio analysis benchmarking has been undertaken to assess the validity of ElectraNet’s operating expenditure forecast in comparison with comparable TNSPs.
9.1 Ratio Analysis
As one of the factors to which the AER must have regard under the Rules, ElectraNet undertakes high level benchmarking ratio analysis to compare its projected operating expenditure with that of other TNSPs.
ElectraNet undertook a ratio analysis to compare the level of recent historical and forecast operating expenditure for ElectraNet against other TNSPs. Load density (MWs per kilometre of line) was used as a base measure to normalise results as this takes into account variations between TNSPs in terms of network size and density (i.e. larger more dense networks will benefit from economies of scale). A ratio analysis was prepared to benchmark operating expenditure based on Opex to RAB.
It is also noted that load density does not take into account other drivers of network cost and performance such as variations in network configuration, functionality or condition.
9.2 Industry Benchmarks
ElectraNet participates in the International Transmission Operations and Maintenance Study (ITOMS) undertaken by the UMS Group as a means of comparing maintenance performance and practices within the transmission industry nationally and internationally.
The study involves companies from the Asia Pacific, Europe, Scandinavia and North America. It focuses on competing indicators of cost (operations and maintenance) and service performance (network reliability). This benchmarking recognises that cost and reliability cannot be considered in isolation – it would be easy to have a low cost network if reliability was of no consequence, or alternatively a high reliability network if cost was no object.

OPERATING EXPENDITURE FORECASTING METHODOLOGY June 2012
Version 1.1 Page 28 of 30
Appendix A ElectraNet’s Forecast Operating Expenditure Methodology
Other Operating
Expenditure
Controllable
operating
expenditure
forecast (13/14)
Cost allocation
Financial year data
(SAP)
Asset management
plans
Maintenance standards
Work Unit Contract
rates
Capital plan
Asset base
Risk
Asset Base
Capital program
Risk
Modelling
Industry experience
Benchmark
Methodology
Step 1a Step 1b Step 1c Step 1d Step 1e Step 2
Base year
financials
Maintenance
forecast
Insurance
forecast
Self insurance
forecast
Debt raising
Adjusted base
year
Base year
expenditure
Base year
expenditure
Base year
($11/12)
Adjustments to
historical data and
new requirements
($11/12)
Apply annual asset
growth and scale
factors ($11/12)
Add zero
based costs
($11/12 #)
Apply escalation
($nominal)
Operating forecast Year 1, 2, 3, 4, 5 ($nominal)
Determine
labour and non labour
splits
Deduct non-
recurrent, zero based
costs & other
operating
Inte
gra
ted
wo
rks
pro
gra
m
Base year
expenditure
Routine
Maintenance
program
Routine
Maintenance
program
Routine
Maintenance
program
Insurance
forecast
Insurance
forecast
Self insurance
forecast
Self insurance
forecast
Debt raising Debt raising
ElectraNet’s Forecast Operating
Expenditure Methodology
Inputs
Key inputs that make up ElectraNet’s operating expenditure forecast
Selected base year financials for
prescribed services are used as the
base year to forecast future
operating expenditure requirements
Non recurrent costs and zero-
based costs are removed from the
base year including revenue reset,
maintenance, insurance, self
insurance, network support.
New requirements are step
changes such as new costs which
are not zero base forecasted.
Annual growth factor is
calculated by multiplying the
annual growth in new assets
by a scale or efficiency factor
Zero-based forecasts for
expenditure are added.
# Local Taxes are in $nominal as
land value needs to be inflated
before tax rates applied other costs
are $11/12. Debt raising costs are
in $12/13 as an output of the
PTRM
CPI and real wage and other
price growth indexes are
applied to cost categories.
(Local taxes are not
escalated)
Asset growth
multiplier
Augmentations Scale factors
Asset base
Cost growth
Wage EscalatorThe first year forecast operating expenditure is formulated (i.e. 2013/14 forecast operating
expenditure)
Steps 1b through 1e are applied to produce the forecast for the remaining years (i.e. 2014/15 – 2017/18).
Other Operating
Expenditure
(14/15 – 17/18)
($Nominal)
Controllable
Operating
Expenditure
Forecast
(14/15 – 17/18)
($Nominal)
Step 1b
Step 1c
Step 1d
Step 1e
Controllable operating expenditure
Network Support
forecast
Local Taxes
Network Support Network Support
Local Taxes Local Taxes
Other Escalator
Deflate costs from
Nominal dollars to
12/13 Dollars
Step 3
Corrective
Maintenance
Corrective
Maintenance
Corrective
Maintenance
Refurbishment
Projects
Refurbishment
Projects
Refurbishment
Projects
CPI is applied to deflate costs
Other Operating
Expenditure
(13/14–17/18)
($12/13)
Controllable
Operating
Expenditure
Forecast
(13/14–17/18)
($12/13)
Condition Assessment
reports
Network support
requirements
Asset Base
Capital program
Add New
Requirements
Insurance
forecast
Network Support
Self insurance
forecast
Debt raising
Determine
labour and non labour
splits
Network
Optimisation
Network
Optimisation
Network
Optimisation`
Corrective Noti
Report

OPERATING EXPENDITURE FORECASTING METHODOLOGY June 2012
Version 1.1 Page 29 of 30
Appendix B ElectraNet’s Forecast Operating Expenditure Escalation Methodology
Cost Category Forecast Basis
$m Cost 2012-13 5 Yr Reg Period
Escalation basis
Escalators Applied
Labour (EBA/LPI)
Non-labour (CPI)
Other Asset
Growth Factors
Scale Efficiencies
Routine Maintenance
Zero Base 80.9 Current year $2011-12
Corrective Maintenance
Zero Base 68.8 Current year $2011-12
Refurbishment Projects
Zero Base 64.9 Current year $2011-12
Network Optimisation
Zero Base 13.3 Current year $2011-12
Maintenance Support
Base Year 69.9 Current year $2011-12
Operations Base Year 47.3 Current year $2011-12
Asset Manager Support
Base Year 43.8 Current year $2011-12
Corporate Support (exc. Insurance)
Base Year 18.8 Current year $2011-12
Insurance Zero Base 15.1 $Nominal
Self Insurance Zero Base 7.5 $Nominal
Superannuation Shortfall
Zero Base 2.4 $Nominal

OPERATING EXPENDITURE FORECASTING METHODOLOGY June 2012
Version 1.1 Page 30 of 30
Cost Category Forecast Basis
$m Cost 2012-13 5 Yr Reg Period
Escalation basis
Escalators Applied
Labour (EBA/LPI)
Non-labour (CPI)
Other Asset
Growth Factors
Scale Efficiencies
Additional Accommodation (Scope Change)
Zero Base / Base Year (hybrid)
2.1 Current year $2011-12
Land Tax Base Year 14.7 $Nominal
Network Support
Zero Base 41.6 $Nominal
Superannuation guarantee
Zero Base 0.5 $Nominal