OPERATING ANALYST NOTES - Toronto · (in $000's) Budget For 2015, the ... increases in salaries,...
29
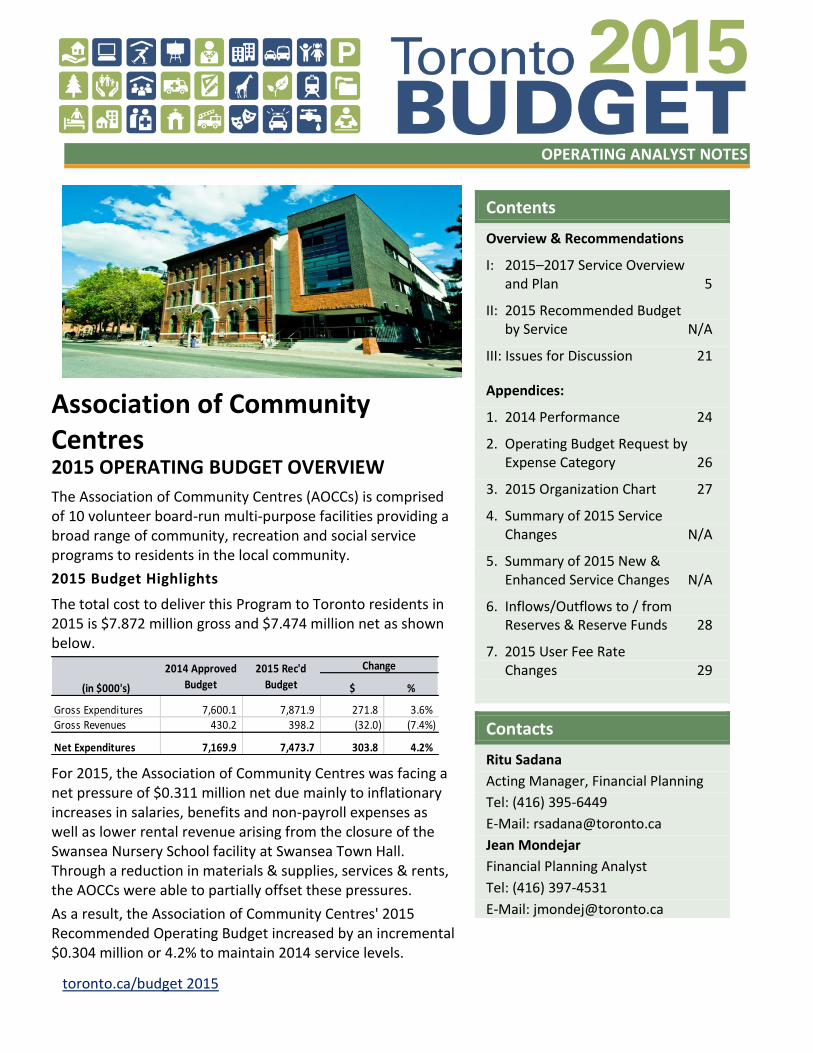
toronto.ca/budget 2015 OPERATING ANALYST NOTES Association of Community Centres 2015 OPERATING BUDGET OVERVIEW The Association of Community Centres (AOCCs) is comprised of 10 volunteer board-run multi-purpose facilities providing a broad range of community, recreation and social service programs to residents in the local community. 2015 Budget Highlights The total cost to deliver this Program to Toronto residents in 2015 is $7.872 million gross and $7.474 million net as shown below. $ % Gross Expenditures 7,600.1 7,871.9 271.8 3.6% Gross Revenues 430.2 398.2 (32.0) (7.4%) Net Expenditures 7,169.9 7,473.7 303.8 4.2% Change 2015 Rec'd Budget 2014 Approved Budget (in $000's) For 2015, the Association of Community Centres was facing a net pressure of $0.311 million net due mainly to inflationary increases in salaries, benefits and non-payroll expenses as well as lower rental revenue arising from the closure of the Swansea Nursery School facility at Swansea Town Hall. Through a reduction in materials & supplies, services & rents, the AOCCs were able to partially offset these pressures. As a result, the Association of Community Centres' 2015 Recommended Operating Budget increased by an incremental $0.304 million or 4.2% to maintain 2014 service levels. Contents Overview & Recommendations I: 2015–2017 Service Overview and Plan 5 II: 2015 Recommended Budget by Service N/A III: Issues for Discussion 21 Appendices: 1. 2014 Performance 24 2. Operating Budget Request by Expense Category 26 3. 2015 Organization Chart 27 4. Summary of 2015 Service Changes N/A 5. Summary of 2015 New & Enhanced Service Changes N/A 6. Inflows/Outflows to / from Reserves & Reserve Funds 28 7. 2015 User Fee Rate Changes 29 Contacts Ritu Sadana Acting Manager, Financial Planning Tel: (416) 395-6449 E-Mail: [email protected] Jean Mondejar Financial Planning Analyst Tel: (416) 397-4531 E-Mail: [email protected]
Transcript of OPERATING ANALYST NOTES - Toronto · (in $000's) Budget For 2015, the ... increases in salaries,...
toronto.ca/budget 2015
OPERATING ANALYST NOTES
Association of Community Centres 2015 OPERATING BUDGET OVERVIEW
The Association of Community Centres (AOCCs) is comprised of 10 volunteer board-run multi-purpose facilities providing a broad range of community, recreation and social service programs to residents in the local community.
2015 Budget Highlights
The total cost to deliver this Program to Toronto residents in 2015 is $7.872 million gross and $7.474 million net as shown below.
$ %
Gross Expenditures 7,600.1 7,871.9 271.8 3.6% Gross Revenues 430.2 398.2 (32.0) (7.4%)
Net Expenditures 7,169.9 7,473.7 303.8 4.2%
Change2015 Rec'd
Budget
2014 Approved
Budget(in $000's)
For 2015, the Association of Community Centres was facing a net pressure of $0.311 million net due mainly to inflationary increases in salaries, benefits and non-payroll expenses as well as lower rental revenue arising from the closure of the Swansea Nursery School facility at Swansea Town Hall. Through a reduction in materials & supplies, services & rents, the AOCCs were able to partially offset these pressures.
As a result, the Association of Community Centres' 2015 Recommended Operating Budget increased by an incremental $0.304 million or 4.2% to maintain 2014 service levels.
Contents
Overview & Recommendations
I: 2015–2017 Service Overview and Plan 5
II: 2015 Recommended Budget by Service N/A
III: Issues for Discussion 21
Appendices:
1. 2014 Performance 24
2. Operating Budget Request by Expense Category 26
3. 2015 Organization Chart 27
4. Summary of 2015 Service Changes N/A
5. Summary of 2015 New & Enhanced Service Changes N/A
6. Inflows/Outflows to / from Reserves & Reserve Funds 28
7. 2015 User Fee Rate Changes 29
Contacts
Ritu Sadana
Acting Manager, Financial Planning
Tel: (416) 395-6449
E-Mail: [email protected]
Jean Mondejar
Financial Planning Analyst
Tel: (416) 397-4531
E-Mail: [email protected]
2015 Operating Budget Association of Community Centres
toronto.ca/budget 2015 Page 2
Fast Facts
Comprised of 10 volunteer board-run multi purposed facilities.
Provide a broad range of community, recreation and social service programs to residents in the local community.
A hybrid between a City Agency and an independent, not-for-profit, community based organization.
The City provides funding for the Core administration activities while the program component is funded from fees, donations and grants.
Trends
AOCCs continue to leverage third party funding to supplement funds received from the City.
AOCCs continue to build community capacity, promote civic engagement and encourage community participation by providing programming and support through services and special events.
Our Key Challenges &
Our Service Deliverables for 2015
The 2015 Recommended Operating Budget of $7.872 million gross and $7.474 million net provides AOCCs with administrative funding necessary to support the delivery of programs and services, respond to community requests and local needs, and improve quality of life. In addition, it also supports delivering services to vulnerable areas and at-risk youth.
The 2015 Recommended Operating Budget will fund a variety of initiatives planned by individual Centres, some are listed below:
Leverage alternative funding to provide programs, services and community activities not funded through core City funding at the 519 Church Street Community Centre.
Provide programming from pre-natal to older adults at Applegrove Community Complex through approximately 40,000 service encounters with the support of over 300 volunteers contributing to approximately 5,000 hours.
Provide valuable support to the community at Community Centre 55 including 300 children in daycare and weekly summer camps, 56 summer jobs, 30 events and programs and food and toys for 1000 families at Christmas.
Increase engagement at Central Eglinton Community Centre with community leaders and businesses to expand fundraising potential.
Provide programming and support to 26,700 individuals through 76,695 service encounters and leverage the assistance of 440 volunteers, contributing 19,755 hours of their time at Cecil Community Centre.
Provide community programming and support to over 11,000 individuals through 268,000 service encounters, leveraging the assistance of over 300 volunteers contributing over 23,500 volunteer hours at Eastview Neighbourhood Community Centre.
Respond to influx of population resulting in new service demands at Harbourfront Community Centre which is estimated to increase by 5%.
Increase the usage of Swansea Town Hall by 10% to replace loss of revenue resulting from the closure of the Swansea Nursery School facility in 2014.
Generate over $8.8 million of Community Centre Funding from fundraising/donations, productive enterprises and grants.
2015 Operating Budget Association of Community Centres
toronto.ca/budget 2015 Page 3
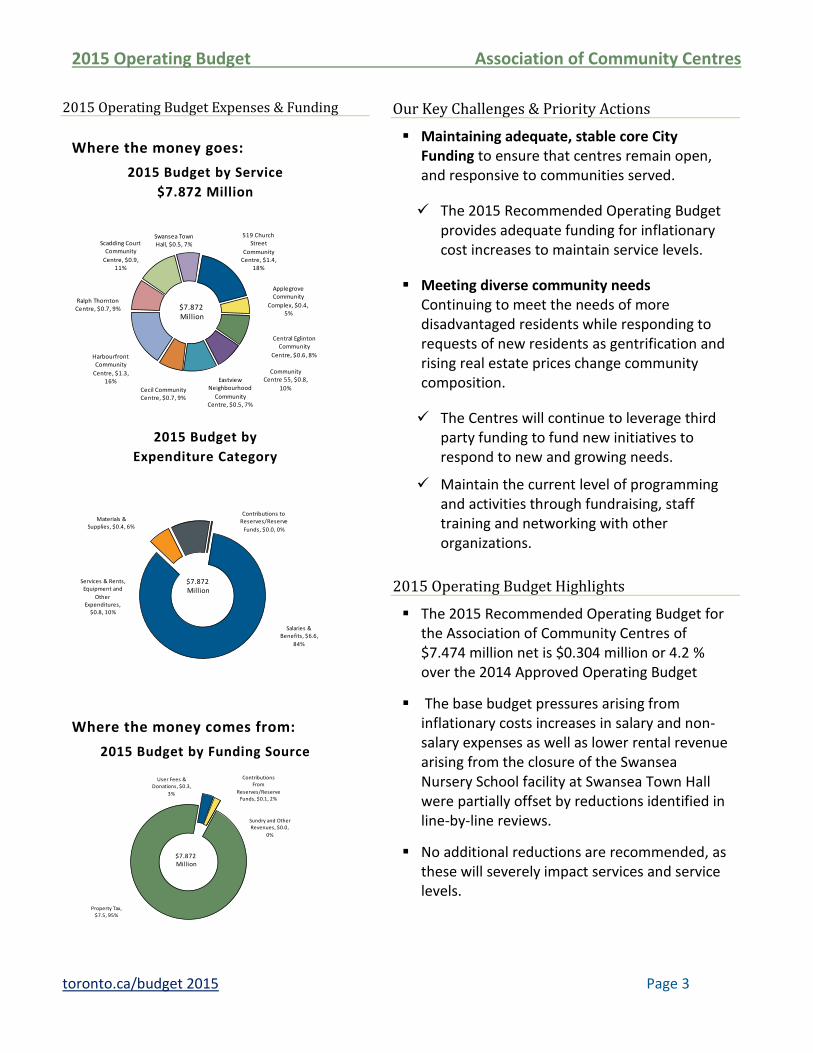
2015 Operating Budget Expenses & Funding
Where the money goes:
2015 Budget by Service
$7.872 Million
519 Church Street
Community Centre, $1.4,
18%
Applegrove Community
Complex, $0.4, 5%
Cecil Community Centre, $0.7, 9%
Central Eglinton Community
Centre, $0.6, 8%
Community Centre 55, $0.8,
10%
Eastview Neighbourhood
Community Centre, $0.5, 7%
Harbourfront Community
Centre, $1.3, 16%
Ralph Thornton Centre, $0.7, 9%
Scadding Court Community
Centre, $0.9, 11%
Swansea Town Hall, $0.5, 7%
$7.872Million
2015 Budget by
Expenditure Category
Salaries & Benefits, $6.6,
84%
Materials & Supplies, $0.4, 6%
Services & Rents, Equipment and
Other Expenditures,
$0.8, 10%
Contributions to Reserves/Reserve
Funds, $0.0, 0%
$7.872Million
Where the money comes from:
2015 Budget by Funding Source
User Fees & Donations, $0.3,
3%
Contributions From
Reserves/Reserve Funds, $0.1, 2%
Sundry and Other Revenues, $0.0,
0%
Property Tax, $7.5, 95%
$7.872Million
Our Key Challenges & Priority Actions
Maintaining adequate, stable core City Funding to ensure that centres remain open, and responsive to communities served.
The 2015 Recommended Operating Budget provides adequate funding for inflationary cost increases to maintain service levels.
Meeting diverse community needs - Continuing to meet the needs of more disadvantaged residents while responding to requests of new residents as gentrification and rising real estate prices change community composition.
The Centres will continue to leverage third party funding to fund new initiatives to respond to new and growing needs.
Maintain the current level of programming and activities through fundraising, staff training and networking with other organizations.
2015 Operating Budget Highlights
The 2015 Recommended Operating Budget for the Association of Community Centres of $7.474 million net is $0.304 million or 4.2 % over the 2014 Approved Operating Budget
The base budget pressures arising from inflationary costs increases in salary and non-salary expenses as well as lower rental revenue arising from the closure of the Swansea Nursery School facility at Swansea Town Hall were partially offset by reductions identified in line-by-line reviews.
No additional reductions are recommended, as these will severely impact services and service levels.
2015 Operating Budget Association of Community Centres
toronto.ca/budget 2015 Page 4
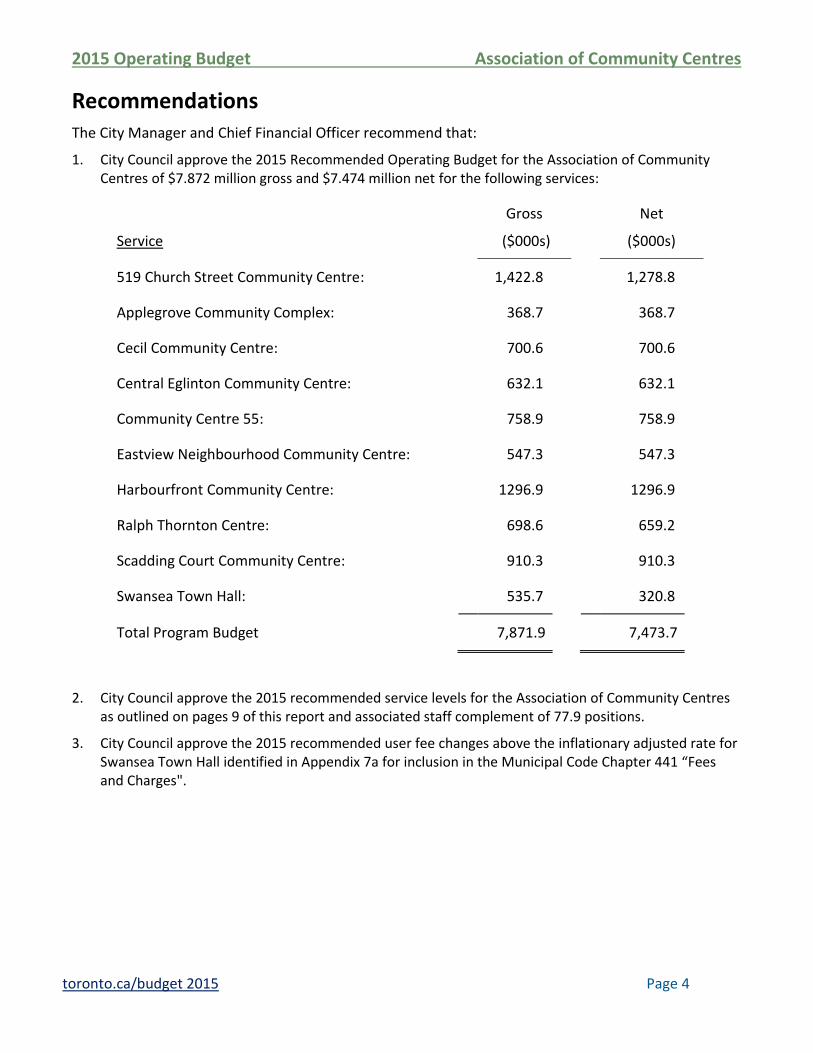
Recommendations The City Manager and Chief Financial Officer recommend that:
1. City Council approve the 2015 Recommended Operating Budget for the Association of Community Centres of $7.872 million gross and $7.474 million net for the following services:
Service
Gross
($000s)
Net
($000s)
519 Church Street Community Centre: 1,422.8 1,278.8
Applegrove Community Complex: 368.7 368.7
Cecil Community Centre: 700.6 700.6
Central Eglinton Community Centre: 632.1 632.1
Community Centre 55: 758.9 758.9
Eastview Neighbourhood Community Centre: 547.3 547.3
Harbourfront Community Centre: 1296.9 1296.9
Ralph Thornton Centre: 698.6 659.2
Scadding Court Community Centre: 910.3 910.3
Swansea Town Hall: 535.7 320.8
Total Program Budget 7,871.9 7,473.7
2. City Council approve the 2015 recommended service levels for the Association of Community Centres as outlined on pages 9 of this report and associated staff complement of 77.9 positions.
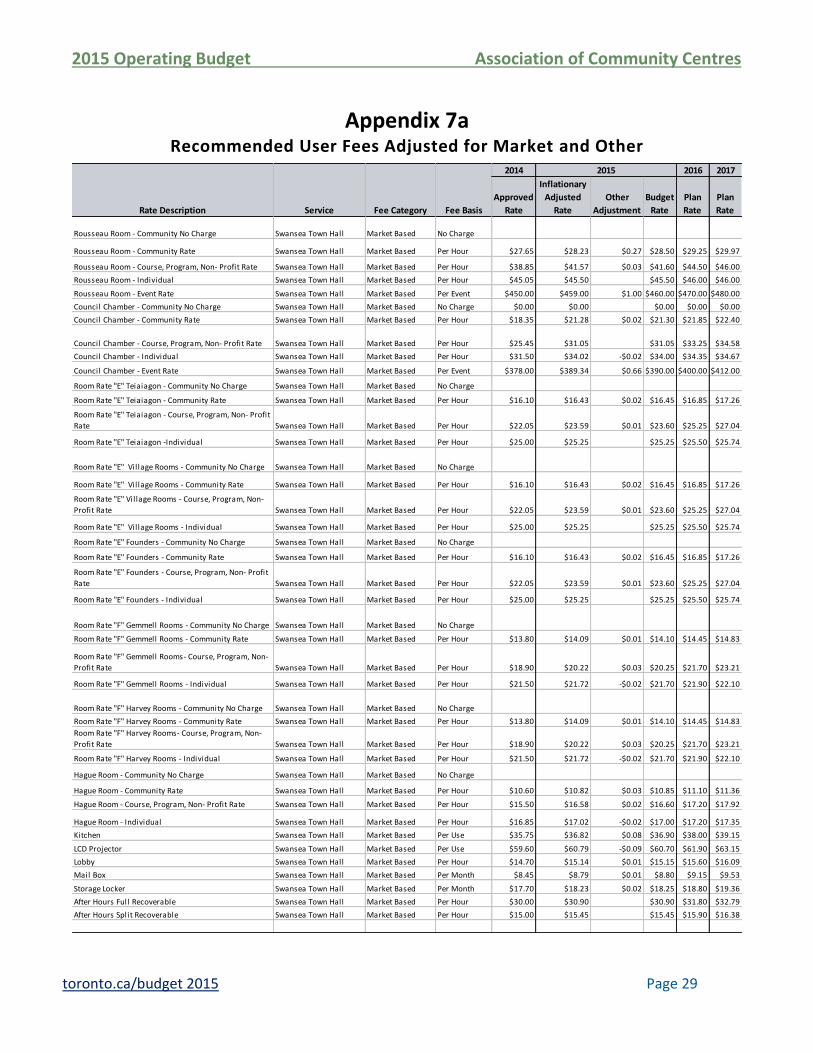
3. City Council approve the 2015 recommended user fee changes above the inflationary adjusted rate for Swansea Town Hall identified in Appendix 7a for inclusion in the Municipal Code Chapter 441 “Fees and Charges".
2015 Operating Budget Association of Community Centres
toronto.ca/budget 2015 Page 5
Part I: 2015 – 2017
Service Overview and
PlanProgram Map
2015 Operating Budget Association of Community Centres
toronto.ca/budget 2015 Page 6
Activity
Program
2015 Operating Budget Association of Community Centres
toronto.ca/budget 2015 Page 7
2015 Service Deliverables
The 2015 Recommended Operating Budget of $7.872 million gross and $7.474 million net will fund a variety of initiatives planned by individual Centres, some are listed below:
Leverage alternative funding to provide programs, services and community activities not funded through core City funding at the 519 Church Street Community Centre. Also, the 519 will be host and trustee of PrideHouse Toronto initiative, a collaborative event that involves 15 organizations working together to ensure the 2015 Pan/ParaPan American Games are the most LGBTQ-inclusive multi-sport games in history.
Provide programming from pre-natal to older adults at Applegrove Community Complex through approximately 40,000 service encounters with the support of over 300 volunteers contributing to approximately 5,000 hours.
Provide valuable support to the community at Community Centre 55 including 300 children in daycare and weekly summer camps, 56 summer jobs, 30 events and programs and food and toys for 1000 families at Christmas.
Increase engagement at Central Eglinton Community Centre with community leaders and businesses to expand fundraising potential.
Provide programming and support to 26,700 individuals through 76,695 service encounters and leverage the assistance of 440 volunteers, contributing 19,755 hours of their time at Cecil Community Centre.
Provide community programming and support to over 11,000 individuals through 268,000 service encounters, leveraging the assistance of over 300 volunteers contributing over 23,500 volunteer hours at Eastview Neighbourhood Community Centre.
Respond to influx of population resulting in new service demands at Harbourfront Community Centre which is estimated to increase by 5%.
Increase funding for program activities by 15% at Ralph Thornton Centre to expand and stabilize program funding.
Increase engagement at Scadding Court Community Centre with to provide service provision for vulnerable women in the community by addressing the root causes of poverty, with a focus on community economic development.
Increase the usage of Swansea Town Hall by 10% to replace loss of revenue resulting from the closure of the Swansea Nursery School facility in 2014.
Generate over $8.8 million of Community Centre Funding from fundraising/donations, productive enterprises and grants.
2015 Operating Budget Association of Community Centres
toronto.ca/budget 2015 Page 8
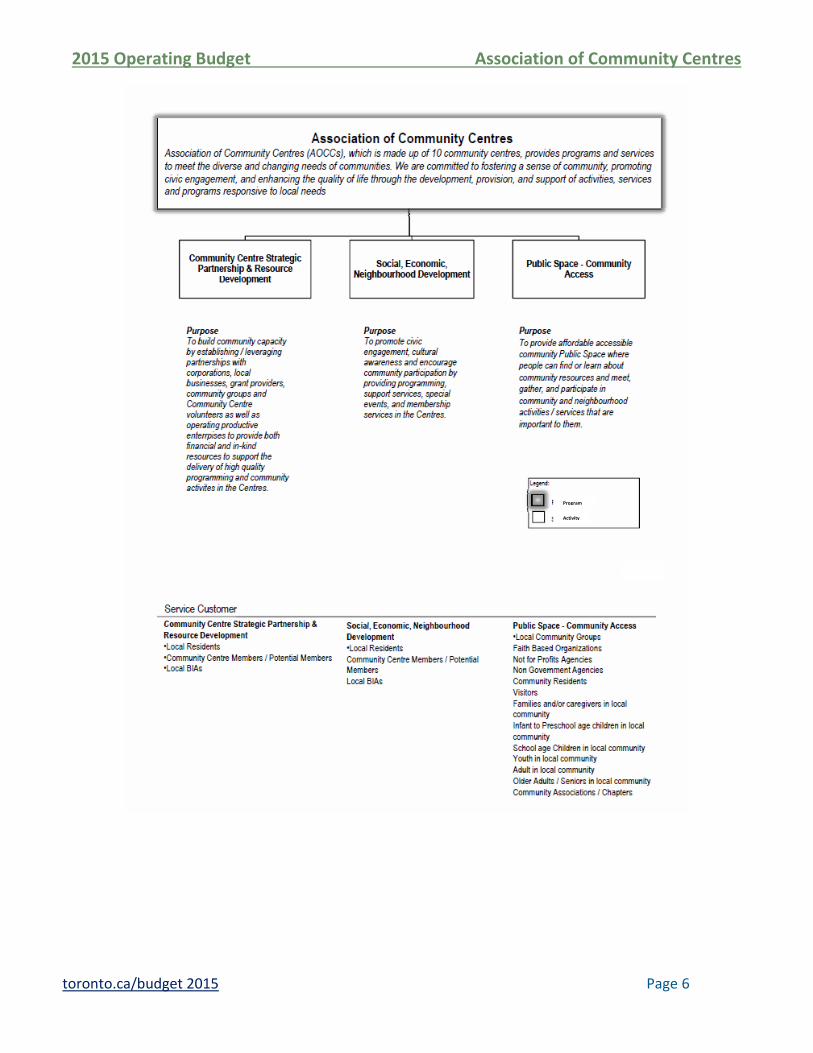
Association of Community Centres
What We Do
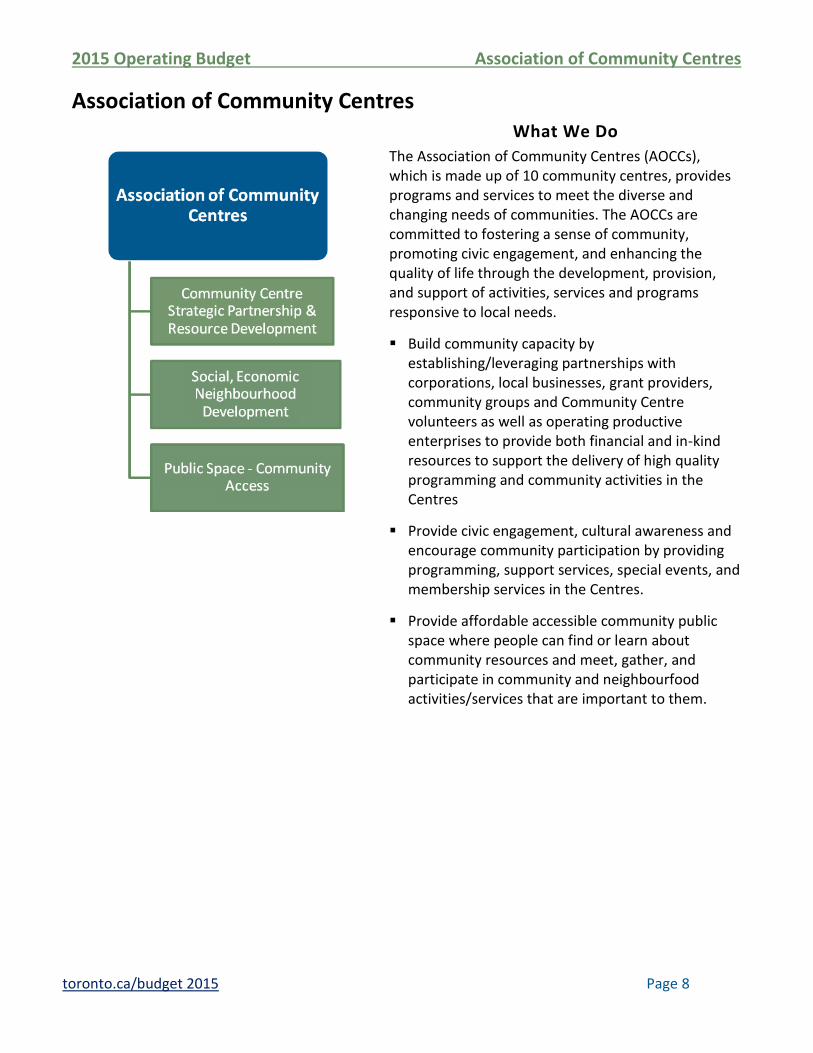
The Association of Community Centres (AOCCs), which is made up of 10 community centres, provides programs and services to meet the diverse and changing needs of communities. The AOCCs are committed to fostering a sense of community, promoting civic engagement, and enhancing the quality of life through the development, provision, and support of activities, services and programs responsive to local needs.
Build community capacity by establishing/leveraging partnerships with corporations, local businesses, grant providers, community groups and Community Centre volunteers as well as operating productive enterprises to provide both financial and in-kind resources to support the delivery of high quality programming and community activities in the Centres
Provide civic engagement, cultural awareness and encourage community participation by providing programming, support services, special events, and membership services in the Centres.
Provide affordable accessible community public space where people can find or learn about community resources and meet, gather, and participate in community and neighbourfood activities/services that are important to them.
2015 Operating Budget Association of Community Centres
toronto.ca/budget 2015 Page 9
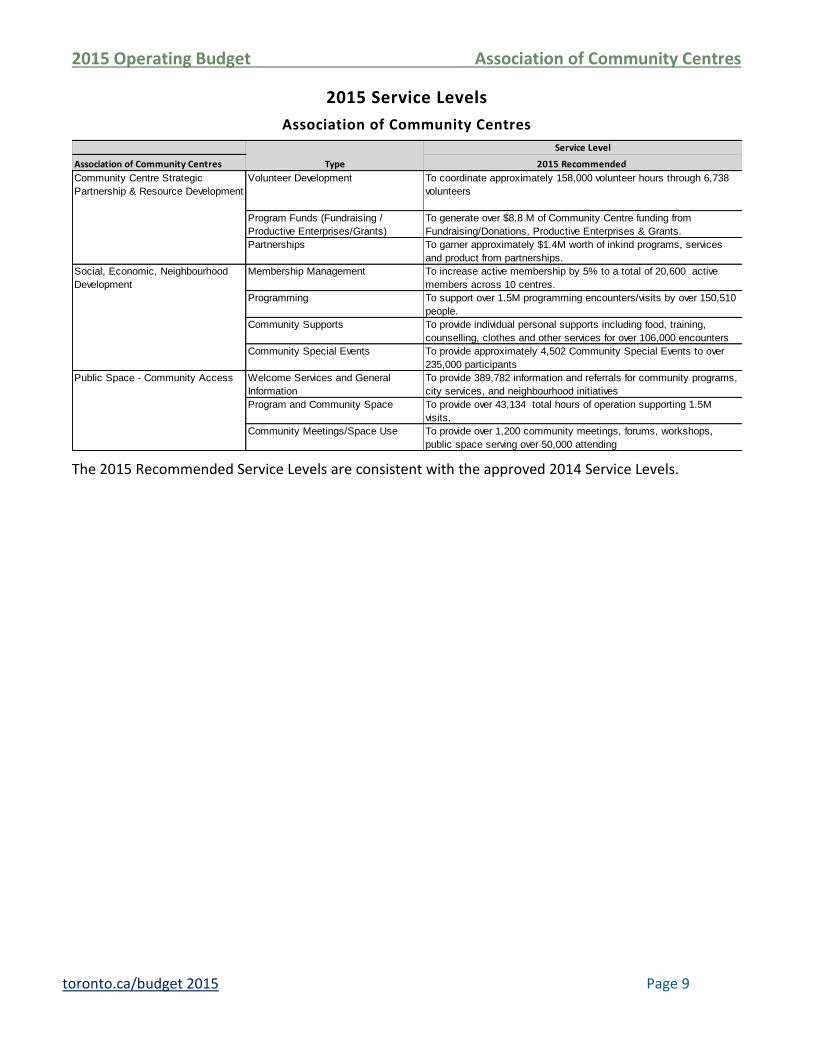
2015 Service Levels
Association of Community Centres
Service Level
Association of Community Centres Type 2015 Recommended
Community Centre Strategic
Partnership & Resource Development
Volunteer Development To coordinate approximately 158,000 volunteer hours through 6,738
volunteers
Program Funds (Fundraising /
Productive Enterprises/Grants)
To generate over $8.8 M of Community Centre funding from
Fundraising/Donations, Productive Enterprises & Grants.
Partnerships To garner approximately $1.4M worth of inkind programs, services
and product from partnerships.
Social, Economic, Neighbourhood
Development
Membership Management To increase active membership by 5% to a total of 20,600 active
members across 10 centres.
Programming To support over 1.5M programming encounters/visits by over 150,510
people.
Community Supports To provide individual personal supports including food, training,
counselling, clothes and other services for over 106,000 encounters
Community Special Events To provide approximately 4,502 Community Special Events to over
235,000 participants
Public Space - Community Access Welcome Services and General
Information
To provide 389,782 information and referrals for community programs,
city services, and neighbourhood initiatives
Program and Community Space To provide over 43,134 total hours of operation supporting 1.5M
visits.
Community Meetings/Space Use To provide over 1,200 community meetings, forums, workshops,
public space serving over 50,000 attending
The 2015 Recommended Service Levels are consistent with the approved 2014 Service Levels.
2015 Operating Budget Association of Community Centres
toronto.ca/budget 2015 Page 10
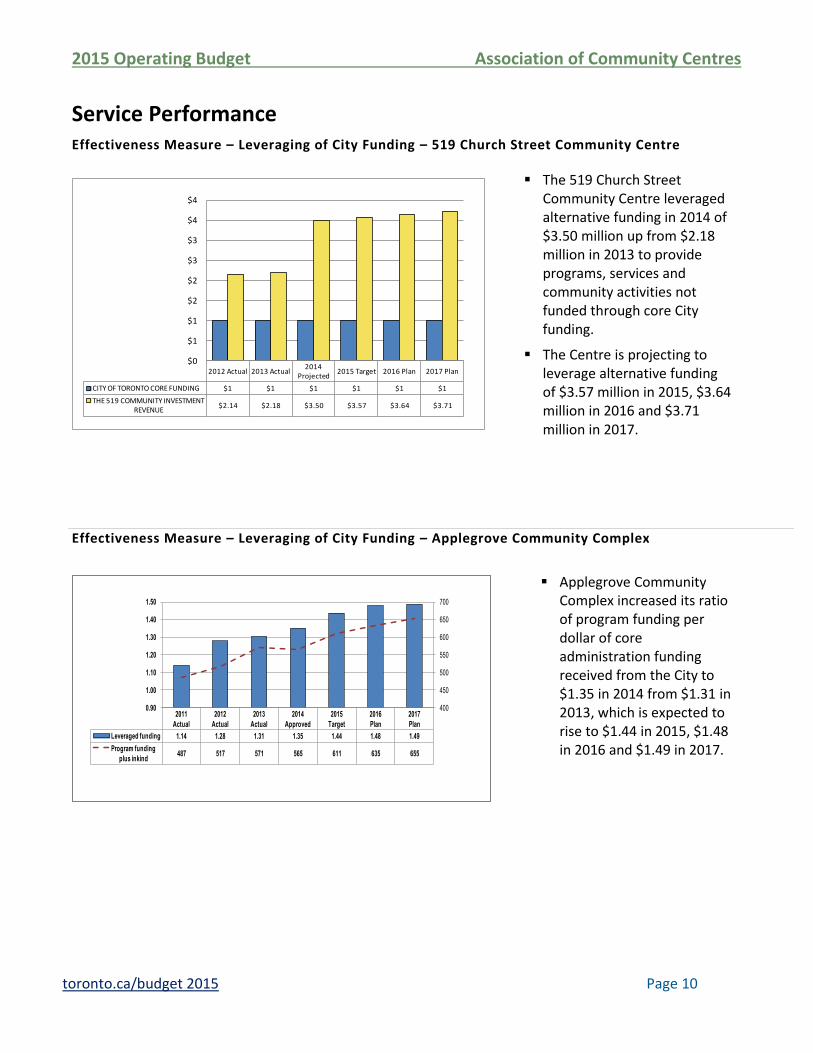
Service Performance Effectiveness Measure – Leveraging of City Funding – 519 Church Street Community Centre
2012 Actual 2013 Actual2014
Projected2015 Target 2016 Plan 2017 Plan
CITY OF TORONTO CORE FUNDING $1 $1 $1 $1 $1 $1
THE 519 COMMUNITY INVESTMENT REVENUE
$2.14 $2.18 $3.50 $3.57 $3.64 $3.71
$0
$1
$1
$2
$2
$3
$3
$4
$4
Effectiveness Measure – Leveraging of City Funding – Applegrove Community Complex
2011
Actual
2012
Actual
2013
Actual
2014
Approved
2015
Target
2016
Plan
2017
Plan
Leveraged funding 1.14 1.28 1.31 1.35 1.44 1.48 1.49
Program funding
plus inkind487 517 571 565 611 635 655
400
450
500
550
600
650
700
0.90
1.00
1.10
1.20
1.30
1.40
1.50
The 519 Church Street Community Centre leveraged alternative funding in 2014 of $3.50 million up from $2.18 million in 2013 to provide programs, services and community activities not funded through core City funding.
The Centre is projecting to leverage alternative funding of $3.57 million in 2015, $3.64 million in 2016 and $3.71 million in 2017.
Applegrove Community Complex increased its ratio of program funding per dollar of core administration funding received from the City to $1.35 in 2014 from $1.31 in 2013, which is expected to rise to $1.44 in 2015, $1.48 in 2016 and $1.49 in 2017.
2015 Operating Budget Association of Community Centres
toronto.ca/budget 2015 Page 11
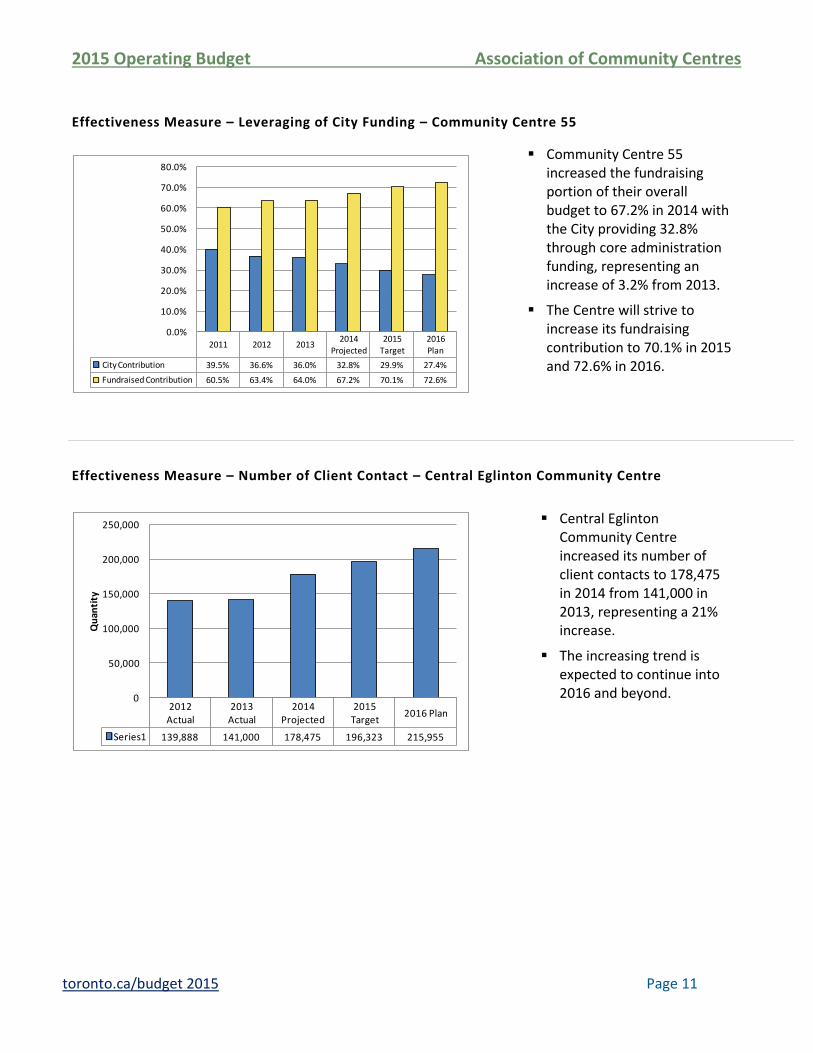
Effectiveness Measure – Leveraging of City Funding – Community Centre 55
2011 2012 20132014
Projected2015
Target2016 Plan
City Contribution 39.5% 36.6% 36.0% 32.8% 29.9% 27.4%
Fundraised Contribution 60.5% 63.4% 64.0% 67.2% 70.1% 72.6%
0.0%
10.0%
20.0%
30.0%
40.0%
50.0%
60.0%
70.0%
80.0%
Effectiveness Measure – Number of Client Contact – Central Eglinton Community Centre
2012 Actual
2013 Actual
2014 Projected
2015 Target
2016 Plan
Series1 139,888 141,000 178,475 196,323 215,955
0
50,000
100,000
150,000
200,000
250,000
Qu
anti
ty
Community Centre 55 increased the fundraising portion of their overall budget to 67.2% in 2014 with the City providing 32.8% through core administration funding, representing an increase of 3.2% from 2013.
The Centre will strive to increase its fundraising contribution to 70.1% in 2015 and 72.6% in 2016.
Central Eglinton Community Centre increased its number of client contacts to 178,475 in 2014 from 141,000 in 2013, representing a 21% increase.
The increasing trend is expected to continue into 2016 and beyond.
2015 Operating Budget Association of Community Centres
toronto.ca/budget 2015 Page 12
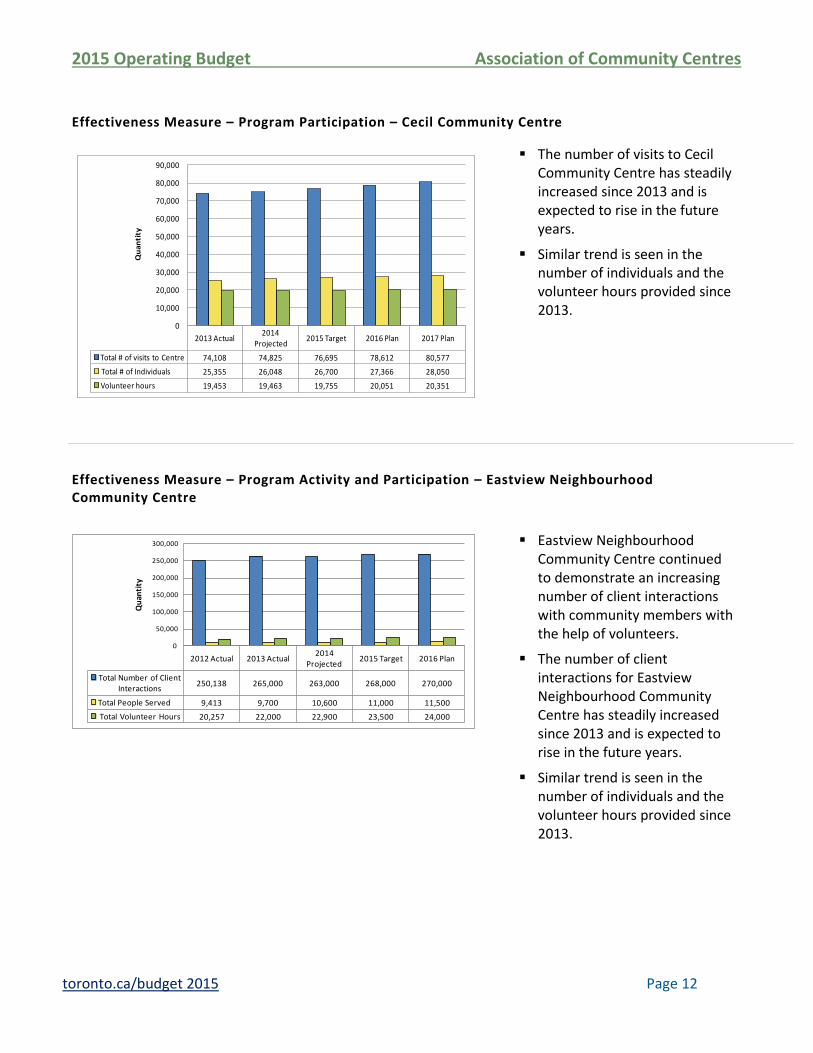
Effectiveness Measure – Program Participation – Cecil Community Centre
2013 Actual2014
Projected2015 Target 2016 Plan 2017 Plan
Total # of visits to Centre 74,108 74,825 76,695 78,612 80,577
Total # of Individuals 25,355 26,048 26,700 27,366 28,050
Volunteer hours 19,453 19,463 19,755 20,051 20,351
0
10,000
20,000
30,000
40,000
50,000
60,000
70,000
80,000
90,000
Qu
an
tity
Effectiveness Measure – Program Activity and Participation – Eastview Neighbourhood Community Centre
2012 Actual 2013 Actual2014
Projected2015 Target 2016 Plan
Total Number of Client Interactions
250,138 265,000 263,000 268,000 270,000
Total People Served 9,413 9,700 10,600 11,000 11,500
Total Volunteer Hours 20,257 22,000 22,900 23,500 24,000
0
50,000
100,000
150,000
200,000
250,000
300,000
Qu
anti
ty
The number of visits to Cecil Community Centre has steadily increased since 2013 and is expected to rise in the future years.
Similar trend is seen in the number of individuals and the volunteer hours provided since 2013.
Eastview Neighbourhood Community Centre continued to demonstrate an increasing number of client interactions with community members with the help of volunteers.
The number of client interactions for Eastview Neighbourhood Community Centre has steadily increased since 2013 and is expected to rise in the future years.
Similar trend is seen in the number of individuals and the volunteer hours provided since 2013.
2015 Operating Budget Association of Community Centres
toronto.ca/budget 2015 Page 13
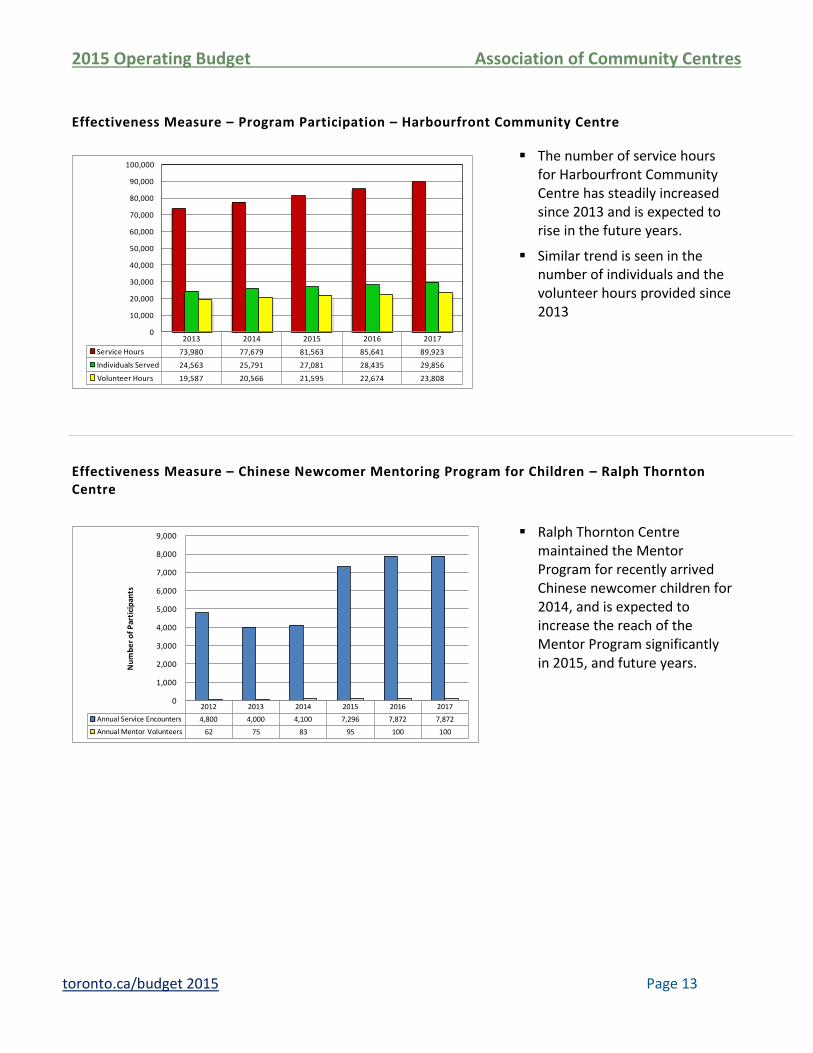
Effectiveness Measure – Program Participation – Harbourfront Community Centre
2013 2014 2015 2016 2017
Service Hours 73,980 77,679 81,563 85,641 89,923
Individuals Served 24,563 25,791 27,081 28,435 29,856
Volunteer Hours 19,587 20,566 21,595 22,674 23,808
0
10,000
20,000
30,000
40,000
50,000
60,000
70,000
80,000
90,000
100,000
Effectiveness Measure – Chinese Newcomer Mentoring Program for Children – Ralph Thornton Centre
2012 2013 2014 2015 2016 2017
Annual Service Encounters 4,800 4,000 4,100 7,296 7,872 7,872
Annual Mentor Volunteers 62 75 83 95 100 100
0
1,000
2,000
3,000
4,000
5,000
6,000
7,000
8,000
9,000
Nu
mb
er
of
Par
tici
pan
ts
The number of service hours for Harbourfront Community Centre has steadily increased since 2013 and is expected to rise in the future years.
Similar trend is seen in the number of individuals and the volunteer hours provided since 2013
Ralph Thornton Centre maintained the Mentor Program for recently arrived Chinese newcomer children for 2014, and is expected to increase the reach of the Mentor Program significantly in 2015, and future years.
2015 Operating Budget Association of Community Centres
toronto.ca/budget 2015 Page 14
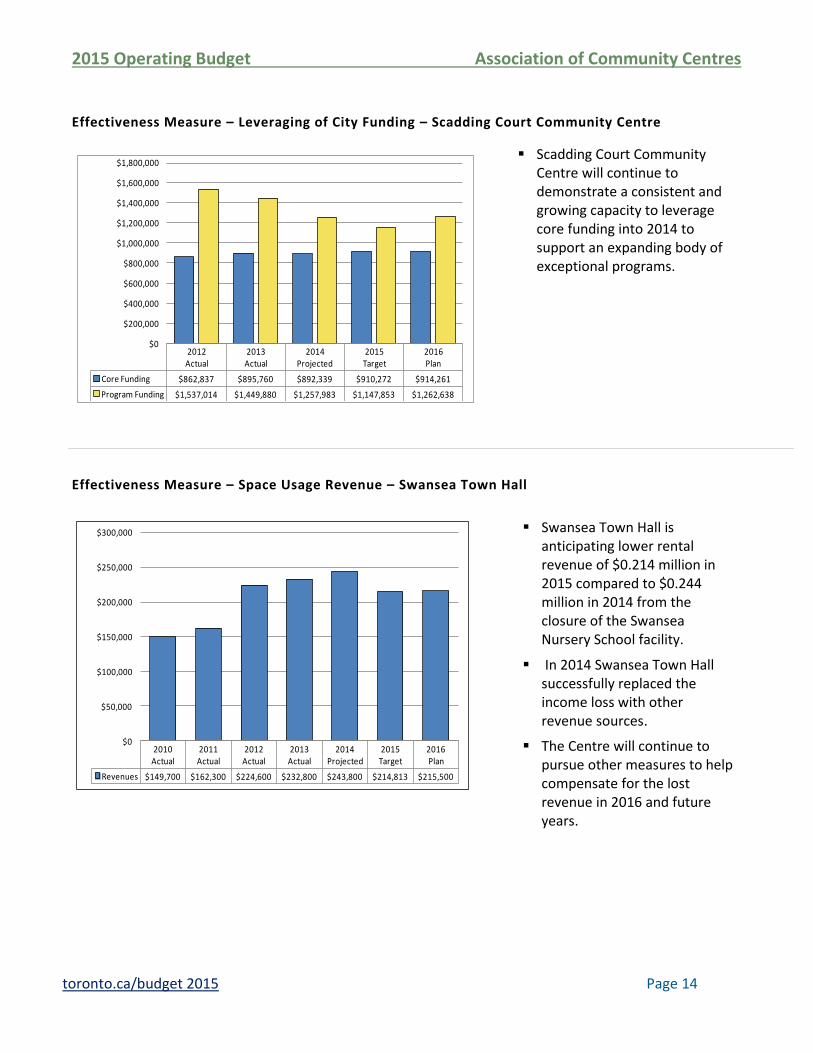
Effectiveness Measure – Leveraging of City Funding – Scadding Court Community Centre
2012 Actual
2013 Actual
2014 Projected
2015 Target
2016 Plan
Core Funding $862,837 $895,760 $892,339 $910,272 $914,261
Program Funding $1,537,014 $1,449,880 $1,257,983 $1,147,853 $1,262,638
$0
$200,000
$400,000
$600,000
$800,000
$1,000,000
$1,200,000
$1,400,000
$1,600,000
$1,800,000
Effectiveness Measure – Space Usage Revenue – Swansea Town Hall
2010 Actual
2011 Actual
2012 Actual
2013 Actual
2014 Projected
2015 Target
2016 Plan
Revenues $149,700 $162,300 $224,600 $232,800 $243,800 $214,813 $215,500
$0
$50,000
$100,000
$150,000
$200,000
$250,000
$300,000
Scadding Court Community Centre will continue to demonstrate a consistent and growing capacity to leverage core funding into 2014 to support an expanding body of exceptional programs.
Swansea Town Hall is anticipating lower rental revenue of $0.214 million in 2015 compared to $0.244 million in 2014 from the closure of the Swansea Nursery School facility.
In 2014 Swansea Town Hall successfully replaced the income loss with other revenue sources.
The Centre will continue to pursue other measures to help compensate for the lost revenue in 2016 and future years.
2015 Operating Budget Association of Community Centres
toronto.ca/budget 2015 Page 15
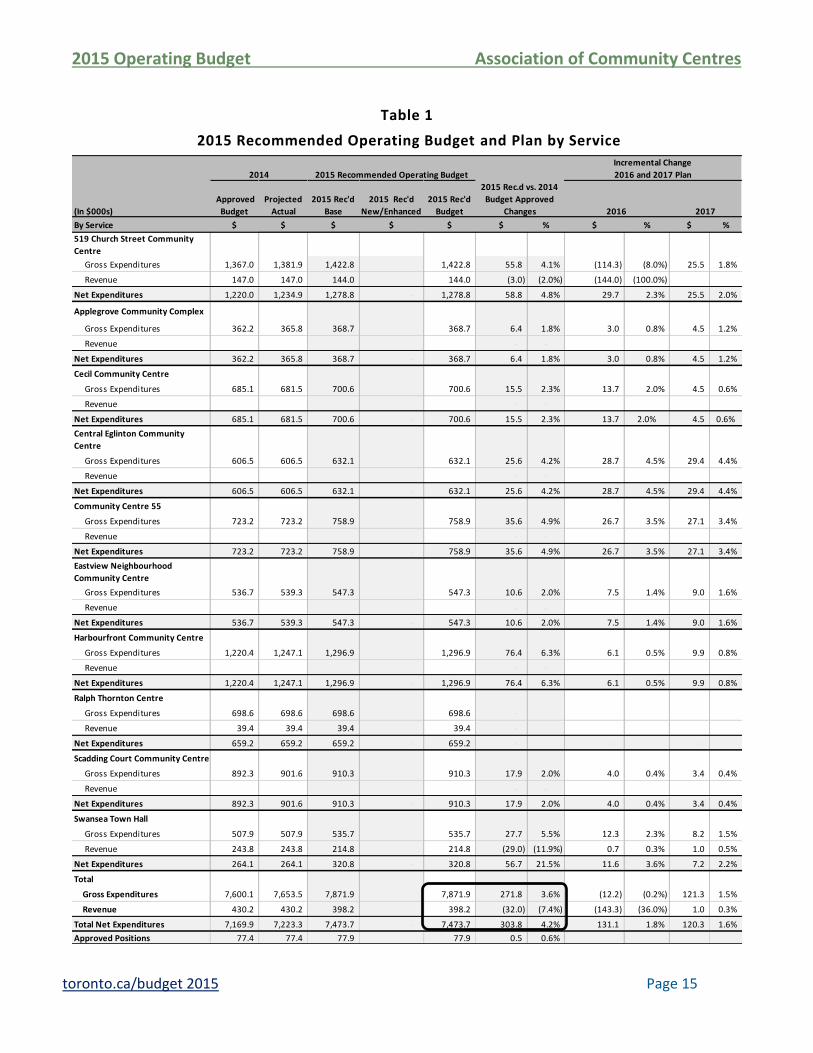
Table 1
2015 Recommended Operating Budget and Plan by Service
Incremental Change
2016 and 2017 Plan
(In $000s)
Approved
Budget
Projected
Actual
2015 Rec'd
Base
2015 Rec'd
New/Enhanced
2015 Rec'd
Budget
By Service $ $ $ $ $ $ % $ % $ %
519 Church Street Community
Centre
Gross Expenditures 1,367.0 1,381.9 1,422.8 1,422.8 55.8 4.1% (114.3) (8.0%) 25.5 1.8%
Revenue 147.0 147.0 144.0 144.0 (3.0) (2.0%) (144.0) (100.0%) -
Net Expenditures 1,220.0 1,234.9 1,278.8 - 1,278.8 58.8 4.8% 29.7 2.3% 25.5 2.0%
Applegrove Community Complex
Gross Expenditures 362.2 365.8 368.7 368.7 6.4 1.8% 3.0 0.8% 4.5 1.2%
Revenue - - -
Net Expenditures 362.2 365.8 368.7 - 368.7 6.4 1.8% 3.0 0.8% 4.5 1.2%
Cecil Community Centre
Gross Expenditures 685.1 681.5 700.6 700.6 15.5 2.3% 13.7 2.0% 4.5 0.6%
Revenue - - -
Net Expenditures 685.1 681.5 700.6 - 700.6 15.5 2.3% 13.7 2.0% 4.5 0.6%
Central Eglinton Community
Centre
Gross Expenditures 606.5 606.5 632.1 632.1 25.6 4.2% 28.7 4.5% 29.4 4.4%
Revenue - - -
Net Expenditures 606.5 606.5 632.1 - 632.1 25.6 4.2% 28.7 4.5% 29.4 4.4%
Community Centre 55
Gross Expenditures 723.2 723.2 758.9 758.9 35.6 4.9% 26.7 3.5% 27.1 3.4%
Revenue - - -
Net Expenditures 723.2 723.2 758.9 - 758.9 35.6 4.9% 26.7 3.5% 27.1 3.4%
Eastview Neighbourhood
Community Centre
Gross Expenditures 536.7 539.3 547.3 547.3 10.6 2.0% 7.5 1.4% 9.0 1.6%
Revenue - - -
Net Expenditures 536.7 539.3 547.3 - 547.3 10.6 2.0% 7.5 1.4% 9.0 1.6%
Harbourfront Community Centre
Gross Expenditures 1,220.4 1,247.1 1,296.9 1,296.9 76.4 6.3% 6.1 0.5% 9.9 0.8%
Revenue - - -
Net Expenditures 1,220.4 1,247.1 1,296.9 - 1,296.9 76.4 6.3% 6.1 0.5% 9.9 0.8%
Ralph Thornton Centre
Gross Expenditures 698.6 698.6 698.6 698.6 - -
Revenue 39.4 39.4 39.4 39.4 -
Net Expenditures 659.2 659.2 659.2 - 659.2 - - -
Scadding Court Community Centre
Gross Expenditures 892.3 901.6 910.3 910.3 17.9 2.0% 4.0 0.4% 3.4 0.4%
Revenue - - - -
Net Expenditures 892.3 901.6 910.3 - 910.3 17.9 2.0% 4.0 0.4% 3.4 0.4%
Swansea Town Hall
Gross Expenditures 507.9 507.9 535.7 535.7 27.7 5.5% 12.3 2.3% 8.2 1.5%
Revenue 243.8 243.8 214.8 214.8 (29.0) (11.9%) 0.7 0.3% 1.0 0.5%
Net Expenditures 264.1 264.1 320.8 - 320.8 56.7 21.5% 11.6 3.6% 7.2 2.2%
Total
Gross Expenditures 7,600.1 7,653.5 7,871.9 7,871.9 271.8 3.6% (12.2) (0.2%) 121.3 1.5%
Revenue 430.2 430.2 398.2 398.2 (32.0) (7.4%) (143.3) (36.0%) 1.0 0.3%
Total Net Expenditures 7,169.9 7,223.3 7,473.7 - 7,473.7 303.8 4.2% 131.1 1.8% 120.3 1.6%
Approved Positions 77.4 77.4 77.9 77.9 0.5 0.6%
2014 2015 Recommended Operating Budget
2015 Rec.d vs. 2014
Budget Approved
Changes 2016 2017
2015 Operating Budget Association of Community Centres
toronto.ca/budget 2015 Page 16
The 2015 Recommended Operating Budget for the Association of Community Centres is $7.872 million gross and $7.474 million net. The net budget increased by $0.304 million or 4.2% due to the following:
All services are experiencing inflationary increases in salary and benefits and non-payroll expenditures totaling $0.282 million.
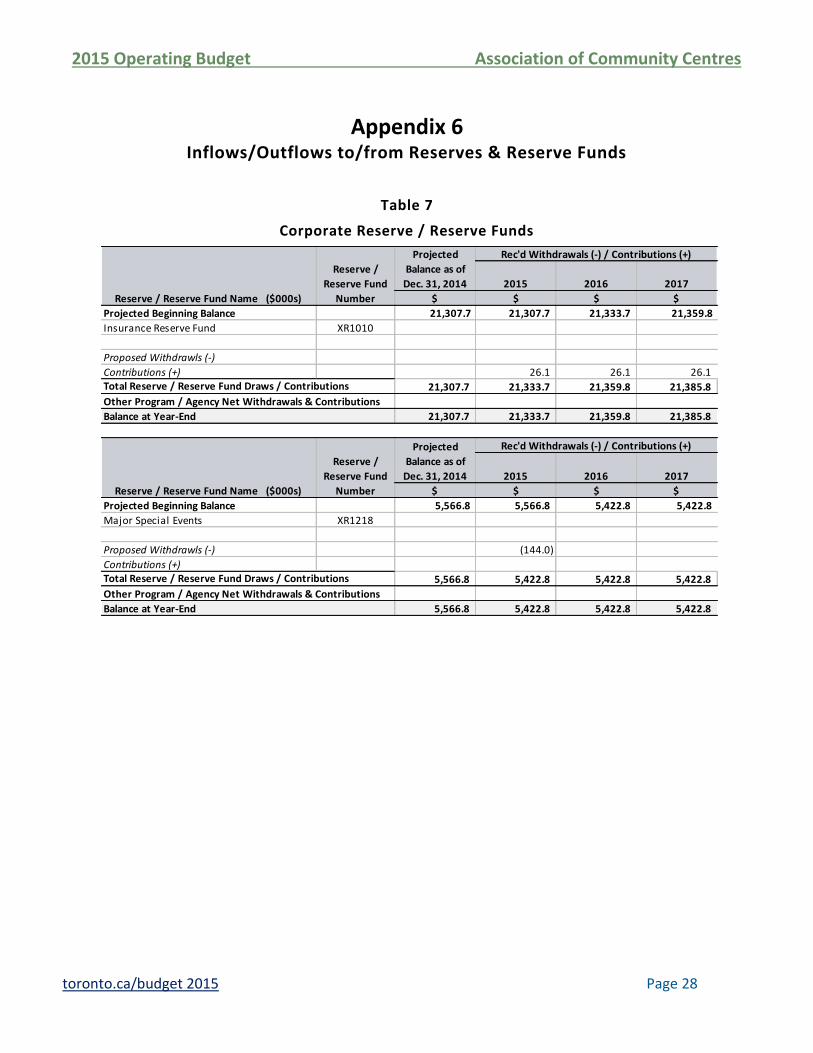
Other base budget pressures are attributable to the loss of rental revenue arising from the closure of the Swansea Nursery School facility at Swansea Town Hall of $0.029 million. Funding of $0.144 million from the Major Special Events Reserve Fund is included for the 519 Church Street Community Centre to complete the delivery of Pan Am – PrideHouseTO initiative that commenced in 2014 providing several activities for engaging LGBTQ communities during and leading up to the 2015 games.
The above base budget pressures have been offset by reductions identified in line-by-line reviews of $0.008 million at Cecil Community Centre and Ralph Thornton Centre.
The 2016 and 2017 Plans reflect the inflationary increase for salary and benefits and non-payroll expenditures. As 2016 is a collective bargaining year, no cost of living allowance estimate has been included.
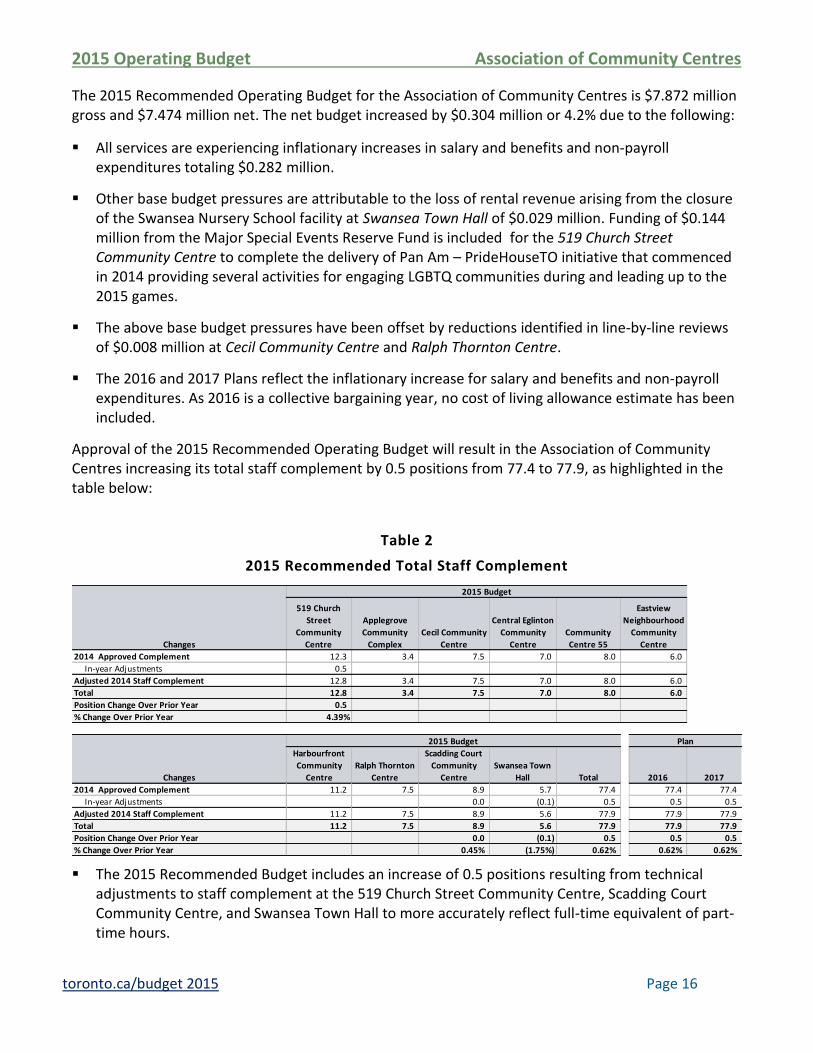
Approval of the 2015 Recommended Operating Budget will result in the Association of Community Centres increasing its total staff complement by 0.5 positions from 77.4 to 77.9, as highlighted in the table below:
Table 2
2015 Recommended Total Staff Complement
Plan
Changes
519 Church
Street
Community
Centre
Applegrove
Community
Complex
Cecil Community
Centre
Central Eglinton
Community
Centre
Community
Centre 55 2016
2014 Approved Complement 12.3 3.4 7.5 7.0 8.0
In-year Adjustments 0.5
Adjusted 2014 Staff Complement 12.8 3.4 7.5 7.0 8.0
Total 12.8 3.4 7.5 7.0 8.0
Position Change Over Prior Year 0.5
% Change Over Prior Year 4.39% 0.00% 0.00% 0.00% 0.00% -
Changes
Harbourfront
Community
Centre
Ralph Thornton
Centre
Scadding Court
Community
Centre
Swansea Town
Hall Total 2016
2014 Approved Complement 11.2 7.5 8.9 5.7 77.4 77.4
In-year Adjustments 0.0 (0.1) 0.5 0.5
Adjusted 2014 Staff Complement 11.2 7.5 8.9 5.6 77.9 77.9
Total 11.2 7.5 8.9 5.6 77.9 77.9
Position Change Over Prior Year 0.0 (0.1) 0.5 0.5
% Change Over Prior Year 0.45% (1.75%) 0.62% 0.62%
6.0
6.0
2015 Budget
Eastview
Neighbourhood
Community
Centre
6.0
2015 Budget
2017
77.4
0.5
77.9
77.9
0.5
0.62%
Plan
The 2015 Recommended Budget includes an increase of 0.5 positions resulting from technical
adjustments to staff complement at the 519 Church Street Community Centre, Scadding Court Community Centre, and Swansea Town Hall to more accurately reflect full-time equivalent of part-time hours.
2015 Operating Budget Association of Community Centres
toronto.ca/budget 2015 Page 17
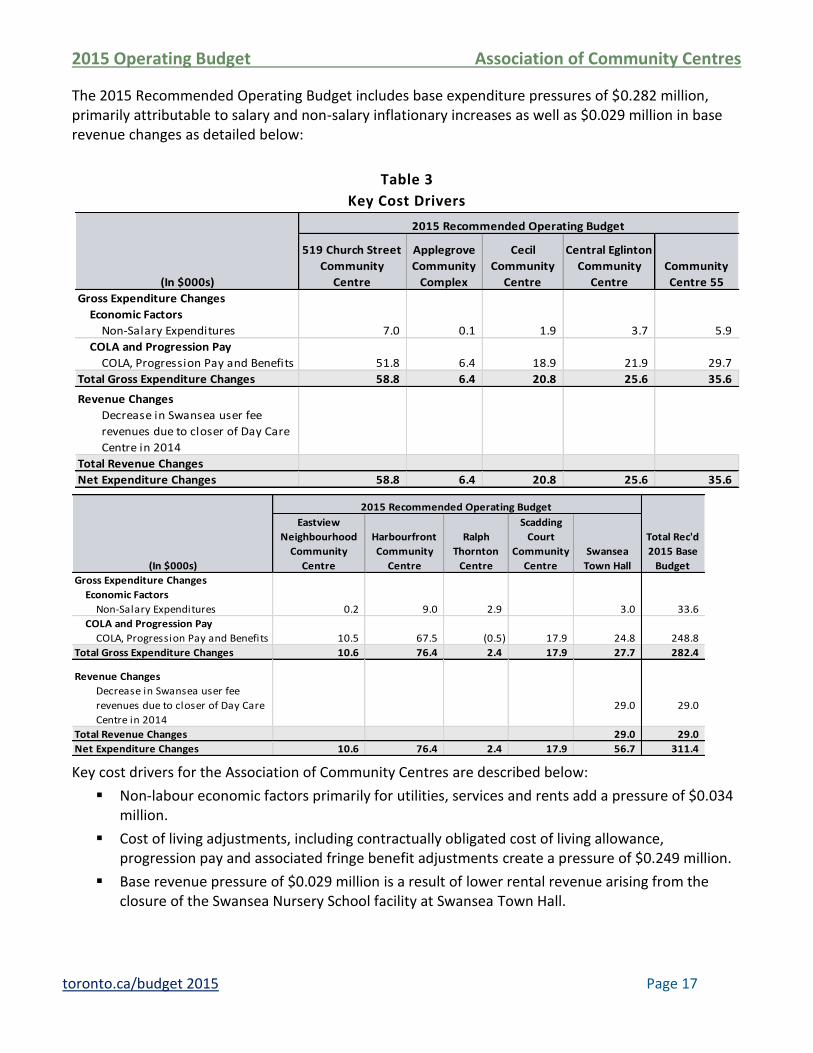
The 2015 Recommended Operating Budget includes base expenditure pressures of $0.282 million, primarily attributable to salary and non-salary inflationary increases as well as $0.029 million in base revenue changes as detailed below:
Table 3
Key Cost Drivers
(In $000s)
519 Church Street
Community
Centre
Applegrove
Community
Complex
Cecil
Community
Centre
Central Eglinton
Community
Centre
Community
Centre 55
Gross Expenditure Changes
Economic Factors
Non-Salary Expenditures 7.0 0.1 1.9 3.7 5.9
COLA and Progression Pay
COLA, Progression Pay and Benefits 51.8 6.4 18.9 21.9 29.7
Total Gross Expenditure Changes 58.8 6.4 20.8 25.6 35.6
Revenue Changes
Decrease in Swansea user fee
revenues due to closer of Day Care
Centre in 2014
Total Revenue Changes
Net Expenditure Changes 58.8 6.4 20.8 25.6 35.6
2015 Recommended Operating Budget
(In $000s)
Eastview
Neighbourhood
Community
Centre
Harbourfront
Community
Centre
Ralph
Thornton
Centre
Scadding
Court
Community
Centre
Swansea
Town Hall
Gross Expenditure Changes
Economic Factors
Non-Salary Expenditures 0.2 9.0 2.9 3.0 33.6
COLA and Progression Pay
COLA, Progression Pay and Benefits 10.5 67.5 (0.5) 17.9 24.8 248.8
Total Gross Expenditure Changes 10.6 76.4 2.4 17.9 27.7 282.4
Revenue Changes
Decrease in Swansea user fee
revenues due to closer of Day Care
Centre in 2014
29.0 29.0
Total Revenue Changes 29.0 29.0
Net Expenditure Changes 10.6 76.4 2.4 17.9 56.7 311.4
2015 Recommended Operating Budget
Total Rec'd
2015 Base
Budget
Key cost drivers for the Association of Community Centres are described below:
Non-labour economic factors primarily for utilities, services and rents add a pressure of $0.034 million.
Cost of living adjustments, including contractually obligated cost of living allowance, progression pay and associated fringe benefit adjustments create a pressure of $0.249 million.
Base revenue pressure of $0.029 million is a result of lower rental revenue arising from the closure of the Swansea Nursery School facility at Swansea Town Hall.
2015 Operating Budget Association of Community Centres
toronto.ca/budget 2015 Page 18
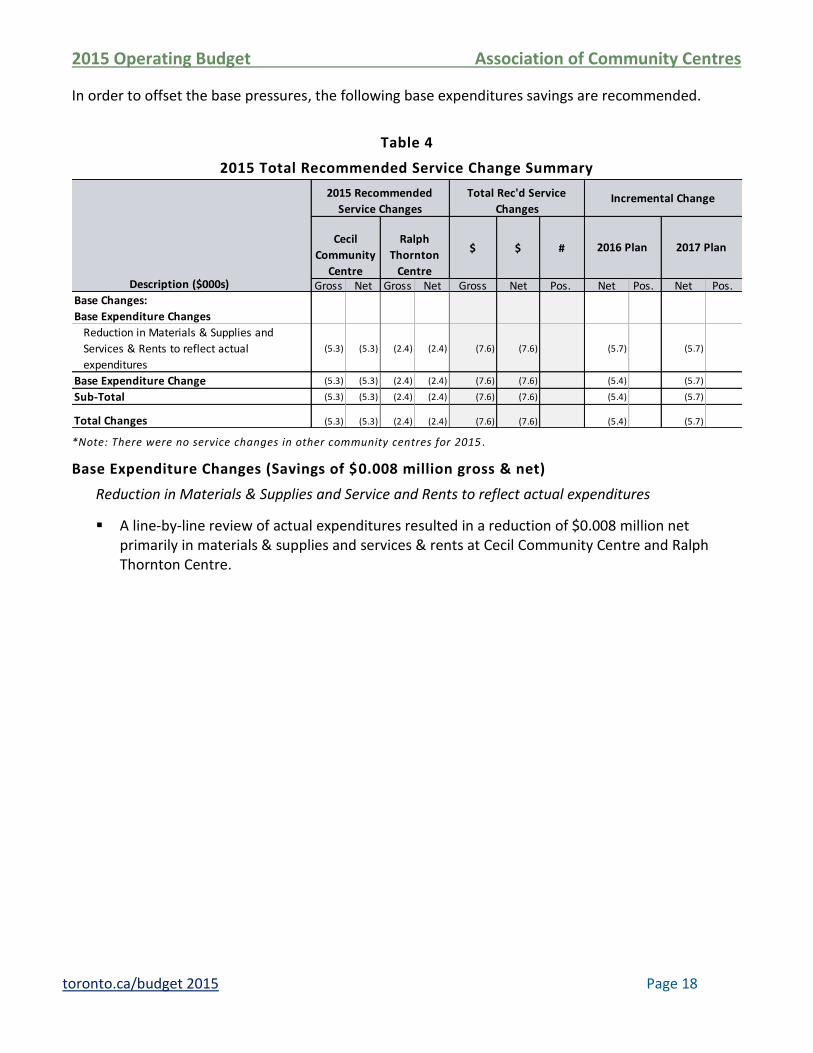
In order to offset the base pressures, the following base expenditures savings are recommended.
Table 4
2015 Total Recommended Service Change Summary
Incremental Change
$ $ #
Gross Net Gross Net Gross Net Pos. Net Pos. Net Pos. Base Changes:
Base Expenditure Changes
Reduction in Materials & Supplies and
Services & Rents to reflect actual
expenditures
(5.3) (5.3) (2.4) (2.4) (7.6) (7.6) (5.7) (5.7)
Base Expenditure Change (5.3) (5.3) (2.4) (2.4) (7.6) (7.6) (5.4) (5.7)
Sub-Total (5.3) (5.3) (2.4) (2.4) (7.6) (7.6) (5.4) (5.7)
Total Changes (5.3) (5.3) (2.4) (2.4) (7.6) (7.6) (5.4) (5.7)
2016 Plan 2017 Plan
2015 Recommended
Service Changes
Total Rec'd Service
Changes
Description ($000s)
Cecil
Community
Centre
Ralph
Thornton
Centre
*Note: There were no service changes in other community centres for 2015 .
Base Expenditure Changes (Savings of $0.008 million gross & net)
Reduction in Materials & Supplies and Service and Rents to reflect actual expenditures
A line-by-line review of actual expenditures resulted in a reduction of $0.008 million net primarily in materials & supplies and services & rents at Cecil Community Centre and Ralph Thornton Centre.
2015 Operating Budget Association of Community Centres
toronto.ca/budget 2015 Page 19
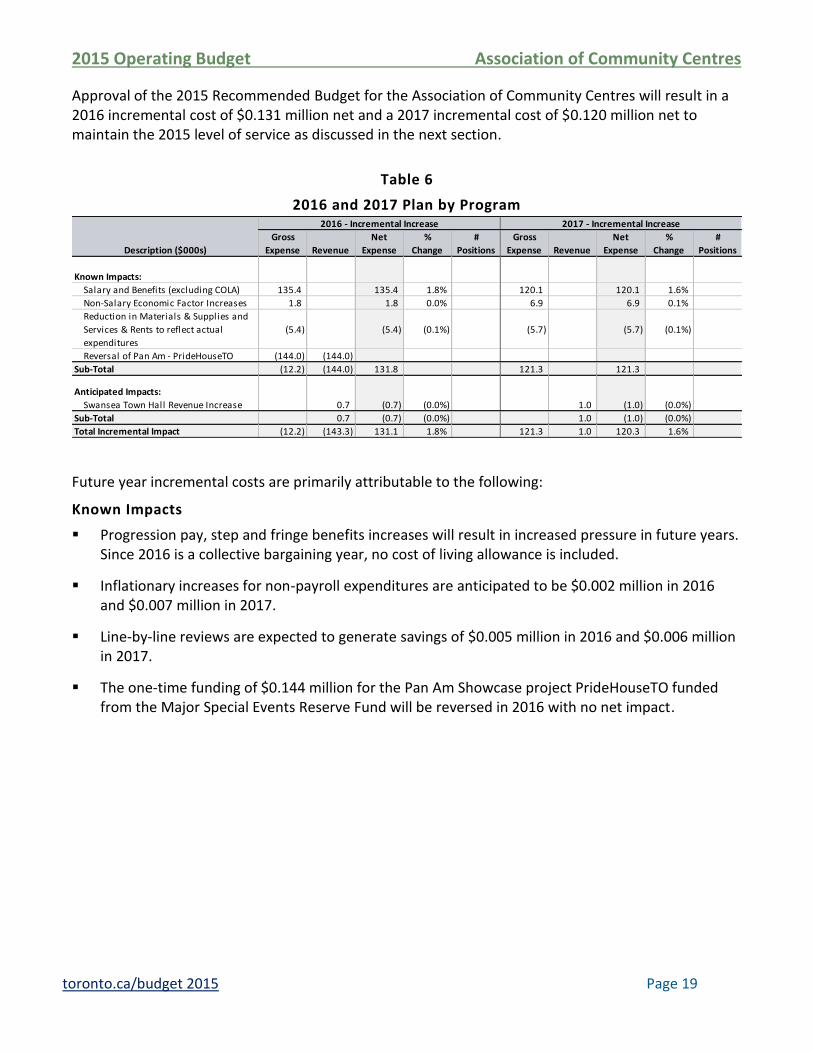
Approval of the 2015 Recommended Budget for the Association of Community Centres will result in a 2016 incremental cost of $0.131 million net and a 2017 incremental cost of $0.120 million net to maintain the 2015 level of service as discussed in the next section.
Table 6
2016 and 2017 Plan by Program
Description ($000s)
Gross
Expense Revenue
Net
Expense
%
Change
#
Positions
Gross
Expense Revenue
Net
Expense
%
Change
#
Positions
Known Impacts:
Salary and Benefits (excluding COLA) 135.4 135.4 1.8% 120.1 120.1 1.6%
Non-Salary Economic Factor Increases 1.8 1.8 0.0% 6.9 6.9 0.1%
Reduction in Materials & Supplies and
Services & Rents to reflect actual
expenditures
(5.4) (5.4) (0.1%) (5.7) (5.7) (0.1%)
Reversal of Pan Am - PrideHouseTO (144.0) (144.0)
Sub-Total (12.2) (144.0) 131.8 121.3 121.3
Anticipated Impacts:
Swansea Town Hall Revenue Increase 0.7 (0.7) (0.0%) 1.0 (1.0) (0.0%)
Sub-Total 0.7 (0.7) (0.0%) 1.0 (1.0) (0.0%)
Total Incremental Impact (12.2) (143.3) 131.1 1.8% 121.3 1.0 120.3 1.6%
2016 - Incremental Increase 2017 - Incremental Increase
Future year incremental costs are primarily attributable to the following:
Known Impacts
Progression pay, step and fringe benefits increases will result in increased pressure in future years. Since 2016 is a collective bargaining year, no cost of living allowance is included.
Inflationary increases for non-payroll expenditures are anticipated to be $0.002 million in 2016 and $0.007 million in 2017.
Line-by-line reviews are expected to generate savings of $0.005 million in 2016 and $0.006 million in 2017.
The one-time funding of $0.144 million for the Pan Am Showcase project PrideHouseTO funded from the Major Special Events Reserve Fund will be reversed in 2016 with no net impact.

2015 Operating Budget Association of Community Centres
toronto.ca/budget 2015 Page 20
Part III: Issues for Discussion
2015 Operating Budget Association of Community Centres
toronto.ca/budget 2015 Page 21
Issues for Discussion Issues Impacting the 2015 Budget
2015 Operating Budget vs. Guideline
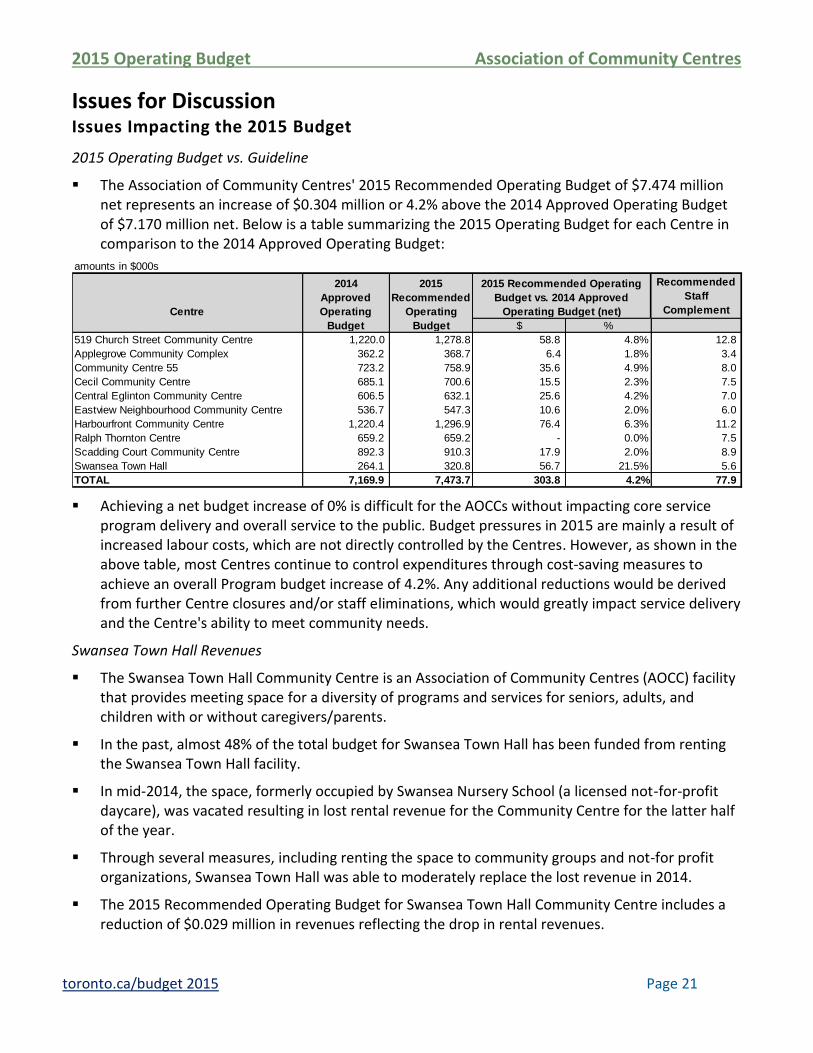
The Association of Community Centres' 2015 Recommended Operating Budget of $7.474 million net represents an increase of $0.304 million or 4.2% above the 2014 Approved Operating Budget of $7.170 million net. Below is a table summarizing the 2015 Operating Budget for each Centre in comparison to the 2014 Approved Operating Budget:
Centre
Recommended
Staff
Complement
$ %
519 Church Street Community Centre 1,220.0 1,278.8 58.8 4.8% 12.8
Applegrove Community Complex 362.2 368.7 6.4 1.8% 3.4
Community Centre 55 723.2 758.9 35.6 4.9% 8.0
Cecil Community Centre 685.1 700.6 15.5 2.3% 7.5
Central Eglinton Community Centre 606.5 632.1 25.6 4.2% 7.0
Eastview Neighbourhood Community Centre 536.7 547.3 10.6 2.0% 6.0
Harbourfront Community Centre 1,220.4 1,296.9 76.4 6.3% 11.2
Ralph Thornton Centre 659.2 659.2 - 0.0% 7.5
Scadding Court Community Centre 892.3 910.3 17.9 2.0% 8.9
Swansea Town Hall 264.1 320.8 56.7 21.5% 5.6
TOTAL 7,169.9 7,473.7 303.8 4.2% 77.9
amounts in $000s
2014
Approved
Operating
Budget
2015
Recommended
Operating
Budget
2015 Recommended Operating
Budget vs. 2014 Approved
Operating Budget (net)
Achieving a net budget increase of 0% is difficult for the AOCCs without impacting core service program delivery and overall service to the public. Budget pressures in 2015 are mainly a result of increased labour costs, which are not directly controlled by the Centres. However, as shown in the above table, most Centres continue to control expenditures through cost-saving measures to achieve an overall Program budget increase of 4.2%. Any additional reductions would be derived from further Centre closures and/or staff eliminations, which would greatly impact service delivery and the Centre's ability to meet community needs.
Swansea Town Hall Revenues
The Swansea Town Hall Community Centre is an Association of Community Centres (AOCC) facility that provides meeting space for a diversity of programs and services for seniors, adults, and children with or without caregivers/parents.
In the past, almost 48% of the total budget for Swansea Town Hall has been funded from renting the Swansea Town Hall facility.
In mid-2014, the space, formerly occupied by Swansea Nursery School (a licensed not-for-profit daycare), was vacated resulting in lost rental revenue for the Community Centre for the latter half of the year.
Through several measures, including renting the space to community groups and not-for profit organizations, Swansea Town Hall was able to moderately replace the lost revenue in 2014.
The 2015 Recommended Operating Budget for Swansea Town Hall Community Centre includes a reduction of $0.029 million in revenues reflecting the drop in rental revenues.
2015 Operating Budget Association of Community Centres
toronto.ca/budget 2015 Page 22
In 2015, the Community Centre will continue to explore other options to be housed in the facility, aimed at increasing the overall revenues to achieve prior year levels.
Future Year Issues
Increase in Demand at the Centres
The key issue for the AOCCs in 2015 and in the future, is their ability to continue maintaining the same level of service and performance in the face of increasing expectations and demand for service.
As an example, Harbourfront Community Centre increased its service hours from 73,980 in 2013 to 77,679 in 2014, representing an increase of 4.8%. Please see pages 12 and 13 for similar trends in other community centres.
The City funds 100% of the Centres' Core Administration costs or approximately 50% of the total AOCC Operating Budget with the remaining funding coming from a combination of City and non-City grants and user fees.
The AOCCs have thus far, managed to maintain the current level of programming and activities through fundraising, staff training, and networking with other organizations.
As an example, the 519 Church Street Community Centre leveraged alternative funding of $3.50 million in 2014 up from $2.18 million in 2013 to provide programs, services and community activities not funded through core City funding. Please see pages 10 and 11 for similar trends in other community centres.
Given that third party funding to the Community Centres is unpredictable, planning for a 3-year horizon is difficult.
As the demand for services and community activities conitues to grow with the growth in population, it will become increasingly challenging for each community centre to meet service expectations and needs without an increase in staffing and budget resources where required.
2015 Operating Budget Association of Community Centres
toronto.ca/budget 2015 Page 23
Appendices:
2015 Operating Budget Association of Community Centres
toronto.ca/budget 2015 Page 24
Appendix 1 2014 Service Performance
2014 Key Service Accomplishments
In 2014, the Association of Community Centres achieved the following results:
The 519 Church Street Community Centre experienced an increase from 221,842 to 265,701 of total program, service and event community encounters. One of the programs in particular, Among Friends, since 2005, has led an inter-agency partnership offering peer-support for LGBTQ refugee claimants – individuals who come to Canada escaping persecution at home as a result of their sexual orientation or gender identity. This year, the program served 5,304 participants and welcomed 682 new clients.
Applegrove Community Complex undertook a program review that adjusted programming hours to make better use of the facility as well as enhanced participant and staff security via a video entrance/surveillance system.
Community Centre 55 provided valuable support to the community including 210 children in daycare and weekly summer camps, 56 summer jobs, 30 events and programs and food and toys for 1000 families at Christmas.
Central Eglinton Community Centre increased outreach, type and scope of programs, and volunteer-led programs for older adults/seniors aimed at increasing engagement and participation.
Cecil Community Centre saw an increase of over 19% in families attending its Family Resource Program in 2014. The Early Literacy component of the drop-in showed a 25% increase in participation with twenty and twenty-five families taking part in each session provided at the Centre.
Eastview Neighbourhood Community Centre increased service levels while restructuring the organization as well as increased the number of clients served and number of volunteer hours to keep pace with the increase of demand for service in the community.
Harbourfront Community Centre continued to experience resident growth in its community. HCC delivered 73,980 service hours, served 216,280 participants, hosted 2,233 program, service and event sessions, and leveraged financial sponsorship to provide for 246 free program sessions.
Ralph Thornton Centre provided accessible public space to over 91 community groups, organizations, and partner agencies for 25,900 service encounters.
Scadding Court Community Centre more than doubled affordable vending spaces for micro-enterprise in Market707 and has strengthened relationships with public, non-profit and private sector stakeholders to replicate this successful community economic development model to various neighbourhoods across the city.
2015 Operating Budget Association of Community Centres
toronto.ca/budget 2015 Page 25
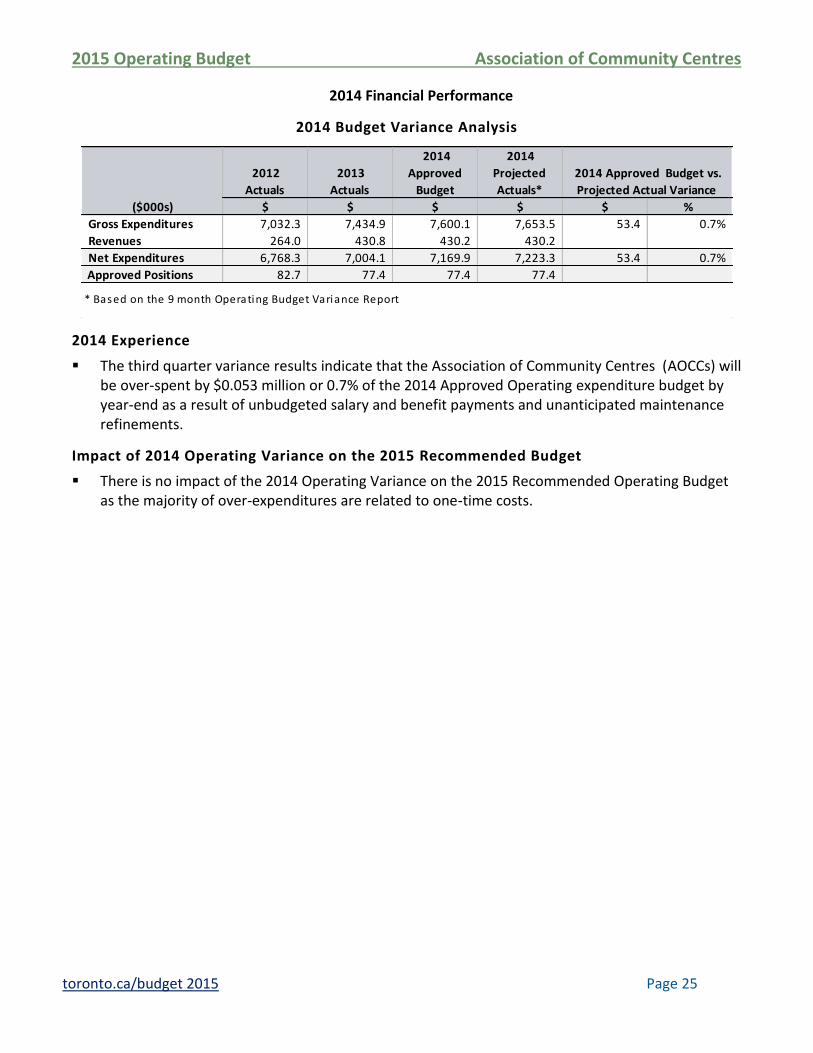
2014 Financial Performance
2014 Budget Variance Analysis
2012
Actuals
2013
Actuals
2014
Approved
Budget
2014
Projected
Actuals*
($000s) $ $ $ $ $ %
Gross Expenditures 7,032.3 7,434.9 7,600.1 7,653.5 53.4 0.7%
Revenues 264.0 430.8 430.2 430.2
Net Expenditures 6,768.3 7,004.1 7,169.9 7,223.3 53.4 0.7%
Approved Positions 82.7 77.4 77.4 77.4
2014 Approved Budget vs.
Projected Actual Variance
* Based on the 9 month Operating Budget Variance Report
2014 Experience
The third quarter variance results indicate that the Association of Community Centres (AOCCs) will be over-spent by $0.053 million or 0.7% of the 2014 Approved Operating expenditure budget by year-end as a result of unbudgeted salary and benefit payments and unanticipated maintenance refinements.
Impact of 2014 Operating Variance on the 2015 Recommended Budget
There is no impact of the 2014 Operating Variance on the 2015 Recommended Operating Budget as the majority of over-expenditures are related to one-time costs.
2015 Operating Budget Association of Community Centres
toronto.ca/budget 2015 Page 26
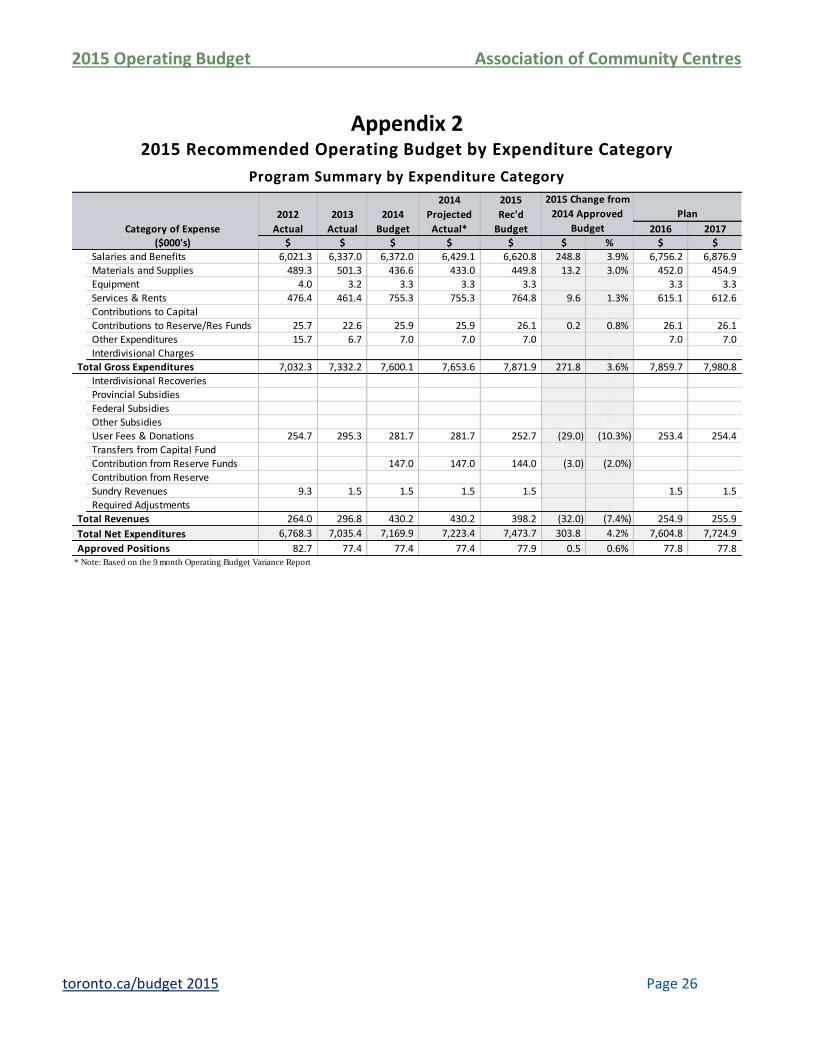
Appendix 2 2015 Recommended Operating Budget by Expenditure Category
Program Summary by Expenditure Category
2014 2015
2012 2013 2014 Projected Rec'd
Category of Expense Actual Actual Budget Actual* Budget 2016 2017($000's) $ $ $ $ $ $ % $ $
Salaries and Benefits 6,021.3 6,337.0 6,372.0 6,429.1 6,620.8 248.8 3.9% 6,756.2 6,876.9 Materials and Supplies 489.3 501.3 436.6 433.0 449.8 13.2 3.0% 452.0 454.9 Equipment 4.0 3.2 3.3 3.3 3.3 3.3 3.3 Services & Rents 476.4 461.4 755.3 755.3 764.8 9.6 1.3% 615.1 612.6 Contributions to Capital - Contributions to Reserve/Res Funds 25.7 22.6 25.9 25.9 26.1 0.2 0.8% 26.1 26.1 Other Expenditures 15.7 6.7 7.0 7.0 7.0 7.0 7.0 Interdivisional Charges -
Total Gross Expenditures 7,032.3 7,332.2 7,600.1 7,653.6 7,871.9 271.8 3.6% 7,859.7 7,980.8
Interdivisional Recoveries - Provincial Subsidies - Federal Subsidies - Other Subsidies - User Fees & Donations 254.7 295.3 281.7 281.7 252.7 (29.0) (10.3%) 253.4 254.4 Transfers from Capital Fund - Contribution from Reserve Funds 147.0 147.0 144.0 (3.0) (2.0%) Contribution from Reserve - Sundry Revenues 9.3 1.5 1.5 1.5 1.5 1.5 1.5
Required Adjustments - Total Revenues 264.0 296.8 430.2 430.2 398.2 (32.0) (7.4%) 254.9 255.9
Total Net Expenditures 6,768.3 7,035.4 7,169.9 7,223.4 7,473.7 303.8 4.2% 7,604.8 7,724.9
Approved Positions 82.7 77.4 77.4 77.4 77.9 0.5 0.6% 77.8 77.8 * Note: Based on the 9 month Operating Budget Variance Report
2015 Change from
2014 Approved
Budget
Plan
2015 Operating Budget Association of Community Centres
toronto.ca/budget 2015 Page 27
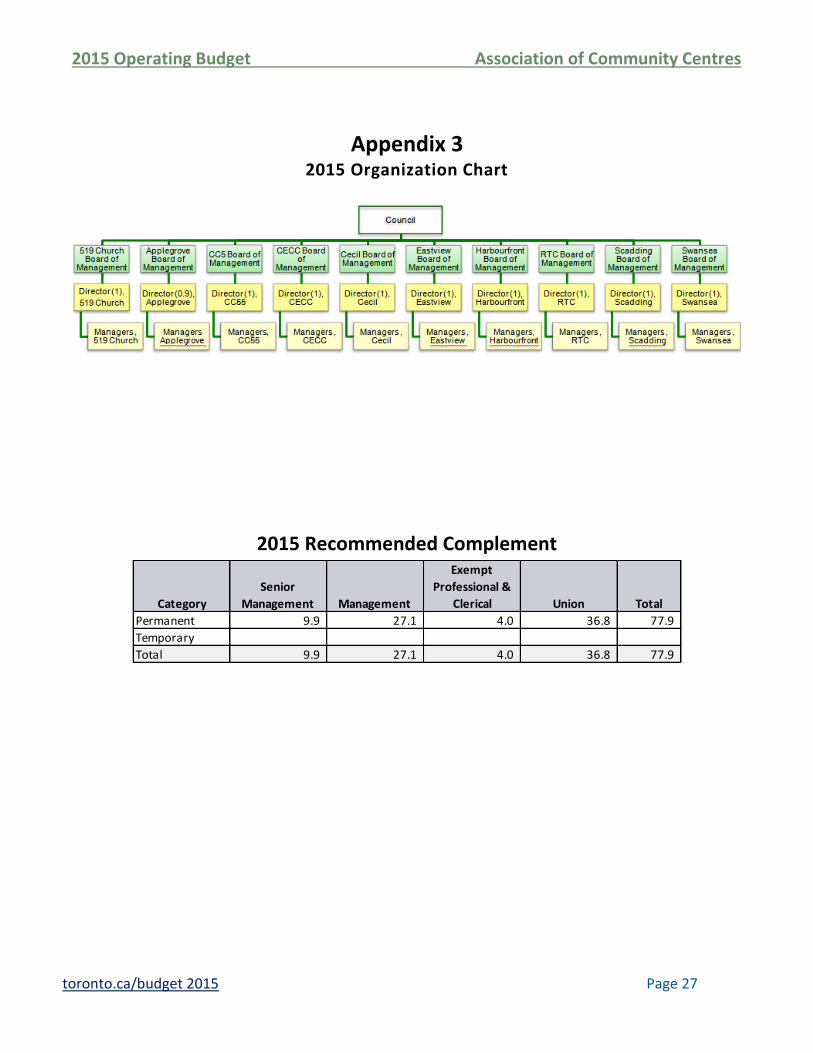
Appendix 3 2015 Organization Chart
2015 Recommended Complement
Category
Senior
Management Management
Exempt
Professional &
Clerical Union Total
Permanent 9.9 27.1 4.0 36.8 77.9
Temporary
Total 9.9 27.1 4.0 36.8 77.9
2015 Operating Budget Association of Community Centres
toronto.ca/budget 2015 Page 28
Appendix 6 Inflows/Outflows to/from Reserves & Reserve Funds
Table 7
Corporate Reserve / Reserve Funds
2015 2016 2017
$ $ $ $
Projected Beginning Balance 21,307.7 21,307.7 21,333.7 21,359.8
Insurance Reserve Fund XR1010
Proposed Withdrawls (-)
Contributions (+) 26.1 26.1 26.1
21,307.7 21,333.7 21,359.8 21,385.8
Other Program / Agency Net Withdrawals & Contributions
Balance at Year-End 21,307.7 21,333.7 21,359.8 21,385.8
2015 2016 2017
$ $ $ $
Projected Beginning Balance 5,566.8 5,566.8 5,422.8 5,422.8
Major Special Events XR1218
Proposed Withdrawls (-) (144.0)
Contributions (+)
5,566.8 5,422.8 5,422.8 5,422.8
Other Program / Agency Net Withdrawals & Contributions
Balance at Year-End 5,566.8 5,422.8 5,422.8 5,422.8
Reserve /
Reserve Fund
Number
Projected
Balance as of
Dec. 31, 2014
Rec'd Withdrawals (-) / Contributions (+)
Reserve / Reserve Fund Name ($000s)
Total Reserve / Reserve Fund Draws / Contributions
Reserve /
Reserve Fund
Number
Projected
Balance as of
Dec. 31, 2014
Rec'd Withdrawals (-) / Contributions (+)
Reserve / Reserve Fund Name ($000s)
Total Reserve / Reserve Fund Draws / Contributions
2015 Operating Budget Association of Community Centres
toronto.ca/budget 2015 Page 29
Appendix 7a Recommended User Fees Adjusted for Market and Other
2014 2016 2017
Approved
Rate
Inflationary
Adjusted
Rate
Other
Adjustment
Budget
Rate
Plan
Rate
Plan
Rate
Rousseau Room - Community No Charge Swansea Town Hall Market Based No Charge $0.00 $0.00 $0.00 $0.00 $0.00 $0.00
Rousseau Room - Community Rate Swansea Town Hall Market Based Per Hour $27.65 $28.23 $0.27 $28.50 $29.25 $29.97
Rousseau Room - Course, Program, Non- Profit Rate Swansea Town Hall Market Based Per Hour $38.85 $41.57 $0.03 $41.60 $44.50 $46.00
Rousseau Room - Individual Swansea Town Hall Market Based Per Hour $45.05 $45.50 $0.00 $45.50 $46.00 $46.00
Rousseau Room - Event Rate Swansea Town Hall Market Based Per Event $450.00 $459.00 $1.00 $460.00 $470.00 $480.00
Council Chamber - Community No Charge Swansea Town Hall Market Based No Charge $0.00 $0.00 $0.00 $0.00 $0.00 $0.00
Council Chamber - Community Rate Swansea Town Hall Market Based Per Hour $18.35 $21.28 $0.02 $21.30 $21.85 $22.40
Council Chamber - Course, Program, Non- Profit Rate Swansea Town Hall Market Based Per Hour $25.45 $31.05 $0.00 $31.05 $33.25 $34.58
Council Chamber - Individual Swansea Town Hall Market Based Per Hour $31.50 $34.02 -$0.02 $34.00 $34.35 $34.67
Council Chamber - Event Rate Swansea Town Hall Market Based Per Event $378.00 $389.34 $0.66 $390.00 $400.00 $412.00
Room Rate "E" Teiaiagon - Community No Charge Swansea Town Hall Market Based No Charge $0.00 $0.00 $0.00 $0.00 $0.00 $0.00
Room Rate "E" Teiaiagon - Community Rate Swansea Town Hall Market Based Per Hour $16.10 $16.43 $0.02 $16.45 $16.85 $17.26
Room Rate "E" Teiaiagon - Course, Program, Non- Profit
Rate Swansea Town Hall Market Based Per Hour $22.05 $23.59 $0.01 $23.60 $25.25 $27.04
Room Rate "E" Teiaiagon -Individual Swansea Town Hall Market Based Per Hour $25.00 $25.25 $0.00 $25.25 $25.50 $25.74
Room Rate "E" Vil lage Rooms - Community No Charge Swansea Town Hall Market Based No Charge $0.00 $0.00 $0.00 $0.00 $0.00 $0.00
Room Rate "E" Vil lage Rooms - Community Rate Swansea Town Hall Market Based Per Hour $16.10 $16.43 $0.02 $16.45 $16.85 $17.26
Room Rate "E" Village Rooms - Course, Program, Non-
Profit Rate Swansea Town Hall Market Based Per Hour $22.05 $23.59 $0.01 $23.60 $25.25 $27.04
Room Rate "E" Vil lage Rooms - Individual Swansea Town Hall Market Based Per Hour $25.00 $25.25 $0.00 $25.25 $25.50 $25.74
Room Rate "E" Founders - Community No Charge Swansea Town Hall Market Based No Charge $0.00 $0.00 $0.00 $0.00 $0.00 $0.00
Room Rate "E" Founders - Community Rate Swansea Town Hall Market Based Per Hour $16.10 $16.43 $0.02 $16.45 $16.85 $17.26
Room Rate "E" Founders - Course, Program, Non- Profit
Rate Swansea Town Hall Market Based Per Hour $22.05 $23.59 $0.01 $23.60 $25.25 $27.04
Room Rate "E" Founders - Individual Swansea Town Hall Market Based Per Hour $25.00 $25.25 $0.00 $25.25 $25.50 $25.74
Room Rate "F" Gemmell Rooms - Community No Charge Swansea Town Hall Market Based No Charge $0.00 $0.00 $0.00 $0.00 $0.00 $0.00
Room Rate "F" Gemmell Rooms - Community Rate Swansea Town Hall Market Based Per Hour $13.80 $14.09 $0.01 $14.10 $14.45 $14.83
Room Rate "F" Gemmell Rooms- Course, Program, Non-
Profit Rate Swansea Town Hall Market Based Per Hour $18.90 $20.22 $0.03 $20.25 $21.70 $23.21
Room Rate "F" Gemmell Rooms - Individual Swansea Town Hall Market Based Per Hour $21.50 $21.72 -$0.02 $21.70 $21.90 $22.10
Room Rate "F" Harvey Rooms - Community No Charge Swansea Town Hall Market Based No Charge $0.00 $0.00 $0.00 $0.00 $0.00 $0.00
Room Rate "F" Harvey Rooms - Community Rate Swansea Town Hall Market Based Per Hour $13.80 $14.09 $0.01 $14.10 $14.45 $14.83
Room Rate "F" Harvey Rooms- Course, Program, Non-
Profit Rate Swansea Town Hall Market Based Per Hour $18.90 $20.22 $0.03 $20.25 $21.70 $23.21
Room Rate "F" Harvey Rooms - Individual Swansea Town Hall Market Based Per Hour $21.50 $21.72 -$0.02 $21.70 $21.90 $22.10
Hague Room - Community No Charge Swansea Town Hall Market Based No Charge $0.00 $0.00 $0.00 $0.00 $0.00 $0.00
Hague Room - Community Rate Swansea Town Hall Market Based Per Hour $10.60 $10.82 $0.03 $10.85 $11.10 $11.36
Hague Room - Course, Program, Non- Profit Rate Swansea Town Hall Market Based Per Hour $15.50 $16.58 $0.02 $16.60 $17.20 $17.92
Hague Room - Individual Swansea Town Hall Market Based Per Hour $16.85 $17.02 -$0.02 $17.00 $17.20 $17.35
Kitchen Swansea Town Hall Market Based Per Use $35.75 $36.82 $0.08 $36.90 $38.00 $39.15
LCD Projector Swansea Town Hall Market Based Per Use $59.60 $60.79 -$0.09 $60.70 $61.90 $63.15
Lobby Swansea Town Hall Market Based Per Hour $14.70 $15.14 $0.01 $15.15 $15.60 $16.09
Mail Box Swansea Town Hall Market Based Per Month $8.45 $8.79 $0.01 $8.80 $9.15 $9.53
Storage Locker Swansea Town Hall Market Based Per Month $17.70 $18.23 $0.02 $18.25 $18.80 $19.36
After Hours Full Recoverable Swansea Town Hall Market Based Per Hour $30.00 $30.90 $0.00 $30.90 $31.80 $32.79
After Hours Split Recoverable Swansea Town Hall Market Based Per Hour $15.00 $15.45 $0.00 $15.45 $15.90 $16.38
2015
Rate Description Service Fee Category Fee Basis