Openreach response to questions in Ofcom’s consultation ...
15
Openreach response to questions in Ofcom’s consultation document “Fixed access market reviews: Approach to setting LLU and WLR Charge Controls” Annex A - Volumes 30 September 2013 NON-CONFIDENTIAL VERSION Comments on this response should be sent to: Kathryn Elliott, Openreach Regulatory Affairs, via email at [email protected]
Transcript of Openreach response to questions in Ofcom’s consultation ...
Openreach response to questions in Ofcom’s
consultation document
“Fixed access market reviews: Approach to setting LLU and WLR Charge Controls”
Annex A - Volumes
30 September 2013
NON-CONFIDENTIAL VERSION
Comments on this response should be sent to:
Kathryn Elliott, Openreach Regulatory Affairs, via email at [email protected]

Openreach response to Ofcom’s LLU and WLR charge control consultation Annex A – non-confidential version 2
1 Introduction
1. Volumes forecasting plays a key role in setting these Charge Controls. This is because marginal costs rise less than average costs, so that higher volumes imply lower charges for regulated services. The consequence of this is that if the volume forecast is too high (‘too optimistic’) BT will not be able to recover fully its efficiently incurred costs under the Charge Controls.
2. BT agrees with the factors which Ofcom report drive fixed line volume changes over the period to 31 March 2017, these being:
the change in the number of mobile only households;
the growth in the number of UK households;
the decline in the number of business lines;
competition from cable; and
the roll-out of fibre-based access networks (NGA)1.
3. Ofcom uses the financial year 2011/12 as the base year for its volume forecasts, effectively forecasting from 1 April 2012 to 31 March 2017 (the “Forecast Period”). Ofcom forecasts that the total number of Openreach lines will grow by 0.67m over the Forecast Period, from 24.36m lines in 2011/12 to 25.03m lines in 2016/17. This total comprises a reduction of 0.18million in business lines
2 which is more than offset by Ofcom’s view of residential lines which are forecast to grow by
0.84million3.
4. BT disagrees with Ofcom’s forecast of the growth of fixed line volumes over the Forecast Period. It is too high and results in forecast unit costs and proposed prices in 2016/17 which are too low. This is the result of incorrect assumptions made by Ofcom in respect of (i) the change in the number of mobile only households and (ii) the growth in the number of UK households:
The change in the number of mobile only households: Ofcom’s assumption that the proportion of mobile only homes will remain flat at 15% of the total number of households is incorrect as:
o Ofcom has dismissed the potential impact of the LTE launch in the UK even though international evidence shows a material increase in the growth of mobile only homes where LTE has been launched;
o BT commissioned market research conducted by Sweeney Pinedo, shows that between 3% and 10% of people sampled were likely to consider taking up a mobile broadband service for in-home use and substitute their fixed broadband connection;
o this assumption runs counter to trended forecasts of 21-24% mobile only households in the medium term.
BT considers that Ofcom should assume an increase of 3% in mobile only homes over the Forecast Period in its base case (increasing from 15% in 2011/12 to 18% by 2016/17). This equates to c.750,000 Openreach customers
4 taking LTE as a
substitute for their fixed lines by 2016/17.
1 Consultation, paragraph A8.13
2 That is, lines supplied to businesses.
3 Consultation, Annex 9
4 3% of all households times 90% for assumed Openreach fixed lines market share.
Openreach response to Ofcom’s LLU and WLR charge control consultation Annex A – non-confidential version 3
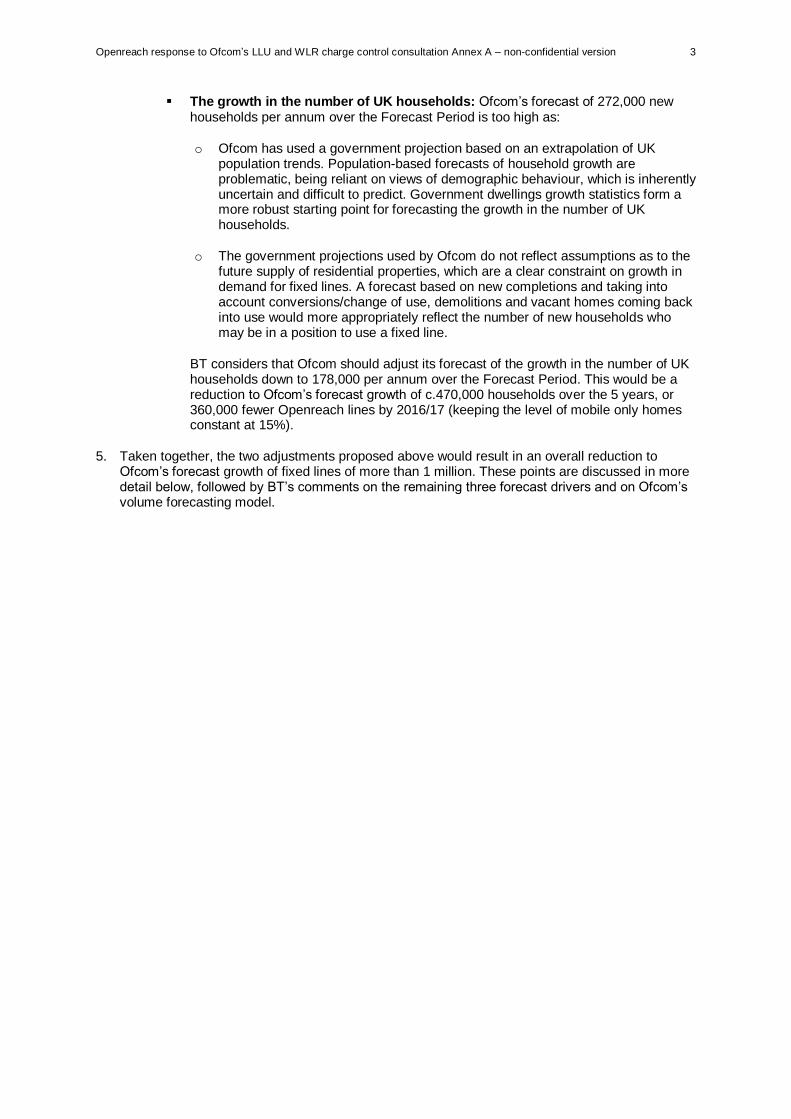
The growth in the number of UK households: Ofcom’s forecast of 272,000 new households per annum over the Forecast Period is too high as:
o Ofcom has used a government projection based on an extrapolation of UK population trends. Population-based forecasts of household growth are problematic, being reliant on views of demographic behaviour, which is inherently uncertain and difficult to predict. Government dwellings growth statistics form a more robust starting point for forecasting the growth in the number of UK households.
o The government projections used by Ofcom do not reflect assumptions as to the future supply of residential properties, which are a clear constraint on growth in demand for fixed lines. A forecast based on new completions and taking into account conversions/change of use, demolitions and vacant homes coming back into use would more appropriately reflect the number of new households who may be in a position to use a fixed line.
BT considers that Ofcom should adjust its forecast of the growth in the number of UK households down to 178,000 per annum over the Forecast Period. This would be a reduction to Ofcom’s forecast growth of c.470,000 households over the 5 years, or 360,000 fewer Openreach lines by 2016/17 (keeping the level of mobile only homes constant at 15%).
5. Taken together, the two adjustments proposed above would result in an overall reduction to Ofcom’s forecast growth of fixed lines of more than 1 million. These points are discussed in more detail below, followed by BT’s comments on the remaining three forecast drivers and on Ofcom’s volume forecasting model.

Openreach response to Ofcom’s LLU and WLR charge control consultation Annex A – non-confidential version 4
2 Forecast drivers and assumptions
2.1 Change in the number of mobile only households
6. Ofcom notes that the proportion of mobile only households has remained stable in the two most recent years, after increasing significantly prior to that.
Ofcom states that (emphasis added):
“The end to the previous upward trend may be related to falling usage of mobile broadband ‘dongles’ as consumers recognise that at home, mobile broadband is a limited substitute for fixed broadband. We do not expect the introduction of LTE to change this flat trend over the period of the next charge control, as within those time horizons we do not consider LTE is likely to be viewed as a mass market substitute for fixed broadband access. We therefore propose as our base forecast that the proportion of mobile only households will not change.”
5
7. While Ofcom has developed an alternative scenario which sees the longer term growth in mobile
only households resume, leading to an increase of 0.9% in mobile only households by 2016/176,
this is not applied in its volume forecast model.
8. BT does not agree that Ofcom ought to reject the impact of LTE over the Forecast Period. Whilst LTE technology may not become a ‘mass market substitute’ for fixed line services, it has the clear potential to impact fixed line volumes in specific segments of the overall market. An assumption of ‘no impact’ from LTE is the lowest possible bound for its likely impact, and BT sets out below why Ofcom would be wrong simply to adopt this lowest bound.
9. As Plum Consulting explains, LTE is an emerging threat to fixed line suppliers, with the potential to make marginal but material impact on the fixed line base because
7:
The improvement in in-building mobile data coverage from around 85% (informal industry estimates) to 98% (agreed plans and targets) with LTE at 800MHz.
Changes in the voice market with unlimited voice bundled with LTE plans, the shift to HD voice and the shift to VoIP over LTE (VoLTE). This should reduce or remove differences in voice cost and quality as a barrier to adoption of mobile only.
The rapid rise in smartphone ownership currently around 60% in the UK and increasing at a rate of around 10 percentage points per annum
8. This will transform
smartphone data into a near ubiquitous default by 2017, with fixed broadband being perceived by many consumers as the incremental add on (depending on capacity needs at home).
Adoption of devices and price plans that enable shared use of mobile including Mi-Fi
9, smartphone Wi-Fi tethering and shared data plans.
The ability to carry smartphones and tablets from place to place allows large downloads (e.g. content or software updates) to be managed without a home broadband connection, and outside of mobile data caps, via public Wi-Fi or at work.
10. Plum Consulting also describes a global shift to mobile broadband relative to fixed, with Ericsson forecasting 7 billion mobile broadband connections by 2018, but less than 1 billion fixed
5 Consultation, paragraph A8.31
6 Consultation, paragraph A8.32
7 BT Group Response Annex, Plum Consulting, section A.4
8 Regarding tablets, it is estimated that a quarter of the UK population owned a tablet by the end of 2012 and that the number of
tablet users will converge to the same level as the PC audience over the next five years. 9 'MiFi units' or 'MiFi dongles' are wireless devices that enable multiple users to share a single broadband connection. In this
way, this allows wireless access to be shared between mobile internet-enabled devices within range of the signal - for example, tablets, mobile phones, laptops and netbooks.

Openreach response to Ofcom’s LLU and WLR charge control consultation Annex A – non-confidential version 5
broadband connections. Application providers such as Google and Facebook are adopting a “mobile first” development strategy, which will lead to improvements to compression and smart connectivity management all of which help mobile offer a closer substitute for fixed access
10.
11. Plum Consulting concludes that:
“The capability of LTE, the evolution of compression and applications to enable lower bandwidth services, early qualitative indications from 4G adopters in the UK, and indications of substitution from international evidence all point to significant potential substitution of mobile for fixed.”
11
12. Evidence also exists from the early market deployments of LTE, particularly in Western Europe, showing the impact it has on fixed line household penetration. Although market conditions will vary between nations, the learning from real world market data provides valuable insight.
13. Market data from those Western European countries where LTE has launched (principally Austria, Denmark, Finland, Germany and Sweden) all show a negative trend for fixed line household penetration since LTE market introduction
12. In particular, in Germany LTE was launched in
December 2010 and by December 2012 LTE connections totalled just under 1.5m. Over the same period fixed line household penetration in Germany dropped by 3% to 77% (decline of 1.5% p.a.), an acceleration on the previous 1% p.a. rate of decline observed between December 2008 and 2010
13.
14. Planned upgrades to LTE network capacity by Vodafone and Deutsche Telekom14
providing headline downstream speeds of up to 150Mbit/s are anticipated to improve the performance of LTE and make it an increasingly viable alternative to fixed broadband connections in Germany.
15. Speed test data on LTE performance in the UK demonstrates that average download speeds between 10Mbit/s and 20Mbit/s are currently being achieved on Everything Everywhere’s (“EE’s”) LTE network
15. Ofcom reports that the average fixed broadband download speed in May 2013
was measured at 14.7Mbit/s16
. This highlights that LTE performance, in terms of downstream and upstream speeds, is already comparable to an average fixed broadband connection.
16. Downstream and upstream speeds are just one aspect of broadband performance and BT acknowledges that EE’s LTE network is currently lightly loaded with subscribers. That said, RootMetrics test data gathered during 2013 proves that downstream and upstream speeds of EE’s LTE network have at least been maintained and in most cases improved as subscriber numbers have increased since the EE network was launched in October 2012. Furthermore, EE and other Mobile Network Operators launching LTE networks have outlined a clear plan to upgrade capacity in future, thus mitigating any degradation in performance.
17. Data allowances and pricing of LTE packages will also have an important influence not only on adoption of LTE but also on the potential for the technology to be seen as a viable alternative to fixed broadband connections. Whilst BT, and similarly Ofcom, cannot predict the future evolution of pricing and packaging, we consider it reasonable to assume that the cost per MB will continue to decrease, making the technology more accessible and compelling.
18. In the absence of any other available relevant data on the possible impact of LTE on fixed line household penetration in the UK, BT commissioned a survey from the research agency Sweeney
10
BT Group Response Annex, Plum Consulting, section A.3 11
BT Group Response Annex, Plum Consulting,, section A.5 12
Analysys Mason, Western European telecoms market: trends and forecasts 2013–2018 13
See footnote 13 above 14
Zdnet, Vodafone increases 4G speeds in Germany to 150Mbps, August 7 2013, available at: http://www.zdnet.com/vodafone-increases-4g-speeds-in-germany-to-150mbps-7000019096/
15 Speed tests performed between November 2012 and September 2013, http://www.rootmetrics.com/uk/compare-operators/
16 Ofcom, UK fixed-line broadband performance, May 2013, page 3, available at: http://stakeholders.ofcom.org.uk/market-data-
research/other/telecoms-research/broadband-speeds/broadband-speeds-may2013/

Openreach response to Ofcom’s LLU and WLR charge control consultation Annex A – non-confidential version 6
Pinedo17
. Using an online and telephone sample of c. 2,500 GB adults (18+) in August 2013, the survey aimed to quantify the likelihood of consumers substituting their fixed voice line in favour of LTE. The consumer decision was analysed under different scenarios, and the drivers behind any such decision were identified.
19. The research found that between 3% and 10% of the total sample was likely to take up a mobile broadband service for in-home use and substitute their fixed broadband connection. Under the scenario where a mobile broadband service can deliver equivalent speed and price to existing fixed broadband connections, 7% of the total sample was likely to take up a mobile broadband service for in-home use and substitute their fixed broadband connection. Even in the scenario where a mobile broadband service delivers an equivalent speed to existing fixed broadband connections but is priced £5 higher per month, 3% of the total sample were likely to take up a mobile broadband service and substitute their fixed broadband connection.
20. Beyond those respondents who indicated that they were likely to adopt a mobile broadband service for in home use, an additional 18% to 26% of the total sample was undecided on their intention to take up mobile broadband in future but had not dismissed the possibility. This not only emphasises the uncertainty surrounding LTE in the market but importantly reveals that a substantial proportion of consumers could subscribe to mobile broadband and substitute their fixed broadband connection as the market matures and real-world performance is apparent.
21. Based on the Plum analysis, Sweeney Pinedo market research and learning from other international markets, there is a clear case for recognising some impact from the introduction of LTE on fixed line growth in the Ofcom forecast. BT considers that Ofcom should assume an increase of 3% in mobile only homes over the Forecast Period in its base case (increasing from 15% in 2011/12 to 18% by 2016/17). This equates to c. 750,000 households taking LTE and deciding there is not sufficient incremental value in also retaining an Openreach fixed line connection by 2016/17.
22. The impact of LTE is also discussed in Annex 1 of BT’s Response to the WBA Market Review, with a particular focus on its likely impact on WBA demand. That Annex further explains why LTE is a realistic option for customers to take instead of a fixed line, in particular that:
substitution can be expected from price sensitive customers seeking to minimise their overall spend on communications;
18
substitution is particularly likely for customers using fixed broadband lines and who are getting much less than 8Mbps and who can get higher speeds from LTE; 19
and that
substitution by LTE could suit customers using broadband lightly (i.e. mostly web-surfing, E-Mails, IM) as LTE plans already offer usage plans that include capacity far in excess of the capacity used by one third of BT’s customers.
20
17
See Annex B 18
BT’s response to Ofcom’s consultation document, “Review of Wholesale Broadband Access Markets”, 25 September 2013, Annex 1, Figure 12
19 BT’s response to Ofcom’s consultation document, “Review of Wholesale Broadband Access Markets”, 25 September 2013,
Annex 1, paragraph 9
20 BT’s response to Ofcom’s consultation document, “Review of Wholesale Broadband Access Markets”, 25 September 2013,
Annex 1, paragraph 20

Openreach response to Ofcom’s LLU and WLR charge control consultation Annex A – non-confidential version 7
23. Figure A.1 below shows the Ofcom base case forecast against other projections. This shows that BT’s proposal of a 3% increase in mobile only households over the Forecast Period (taking this to 18%) falls well below trended forecasts based on either the four years to 2010/11, or the six years to 2012/13. Ofcom’s “base case” assumption of no increase in mobile only households is notable in that it is clearly less consistent with medium term trends.
Figure A.1, % of Mobile only households (2006/07 – 2016/17)
24%
15%
21%
15%
18%
8%
11%
14%
17%
20%
23%
26%
06/07 07/08 08/09 09/10 10/11 11/12 12/13 13/14 14/15 15/16 16/17
Mo
bile
on
ly h
ou
seh
old
s
Mobile only householdsMobile only households (Ofcom CMR) Extrapolated Trend 06/07 - 10/11
Extrapolated Trend 06/07 - 12/13 Ofcom Base Case Forecast
BT Recommended Forecast

Openreach response to Ofcom’s LLU and WLR charge control consultation Annex A – non-confidential version 8
2.2 Growth in the number of UK households
24. Ofcom reports that the Department for Communities and Local Government (“DCLG”) statistics it uses to forecast the growth in the number of UK households show that the number of UK households will increase by 1.4 million households over the Forecast Period (from 26.5 million households in 2011/12 to 27.9 million in 2016/17)
21. This represents an average annual increase
of 272,000 per annum22
or a Compound Annual Growth Rate (CAGR) of 1.0%.
25. BT considers that Ofcom’s assumption is too high and that the number of UK households (and hence the size of the addressable market for fixed line providers) should increase by an annual average of 178,000 p.a. rather than 272,000 p.a. Over 5 years, Ofcom has therefore overestimated the number of UK households by c. 470,000. This in turn reduces the projected increase in total Openreach lines by 360,000
23.
26. The DCLG household projections used by Ofcom are based on an extrapolation of UK population trends. As explained below, population-based forecasts of household growth are problematic, being reliant on views of demographic behaviour, which is inherently uncertain and difficult to predict. Separately, population trends do not reflect assumptions as to the future supply of residential properties, which are a clear constraint on growth in demand for fixed lines.
2.2.1 Population-based forecasts
27. As indicated above, the source on which Ofcom relies in the consultation is based on population-based forecasts of household growth. As the DCLG explain (emphasis added):
“The household projections are produced by applying projected household representative rates [equivalent to people per household] to the population projections published by the Office for National Statistics. Projected household representative rates are based on trends observed in Census and Labour Force Survey data. The assumptions underlying national household and population projections are demographic trend based. They are not forecasts as they do not attempt to predict the impact that future government policies, changing economic circumstances or other factors might have on demographic behaviour.”
24
28. Forecasting “households” is clearly a difficult task, depending on such factors as net migration and changes in average household size. In an article entitled “How can a graph be so very wrong?”
25 it is explained that
“Total population change in a country comprises three elements: migration, lifespan and fertility. In no case have people done what they were meant to….[so] It's hardly surprising that the UK projections for all three elements have repeatedly failed to hit a barn door.”
29. The article also quotes the ONS:
“Demographic behaviour is inherently uncertain…[t]he number of children we have, how long we live and the number of people who migrate from one country to another are variables that have changed continually in the past and will continue to do so in the future. Even if we understood perfectly the factors that have brought about past changes (which we clearly do not), our ability to predict the demographic future would inevitably remain limited."
30. A particular uncertainty exists around projected net migration rates. Here the forecasts are already too high. The numbers on which Ofcom relies, use a forecast for net migration of 233,000
21
Consultation, paragraph A8.35 22
Allowing for roundings. 23
470,000 times 85% times 90% = 360k fewer Openreach lines. The 85% assumes the level of mobile only homes remains
constant at 15%. The 90% reflects the assumed Openreach share of fixed lined households. 24
DCLG, Household Interim Projections, 2011 to 2021, England, 9 April 2013, available at:
https://www.gov.uk/government/uploads/system/uploads/attachment_data/file/190229/Stats_Release_2011FINALDRAFTv3.pdf 25
BBC Magazine, How can a graph be so very wrong?, 20 April 2009, available at: http://news.bbc.co.uk/1/hi/8000402.stm

Openreach response to Ofcom’s LLU and WLR charge control consultation Annex A – non-confidential version 9
in 2012/13, whereas the actual number in the year to September 2012 was 176,000.26
For the next four years, the ONS project an annual average for net migration of 213,000, whilst government policy is for the figure to drop below 100,000 by 2015. Even if September 2012 rates are maintained, this means that the population forecast will be 200,000 too high.
2.2.2 Household projections are unconstrained by supply considerations
31. Not only is demographic behaviour uncertain, but the household projections are not constrained by the availability of dwellings (i.e. residential properties), and are therefore essentially projections of what might occur in an unconstrained world
27. A clear issue for Ofcom to consider, then, is
whether any such constraint applies.
32. The nature of the available statistics and the appropriate measure for forecasting household growth (and thus estimating the growth in demand for fixed lines) was considered by the Competition Commission in the appeal of the current WLR/LLU charge control
28. In its
determination, the Competition Commission distinguished between household growth and dwellings growth statistics, highlighting the need for the statistic used to take into account issues around the future supply of residential properties such as conversions and empty dwellings coming back into use
29. BT has been careful to address these concerns in its analysis below,
ensuring that the data advanced does include conversions, as well as dwellings which arise from a change of use. BT has also included an allowance for vacant homes being brought back into the used housing stock and taken account of homes removed from the housing stock due to demolitions.
Households and dwellings statistics
33. We discuss below the important distinction between government forecasts of ‘households’ and ‘dwellings’. In choosing between the use of household or dwelling statistics, the key consideration is which of the alternatives is most likely to provide a guide to the change in the size of the addressable market for fixed line services.
34. A home or dwelling in government statics is defined as:
“a self-contained unit of accommodation. Self-containment is where all the rooms (including kitchen, bathroom and toilet) in a household's accommodation are behind a single door which only that household can use. Non-self-contained household spaces at the same address should be counted together as a single dwelling.”
30
35. This definition has a direct and unambiguous correspondence to the demand for fixed lines – a line is only normally provided where it can be located, “behind a single door which only that household can use.”
36. BT accepts that there will be a broad similarity between the number of households and dwellings. Put simply, most households have a home, and in the long term households and dwellings will move in broad correlation if we assume that new households will not form if there exists no self-contained unit of accommodation for them to occupy. However, over shorter periods there can be significant divergences.
26
BBC News, Net migration to UK increases - Office for National Statistics, 29 August 2013, available at: http://www.bbc.co.uk/news/uk-23878689
27 BT has confirmed that this is the position directly with statisticians at the DCLG
28 British Telecommunications Plc v Office of Communications Case1193/3/3/12, British Sky Broadcasting Limited and TalkTalk
Telecom Group Plc v Office of Communications Case1192/3/3/12, Competition Commission Determinations, 27 March 2013, paragraph 14.112.
29 British Telecommunications Plc v Office of Communications Case1193/3/3/12, British Sky Broadcasting Limited and TalkTalk
Telecom Group Plc v Office of Communications Case1192/3/3/12, Competition Commission Determinations, 27 March 2013, paragraph 14.61 (b).
30 DCLG, Net supply of housing, 2011-12, England, Definitions, 1 November 2012, available at:
https://www.gov.uk/government/uploads/system/uploads/attachment_data/file/15273/2246985.pdf

Openreach response to Ofcom’s LLU and WLR charge control consultation Annex A – non-confidential version 10
37. Evidence of this can be seen in Table A.1 below, where the household increases in the Ofcom model are shown to be between 40% to 60% higher than those for dwellings as reported by the DCLG.
Table A.1 - Increases in dwellings and households in the UK, 000s
FY 2010/11 or 2010 FY 2011/12 or 2011
Ofcom’s model (Financial Year)* households 254 257
DCLG Live Table 101 (Calendar Year) dwellings ** 183 165
Percentage difference, Ofcom on DCLG 38.8% 55.8%
*Extracted from Ofcom Volumes model ** DCLG Live Tables, 21 May 2013, available at: https://www.gov.uk/government/statistical-data-sets/live-tables-on-
dwelling-stock-including-vacants
Future supply constraints
38. The supply of residential properties is likely to be a constraining factor on the growth in demand for fixed lines and this constraint is reflected in dwellings statistics but not in new households data. That there is a gap between the demand for housing and its availability is widely known. In a report published on 19 July 2013, the National Housing Federation said that Britain was building less than half the number of homes needed to keep up with demand from new households.
31
39. It is certainly the case that unless households can form in permanent new homes or dwellings (whether these are new build or conversions) they will not be in a position to acquire new fixed lines. This issue can be framed in terms of another of Ofcom’s assumptions – that, ‘new households have the same propensity to use an Openreach line as existing households.’
32 We do
not consider that this assumption is justified if the DCLG household projections are used, as this will only be the case where they are able to form in new homes or dwellings.
40. Accordingly, Ofcom’s forecast of 272,000 new households per annum will over-estimate growth in demand for fixed lines. This is corroborated by independent and objective data, with the most recent Government statistics for the housing supply in England showing an increase of 135,000 net additional dwellings in 2011-12.
33 If this is increased by 20% to allow for households in Wales,
Scotland and Northern Ireland,34
it gives a figure of 162,000 net additional dwellings for the UK in 2011-12.
41. This is also in line with government data on the number of properties liable to council tax in England, which showed an increase of 140,000 p.a. on average between 2008 and 2012
35. (The
CAGR of properties liable to council tax in England is around 0.6%, compared to Ofcom’s projection of a 1% CAGR.) In terms of the UK, this suggests an annual increase of around 168,000
36.
42. While the Competition Commission criticised dwellings growth statistics for not including conversions (see paragraph 32 above), this net additional dwellings figure does include additional
31
National Housing Federation, Housing Britain’s Future: Some home truths, 19 July 2013 available at:
http://www.housing.org.uk/publications/browse/housing-britains-future-some-home-truths 32
Consultation, Annex 8, footnote 94 33
See footnote 30 above 34
According to the ONS, in the 2011 Census there were 22.1 million households in England, 2.4 million households in Scotland, 1.3 million in Wales and 0.7 million in Northern Ireland. We have therefore increased numbers for England by
(22.1+2.4+1.3+0.7)/22.1 = 119.9percent. The Census is available at, (21 March 2013): http://www.ons.gov.uk/ons/rel/census/2011-census/population-estimates-by-five-year-age-bands--and-household-estimates--for-local-authorities-in-the-united-kingdom/stb-population-and-household-estimates-for-the-united-kingdom-march-2011.html
35 DCLG, Local Authority Council Tax Base -2012 England, Table 1, 20 November 2012, available at:
https://www.gov.uk/government/uploads/system/uploads/attachment_data/file/14811/Web_2012_Council_Tax_Base_Nov_2012.pdf
36 See footnote 34 above

Openreach response to Ofcom’s LLU and WLR charge control consultation Annex A – non-confidential version 11
homes resulting from conversions and from change of use. It also includes caravans, mobile homes, converted railway carriages and houseboats if they are the occupant’s main residence.
43. Other potential sources of housing supply or constraints are considered below.
Vacant Housing: BT accepts that the re-introduction of vacant housing into the used stock of housing is a further source of housing for new households, and that this should be added to the net additional dwellings figure above.
Homes are left vacant for many reasons – they may have fallen into disrepair and their owners do not wish or cannot refurbish them; they may be inherited and eventually sold; they may be newly-built homes that have yet to be sold (and included in the completions data anyway); whilst some homes previously provided staff accommodation but are not longer needed
37. Many homes are also vacant between
occupiers, such as temporarily empty rented flats between leaseholders, and houses/flats in the process of being bought and sold.
In terms of impacting the housing supply, the starting point would be the extent of long-term empty housing, which is defined as housing that has been empty for six months or more. There are estimated to be about 330,000 such homes in the UK
38.
From there, one must consider the rate at which this long term empty housing is coming back into use. Data on homes coming back into use is available from the Council Tax records. The DCLG reported that there was a reduction of 20,000, or 7%, in the total number of long term empty dwellings between 2011 and 2012
39, and an
average (17,000) for the last four years (2008-2012). Scaling the 20,000 up for the UK, this would allow for 24,000 such homes per annum. This latter allowance is a very appreciable number, representing a reduction in long-term empty homes over the period 2011/12 to 2016/17 of over one third of the total.
Demolitions: In addition to vacant housing coming back into use and therefore the housing supply, BT considers that one must also take into account those properties removed from the housing supply due to demolition. This accounted for 12,200 properties in 2011/12
40.
Communal Housing: The only further source of housing of which BT is aware is Communal Housing defined as: “establishments providing managed residential accommodation…. These cover university and college student, hospital staff accommodation, hostels/homes, hotels/holiday complexes and defence establishments (not married quarters).”
41
Growth here seems overwhelmingly to be in student halls of residence, which accounted for 98% of the increase in Communal Housing 2011/12.
42 There is an
obvious reason for Ofcom to exclude such dwellings, as students do not tend to rent individual fixed lines in such circumstances and the Ofcom assumption referred to in footnote 94 of Annex 8 to the Consultation is clearly invalid.
44. Accordingly, BT considers that the correct view of UK ‘household growth’ in 2011/12 is c. 174,000. This is made up of 162,000 net additional dwellings plus a further 24,000 empty dwellings coming back into use, less 12,200 properties demolished. This compares with the 257,000 household growth in 2011-12 assumed by Ofcom, which is over 40% higher.
37
Empty Homes, Empty Homes Statistics 2011/12, November 2012, available at: http://www.emptyhomes.com/statistics-
2/empty-homes-statistice-201112/ 38
See footnote 37 above 39
By way of comparison, there was a net reduction of 68,000, or 21%, in the total number of long term empty dwellings between 2008 and 2012, i.e. 17,000 per year.
40 See footnote 30 above
41 See footnote 40 above
42 See footnote 40 above
Openreach response to Ofcom’s LLU and WLR charge control consultation Annex A – non-confidential version 12
Forecast period and extent of likely upturn
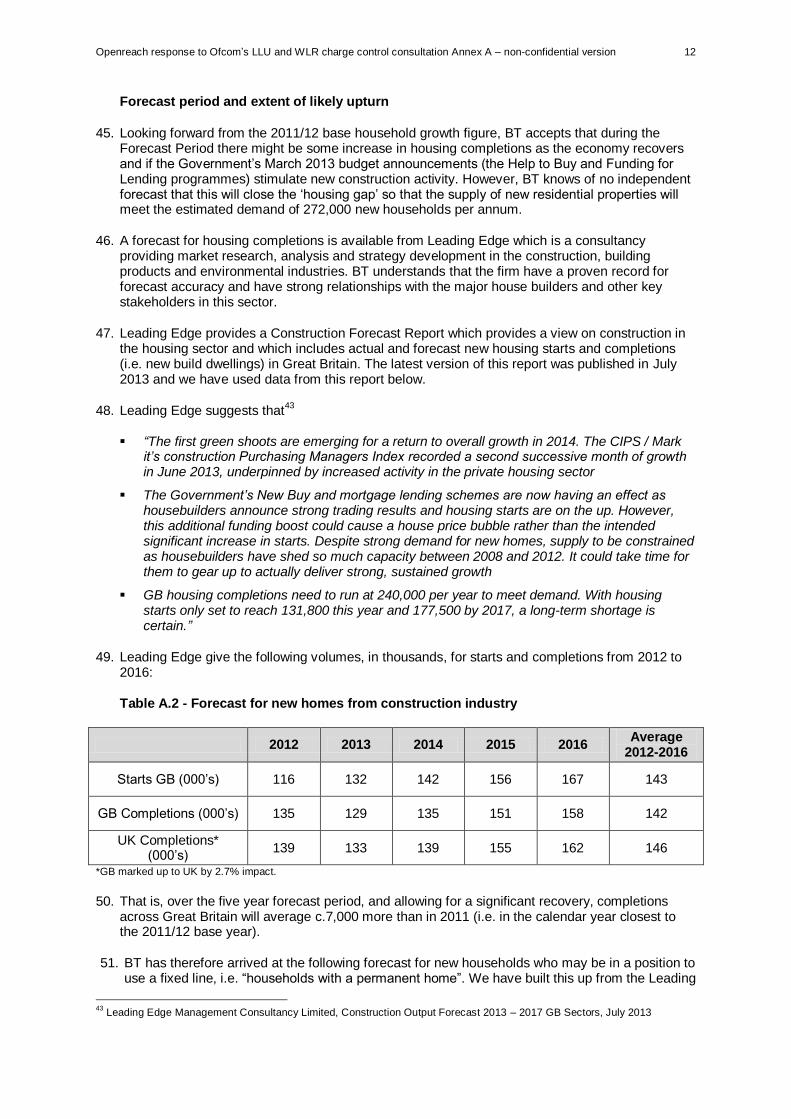
45. Looking forward from the 2011/12 base household growth figure, BT accepts that during the Forecast Period there might be some increase in housing completions as the economy recovers and if the Government’s March 2013 budget announcements (the Help to Buy and Funding for Lending programmes) stimulate new construction activity. However, BT knows of no independent forecast that this will close the ‘housing gap’ so that the supply of new residential properties will meet the estimated demand of 272,000 new households per annum.
46. A forecast for housing completions is available from Leading Edge which is a consultancy providing market research, analysis and strategy development in the construction, building products and environmental industries. BT understands that the firm have a proven record for forecast accuracy and have strong relationships with the major house builders and other key stakeholders in this sector.
47. Leading Edge provides a Construction Forecast Report which provides a view on construction in the housing sector and which includes actual and forecast new housing starts and completions (i.e. new build dwellings) in Great Britain. The latest version of this report was published in July 2013 and we have used data from this report below.
48. Leading Edge suggests that43
“The first green shoots are emerging for a return to overall growth in 2014. The CIPS / Mark it’s construction Purchasing Managers Index recorded a second successive month of growth in June 2013, underpinned by increased activity in the private housing sector
The Government’s New Buy and mortgage lending schemes are now having an effect as housebuilders announce strong trading results and housing starts are on the up. However, this additional funding boost could cause a house price bubble rather than the intended significant increase in starts. Despite strong demand for new homes, supply to be constrained as housebuilders have shed so much capacity between 2008 and 2012. It could take time for them to gear up to actually deliver strong, sustained growth
GB housing completions need to run at 240,000 per year to meet demand. With housing starts only set to reach 131,800 this year and 177,500 by 2017, a long-term shortage is certain.”
49. Leading Edge give the following volumes, in thousands, for starts and completions from 2012 to 2016:
Table A.2 - Forecast for new homes from construction industry
2012 2013 2014 2015 2016 Average
2012-2016
Starts GB (000’s) 116 132 142 156 167 143
GB Completions (000’s) 135 129 135 151 158 142
UK Completions* (000’s)
139 133 139 155 162 146
*GB marked up to UK by 2.7% impact.
50. That is, over the five year forecast period, and allowing for a significant recovery, completions across Great Britain will average c.7,000 more than in 2011 (i.e. in the calendar year closest to the 2011/12 base year).
51. BT has therefore arrived at the following forecast for new households who may be in a position to use a fixed line, i.e. “households with a permanent home”. We have built this up from the Leading
43
Leading Edge Management Consultancy Limited, Construction Output Forecast 2013 – 2017 GB Sectors, July 2013

Openreach response to Ofcom’s LLU and WLR charge control consultation Annex A – non-confidential version 13
Edge forecast for new completions; plus an addition for conversions and change of use less demolitions; plus an allowance for vacant homes.
Table A.3 – BT forecast for increase in size of addressable market for fixed lines, UK
2012/13 2013/14 2014/15 2015/16 2016/17 Average 2012/13
to 2016/17
New build* 139 133 139 155 162 146
Conversions / change of use less demolitions**
8 8 8 9 9 8
Vacant properties*** 24 24 24 24 24 24
Total 171 165 171 188 195 182
*Source: Leading Edge (July 2013), actual and forecast volume of new build housing completions, GB marked-up to UK by 2.7% impact.; See Row 3 of Table A.2 above. ** Source: DCLG, Net supply of housing: 2011-12, England, Table 2; moved in line with New Build trend, times 1.2 for England
to UK conversion.
*** Source: As explained in paragraph 42 of this Annex.
52. BT appreciates that, as Ofcom has explained in 2012, it is “very difficult to predict household growth”
and that,
‘There are many reasons why a forecast is likely to diverge from outturn figures, particularly when market developments cannot be foreseen, or where there are complex interactions between the different services being modelled.’
44
53. However, BT has set out above a detailed analysis of all the factors it considers relevant to this question, supported by independent and objective data, and as an evidence-based regulator Ofcom should recognise that in its final forecast of fixed lines.
45
Consultation, paragraph A8.7

Openreach response to Ofcom’s LLU and WLR charge control consultation Annex A – non-confidential version 14
2.3 Decline in Number of Business Lines
54. Ofcom estimates that business lines account for about 17% of all BT lines, hence quantitatively are of less importance than residential lines in terms of making up the total. Ofcom’s model forecasts a reduction of 182,000 lines over the 5 years from 2011/12 to 2016/17 (thus averaging 36,000 p.a.), compared to a loss estimated to be 320,000 (107,000 p.a.) in the previous three years.
55. BT appreciates that the economic situation in 2011/12 may be better than that from 2008/9 to 2011/12 and that this may affect the rate of loss of business lines. However, this is a large reduction in the rate of loss of lines, with 7% of all Openreach business lines being lost between the 3 years to 2011/12 but only 4% lost in the five years to 2016/17.
56. Ofcom’s model bases this forecast reduction in the rate of loss of lines on expected movements in GDP. While BT recognises that the consensus view is for GDP growth to return and improve over time, it does not agree that this will impact the rate of loss of business lines to the extent Ofcom assumes.
57. In particular, BT expects increasing pressure on business lines to come from the migration of telephony to VoIP. Despite some lingering concerns amongst businesses regarding VoIP technology
45, particularly regarding the reliability and quality of voice, they are increasingly
engaging with the technology and seeking to capitalise on the cost savings it presents. There are many notable examples of key contract wins that were underpinned by VoIP technology, demonstrating its growing importance
46.
2.4 Competition from cable
58. BT appreciates that the effect of competition from cable is difficult to forecast over the Forecast Period. The period of investment in expansion of the local access ‘cable footprint’ is largely over, and one of the important drivers is now competition between CPs using Openreach’s network and Virgin Media.
59. It is clearly difficult for Ofcom to forecast which CPs will prevail. In these circumstances, BT agrees that it is right to assume that competition from cable does not impact the net number of Openreach provided lines. Historic data on fixed line market share also demonstrates that Virgin Media is not ‘winning’ or ‘losing’ considerably against CPs using Openreach’s network. Any net movement that does occur can be addressed, anyway, in the next control when Ofcom will have updated evidence in terms of the success of different CPs, and thus the underlying access platforms.
2.5 Roll-out of fibre-based access networks (NGA)
60. BT does not consider it necessary to forecast NGA lines under the ‘technology neutral’ approach to cost modelling that Ofcom is adopting. It is also worth noting that NGA lines will be included in the total under Ofcom’s volume forecasting approach, which is based on household growth and not the fixed line technology involved. Similarly, using dwellings instead of households, an issue we discuss in Section D, will also implicitly include demand for FTTP.
45
Telecompaper, UK business managers have poor perception of VoIP – study, 14 June 2012, available at: http://www.telecompaper.com/news/uk-business-managers-have-poor-perception-of-voip-study--879122
46 Virgin Media Business, 2,000 schools across London to tap into Wi-Fi service in latest breakthrough by London Grid for
Learning, 2013, available at: http://www.virginmediabusiness.co.uk/News-and-events/News/News-archives/2013/2000-schools-across-London-to-tap-into-Wi-Fi-service-in-latest-breakthrough-by-London-Grid-for-Learning-/ ;
Telecompaper, NextiraOne delivers VoIP telephony at Birmingham NHS trust, 17 October 2012, available at: http://www.telecompaper.com/news/nextiraone-delivers-voip-telephony-at-birmingham-nhs-trust--902468

Openreach response to Ofcom’s LLU and WLR charge control consultation Annex A – non-confidential version 15
3 Ofcom’s volume forecasting model
61. BT draws to Ofcom’s attention that the Volumes model contains a circularity that needs to be fixed. This problem is explained below by way of an example.
62. Ofcom forecasts the number of MPF and WLR lines using an estimate of BT “lines per household” multiplied by the number of households taking a fixed line. As an approximation, there are 0.9 Openreach lines per household, whilst mobile-only homes are estimated as being 15% of all households. As such, for every 100,000 fewer homes there will be circa:
100,000 times 0.9 times (1-15%) = 76,500 fewer Openreach lines.
63. However, this calculation does not appear to be applied properly in Ofcom’s model. For example, one would expect an annual reduction of 100,000 households to result in 380,000 fewer lines over the 5-year Forecast Period (76,500 annual decrease times 5 years) but Ofcom’s model generates an output of only 160,000 fewer lines over this period.
64. The model’s output is therefore implausible or, put another way, inconsistent with one of Ofcom’s underlying assumptions that, ‘new households have the same propensity to use an Openreach line as existing households.’
47
65. The root of the problem seems to be that forecast data is used to derive historic data in the model. Specifically, if the forecast of households is changed, then so is the historic estimate of lines per household. Given that the historic trend of lines per household is used as the basis for forecasting the number of lines per household, there is effectively a circularity in the way the model works. The two constituents of the forecast number are not working independently, and in a way that gives plainly erroneous outputs. Ofcom’s volume forecasting model therefore needs correcting to address this circularity.
47
Consultation, Annex 8, footnote 94