Open Session Approval of the Draft Regional Land Transport ... · Regional Transport Committee...
68
Regional Transport Committee Meeting| 01 February 2018 Agenda item no. 4.1 Open Session Approval of the Draft Regional Land Transport Plan 2018-28 Recommendations That the Regional Transport Committee: i. Approve the draft 2018-2028 Auckland Regional Land Transport Plan for public consultation from 28 February to 28 March; ii. Delegate authority to the Sub-Committee of the Regional Transport Committee to approve any changes to the document prior to publication; iii. Note the recommended consultation approach as outlined below, further noting that Auckland Council’s approach to consultation on the 2018-2028 Long-term Plan, under which this sits, is to be approved by the Governing Body at its meeting on 21 February 2018; iv. Nominate at least two members of the Regional Transport Committee to attend and hear feedback at the Transport Stakeholder Events on 7, 9 March and 14 March; and v. Delegate authority to the Chief Executive, the Executive Leadership Team, and any other staff member of Auckland Transport approved by the Chief Financial Officer to receive in-person feedback from the public on behalf of the Regional Transport Committee at local and targeted events led by Auckland Transport and Auckland Council during the consultation period. Executive Summary 1. The Regional Land Transport Plan (RLTP) sets out a ten-year capital and operating programme for transport in Auckland. It covers transport activities delivered by Auckland Transport, the NZ Transport Agency (Transport Agency), Auckland Council and KiwiRail. 2. Since the 2015 RLTP was prepared, Auckland’s population growth has increased at a much faster pace than was envisaged. By 2028, the population of Auckland is expected to be around two million people – four years earlier than projected in 2015. Significant investment in transport infrastructure and services will be required to meet the increasing needs of these additional people both to service new housing required to match growth and to service many more customers. The Auckland Transport Alignment Project (ATAP) study provides a framework for this investment. 3. At the same time technology is changing rapidly and the expectations of customers, from how they are communicated with to how they pay for services and even the role of public transport and road network performance, is evolving at a fast pace. 4. Legislation requires that the RLTP is revised every six years and reviewed after three years. The RLTP is required to be consistent with the Government Policy Statement on Transport (GPS). At its meeting of 24 October 2017 the Auckland Transport Board agreed that the level of change warrants a full review of the RLTP, along with public consultation to take place in conjunction with consultation on Auckland Council’s Draft 2018-2028 Long-term Plan (LTP), between 28 February and 28 March 2018.
Transcript of Open Session Approval of the Draft Regional Land Transport ... · Regional Transport Committee...

Regional Transport Committee Meeting| 01 February 2018 Agenda item no. 4.1
Open Session
Approval of the Draft Regional Land Transport Plan 2018-28
Recommendations
That the Regional Transport Committee:
i. Approve the draft 2018-2028 Auckland Regional Land Transport Plan for public consultation from 28 February to 28 March;
ii. Delegate authority to the Sub-Committee of the Regional Transport Committee to approve any changes to the document prior to publication;
iii. Note the recommended consultation approach as outlined below, further noting that Auckland Council’s approach to consultation on the 2018-2028 Long-term Plan, under which this sits, is to be approved by the Governing Body at its meeting on 21 February 2018;
iv. Nominate at least two members of the Regional Transport Committee to attend and hear feedback at the Transport Stakeholder Events on 7, 9 March and 14 March; and
v. Delegate authority to the Chief Executive, the Executive Leadership Team, and any other staff member of Auckland Transport approved by the Chief Financial Officer to receive in-person feedback from the public on behalf of the Regional Transport Committee at local and targeted events led by Auckland Transport and Auckland Council during the consultation period.
Executive Summary
1. The Regional Land Transport Plan (RLTP) sets out a ten-year capital and operating programme for transport in Auckland. It covers transport activities delivered by Auckland Transport, the NZ Transport Agency (Transport Agency), Auckland Council and KiwiRail.
2. Since the 2015 RLTP was prepared, Auckland’s population growth has increased at a much faster pace than was envisaged. By 2028, the population of Auckland is expected to be around two million people – four years earlier than projected in 2015. Significant investment in transport infrastructure and services will be required to meet the increasing needs of these additional people both to service new housing required to match growth and to service many more customers. The Auckland Transport Alignment Project (ATAP) study provides a framework for this investment.
3. At the same time technology is changing rapidly and the expectations of customers, from how they are communicated with to how they pay for services and even the role of public transport and road network performance, is evolving at a fast pace.
4. Legislation requires that the RLTP is revised every six years and reviewed after three years. The RLTP is required to be consistent with the Government Policy Statement on Transport (GPS). At its meeting of 24 October 2017 the Auckland Transport Board agreed that the level of change warrants a full review of the RLTP, along with public consultation to take place in conjunction with consultation on Auckland Council’s Draft 2018-2028 Long-term Plan (LTP), between 28 February and 28 March 2018.

Regional Transport Committee Meeting| 01 February 2018 Agenda item no. 4.1
Open Session
5. The draft RLTP, appended here as Attachment 1, has been developed in collaboration with the Transport Agency and has been finalised under the direction of the sub-committee of the Regional Transport Committee (RTC) established on 5 December 2017.
6. The draft GPS is currently being reviewed by the Government and a new draft is expected very soon. Any change of focus in the GPS will need to be reflected through into the RLTP, and given the uncertain environment in which consultation is taking place and the potential for changes to be made to the document after public consultation, it is possible that further consultation will be required at some stage.
Previous Deliberations
7. The process for reviewing the RLTP was considered by the AT Board on 24 October 2017.
8. The Regional Transport Committee received an update on the development of the RLTP on 5 December 2017 and resolved to establish a Sub-Committee to oversee its development. The attached draft reflects the views of the Sub-committee.
Strategic Context
9. This RLTP is being taken to public consultation in an environment of significant uncertainty given changes to the Draft Government Policy Statement (GPS) and the further review, currently underway, of the Auckland Transport Alignment Project (ATAP).
10. The RLTP is required be consistent with the GPS. The Government is currently reviewing the GPS and is expected to release a draft for consultation in January 2018, but at the time of writing the updated draft GPS is not yet available. Once the new draft GPS is released, the draft RLTP will be updated to reflect these changes if time permits, noting the tight deadlines to get the draft document edited and published prior to the start of consultation on 28 February 2018.
11. ATAP has led to high level agreement amongst the key stakeholders on the long term strategic approach to the development of Auckland’s transport system and the likely sequencing of major investments over time to address the most critical challenges facing Auckland. ATAP has provided support for an expanded capital programme, but the Government announced a review of ATAP, expected to be completed during March 2018.
12. In addition to the changes to the GPS and ATAP, it is likely that the new Government will seek to implement a number of initiatives in Auckland specifically, including:
Light rail from the city centre to Auckland Airport, and also potentially to the North-West;
North-West bus rapid transit acceleration; and
A regional fuel tax, likely at 10c per litres.
Regional Transport Committee Meeting| 01 February 2018 Agenda item no. 4.1
Open Session
13. The Auckland Plan sets a high-level 30-year strategy to improve Auckland’s economic, environmental, social and cultural wellbeing and gives direction about the location and timing of future growth and the necessary infrastructure to support that growth. The Auckland Plan Refresh process is currently underway, and an updated vision of Auckland being a “world class city where talent wants to live” has recently been announced by the Mayor. The Auckland Plan focuses on achieving six key outcomes, one of which “access and connectivity for everyone” relates specifically to transport. The RLTP is proposed to align with the strategic directions and focus areas identified in the draft updated Auckland Plan.
Background
14. The Land Transport Management Act 2003 (LTMA) requires that the Regional Transport Committee (RTC) prepare a RLTP every six years, which sets out the region’s transport priorities for the next ten years, and must contribute to the purposes of the LTMA and be consistent with the GPS.
15. Section 18CA of the LTMA requires that the RTC complete a review of the RLTP during the six months prior to the end of the third year of the Plan, to ensure that the Plan is relevant, aligned with the strategic context and consistent with the GPS. Public consultation is required if the RLTP is to be revised. At its meeting of 24 October 2017 the Auckland Transport Board agreed that the level of change warrants a full review of the RLTP, along with public consultation to take place in conjunction with consultation on Auckland Council’s Draft 2018-2028 Long Term Plan (LTP), between 28 February and 28 March 2018.
16. The RLTP is required to be consistent with the Government Policy Statement on Transport (GPS). The draft GPS is currently being reviewed by the Government and a new draft is expected very soon. Any change of focus in the GPS will need to be reflected through into the RLTP. The Government, Auckland Council and Auckland Transport are also undertaking a review of ATAP, expected to be completed in March 2018 and this may result in additional changes to the RLTP.
17. The Mayor’s proposal for the LTP was released on 29 November. This provides indications of rates increases and prioritisation between different Auckland Council activities and includes transport as one of three focus areas, the others being housing and the environment. However, within Auckland Council’s proposed consultation approach, the Government’s proposed regional fuel tax is the only transport initiative to be highlighted in consultation.
18. Early engagement was undertaken with Local Boards and mana whenua in late-2017 and is ongoing. The Auckland Council-led approach to consultation will enable opportunities to engage with other communities, particularly ethnic communities and Mataawaka, prior to and during public consultation. Other key stakeholders will be invited to attend targeted events in March 2018.

Regional Transport Committee Meeting| 01 February 2018 Agenda item no. 4.1
Open Session
Approach to Consultation
19. Where a review determines that significant changes are required to the RLTP, it is necessary for a full public consultation to take place, as set out in the Local Government Act 2002. The LTMA notes that it may be appropriate for RLTP consultation to be undertaken jointly with the LTP.
20. The Auckland Council-led public consultation on the LTP will run from 28 February to 28 March and will include a significant media and communications campaign encouraging public participation. Numerous events will be held throughout the region, including a presence at high-profile existing events, to raise awareness of the consultation and provide opportunities for feedback. The approach to consultation is expected to be approved by the Governing Body of Auckland Council at its meeting of 21 February 2018.
21. The proposed regional fuel tax is the only transport issue to be highlighted specifically in the LTP consultation. Given the degree of uncertainty around the strategic context with the review of the GPS and ATAP it has been agreed that the RLTP will not be highlighted in consultation via a targeted question although the public will be invited to give free-form feedback on any topic they wish, including on the RLTP. In light of this uncertainty and the potential for changes to the document following consultation, once the GPS and ATAP have been updated, it is possible that further public consultation will be required at some stage. This will be outlined in the LTP consultation document along with an explanation of the RLTP and how transport-related feedback will be considered by the two organisations.
22. Targeted consultation events with key stakeholders (for example environmental organisations, transport lobby groups, disability advocacy groups, tertiary institutions, business groups) and Local Boards will be held on 7 and 9 March to enable in-person feedback to the RTC, and local events will also be held throughout the region during consultation, and AT staff will need delegated authority to receive verbal feedback on behalf of the RTC from the public at these events as required under Section 83 of the Local Government Act 2002.
23. The Auckland Plan Refresh will be consulted on alongside the LTP and RLTP in an integrated approach. Consultation on the Auckland Plan Refresh will include a formal consultation question (one of seven) focused on the “access and connectivity” outcome. There will be an Auckland Council-led Transport Stakeholder Event on 14 March covering all three plans, in addition to the Auckland Transport-led events on 7 and 9 March focused exclusively on the RLTP.
24. It is also anticipated that AT will undertake additional consultation activities through its own channels, including specific RLTP related consultation questions on its own website. AT will also welcome direct submissions in any format on the RLTP, and will share these submissions with Auckland Council.
25. All transport-related feedback received by Auckland Council (whether directed specifically to the LTP, RLTP or Annual Plan refresh) will be shared by AT to inform decision-making on the RLTP. Some AT staff will likely be involved, at least on a part-time basis, in assisting Auckland Council with the coding and data entry of submissions throughout the consultation period. Each organisation will undertake analysis of submissions separately.

Regional Transport Committee Meeting| 01 February 2018 Agenda item no. 4.1
Open Session
Issues and Options
26. During the public consultation on the 2015-2025 RLTP, which was similarly combined with Auckland Council’s consultation on its 2015-2025 LTP, transport was a key issue in consultation and three targeted questions were highlighted in consultation, one of which sought feedback on the RLTP prioritisation process.
27. Given the relatively low profile of transport (generally) and the RLTP (specifically) within the LTP there is a question as to what level of additional focus should be given to the RLTP through AT’s own Media and Communications channels. During the 2015 consultation a page on AT’s website was dedicated to the RLTP, with a number of targeted consultation questions set up using Survey Monkey, and information on how to give feedback. It is anticipated that a similar level of focus will be given to the RLTP by AT during the 2018 consultation.
28. During the 2015 Consultation authority to receive in-person feedback at local events was delegated only to the Elected Member Relationship Team. While it is anticipated that this team will undertake the bulk of responsibility for hearing feedback at local events, there is significant risk in this approach if events are well-attended and the ratio of delegated “decision-makers” to members of the public is too small to enable genuine one-on-one interaction. Therefore, it is recommended that the RTC extend this delegation to any other staff member of Auckland Transport approved by the Chief Financial Officer, to ensure compliance with the relevant provisions of the Local Government Act.
Next Steps
29. The adopted Draft RLTP for consultation will undergo an editorial process to ensure quality control and will be published. The intention is to distribute the draft plan electronically wherever possible, noting that there will be some instances (for example libraries and Auckland Council service centres) where hard copy documents are necessary.
30. Further pre-consultation engagement will take place with Local Boards at cluster workshops later in February, and formal engagement with mana whenua is ongoing.
31. Consultation starts on 28 February. It is yet to be determined the extent to which AT staff will need to be involved in the coding and data entry process, which will take place at Auckland Council.
32. It is recommended that representatives of the RTC attend all three targeted stakeholder events on 7, 9 and 14 March to receive in-person feedback from key stakeholders and Local Boards. Around 25 Local “Have your Say” events will be held throughout the region and will require AT staff attendance, in addition to numerous other engagement events and opportunities. In-person feedback at “Have your Say” events will be captured by note-takers and processed alongside written submissions.
33. Possible changes to the document will be considered following public consultation, also taking into account any changes to the Draft GPS and ATAP. If changes to the RLTP made as a result of changes to the Draft GPS or ATAP are considered significant, it may be necessary for further public consultation to take place at some stage – possibly in conjunction with Auckland Council’s public consultation on its 2019-2020 Annual Budget.

Regional Transport Committee Meeting| 01 February 2018 Agenda item no. 4.1
Open Session
34. Generic reports will be submitted to the March business meetings of all Local Boards to enable them to formally resolve on their written feedback, in addition to the in-person feedback which they have been invited to provide on 7 or 9 March.
35. Staff will report to the Board on the results of public consultation in May or early-June 2018, to ensure that any changes as a result of consultation are incorporated into the final document for publication prior to 30 June 2018.
Attachment
Attachment Number Description
1 Draft Regional Land Transport Plan 2018-2028
Document Ownership
Submitted by Nicki Lucas
Revenue & Analysis Manager
Recommended by Richard Morris
Chief Financial Officer
Cynthia Gillespie
Chief Strategy & Development Officer
Approved for submission Shane Ellison
Chief Executive
Auckland Regional Land Transport Plan
2018–2028
New Zealand Transport Agency, KiwiRail, Auckland Transport, Auckland Council
ATTACHMENT 1

2
Introduction from the Chairman
Auckland is facing unprecedented population growth. Our beautiful natural environment, pleasant climate and ethnic diversity make it an appealing destination for immigrants and visitors to New Zealand. In addition, population is growing from within, with over 20,000 new babies born in Auckland over the last 12 months, including one little girl historically making her first appearance at the Britomart Transport Centre! This population growth is vital for making Auckland a vibrant, growing city. But, coupled with historic under-investment in infrastructure, it is putting unremitting pressure on the transport system. Compounding this is the slow pace at which decisions on truly transformational change occurs. It is no exaggeration to say that even the most modest of capital projects can take five to seven years, moving from conception, through decision making, to securing funding, through public consultation, to design, property acquisition, resource consenting... and finally construction. By which time more people and more cars have mean that we are no further ahead in resolving Auckland’s transport problems. In recent years a great number of very good things have been achieved on the transport front in Auckland. Public transport patronage is growing at never seen before rates, customer satisfaction is on a similar trajectory, the long awaited City Rail Link is being built and we are commissioning or opening new facilities on an almost weekly basis. But, simply not enough is being done fast enough. I often think of the queues of cars crawling along our motorways and main roads as a metaphor for the pace at which real change is occurring. FROM THE CHAIRMAN Joined-up thinking between the Government, Auckland Council, the Transport Agency and Auckland Transport is critical if we are to address these fundamental issues. For the good of ‘NZ Inc.,’ collectively we need to deliver a programme of infrastructure improvements now, coupled with behaviour change initiatives which will fundamentally transform the way the transport system works. In the short-term it is imperative that we move ahead with re-prioritising the public space we call roads. We need to be more ambitious than we have been previously in introducing many more bus lanes and giving a higher priority to cycling, walking and service vehicles. Auckland is on the cusp of transformational change. This Regional Land Transport Plan (RLTP) sets out a plan for delivering on the huge potential the region has – quite simply decisions need to be made and executed more quickly. We look forward to hearing your views on how best to address the challenges the region is facing.
Dr Lester Levy, CNZM
Chairman, Regional Transport Committee
3
Table of Contents
Chairman’s introduction
1) The next ten years 2) Strategy and context 3) Consultation and engagement 4) The current situation 5) Strategic approach and prioritisation 6) The Ten-year Programme 7) Funding issues and funding envelopes 8) Operational, renewal and capital programmes 9) Measuring outcomes 10) Prioritised list of projects
Appendices:
• Significance policy
• Glossary

4
1. The next ten years
Auckland is facing an exciting future. It is one of the fastest developing cities in Australasia, growing by
more than 250,000 people since 2010. It is increasingly diverse and multi-cultural with a growing range
of economic opportunities for those that call the region home. It is against this backdrop of
unprecedented growth and prosperity that Auckland Transport has developed the Auckland Regional
Land Transport Plan (2018-2028).
There is no doubt that over the next ten years the way in which Aucklanders and visitors choose to
live, work and play will change radically. The traditional choice between taking a car to work or public
transport is already changing. Providing information and choice to customers to enable ride sharing,
ease of travel to rapid and frequent public transport, walking or cycling is the future for Auckland. This
will free up valuable road space for high priority users, such as freight, in order to drive up productivity
and growth. Young people are leading these changes with fewer drivers’ licences for under 25s.
Instead, young people are finding new ways to get around.
Transport networks are gradually becoming less about hard infrastructure as the focus shifts more
towards information technology and the smart use of big-data. In 2013, less than half New Zealand’s
population had smart phones. This figure rose to 70% by 2015, and is predicted to exceed 90% by
2018. Mobility as a service is putting the customer first, and enabling people to easily make choices
between different options for getting to where they need to be. Smart phone applications show
customers mode options and travel times, including “first and last leg” (e.g. travel from home to the
nearest, or preferred, public transport stop). Commuters have access to real time information about
delays or disruptions to services, and alternative options. These type of services are significantly
enhancing the customer service, and also encouraging people to rely more and more on public
transport.
Aucklanders are using digital technology in ways we would never have envisaged ten years ago.
Applications are already available for finding and paying for parking, and for carpooling. Aucklanders
have a single HOP card which can be used for seamless travel on all modes of public transport, with a
zonal fare system. Within the next few years, it will be possible to use credit cards as public transport
cards. Over the next ten years there will be an expansion and optimisation of our public transport
network to include ferry services, first-leg and last-leg services, and technology that will provide
enhanced connectivity for commuters.
There will be a growing emphasis on “place shaping” – the role that transport infrastructure and
transport-led developments play in retaining and enhancing heritage, building cohesive communities,
and protecting our environment. There will also be an increased focus on road safety in our
communities throughout the region.
We cannot build our way out of congestion, and nor should we try. An expanded transport system will
help to enable the planned growth for Auckland. Increasing our focus on demand management will
help to optimise the use of our roads. This might involve some form of road pricing, but it’s also about
getting people onto public transport, encouraging carpooling through ride share applications and
transit (T2 and T3) lanes. An increased focus on advances in freight planning will be a key driver of
productivity. However, alongside this will be the development of a deeper understanding of the
impacts of our transport system on the environment.

5
Investment in transport in Auckland has always been significant. Over the past 15 years, transport
investment in Auckland has increased four-fold, from around $500 million in 2000 to around $1.4
billion in 2016/17. Transport is Auckland Council’s largest, and central government’s fourth-largest
area of investment. We need to make sure that we are making the best use of the investment which
has already occurred through prudent asset management and maintenance. The next ten years will
see an increasing road and transport asset base that requires maintenance. Over the next ten years:
• Several major infrastructure initiatives which are already underway will be completed, including
the City Rail Link, the Eastern Busway project (formerly known as AMETI) and Lincoln Road
upgrade, the Western Ring Route and the Puhoi to Warkworth highway.
• Significant further investment will occur in the “public transport spine” to support the new bus
network and increase the efficiency and connectivity of the network.
• Over the next ten years there will be investigation of Mass Rapid Transit (MRT), including light
rail, to the Airport, the north-west, and potentially other locations.
• The current walking and cycling programme will be completed, and a new programme of
investment will be underway focused on connections to rapid transit networks and the city
centre.
• There will be a much greater focus on optimising our existing networks to utilise the benefits of
technology, more efficiently allocate streetspace between different users and have the transport
network play a great role in placemaking.
This draft RLTP includes:
Operating expenditure
$000
Renewals
$000
Capital expenditure
$000
Transport Agency $499,272 $342,122 $5,302,379
Auckland Transport $6,128,796 $3,344,654 $7,430,102
City Rail Link Ltd
KiwiRail
Department of Conservation $53 $100
The incoming Government is in the process of reviewing and finalising its priorities for transport in Auckland. This will be undertaken through an update to the Auckland Transport Alignment Project’s (ATAP) indicative package to ensure it better aligns with the new Government’s transport priorities. This work is expected to be completed by March 2018. The update to ATAP will help inform the Government Policy Statement for Land Transport and the nature and prioritisation of the transport programme outlined in the final version of the RLTP.

6
2. Strategy and context
Purpose of the RLTP
The RLTP must be prepared every six years in accordance with the Land Transport Management Act
(LTMA). It is a shared plan which sets out the region’s land transport objectives and includes a ten-year
programme which sets out a prioritised list of activities intended to deliver these objectives.
The RLTP must contribute to the purpose of the LTMA which seeks “an effective, efficient and safe
land transport system in the public interest”. It is also required to be consistent with the Government
Policy Statement on Land Transport (GPS).
All publicly funded land transport activities in Auckland are included in this RLTP, including:
• The road network, including state highways
• Footpaths and cycleways, which are usually but not always beside roads
• Road safety activities delivered in partnership by AT, the Transport Agency and the NZ Police
• Public transport (bus, rail and ferry) services
• Improvements to bus stops, rail stations and ferry wharves, and the creation of transport interchanges and park-and-ride facilities
• Management and improvement of rail track infrastructure by KiwiRail
• Parking provision and enforcement activities
• Transport planning and investment in improvements for customers.
The Land Transport Management Act requires that the Regional Transport Committee (RTC, comprised
of the Auckland Transport Board plus a representative of the NZ Transport Agency) complete a review
of the RLTP during the six months prior to the end of the third year of the Plan, to ensure that the Plan
is relevant, aligned with the strategic context and gives effect to the GPS. Public consultation is
required if the RLTP is revised. Given the rapidly increasing Auckland population, the Auckland
Transport Alignment Project and the change of Government, the Auckland RTC has decided a full
revision of the RLTP is warranted at this time.
Funding sources
Over the past 15 years, transport investment in Auckland has increased four-fold, from around $500
million in 2000 to around $1.4 billion in 2016/17. Transport is Auckland Council’s largest and central
Government’s fourth-largest area of investment. Transport projects and programmes are funded from
a mix of:
• Central government funding for land transport activities through the National Land Transport Fund (NLTF). The NLTF is predominantly sourced from fuel excise duties, road user charges, registration and licensing fees. The Transport Agency administers the fund, which is used to contribute to investment in state highways, local roads, public transport, walking and cycling, traffic policing and other transport activities, approved for funding through the National Land Transport Programme (NLTP).
• Central government also invests general taxation directly in transport activities into rail infrastructure, funding half of the City Rail Link and all of KiwiRail’s infrastructure upgrades.

7
• Auckland Council owns Auckland Transport and contributes over half of its total funding. The council’s revenue is from rates and user-charges. Rates generally fund ongoing activities such as bus services, while debt funds new infrastructure such as railway stations. Rates are also used for interest and principal payments on debt. Auckland Council’s over-riding strategic document is the Auckland Plan. Details of funding sources for Auckland Council are set out in their Long-term Plan.
• Auckland Transport’s third-party revenue including fares on public transport services, advertising, and income from land held for future transport needs, parking revenue and enforcement.
• The Housing Infrastructure Fund (HIF) is an initiative of central government, making $1 billion available as loans to assist high growth councils to advance infrastructure projects important to increasing housing supply. Around $300 million will be provided for transport and Three Waters bulk infrastructure development in the Northwest of Auckland.
Maori Outcomes
Maori outcomes in this RLTP are guided by the key directions and focus areas identified in the draft
Auckland Plan. The key direction areas for the Maori Identify and Wellbeing are proposed as:
• Advance Maori wellbeing;
• Promote Maori success, innovation and enterprise;
• Recognise and provide for Te Tiriti o Waitangi outcomes; and
• Showcase Auckland’s Maori identity and vibrant Maori culture.
The mana whenua groups who comprise the majority of Auckland’s iwi have agreed five strategic pou
for Maori aspirations. These have direct relevance for transport in Auckland:
• Cultural identity. We will work to preserve and enhance the unique cultural identity of Maori and its place at the forefront of New Zealand’s way of life
• Economic well-being. Opportunities will be sought to provide economic development for Maori businesses and people consistent with procurement requirements
• Leadership and Influence. We will continue to work with mana whenua to recognise their role under the Treaty of Waitangi for kawanatanga

8
• Infrastructure and Property. We will continue to work with mana whenua on land use issues and in the design and construction of facilities and infrastructure
• Natural environment. We have a large impact on the environment. We will work with mana whenua to minimise adverse impacts and to preserve and enhance the natural environment
These strategic priorities are consistent with other strategic planning priorities and are incorporated
into the way resources and programmes are prioritised over the ten years.
Strategic Context
The diagram below highlights the key planning document and strategic themes for both Auckland
Transport and the Transport Agency. More detail on the key documents is provided in the following
sections.

9
Government Policy Statement on Land Transport (GPS) The overall national strategic direction for land transport, as described in the current GPS, is to drive
improved performance from the land transport system by focusing on:
• Economic growth and productivity
• Road safety
• Value for money
The new Government is reviewing the GPS. In a letter dated 20 November 2017 the Minister of
Transport set out the following likely revisions to the draft GPS which RTCs should take into account in
preparing RLTPs:
• Giving public transport greater priority in cities and expanding the public transport system to support new housing and interregional commuting;
• Increasing the use of rail to enable efficient passenger and freight use;
• Supporting regional development;
• Increasing support for active modes – walking and cycling;
• Delivering health, safety and environmental improvements;
• Reducing the environmental impact of transport; and
• Mode neutrality in freight transport planning.
The revised draft GPS will be available as an engagement draft in early-2018. The Minister has also
signalled that more fundamental changes to the scope of the GPS and changes to local, regional and
national transport planning are likely to occur at a later date but will not affect the GPS 2018.
The Long-term Strategic View (LTSV) The Transport Agency’s Long-term Strategic View (LTSV) is a document that is intended to provide a
link between the GPS and the investment proposals developed by local authorities. It sets out a
number of priorities for inter-regional transport to link international ports and other key locations
which make significant contributions to the national economy. The LTSV notes the ATAP
Recommended Strategic Approach in response to the challenge of Auckland’s growth and notes the
immediate and future transport priorities with a focus on geographical areas of future population
growth and expected future business growth
The Auckland Plan The Auckland Plan sets a high level 30-year strategy to improve Auckland’s economic, environmental,
social and cultural wellbeing. This includes a high level development strategy that gives direction
about the location and timing of future growth and the necessary infrastructure to support that
growth.
Under an updated vision of Auckland being a “world class city where talent wants to live”, the
Auckland Plan focuses on achieving six key outcomes:
• Belonging and participation
• Opportunity and prosperity
• Homes and places
• Environment and cultural heritage
• Transport and access
• Maori identity and wellbeing

10
Transport contributes to achieving all these outcomes, although the strongest links are to the
transport and access outcome.
The Auckland Plan strategic directions and focus areas for the transport and access outcome are
outlined in the table below.
Outcome: Transport and Access
Direction 1 Create an integrated transport system connecting people, places, goods and services
Direction 2 Increase genuine travel choices for a healthy, vibrant and equitable Auckland
Direction 3 Maximise safety and environmental protection
Focus Area 1
Make better
use of
existing
transport
networks,
including a
greater focus
on
influencing
travel
demand.
Focus Area 2
Target new transport investment to the most significant challenges
Focus Area 3
Maximise the benefits from transport technology
Focus Area 4
Make walking, cycling and public transport preferred choices for many more Aucklanders
Focus Area 5
Better integrate land-use and transport decisions.
Focus Area 6
Move to a safe transport network, free from death and serious injury
Focus Area 7
Develop a sustainable and resilient transport system.
Consultation on the Auckland Plan is underway at present, so these Directions and Focus Areas may
change.
Auckland Transport Alignment Project The impact of Auckland’s growth and on the transport system was the subject of detailed examination
through ATAP. This process involved both central and local government, working together to identify
an aligned strategic approach for the development of Auckland’s transport system. The Minister of
Transport and Mayor of Auckland have agreed to reconvene ATAP to ensure the ATAP indicative
package places greater weight on the new government’s transport priorities. The review is expected to
be completed by March 2018.

11
3. Consultation and engagement
Auckland Transport has worked closely with the NZ Transport Agency and with Auckland Council
throughout the development of this draft Regional Land Transport Plan. KiwiRail has also had input into
its development. The draft Plan reflects input from Auckland Council’s 21 local boards, and from mana
whenua. Further engagement with these key partners is ongoing. Auckland Council and Auckland
Transport are consulting jointly on this RLTP together with Auckland Council’s Long-term Plan (LTP) and
Auckland Plan.
This draft RLTP is being consulted on in an environment of significant uncertainty. GPS and ATAP are
both currently under review by the Government. While the Minister of Transport has given clear signals
around the areas where change can be anticipated – in particular greater priority for public transport,
more emphasis on active modes and reducing environmental impacts of transport – it is likely that there
will be a number of changes to this draft Plan. If changes made to the Plan as a result of changes to the
GPS and ATAP are significant, then it is anticipated that further public consultation would take place.
3.1 How to have you say
Please take the time to let us know what you think of this draft Regional Land Transport Plan. Auckland
Council and Auckland Transport will work together to ensure that all feedback is considered by the
appropriate agency and taken into account in the development of this Plan, as well as the LTP and
Auckland Plan. There are several ways you can let us know your views:
• Via the Auckland Council website, where you can give your views on the RLTP, the LTP and the Auckland Plan XXX
• Via the Auckland Transport website, if you wish to give your views on the RLTP only
• By email, to [email protected] or to [correct AC email address] if you wish to give your views on all three plans
• In writing to [give best postal address – suggest council only]
• By attending a local Have your Say event or other opportunity being provided by local boards to enable in-person feedback on these three Plans. For a complete list of events see [correct URL] or phone Auckland Council on 09 301 0101
Regardless of what form your submission takes, be assured that both Auckland Transport and Auckland
Council will consider your input with an open mind and will give it due weight when making decisions.
This draft RLTP is available at www.at.govt.nz/rltp. For those who require a hard copy, a limited
number are available – please email [email protected] or phone 09 355 3553. All feedback must be
received by 8pm on Wednesday 28 March.
3.2 How final decisions will be made
All views and ideas expressed in submissions to Auckland Council or to Auckland Transport, including at
local consultation events, will be summarised and presented to the RTC. The RTC will adopt a final RLTP
following both public consultation, and the Government reviews of the GPS and ATAP. Decisions will be
publicly available via the Auckland Transport website in late-June 2018 and the full final document will
be made available as soon as possible after adoption.

12
Should the reviews of the GPS and ATAP result in significant changes to the final Plan, then it is likely
that further public consultation will take place, potentially in conjunction with public consultation for
Auckland Council’s 2019-2020 Annual Budget.

13
4. The current situation
Auckland is the largest, and fastest growing, urban area in New Zealand, and home to over 1.7 million
people. Over the past few years the rate of growth has increased substantially, from around 17,000
people per year from 2006 to 2013 to over 40,000 per annum since 2015, making Auckland the fastest
growing major city in Australasia. Since Auckland’s local government was amalgamated in 2010 the
population has grown by over 200,000 people.
This rapid growth is projected to continue, at least for the next few years. Over the next 25 years,
Auckland population is expected to increase by more than the rest of New Zealand’s population
growth combined.
This growth provides opportunities to improve the prosperity and well-being of all New Zealanders,
through the greater diversity of social, cultural and economic opportunities that a larger population
-
10,000
20,000
30,000
40,000
50,000
2007 2008 2009 2010 2011 2012 2013 2014 2015 2016 2017
Auckland's Annual Population Growth (2007-2017)
14
provides. However, these benefits will only be realised if new opportunities can be accessed
conveniently, affordably, safely and sustainably.
Five critical transport problems facing Auckland over the next decade have been identified, based on
ATAP, the GPS and the Auckland Plan:
• Problem 1: The existing transport network does not adequately support growth, particularly in Special Housing Areas (SHAs) and live-zoned greenfield areas
• Problem 2: Accelerated growth and rising travel demand will exceed the capacity of the transport system, undermining access to jobs for people living in large parts of the west, and some parts of the south
• Problem 3: Increasing demand for travel is resulting in greater congestion and unreliable travel times
• Problem 4: Public and active transport modes are under-utilised relative to other modes, leading to less effective use of the transport network
• Problem 5: Increasing interactions between users of the transport system are creating adverse health, safety, cultural and environmental effects
Problem 1: The existing transport network does not adequately support
growth, particularly in Special Housing Areas (SHAs) and live-zoned
greenfield areas
Auckland needs to significantly accelerate the pace of housing and business construction, especially to
improve housing affordability. Over the next 30 years up to 400,000 new homes will be required to
provide for Auckland’s growth. Around two-thirds of these homes will be in existing urban areas, and
one-third in areas which are currently rural.
Significant investment is required to enable and support greenfields growth in the region. The Unitary
Plan identifies around 15,000 hectares of rural land for future urbanisation to accommodate around
135,000 dwellings. This will require new transport, water and wastewater infrastructure in those
growth areas. While that transport infrastructure will be partly provided by developers, it will also
require significant investment from Auckland Transport and the Transport Agency.
ATAP emphasised the importance of enabling a faster rate of housing growth, particularly in Special
Housing Areas and greenfield areas live-zoned by the Unitary Plan. The benefits of this investment will
largely be seen through the acceleration of development, rather than through the alleviation of
current transport deficiencies. The HIF is available for investment in growth areas but is not sufficient
to cover all growth-related initiatives.

15
Problem 2: Accelerated growth and rising travel demand will exceed the
capacity of the transport system, undermining access to jobs for people
living in large parts of the west, and some parts of the south
Rapid population growth, lower fuel prices and a buoyant economy has led to substantial growth in
travel demand over the past few years. This is a new trend, as for much of the previous decade travel
demand was slow and reduced on a per-capita basis. Total vehicle travel has grown by around 10% in
the past three years, this equates to around 360,000 more trips each day.
Longer travel times and less travel time reliability on Auckland’s road network ultimately make it more
difficult to reach employment, education, healthcare, shopping, services, recreation and the myriad of
other activities people undertake in their daily lives. Access to job and education opportunities is
particularly crucial to boosting Auckland’s economic productivity and prosperity as both businesses
and workers benefit from having a wide variety of workers or jobs available through improved ‘job
matching’.
ATAP highlighted that parts of Auckland – especially in the west and south – face a future where the
number of jobs within a reasonable commute time may reduce over the next ten years as Auckland’s
economy evolves and as congestion lengthens travel times. The following graph shows the changes in
access to employment from 2013-2026 assuming committed investments are completed. As the west
and south contain some of the most deprived communities in Auckland and expect to see significant
growth, focused effort is required to improve access for these parts of Auckland.

16
Problem 3: Increasing demand for travel is resulting in greater
congestion and unreliable travel times
Growing demand is exceeding capacity on many parts of the transport network. This is leading to
congestion on motorways and arterial roads, slower speeds and less reliable travel times for people,
goods and services moving around Auckland.
While some level of congestion is the by-product of a successful and growing city, the performance of
many parts of Auckland’s transport network has deteriorated rapidly over the past few years:
• Average peak time travel speeds on Auckland’s state highway network have declined from 64 to 55 km/h between 2014 and 2016.
• The arterial road network has become increasingly congested at peak times. 24% of Auckland’s arterial road network is now congested at peak times, up from 18% three years ago. Across a very large network this is a substantial reduction in performance.
• Congestion is increasingly spreading into inter-peak times, which is particularly concerning as this affects commercial and freight travel that occurs at this time.
Overall congestion has been calculated to cost Auckland $0.9 – $1.3 billion per year1. Increased travel
times and poor reliability have a particularly severe impact on the freight industry and the efficient
movement of goods and services. Auckland has a nationally significant freight logistics function in the
production and distribution of freight to the rest of New Zealand. Travel delays and poor reliability
create genuine and substantial costs to businesses that are ultimately borne by us all.
Problem 4: Public and active transport modes are under-utilised relative
to other modes, leading to less effective use of the transport network
Throughout the second half of the twentieth century Auckland became one of the most car dependent
cities in the world through an investment approach that almost completely ignored public transport,
walking and cycling. Much has changed over the past 20 years, but this legacy of under-investment
and the development patterns it created means many Aucklanders still do not have access to
attractive, safe, reliable and affordable travel choices.
Of particular concern is that travel choice is often poorest in parts of Auckland with socio-economic
deprivation and where the access challenge is greatest.
1 NZIER ‘Benefits of Auckland Road Decongestion’, July 2017

17
ATAP emphasised the need to increase public transport mode share, particularly along congested
corridors and to concentrated activity centres like the city centre and major employment areas. This
recognises the difficulties of widening existing transport networks or providing new corridors and
ultimately the need to utilise space more efficiently.
There has been considerable success in increasing public transport uptake in Auckland. Annual public
transport boardings have increased by 22%, from 69.9 million in the year to January 2014 to nearly 90
million in the year to June 2017. Rail has been a big component of that growth, with boardings
increasing by over 70% since 2014, on the back of initiatives such as electrification and the new fleet
of electric trains. Bus patronage has also increased, by 16% from 54.1 million in the year to January

18
2014 to 62.6 million in the year to June 2017, with the rollout of the new network, integrated ticketing
and new fare structure.
However, the ability to continue to grow public transport patronage is limited by the capacity of the
public transport network, with parts of the public transport network increasingly facing capacity
constraints, particularly capacity on the rail network, and accessing the city centre by bus from the
isthmus and the North Shore.
Although current levels of cycling are low, there is evidence that cycling could play a much greater role
in meeting Aucklanders’ transport needs. There is considerable latent demand for cycling, which can
be realised by overcoming barriers related to lack of high quality cycling infrastructure and concerns
about the safety of cycling, where people who cycle are over-represented in road crash statistics in
Auckland. Where these issues have been addressed, through investment in cycling infrastructure,
there has been unprecedented growth in the number of cyclists.
Ideally, walking and cycling will account for a greater share of short- and medium-distance trips as
Auckland grows. This will reduce pressure on the road network and will also provide health benefits
for Aucklanders. This will require sustained effort and investment, including ensuring the active modes
are prioritised in the way we design our streets.
Problem 5: Auckland’s transport system creates unacceptable harm to
people and the environment
Auckland’s transport network forms a large part of the city’s public space. Where the balance between
movement and place is inappropriately tilted towards moving vehicles, the network can create a
number of unwanted impacts on Auckland’s people and communities. These include severance, noise
and air pollution that affects visual amenity, sense of community and reduces physical connections
between key local destinations.
Some of the most significant adverse impacts associated with the transport networks have been on
safety and health. The last few years has seen substantial increases in deaths and serious injuries on

19
Auckland’s road network, reversing a previous decades-long period of decline. Vulnerable road users
(pedestrians, cyclists and motorcyclists) are over-represented in these statistics compared with the
rest of New Zealand. At around $1.3 billion annually2, the social cost of road trauma is significant.
Furthermore, unsafe parts of the transport network stifle the range of realistic available travel choices,
be it through actual or perceived safety concerns discouraging walking, cycling and public transport.
Environmental issues can include air pollution, contamination of waterways through run-off, flooding
and stormwater overflow due to infrastructure being unable to cope with extreme weather events,
visual and noise pollution, loss of green space, disruption to ecosystems with the construction of new
transport infrastructure, and soil and groundwater contamination.
Particulates and other vehicle emissions compromise air quality and harm the health of Aucklanders.
Unattractive environments for walking and cycling contribute to lower levels of physical activity and a
wide variety of associated health problems, including obesity and diabetes.
Transport is Auckland’s largest contributor to greenhouse gas emissions, contributing to the global
challenge of climate change. Reducing greenhouse gas emissions from the transport system is
fundamental to meeting regional, national and international commitments to mitigate the impact of
climate change.
At a more local level, runoff from the transport network contributes to the pollution of waterways
while the construction of new transport infrastructure has the potential to generate significant
environmental, cultural and social impacts that need to be appropriately mitigated.
2 Roadsafe Auckland Strategy 2018-23

20
5. Strategic approach and prioritisation
Addressing Auckland’s transport challenges is critical to the success of the region and of New Zealand
as a whole. An integrated approach is required, with agreement between all stakeholders. as transport
is a partnership between central and local government. Over the past three years there has been
growing alignment about how to address Auckland’s transport challenges through the Auckland
Transport Alignment Project (ATAP).
Auckland Transport Alignment Project
ATAP highlighted that a change in approach to addressing Auckland’s transport challenges is required.
In the past, the main response to growing travel demand was to increase road capacity and (less
commonly) provide public transport, walking and cycling infrastructure and services. In comparison,
relatively little attention was placed on influencing travel demand.
Moving forwards, it will be necessary to expand the range of interventions to improve transport
performance. ATAP outlines the need for an integrated approach that targets new investment to the
most significant challenges, makes better use of existing networks, and maximises opportunities to
influence travel demand.
The Minister of Transport and Mayor of Auckland have agreed to reconvene ATAP to ensure the ATAP
indicative package places greater weight on the new government’s transport priorities, particularly
public transport, walking and cycling, and improvement in health, safety and environmental outcomes.
ATAP and the Prioritisation Process
Although ATAP developed an indicative package, it was not itself an investment programme and
generally focused only on the larger components of the programme. This RLTP translates the ATAP
Make better use of existing networks
Optimise key routes to increase
productivity
Continue to improve asset management efficiencies
Maximise benefits from new transport
technology
Target investment to the most significant
challenges
Prioritise investments to
achieve best value for money
Enable and support growth
Strengthen strategic transport
networks
Maximise new opportunities to
influence travel demand
Better integrate land use and
transport
Actively encourage increases in vehicle
occupancy
Progressively move to smarter transport pricing

21
strategic approach into a more specific implementation plan for the next ten years. Therefore, the
transport programme in this RLTP has been developed through a process of prioritising potential
investments in a way that best gives effect to the strategic direction articulated in ATAP, the GPS and
the Auckland Plan.
Addressing the five problems discussed in Chapter 4 can deliver significant benefits for Auckland. The
ten-year investment programme developed by ATAP will deliver the following benefits, compared to
the status quo:
• Benefit 1: The transport network will support a faster rate of housing and business growth
• Benefit 2: Access to employment/labour will improve relative to current levels, supporting
economic growth and increasing productivity
• Benefit 3: Congestion will improve relative to projected levels – in particular travel time and
reliability in the peak period will improve, and congestion will not become widespread during
working hours
• Benefit 4: Public transport and active mode shares will increase relative to vehicle use
• Benefit 5: There will be a reduction in harm from the transport system on people and the
environment
• Benefit 6: Public investment in the transport system delivers value for money
The transport programme has been developed through a process of prioritising potential investments
in a way that best gives effect to the strategic direction articulated in ATAP, the GPS and the Auckland
Plan. A particular focus of this exercise is ensuring investments target Auckland’s most significant
challenges in a way that achieves long-term strategic goals and delivers value for money.
That prioritisation involved reviewing over 300 capital projects and programmes, covering initiatives
on the local road and state highway networks, improvements to public transport, technology-related
projects, and below-track rail projects.
The ITP Calculator and prioritisation process have been designed to enable different priority, weighting and funding assumptions to be tested and assessed. Considering different scenarios has been a key part of the process in developing this Regional Land Transport Plan.

22
Developing the RLTP programme begins with the identification of all potential projects for
consideration. Project information is then gathered to enable assessment and prioritisation.
Committed items in the project list are then identified. These are treated as non-discretionary and
include:
• Projects with pre-existing contractual commitments (examples include the recently
announced purchase of additional electric trains and projects already under construction)
• Maintenance and renewal of the public transport, local road and state highway networks
• Ongoing operational requirements and programmes (examples include minimum investment
in safety, minor improvement, bus priority, digital technology and land acquisition
programmes)
• Items with ring-fenced council funding (examples include Auckland Transport’s seal extensions
and local board initiatives budgets).
While these committed items are treated as an essential part of the programme, they are not exempt
from scrutiny. Work is undertaken to confirm the items are efficient, effective and represent value for
money.
Non-committed projects are then prioritised and ranked using the ITP Calculator. The ITP Calculator is
a multi-criteria assessment tool that results in a consolidated ranked list of non-committed capital
projects (covering local road, walking and cycling, state highway and public transport initiatives). The
criteria underpinning the ITP Calculator have been developed to align strongly with ATAP’s agreed
Strategic Approach. The key components of the calculator are summarised in the figure below.

23
The ITP Calculator can be adjusted to place greater emphasis to the different outcomes areas, for
example, greater weight could be given to those key components that focus on supporting public
transport mode share. The projects presented in ranked order in this draft RLTP are based on an equal
weighting of outcomes to best reflect the overall ATAP strategic approach.
Once available, the ten-year funding envelope can be applied to the ranked list of projects to identify
which items receive funding, and which lower priority initiatives fall below the funding cut-off.

24
6. Ten-year programme
Nine key elements have been identified for this ten-year period, based on the strategic approach and
prioritisation process. These elements are considered to contribute most to addressing the transport
problems facing Auckland over the next ten years.
Transport Planning
Supporting the transport challenges is the need for robust transport planning to inform clear business
and investment decision making, both for this ten-year programme and longer term planning (up to 30
years) being undertaken.
Statutory plans such as Auckland Transport’s Asset Management Plan, the Transport Agency’s State
Highway Investment Proposal and the Regional Land Transport Plan provide inputs into Council’s
Long-term Plan and the National Land Transport Programme as needed and, along with the Regional
Public Transport Plan, provide high level strategic direction to guide more detailed planning.
The introduction of the One Network and Business Case approaches for transport planning necessitate
a new way of planning and managing Auckland’s transport system across the partner organisations. It
requires much greater collaboration to enable regional strategic planning and enables a co-ordinated
response to planning and investment, including incorporation of national initiatives such as the One
Road Network Classification and Safer Journey systems.
Planning needs to be co-ordinated to ensure investment makes the best use of existing
infrastructure/assets and that the best overall outcomes can be achieved. Using the Business Case
Approach to guide planning, in collaboration with key stakeholders, ensures that interventions can
deliver against the key problems, that interventions provide value for money, and that opportunities
for making better use of existing capacity are explored before new infrastructure interventions.
Supporting growth areas
Improving the strategic and
connected public transport network
Improving access to the City Centre and
Airport
Developing Auckland's strategic
road network
Making better use of existing networks and
influencing travel demand
Reducing harm to people and the
environment
Encouraging walking and cycling
Maintaining existing assets
Improving inter-regional connectivity

25
6.1 Supporting growth areas
Accommodating Auckland’s rapid population growth requires accelerating the construction of housing
and business development. Opening up rural land for development, or facilitating redevelopment of
existing urban areas to higher densities, is frequently dependent upon the provision of new transport
infrastructure and services. These investments are therefore focused on enabling growth, rather than
addressing current network performance deficiencies.
Large-scale multi-year infrastructure improvements of this scale have long lead times as they go
through the processes of options analysis, design, property acquisition, consenting, and effective
procurement and construction.
The Auckland Unitary Plan provides substantial capacity in both new and existing urban areas to
accommodate future growth. Realising this capacity in a way that supports the desired land use and
transport outcomes requires a flexible and responsive approach to planning, funding and staging of
infrastructure and services that integrates with the location and timing of development. This includes
supporting development of residential areas and town centres through early investment in enabling
infrastructure.
Existing urban area
Around two-thirds of Auckland’s future growth is expected to occur through the redevelopment of
existing urban areas to higher intensities. Transport investment within the existing urban area is
necessary to unlock growth, by improving access and supporting redevelopment. These projects are
typically fairly small in scale and focus on unlocking land for redevelopment or improving amenity to
make areas more market attractive.
The map below shows the location of “Development Areas”, the parts of the existing urban area
where the greatest amount of change is likely to occur. These locations are strategically important
areas where growth will need to be enabled and supported.
Typically they have a combination of the following attributes:
• Capacity for substantial redevelopment under Unitary Plan zoning; • Relatively good access to employment opportunities; • Easy access to current or planned strategic public transport corridors;
• Current or planned infrastructure capacity; and
• Strategic landholdings (e.g. major areas of Housing New Zealand owned land).

26
The map below indicates the location of first decade and then longer-term Development Areas.
Projects to help deliver this growth may be funded from the Local Residential Growth Fund (LRGF),
which was established to provide a source of funding for roading and public transport projects across
the region that are needed to meet the demands arising from additional housing in Auckland. Projects
funded from this source include Hingaia Road widening, Medallion Drive, Gills Link Road and Dairy
Flat/Lucas Creek Bridge improvements.
Other projects that help to address the impacts of growth include Carrington Road, supporting the
development at the Wairaka Precinct, as well as significant investment in public transport and walking
and cycling to provide affordable and realistic transport alternatives.

27
Greenfield areas
About 15,000 hectares of greenfield (mainly rural) land has been identified for development in the
Unitary Plan. This includes areas zoned ‘future urban’ (rural land zoned for future urban
development), as well rural land that has been ‘live zoned’ (zoned for immediate urban development).
Major new greenfields growth areas will occur in the South, Northwest, North and Warkworth. Over
the next decade, this growth will mostly occur around Wainui in the north, Red Hills and Whenuapai in
the northwest, and Paerata and Drury West in the south.
Auckland Council’s Future Urban Land Supply Strategy (FULSS) identifies a programme to sequence
when future urban land will be ‘development ready’. In the first decade the proposed land to be
“development ready” will enable 53,000 new homes in these growth areas.
Greenfield areas need substantial investment before significant development can occur. Some of the
investment is needed to open up land for development, alongside larger scale improvements needed
to connect these areas to the rest of Auckland and address the impact of increased travel demands to
and from these new urban areas. Investment over the next decade will be focused on:
• Enabling and supporting urbanisation in areas live-zoned or sequenced for early growth
• Protecting routes for longer term projects

28
Auckland Transport, Auckland Council and the Transport Agency have worked in partnership to assess
the impacts that growth will have in these future urban areas.
A transport network plan, known as the Supporting Growth Programme, has been developed to
support these future urban areas. The Programme identifies a preferred network which:
• Enables the sequence of land release specified in the Future Urban Land Supply Strategy
• Improves access to places where people live and work now, and in the future
• Increases transport choice with a strong focus on public transport and the development of the walking and cycling network
• Supports the ongoing economic development of Auckland by providing strong connections to the wider Auckland strategic transport network
• Manages the network in a way that gets the most out of existing assets.
Southern Area
The Drury growth area, including Opaheke, Drury, Drury South and parts of Karaka is the largest greenfields area to be developed in the Auckland region, and Pukekohe/Paerata is identified in the Auckland Plan as a priority satellite town. The transport programme for these areas includes:
• A well-connected rapid transit network with electric trains extended to Pukekohe, following electrification of the network by KiwiRail, and supported by new rail stations.
• Rapid transit links between the airport, Manukau, Flat Bush and Botany
• The upgrade of the Mill Road corridor from Manukau and Flat Bush to Papakura and Drury. This will help to improve safety, provide greater access to the growth areas in the south, and provide an alternative north-south route to SH1.
• Replacing level crossings in Takanini with bridges over rail lines allowing increased train frequencies, along with upgrades at Rangi Road, Taka Street and Walters Road to provide good east-west connections for the area.
• SH 22 will be upgraded near Paerata, and in Pukekohe a road south of the town centre will allow a bypass for trucks and other traffic. Safety improvements on SH22 will also improve travel between Drury and Pukekohe.
• Walking and cycling networks will be expanded to improve travel choices and accessibility in local areas.
North-West Area
The north-west growth areas of Redhills, Whenuapai, Kumeu/Huapai and Riverhead are expected to
experience significant growth over the next decade. The transport programme for these areas
includes:
• New arterial roads and improvements in Whenuapai and Redhills to provide a strong local road network with connections to the motorway network
• A direct motorway to motorway connection between SH16 and SH18 to provide a more efficient connection between Kumeu/Huapai and the North Shore
• The new Westgate bus station
• Safety improvements on SH16 between Waimauku and Brigham Creek Road
North Area
The Wainui East, Silverdale and Dairy Flat area has the capacity to accommodate significant residential
growth. The transport programme for these areas includes:
• An extension of the rapid transit network linking Albany to Dairy Flat, Silverdale, Wainui and Grand Drive via an extension of the Northern Busway.
• New and upgraded arterial roads to connect these growth areas.
29
Warkworth Area
The Auckland Plan anticipates that Warkworth will grow to a substantial satellite town of over 20,000
people. Improvements to the transport network to support this growth include:
• The Pūhoi to Warkworth project will extend the four-lane Northern Motorway (SH1) 18.5km from the Johnstone’s Hill tunnels to just north of Warkworth. It is the first stage of the Ara Tūhono – Pūhoi to Wellsford Road.
• The Matakana Link Road will reduce congestion and provide an alternative route to State Highway 1
• Increased public transport services are proposed between Auckland and Warkworth, with a frequent express bus service along the new motorway, supported by a park and ride bus station.
6.2 Improving the strategic and connected public transport
network
A continuing strong uptake of public transport use will help address congestion on key parts of the
strategic road network. The developing Auckland public transport network seeks to create a single,
connected service network across all modes (rail, light rail, bus, ferry, emerging mode technologies)
accessed by the customer through emerging personalised digital platforms.
The ‘hub-and-spoke’ network design comprises a core rapid and frequent network of high capacity
and frequent services on dedicated routes. It links rail and busway (Rapid services) and frequent bus
services with bus priority on shared arterial routes and some ferry services (Frequent services), with
Connector/Local services feeding people into the Rapid and Frequent network at transport
interchanges. Targeted services provide a capacity or specialist overlay as required, e.g. peak–only
services.
Auckland Transport is preparing a new Regional Public Transport Plan which will outline the next steps
to progress development of the public transport network, given the implementation, or near completion
of key initiatives underpinning the 2015 RPTP, in particular:
• Completion of the New Network by September 2018, including delivery of interchanges at Otahuhu, Pukekohe and Manukau.
• Roll-out of the PTOM procurement framework for bus and ferry, in parallel with the New Network.
• Implementation of the Simpler Fares zonal structure for bus and rail in August 2016.
Strategic public transport network
Auckland’s strategic public transport network (bus, rail and mass rapid transit) forms the backbone of
the public transport system, providing for high volumes of travel to major employment centres,
especially into the central area. This public transport “spine” enables frequent, high capacity services
to operate in their own dedicated corridors, offering mass transit that is at least partially separated
from private vehicles and is much less affected by road congestion.
The network barely existed a decade ago, but through a programme of upgrading and electrifying the
rail system and completing the Northern Busway, the strategic public transport network now reaches
into many parts of the city. This has resulted in very rapid growth in rail and busway boardings and has
substantially increased throughput along many of Auckland’s busiest transport corridors.
30
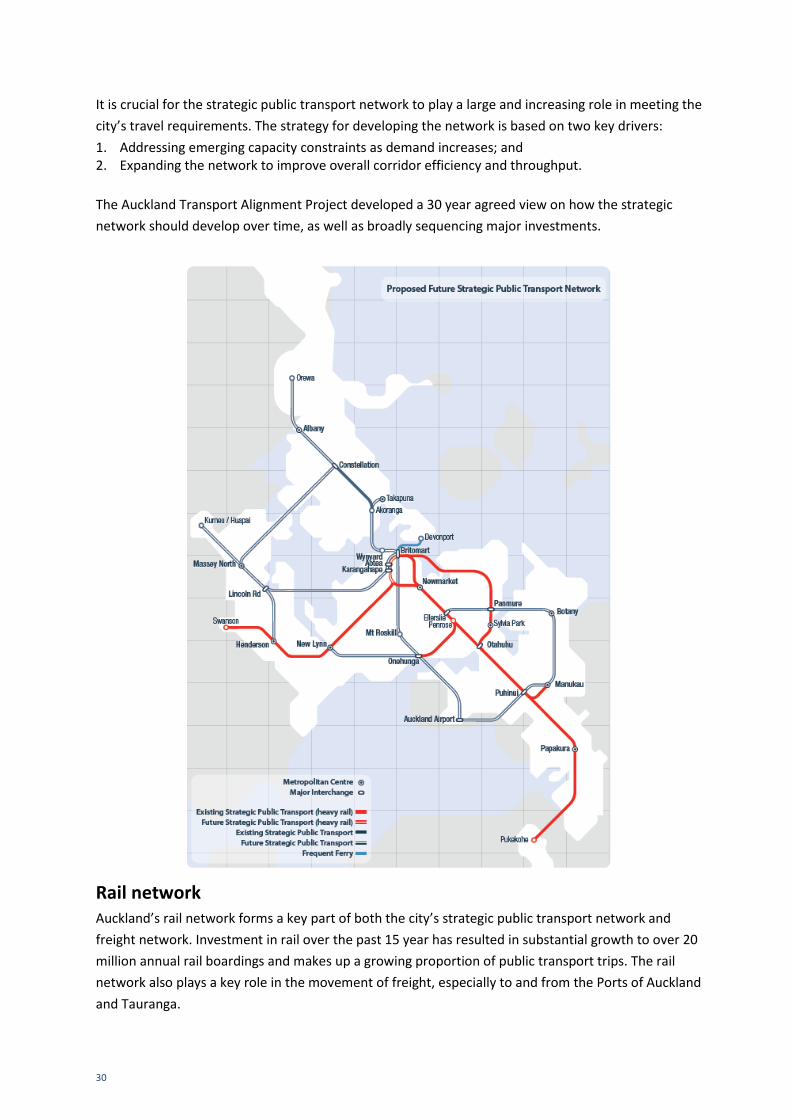
It is crucial for the strategic public transport network to play a large and increasing role in meeting the
city’s travel requirements. The strategy for developing the network is based on two key drivers:
1. Addressing emerging capacity constraints as demand increases; and 2. Expanding the network to improve overall corridor efficiency and throughput.
The Auckland Transport Alignment Project developed a 30 year agreed view on how the strategic
network should develop over time, as well as broadly sequencing major investments.
Rail network Auckland’s rail network forms a key part of both the city’s strategic public transport network and
freight network. Investment in rail over the past 15 year has resulted in substantial growth to over 20
million annual rail boardings and makes up a growing proportion of public transport trips. The rail
network also plays a key role in the movement of freight, especially to and from the Ports of Auckland
and Tauranga.

31
Strong growth in passenger rail boardings and rail freight is expected to continue into the future.
Meeting this growing demand will require more passenger and freight trains to be operated on the rail
network, increasing conflict between services unless ongoing investment occurs. More intensive use of
the rail network will also require investment to increase capacity, improve network resilience and
maintain safety. Access to Britomart train station and the section of track between Westfield and Wiri
rail junctions are the two most significant pinch points on the rail network and will need to be the key
focus for early efforts.
Significant additional investment in rail passenger infrastructure is underway or planned to support
the recent growth in patronage and address capacity constraints. The largest of these is the City Rail
Link (CRL), a $3.4 billion investment jointly funded by Auckland Council and the Crown. The CRL will
provide a second access point to the city centre from Mt Eden, removing the current Britomart
bottleneck. This will more than double the number of trains potentially able to operate on the rail
network. Construction of the CRL is now well underway, with the project being delivered by City Rail
Link Limited (a crown entity owned by the Crown and Auckland Council), and expected to be
completed in the 2023/24 financial year. Once complete, this 3.4km underground rail line will provide
benefits to rail passengers through improved access to the city centre and reductions in travel times,
particularly from the west.
Additional investment to support growing rail passenger and freight demand includes:
1. More electric trains to provide for growth and reduce crowding that would otherwise occur. The initial purchase of at least 15 new trains will provide much needed additional capacity in advance of the CRL opening. It is anticipated that a further order will be placed around the time of the CRL opening to support growth that is higher than originally forecast when the network was electrified. Provision for stabling, cleaning and maintenance facilities is also included.
2. Electrification of the line from Papakura to Pukekohe will allow the current old diesel fleet to be replaced by electric trains, and will remove the need for passengers to change trains at Papakura. New stations will allow rail access to those new growth areas.

32
3. A third main between Westfield and Wiri. The section of track between Westfield and Wiri junctions experiences the greatest conflict between passenger and freight trains because it services Southern and Eastern Line passenger services as well as most freight train paths. Constructing an additional track and upgrading the Westfield rail junction will enable better separation of passenger and freight services, enabling higher frequencies and improved reliability. A fourth track in this area will also be required and is included in the second decade.
4. Progressively removing road/rail level crossings to better manage safety risks and address road congestion.
Bus network Buses are, and will remain, the most heavily used mode of public transport, accounting for around
70% of public transport trips. Major new initiatives over the next ten years will strengthen the public
transport “spine”, and include:
• Mass rapid transit is proposed for the north-west, to provide travel alternatives from the west to the central city, and help to relieve the pressure on SH16. Options for this include a busway or light rail. If a busway is the preferred option, this would be progressively enhanced over the next three decades, with the first decade including the Lincoln Road to Te Atatu and Point Chevalier to Karangahape Road sections, and stations at Westgate, Royal Road, Lincoln Road, Te Atatu, Point Chevalier, Western Springs and Bond Street.
• The completion of the Eastern Busway from Panmure to Pakuranga, including the Reeves Road flyover and Pakuranga Bus Station, and through to Ti Rakau Drive and Botany. The Eastern Busway will improve transport options by making public transport, walking and cycling realistic and safe choices, and improving connections between the area and the rest of Auckland.
• The Northern Busway will be extended to Albany Bus Station, running in both directions alongside the motorway, and building on the hugely successful existing busway from Constellation Drive to the CBD. A new station will be added at Rosedale to provide another station to access the northern busway. There is also provision to extend the busway from Albany to Grand Drive near Orewa, potentially through bus shoulder lanes and associated infrastructure between Albany and Grand Drive.
As well as these dedicated busways, the RLTP includes investment to provide bus priority lanes on all
major bus routes over a fifteen-year period. Road corridor improvements such as the upgrade of
Lincoln Road corridor also include adding bus lanes, high occupancy vehicle lanes and cycling lanes.
Ferry network Capacity constraints are appearing at the Downtown ferry terminal, with the risk that this may limit
the ability to increase the frequency of ferry services, particularly to Hobsonville and West Harbour.
This RLTP includes funding for the redevelopment of the Downtown ferry terminal, to accommodate
the future expansion of services.
Auckland Transport, as part of its review of the RPTP, is also developing Auckland’s Future Ferry
Strategy. This will consider opportunities for network expansion including into the Manukau Harbour.
Initiatives supporting public transport
Ideally growth in patronage needs to continually exceed the population growth rate, so that
Auckland's roads do not get more congested than they already are. This would require significant
33
investment in public transport infrastructure and services, including in ways which encourage current
drivers to switch to public transport. Auckland Transport will be investigating, through the
development of its RPTP, the most effective ways to encourage public transport use, and what is
possible with available funding levels.
Maximising benefits from improving the strategic public transport network also relies on its
integration with the broader transport network and the ability of customers to access the services
easily. Key initiatives to improve this integration include:
• New or expanded park and ride facilities, focused in outer parts of the city to provide access to public transport for areas with poor walk/cycle catchments or where feeder bus services are unlikely to be cost-effective or attractive.
• Walking and cycling improvements to increase the catchment size of stations on the strategic public transport network. (More discussion of first and last leg.)
6.3 Improving access to the City Centre and Airport
The city centre, airport and their surrounds are projected to be the fastest growing employment areas
in Auckland over the next 30 years. Providing effective access to these areas is important to the
success of Auckland and New Zealand as a whole.
Improving City Centre Access
Auckland City Centre and its surrounds are New Zealand’s fastest growing residential area and largest
employment hub. Strong growth is expected to continue, reaching nearly 250,000 jobs by the 2040s,
accompanied by a substantial increase in population, tertiary students and visitors. The City Centre is
the economic power house of the region, accounting for 20% of Auckland’s GDP while only occupying
0.08% of the region’s land area.
Growing travel demand to the city centre has been entirely accommodated by public transport,
walking and cycling over the past 15 years, while the number of private vehicle users has remained
static. This trend will need to continue as access to the City Centre and its surrounds is particularly
constrained. Even greater competition for limited street space between people walking, people on
bikes, people on public transport, freight, and people in cars is expected in the future. In addition to
these travel demands a high degree of public amenity is needed, requiring a continual balancing
between the competing demands of movement and place. This means it is imperative the transport
network moves more people in fewer vehicles. This requires a continued modal shift towards public
transport, walking, and cycling.
The City Rail Link and changes to the bus network will help improve access to the city centre and
facilitate this ongoing modal shift. Major city centre bus upgrades over the next ten years include:
• Bus terminal facilities and associated infrastructure in Lower Albert Street, Quay Street, Wynyard Quarter and the Learning Quarter.
• A major upgrade of Wellesley Street (from Halsey Street to Symonds Street) to increase the flow of buses to/from the isthmus, north shore to mid-town, additional Link and crosstown services between suburbs in the east and west of the city centre.

34
• A major upgrade of Fanshawe and Customs streets to accommodate the increases in north shore buses to/from the downtown area.
• Improvements to Vincent and Albert Streets to accommodate the increased volume of buses coming from the north-western busway from Karangahape Road to Britomart.
Bus efficiency improvements on City Centre corridors can only provide limited additional capacity.
Mass transit between the city centre and Mt Roskill along Dominion Road and Queen Street will be
required within the next decade. This will provide substantial increased capacity for public transport
services through a shift to much larger vehicles that can carry many more people and will also take
pressure off the highly constrained Symonds Street and Wellesley Street corridors, benefitting
remaining buses and general traffic.
Improving Airport Access
Auckland Airport is the international gateway to New Zealand and key to our tourism economy. It is a
major and growing regional employment hub and a key freight destination, particularly for high-value
and time sensitive goods. Auckland International Airport handles around 17 million passengers per
year and about 15 percent of New Zealand’s foreign trade by value, making it the country’s third
largest port (by value). The Airport and surrounding area currently employs over 30,000 people, and
anticipated to grow to approximately 90,000 by 2044.
A wide range of customers require access to the area for work, to travel, and for logistics movements.
However, record levels of both freight and passenger air travel combined with general increases in
traffic around the airport precinct has led to journey time unreliability and significant congestion. Daily
trips to and from the area are expected to grow from 63,000 to 140,000 over the next 30 years, and
capacity improvements are required along both the northern (SH20A) and eastern (SH20B) access
points to the area.
A programme of investments is required to improve customer journey experience. Initially access can
be improved with the implementation of more immediate and short-term public transport
improvements and some targeted road capacity increases. However, space constraints with the
Airport area and capacity challenges on the main access corridors will make it increasingly difficult to
serve the area through road and bus improvements alone. A number of different initiatives are
included in this RLTP to improve airport access. Improvements to SH20A, providing for future bus
shoulder lanes and signalising some intersections are already underway and will provide a safer, more
reliable route to and from the airport and will increase freight efficiency.
More immediate and progressively enhanced rapid, high frequency bus services will be introduced,
taking advantage of bus/high occupancy lanes on SH20A and SH20B. The improvements will seek to
maximise the investments already made, such as electrification of the rail network, with a proposed
upgrade of the Puhinui Rail Station to optimising the use of the existing south and east area bus
network.
These will complement developments undertaken by Auckland Airport to improve pedestrian facilities,
bus lanes and stops, lighting and cycling facilities within the airport precinct.

35
The longer term direction is to provide enhanced transit connections between the Airport and the City
Centre, and to Manukau and Botany. The extension of mass transit to the airport is proposed to be
completed in the next decade. Funding is also included to investigation into mass transit from
Auckland Airport to Botany via Manukau with bus to light rail transition and implementation staging,
including staged additional capacity on SH20B and SH20 and new southbound link from SH20A to
SH20.
6.4 Developing Auckland’s strategic road network
Auckland’s strategic road network, including both State highways and the most important arterial
roads, forms the backbone of the road network, providing for a wide variety of travel and the highest
traffic volumes, linking major parts of Auckland and the rest of New Zealand, carrying the heaviest
freight volumes and providing access to the Port and Airport. Through-movement of people and goods
is the primary consideration.
Given the role of the service sector in driving Auckland’s economy, the major industrial employment
areas such as Onehunga/Penrose/Mt Wellington, East Tamaki, Wiri and the Rosebank Road area are
forecast to see slower growth. Auckland’s freight task is, however, forecast to grow faster than
commuter and education related travel as the economy grows. These areas will remain important
employment hubs and will generate significant freight travel movements. It is important to limit the
growth in congestion on the freight network, particularly in the interpeak and improve the efficiency
of the connections to major freight hubs, especially the ports and airports.
It is crucial for the strategic road network to play a large and increasing role in meeting the city’s travel
requirements. The strategy for developing the network is based on four key drivers:
• Focusing primarily on improving the efficiency of existing corridors by better balancing demand
and capacity.
• Providing new corridors in greenfield areas to support growth and improve connections to
existing urban areas.
• Focusing additional capacity primarily on outer parts of the network, along the Western Ring
Route and improving Port and Airport access.
• Maximising benefits from new technology to increase vehicle throughput and occupancy levels.
The Strategic Road Network
The congestion on the strategic road network, both at peak and increasingly in inter-peak periods is a
significant concern. The completion of the Western Ring Route through the Waterview Connection
demonstrates the benefits that can arise from the completion of gaps in the strategic road network.

36
It is critical for implementation of the strategic road transport network to be planned as a cohesive
whole, across the different agencies that may implement parts of the network and to make sure
different components of the network come together to maximise its performance. This planning work
will need to focus on determining appropriate timing and sequencing.
The Auckland Transport Alignment Project developed a 30-year agreed view on how the strategic road
network should develop over time, as well as broadly sequencing major investments.
Major investments included in this RLTP are:
• Northern Corridor Improvements (NCI) - The NCI are a range of inter-related projects on SH1 and
SH18, covering:
o Converting the last remaining part of SH18 to full motorway standard with motorway to motorway ramps to the SH1 north along with extra lanes.
o Additional motorway lanes in both directions will be added on the Northern Motorway (SH1) between Greville Road and Constellation Drive.
o The extension of the Northern Busway from Constellation Bus Station to Albany Bus Station (discussed under PT improvements).
o Walking and cycling improvements

37
• Southern Corridor Improvements (SCI) – The SCI cover the stretch of Southern Motorway (SH1)
from the SH20/SH1 connection at Manukau down to Papakura in the south. The project is well
underway and expected to be completed by the end of 2019. The SCI include additional lanes in
both directions, an upgraded Takanini Interchange and a 4.5km shared use pedestrian / cycle path.
• Additional Waitematā Harbour crossing – further work on the business case as well as pre-
implementation work on an additional Waitematā Harbour crossing. Improvements to SH20A and
20B outlined above in the section on Improving Airport Access.
In addition, new or upgraded arterial roads are planned:
• Mill Road - the Redoubt Road-Mill Road corridor will be upgraded in 2 phases. The northern
section from State Highway 1 at Manukau to the intersection of Mill Road and Popes Road. This
upgrade includes a4-lane road and upgraded intersections, improved public transport
infrastructure and services along Redoubt Road to SH1 to provide more reliable bus journey times,
the ability to move more people and address constraints on the public transport network, on-road
cycle lanes and shared path facilities, and safer pedestrian footpaths and crossings. The southern
section from the Mill Road/Popes Road intersection will include new connections through to
Papakura and Drury, supporting growth in the south. The fully upgraded corridor will improve
travel times and safety for drivers, pedestrians and cyclists, and provide an alternative north-south
corridor in case of major disruption or emergencies on SH1.
• Penlink is a four lane arterial connecting the Whangaparaoa peninsula with SH1 at Redville, and is
also part of ATAP’s proposed strategic road network. It will improve travel times and reliability for
Whangaparaoa commuters and improve network performance, safety and resilience. It will also
reduce traffic through the Silverdale Interchange, thereby freeing up transport capacity for
housing development in Wainui, Silverdale West and approved development on the
Whangaparaoa peninsula.
• Lincoln Road from Te Pai Place to SH16 will be upgraded, including adding transit lanes for buses
and high occupancy vehicles and cycling lanes.
• The Eastern Busway (a mix of road improvement and public transport projects including the
Reeves Road flyover), will relieve pressure on the Panmure-Pakuranga and Botany road corridor.
6.5 Making better use of existing networks and influencing
travel demand
Network Optimisation
Much of Auckland’s future transport network already exists and there are few opportunities to build
or expand transport corridors. This means that most travel demand growth will need to be
accommodated on the existing routes. Auckland needs to make better use of existing infrastructure by
increasing the number of people who can travel through key routes. Better planning is also needed to
ensure that a larger proportion of Aucklanders can live and work in close proximity to major transport
corridors.

38
One issue with optimising the available road corridor is the often conflicting demands between road
users. For example, removing parking to accommodate cycle lanes, the introduction of light rail or
changing mixed traffic lanes to prioritise bus, freight or multiple occupancy vehicles. Over the period
of the RLTP, Auckland Transport’s Roads and Streets Framework will be used to resolve conflicting
demands on the local road network. It is acknowledged that changing the existing use of some road
space will be a feature of the evolution of managing Auckland’s traffic.
Accommodating this wide variety of demands at increasing intensities will require a far stronger focus
on optimisation – ensuring each transport route performs the functions required of it. This involves a
stronger focus on network-level planning to identify and manage key transport routes and clear
criteria to balance different user requirements and conflicts between through-movement and
amenity.
Key initiatives that will be undertaken to improve network optimisation include:
• Applying the Roads and Streets Framework to assist in resolving competing issues and guiding difficult decisions about the allocation of street space, such as removing on-street parking, expanding the bus lane network and extending operating hours, and introducing freight priority measures on the local road network.
• Improving the efficiency of traffic signals to avoid unnecessary delays for all users.
• Enabling a more active use of joint transport operation centres to minimise the impact of disruptions and make real-time adjustments to managing and operating transport networks.
• Providing timely and accurate information to help people use the most efficient route and mode for their travel needs (for example motorway signs advising of delays or weather conditions).
• Trialling a “dynamic lanes” project on Whangaparaoa Road, which involves a moving middle lane to accommodate peak traffic flows.
• Undertaking a series of targeted minor intersection upgrades, particularly focused on optimising throughput on key movement routes (including for pedestrians in high activity areas).
Technology improvements, like the HOP card and real-time travel information, have strongly
contributed to the current rapid increase in public transport use. Ongoing investment in improved
technology will allow enhancements that include further improvements to real time information
displays, Wi-Fi, and Mobile applications to improve customer information.
Developing transport technologies also provide new opportunities to better meet travel demand that
is difficult to efficiently serve with conventional public transport systems. These developments will be
particularly beneficial in areas where household and employment density is too low to support
frequent public transport services.
Mobility as a service (MaaS) provides the opportunity to integrate public transport, demand-
responsive services, ride-sharing, and active modes into a single, connected, personalised transport
system. While each mode on its own is unlikely to fully meet most people’s mobility needs, in
combination MaaS provides a genuine alternative to owning or using a private vehicle. Collaboration
will be key in the delivery of MaaS, and the early stages of this have already commenced in New
Zealand.
These initiatives are likely to be led by the private sector, rather than Auckland Transport or the
Transport Agency.

39
Shift to greater focus on influencing travel demand
ATAP highlighted the importance of improving the balance between transport demand and the
capacity of infrastructure and services in achieving a performance step-change. New and emerging
technologies provide new opportunities to influence demand, including moving over time to a smarter
transport pricing system that varies charges according to the time and location of travel.
The Auckland Smarter Transport Pricing Project has commenced and will undertake an investigation to
inform decisions on whether or not to proceed with introducing smarter transport pricing in Auckland.
This will involve a detailed options analysis process aimed at developing a system that can improve the
performance of Auckland’s transport network in a way that supports wider economic, social and
environmental outcomes.
One element of demand management is encouraging higher vehicle occupancy. There are already
initiatives in place to encourage higher vehicle occupancy, including priority lanes for high-occupancy
vehicles, carpooling applications and ride share parking spots at public transport hubs. Existing
programmes such as travel planning, walking school buses and travel management initiatives with
businesses also help to manage demand. Longer-term initiatives may include connected or
autonomous vehicles and ride share platforms.
Innovation in the area of ridesharing is expected to be led by the private sector, but public sector
agencies have a role to play in encouraging progress through understanding and reducing regulatory
barriers, promoting pilot schemes, ensuring open access to data and exploring opportunities to
reallocate road space where it increases overall throughput.
6.6 Reducing harm to people and the environment
Improving road safety
In 2015 and 2016 Deaths and Serious Injuries on the Auckland network have increased. Particularly
impacted are vulnerable road users. Half of these serious injuries involve pedestrians, cyclists and
motorcyclists. This reflects the increasing vulnerability of these growing alternative transport choices
on a local road network that is struggling to accommodate them safely. Additionally, over the past five
years there has been a 54% increase in deaths and serious injuries on the state highway network, of
this the bulk were serious injuries.
Maori are over-represented in road deaths and serious injuries. Maori made up 15% of road deaths
and serious injuries in Auckland in 2017, with 114 incidents recorded up from 54 in 2013. Auckland
Transport has developed a specific Maori Road Safety programme Te Ara Haepapa to address this
concerning trend.

40
1 The above graph refers to deaths and serious injuries on local roads (not state highways). Vulnerable Road
Users (pedestrians, cyclists and motorcyclists) have increased from 41% of all Auckland Transport road deaths
and serious injuries in 2012 to 50% in 2016.
While overall safety trends are heading in the wrong direction, targeted efforts in recent years have
delivered improvements. For example:
• A reduction in road deaths and serious injuries among children walking or cycling to school which is related to a combination of speed management, enforcement and road safety promotion.
• Alcohol related road deaths and serious injuries have also decreased by 23% since the introduction of a lower drink-drive limit in December 2014.

41
Reversing this recent increase in deaths and serious injuries will require fundamental changes in our
approach to road safety and a strong cross-agency approach between Auckland Transport, the
Transport Agency, the Police and ACC. This approach is guided by the RoadSafe Auckland strategy,
which has six key components:
• Safe System Management
• Road Safety Promotions (in combination with NZ Police), including advertising, promotion and education to communities to address high risk safety areas
• Safer Communities (with a focus on Pedestrian Accessibility and Safety)
• High-risk Road and Intersection Improvements
• Speed Management, including review of speed limits in high risk areas
• Minor Safety Improvements (for example, intersection, guardrail and signage improvements, traffic calming, pedestrian refuges and pedestrian crossings)
Making progress in this area will require greater investment in engineering safe urban and rural roads
and placing greater priority on safety outcomes, rather than trading it off against travel time.
Benefits of the Road Safety Programme include reduced deaths and serious injuries, reduced air and
noise pollution, increased levels of active transport, health benefits, increased public transport (and
reduced private vehicle) usage, and increased public confidence.
Over the ten-year period there will be investment in:
• low-cost safety improvements, and the Safer Communities and Speed Management programmes;
• high-risk rural and urban roads and intersections. The road network is regularly assessed to identify the highest-risk roads and intersections so that these can be addressed. Safety-related projects on SH1 at Dome Valley, SH22-SH1 (Drury) to Paerata, and Brigham Creek to Waimauku on SH16
• Initiatives to address safety concerns at level crossings, including automatic gates at pedestrian level crossings, level crossing closures and barrier arms for level crossings.
In addition to the above safety focussed activities, all improvement projects (road, public transport and cycling) consider existing safety issues, and apply safe design principles aligned with the Safe System approach identified in the Transport Agency’s Safer Journeys Strategy.
Reducing environmental harm The transport sector produces 18% of New Zealand’s domestic greenhouse gas emissions, with the
vast majority of these coming from road transport. AT already operates a fleet of electric trains for
most of the rail network, and further electric trains are being purchased to provide capacity to cover
the expected electrification of the Pukekohe to Papakura section.

42
Over the next ten-years, other initiatives for reducing greenhouse gas emissions are:
• Increasing vehicle occupancy (including public transport patronage) so that there are less vehicles on the road than would otherwise be the case.
• Facilitating the increased uptake of electric vehicles (this could be by direct provision, by incentivising provision of electric charging facilities by the private sector, or by providing maps of locations).
• Facilitating the introduction of electric buses (Auckland Transport is currently participating in a trial of electric buses sponsored by EECA
• Encouraging walking and cycling, including use of electric bicycles.
Transport infrastructure projects also often have a significant direct impact on the natural
environment. This is managed as much as possible through consultation with affected parties and
through the Resource Management Act and mitigation strategies. Auckland Transport and the
Transport Agency have strong relationships with mana whenua, who provide valuable advice and
input regarding appropriate interventions. One of the mana whenua strategic pou is to minimise
adverse impacts on the natural environment and to preserve and enhance the natural environment.
6.7 Encouraging walking and cycling
Walking and cycling contribute to a wide range of important outcomes, including health benefits,
reducing pollution and providing alternatives to traffic congestion. There is a significant opportunity
for walking and cycling to play more substantial roles in contributing to a more effective Auckland
transport system.

43
Increased uptake of walking and cycling can reduce a number of important negative impacts of
Auckland’s current transport system, including:
• Reducing negative health impacts associated with high dependence on motorised transport and sedentary lifestyles;
• Reducing air, noise and greenhouse gas emissions that impact on local environments and contribute to climate change.
Approximately 6.5 percent of Aucklanders currently commute using active modes (walking or cycling).
The percentage is much higher for those living close to the city centre (around 20% for those living in
the Waitemata Local Board area). Cycling accounts for less than one percent of all household trips and
around one percent of commuter trips.
Walking The opportunity for increased walking in Auckland is to:
• Play an increased role for short commuting trips, especially around the city fringe and other metropolitan centres
• Provide a convenient and affordable way to access public transport, especially to Auckland’s rapid and frequent transport systems
• Provide safe and attractive transport to schools and other education for children, young people and their parents and caregivers.
• Play an increased role for everyday household trips to local shops, community facilities and recreational facilities
• Provide attractive and safe walking facilities and networks in high demand areas such as the city centre and metropolitan centres.
Auckland’s city centre is continually undergoing changes to the street environment to create a world-
class city centre for people. This includes shared spaces, more and improved pedestrian crossings,
signal phasing that prioritises pedestrians and high-quality paving and seating facilities. Other projects
around the region support increased walking through the provision of good quality footpaths,
increasing the width of footpaths, more and improved pedestrian crossings and safer traffic speeds.
The Safer Communities programme is a key mechanism used for increasing walking in selected
neighbourhoods. Priority areas are chosen based on safety risks, the high number of people living
there, and a large number of trip generators like town centres, schools and recreational facilities. The
programme seeks to increase walking by making it safer and easier to walk by:
• Creating streets that give greater priority to pedestrians
• Reducing traffic speeds and making it more consistent
• Improving people’s ability to cross the road safely and easily
• Creating streets that support more compliant and alert driving behaviours
• Supporting these changes with high-quality education to increase active modes and tailor to the community needs

44
Cycling
The opportunity for increased cycling in Auckland is to:
• Play an increased role for short-medium distance commuting trips, with particular value where it can shift trips off congested road and public transport networks;
• Provide connectivity to Auckland’s developing strategic public transport network, increasing its reach and thereby improving transport accessibility to jobs and other opportunities;
• Improve transport accessibility for groups with lower levels of transport choice, including providing a low-cost, convenient transport option for children and young people and other people with poor access to public transport or private vehicle choices; and
• Provide a convenient transport choice for everyday household trips, taking pressure off networks serving key Auckland centres.
Approximately 6.5 percent of Aucklanders currently commute using active modes (walking or cycling).
The percentage is much higher for those living close to the city centre (around 20 per cent for those
living in the Waitemata Local Board area). Cycling accounts for less than one percent of all household
trips and around one percent of commuter trips.
The Cycling Programme proposed in the RLTP seeks to increase cycling mode share to three percent by
2028 and reduce deaths and serious injuries among cyclists by at least 20 percent in the same period.
This will be achieved through provision of safe and attractive cycling infrastructure focusing on access
to the city centre and key rail or bus stations. Encouraging people to access public transport hubs by
walking or cycling will reduce congestion and car parking demand around stations. Encouraging
walking and cycling also has significant environmental and health benefits for Aucklanders.
The Cycling Programme will also focus on short trips, less than 7kms. Aucklanders living in the city
centre and adjacent suburbs have an average commuter trip of 5.1kms. Across the region the majority
of journeys between 8am and 9am are education related, with an average journey length of less than
2km. Encouraging people to walk or cycle for these journeys frees up capacity in the transport
network for journeys that need to be made by vehicle.
The infrastructure investment will be supported by a range of behaviour change activities, supporting
infrastructure such as bike parking facilities at public transport stations, speed management and a key
focus on innovations such as cycle share. Cycle share schemes are extremely convenient for both
tourists and commuters wishing to cycle around the city, but they do have potential safety issues
associated with them. The Transport Agency has developed a Code of Practice aimed at ensuring that
bikes are well-maintained and do not obstruct the public realm.
Perceptions of safety are key for encouraging people to walk or cycle. The programme will aim to
provide facilities that are safe and accessible for people of all ages and abilities.
In addition, a number of major projects including the Southern Corridor Improvements, Northern
Corridor Improvements, Mill Road and Lincoln Road all include walking and cycling components as part
of their design.

45
6.8 Maintaining existing assets
Auckland Transport’s road network assets have a total replacement value of around $12 billion and a
(depreciated) value of $8 billion. These assets are depreciating by $217 million a year or almost
$600,000 per day. Auckland Transport’s public transport assets have a replacement value of $1.4
billion and a depreciated value of $1.13 billion. Improving value for money in the maintenance,
operation and renewal of these assets is therefore critical.
Auckland Transport’s draft Asset Management Plan (AMP) sets out priorities for maintaining and
renewing assets. The bulk of renewals funding will continue to be spent maintaining existing assets in
their current condition, but several changes are anticipated under the new AMP:
• Focus road asset investment on busy roads by prioritising these over (for example) pavement renewals on less busy roads;
• Support the growing use of public transport by keeping pace with the inevitable increases in renewals that will occur with the expansion of the public transport system and increases in service frequency;
• Integrate renewals with new capital projects including minor improvements, safety upgrades and traffic operations; and
• Ensure that all consequential costs arising from the maintenance and renewals of new assets are taken into account over the expected life of these assets
Auckland Transport is also bringing its renewals practice into line with the One Network Road
Classification (ONRC) recommendations developed jointly by the Transport Agency and Local
Government New Zealand. Under the new system, 18% of Auckland’s roads (by length) are classified
as Regional or Arterial. There will be no change to the level of service on these busy roads, which carry
73% of Auckland’s vehicle travel. However, major rehabilitation of local residential roads will be
undertaken later in their lifecycle – by up to five years - than the previous practice. There may be
some impact on resealing expenditure, but overall the new approach is expected to offer better value
for money, with minimal change to the user experience of roads.
Auckland’s state highway system, which includes the motorway network, is a significant national asset,
made up of 11,412 km of roads and associated assets. The total value of the assets along the corridor
is $3.5 billion. The Transport Agency’s maintenance and renewals programme aims to sustain current
levels of service and incrementally improve these where there is gap against the ONRC targets to
improve efficiency without undue service or investment risk.
The focus is on:
• Maintaining and incrementally improving customer service levels against the ONRC targets • Responding to events and incidents to minimise their adverse impact and duration on service
levels • Improving efficiency of long-term service delivery • Continual improvement • Managing service and investment risk sustainably
• Further details are set out in the State Highway Investment Proposal.

46
6.9 Improving Inter-regional connectivity
Auckland plays a huge role in the national economy, and is a critical link between Northland and
Waikato/Bay of Plenty. Ports of Auckland is the country’s largest import container port by volume and
value. Approximately $26.4 billion in trade passes through the port annually which equates with
approximately 31 percent of New Zealand’s total trade. Auckland International Airport handles and
about 15 percent of New Zealand’s foreign trade by value, making it the country’s third largest port
(by value) behind Auckland’s sea port and the Port of Tauranga. Auckland’s freight volume is projected
to increase by 78 percent over the next 30 years.
The Transport Agency’s Long-term Strategic View (LTSV) notes that providing a strong inter-modal
network supports economic growth and investor confidence. Auckland’s inter-regional transport
connections to Northland, Waikato and Bay of Plenty are of particular importance to the national
economy, with the Upper North Island being home to more than 50% of New Zealand’s population.
Major inter-regional transport challenges in the Upper North Island include:
• constraints on the strategic road and rail network where they intersect with local traffic in urban areas; and
• a lack of integrated strategic land use and transport planning across different regions.
Address these challenges will require a focus on:
• ensuring a safe and reliable corridor on State Highway One between Auckland and Whangarei;
• ensuring strong strategic connections between Drury and Tauranga (via the Waikato Region); and
• addressing the challenges of growth in not only Auckland, but also Hamilton and Tauranga.
Specific initiatives to improve connections between the Auckland and Northland regions include the
Puhoi to Warkworth and Warkworth to Wellsford highways, which aim to improve safety, resilience,
throughput and travel time reliability, as well various state highway initiatives in Northland. To the
south, the Waikato Expressway will be complemented by on-going improvements on Auckland’s
Southern Motorway intended to increase throughput. These initiatives would require commitment
and funding from a range of organisations.
The Government has signalled its intention to introduce inter-regional rail services between Auckland,
Hamilton and Tauranga as a means of supporting growth in the towns en-route, helping to address
Auckland’s housing issues, and reducing congestion on the southern motorway. Provision of regional
services would require additional investment in rail network and terminal capacity. Auckland
Transport will work closely with key stakeholders to assist in progressing this initiative.

47
7 Funding issues and funding envelopes
Many of the projects and programmes in this plan have an identified source of funding.
The following programmes of work will be funded from Auckland Council and/or the National
Land Transport Fund (NLTF), although the exact levels of funding will not be determined until
the National Land Transport Plan and Auckland Council’s Long-term Plan are finalised:
• the State Highways renewals and maintenance programme
• local roads renewals and maintenance
• public transport facilities, information and services (net of fare revenue)
The Government and Auckland Council have agreed to share the costs of constructing the City
Rail Link. Funding will be advanced through the Housing Infrastructure Fund for transport
developments in the Northwest of Auckland. Crown Infrastructure Partners will fund and
deliver around $360 million of growth projects in the Drury/Pukekohe/Paerata and Wainui
East/Silverdale/Dairy Flat growth areas.
A number of other major capital projects are underway and will be completed over the next
few years as part of the rolling programme of work. These include walking and cycling
projects, roading improvement projects and public transport interchanges. There will be
significant benefits delivered to Auckland’s transport system through the current three-year
base programme. Other elements of the capital programme will be dependent on the level of
NLTF and Auckland Council funding available.
The Government has also announced that mass rapid transit (in particular light rail) is a
priority, and that funding will be made available for this investment. The Government is also
currently reviewing the Government Policy Statement on Land Transport (GPS) and the
Auckland Transport Alignment Package (ATAP) which are likely to have an impact on final
decisions around the RLTP.
At the time of preparing this draft RLTP document, total funding levels are still uncertain.
Auckland Council is consulting on rates levels and funding options through its draft LTP. This includes
consultation on the introduction of a Regional Fuel Tax to fund some transport projects in Auckland. It
is clear that available funding will enable only a portion of the desirable programme for
Auckland to be delivered. The size of some programmes of work may need to be scaled back.
Over the next few years, work on alternative funding sources and travel demand
management will be critical for raising additional funding and managing better with existing
assets.
Public consultation provides an opportunity to assess the prioritisation of capital projects, as
set out in Chapter 9 below. Feedback from consultation, along with changes to the GPS and
ATAP may result in projects moving up or down within this list, and the overall amount of
available funding may also change.

48
8 Operational, renewal and capital programmes
The tables below provide an overview of the expenditure proposed for operational, renewal and
capital expenditure for the key partners to this RLTP.
A detailed breakdown of prioritised capital projects is provided in chapter 10.
Project type Category
2018/19
$000
2019/20
$000
2020/21
$000
2021/22-2027/28
$000
Local Road 138,494 138,349 136,078 988,908
Bus operations 225,012 236,185 245,230 2,113,154
Rail operations 130,887 119,056 118,008 570,319
Ferry operations 14,606 13,697 16,037 124,714
Other public transport 48,499 48,663 48,252 352,270
Transport planning 9,143 9,825 9,852 68,508
Parking and enforcement 20,401 20,562 20,545 143,541
Local road 168,069 182,845 214,993 2,047,067
Public transport 10,159 12,848 19,340 262,522
Footpath and cycleways 18,349 19,998 23,708 227,380
Parking and others renewals 10,771 11,114 12,129 103,361
Local road improvements 458,040 548,179 693,511 2,518,930
Network growth 17,293 45,280 111,666 1,757,988
Public transport 26,503 135,105 96,492 885,001
Walking and cycling 64,984 6,512 6,717 57,901
Total 1,361,210 1,548,219 1,772,558 12,221,565
Auckland Transport
Capital expenditure
Operational expenditure
Renewal expenditure
Project type Category
2018/19
$000
2019/20
$000
2020/21
$000
2021/22-2027/28
$000
State highway operations and
maintenance 76,230 77,502 78,976 266,000
Transport planning 564 - - -
Renewal expenditure State highway renewals 44,178 55,680 51,264 191,000
Capital expenditureState highway, walking and
cycling improvements 1,207,070 988,181 959,513 2,147,614
Total 1,328,042 1,121,364 1,089,753 2,604,614
Auckland Highway & Network Operations
Operational expenditure
Project type Category
2018/19
$000
2019/20
$000
2020/21
$000
2021/22-2027/28
$000
Capital Expenditure Rail Development Project
Total
City Rail Link
Project type Category
2018/19
$000
2019/20
$000
2020/21
$000
2021/22-2027/28
$000
Capital expenditure Rail network improvements
Total
KiwiRail
Project type Category
2018/19
$000
2019/20
$000
2020/21
$000
2021/22-2027/28
$000
Operational expenditure Local road maintenance 17 17 19 -
Capital expenditure Local road improvements - - 100 -
Total 17 17 119 -
Department of Conservation

49
9 Measuring outcomes
The activities in this plan are aimed at addressing the problems set out in Chapter 4 and delivering the
benefits outlined in Chapter 5. The extent to which the benefits will be realised depends on the level
of funding available, as discussed in Chapter 7. Measures have been identified to monitor progress
against each benefit area. These measures are aligned with measures in the Auckland Plan and the
SOIs of the various transport organisations in Auckland.
RLTP Benefits Measures:
Source
The transport network will
support a faster rate of housing
and business growth.
• Number of new housing units in selected areas supported by transport investment
• Measured by Auckland Council
Access to employment/labour
will improve relative to current
levels, supporting economic
growth and increasing
productivity.
• Number of jobs accessible by car within a 30-minute trip in the AM peak
• Number of jobs accessible by public transport within a 45-minute trip in the AM peak
• Measured by MR Cagney every three years
• Measured by MR Cagney every three years
Congestion will improve relative
to projected levels – in particular
travel time and reliability in the
peak period will improve, and
congestion will not become
widespread during working
hours.
• Average vehicle occupancy rates
• Proportion of the freight network operating at level C or above during the inter-peak
• Vehicle km travelled per capita
• Measured by Ministry of Transport
• Auckland Transport’s Statement of Intent
• Measured by Ministry of Transport and Statistics New Zealand
Public transport and active mode
shares will increase relative to
vehicle use.
• Proportion of students walking/cycling to school
• Number of PT boardings per capita
• Number of cycle movements past selected count sites across the region (including CBD)
• Measured by Auckland Transport’s school surveys
• Measured by Auckland Transport
• Measured by Auckland Transport
There will be a reduction in harm
from the transport system on
people and the environment.
• Level of greenhouse gas emissions
• DSI per 100m vehicle kilometres travelled
• Measured by Ministry for the Environment
• Measured by Auckland Transport
Public investment in the
transport system delivers value
for money.
• Net public transport operating costs per passenger kilometre
• Measured by Auckland Transport

50
10 Prioritised list of projects
The table below shows the prioritised list of projects (that align with the priorities for this RLTP, and
ATAP and the draft GPS) which form the basis of the capital programmes proposed for Auckland
Transport, the Transport Agency, KiwiRail, Department of Conservation and City Rail Link Limited for
the Regional Land Transport Plan 2018-28.
While funding levels are uncertain (as noted in chapter 7 above), and not all Auckland Transport
activities in the detailed tables are expected to receive subsidy from the Transport Agency through
the National Land Transport Programme or the Long-term Plan, they are shown for consultation
purposes (those that currently sit below indicative funding levels are shown beneath the green
highlighted row). The prioritised programme has been developed giving consideration to the
proposed timing of projects, however both the timing and prioritisation of projects is subject to
change based on feedback through consultation and any signalled changes to funding levels through
the finalisation of both the GPS and the Long-term Plan.
The programme shows all significant land transport projects and activities that will be carried out in
Auckland over the next three years in detail, and the proposed programme for the 2021-28
programme, however the outer years of the programme will be further evaluated for the 2021
Regional Land Transport Plan review.
Details of Projects and Priorities
Key: I = Investigation, D = Design, C = Construction, P = Property

51
TRANSPORT AGENCY ACTIVITIES
Projects with Commitments and Council Ring-fenced Projects2018/19 2019/20 2020/21
2021/22 to
2027/28
Total RLTP
Cost
$'000 $'000 $'000 $'000 $'000
Additional Waitemata Harbour Crossing (Planning
and Route Protection)13,287 15,980 0 29,267
Auckland Metro Rolling Stock (Tranche 2) 5,299 99,684 7,948 0 112,931
Cycling Programme - AT (completion of 2015-18
Programme)53,040 0 53,040
Cycling Programme - Glen Innes to Tamaki Dr
Shared Path0 0
Dominion Road Bus Lane Improvements 12,480 0 12,480
East West (FN32) Bus Network 25,480 21,632 0 47,112
Franklin Road Improvements 6,000 6,000
Local Board Transport Capital Fund 10,670 11,097 11,541 91,086 124,395
Local Residential Growth Fund (Growth
Infrastructure Fund)24,100 10,200 18,750 338,000 391,050
LRGF - Dairy Flat Highway Upgrade 2,000 7,500 7,350 0 16,850
LRGF - Gills Road Link 700 10,000 13,000 0 23,700
LRGF - Glenbrook 300 0 300
LRGF - Hingaia - Kuhanui Drive / Hingaia Road
Intersection and Papaka Road (Stage 1)1,200 0 1,200
LRGF - Hingaia - Oakland Road / Hingaia Road
Intersection500 0 500
LRGF - Hingaia - Park Estate Road / Great
South Road Intersection500 0 500
LRGF - Hingaia - Park Estate Road / SH1
Pedestrian and Cycling Bridge500 0 500
LRGF - Hingaia Road Widening 5,000 0 5,000
LRGF - Kumeu / Huapai SHA 10,000 0 10,000
LRGF - Medallion Drive Link 700 300 6,900 13,000 20,900
LRGF - Scott's Point 500 9,500 0 10,000
Manukau Harbour Crossing 15,903 0 15,903
Murphys Road Upgrade 6,240 4,954 0 11,194
Papakura Park and Ride 5,200 0 5,200
Renewals - Auckland Transport 181,250 200,704 242,106 2,375,752 2,999,813
Renewals - Auckland Transport Corporate 6,240 6,490 6,749 53,267 72,746
Renewals - Cliff Road 520 0 520
Rosedale Busway Station (AT Contribution) 3,120 10,275 47,244 0 60,639
Seal Extensions 3,120 3,245 3,375 26,633 36,373
SH1 : Dome Valley Safety Improvements 7,813 11,157 9,754 0 28,725
SH1 : Northern Corridor Improvements (incl.
Busway Extension to Albany)213,921 175,923 168,927 73,582 632,353
SH1 : Puhoi to Warkworth 8,413 7,622 11,156 511,784 538,976
SH1 : Southern Corridor Improvements 55,263 0 55,263
Taharoto / Wairau Road Improvement (Stage 3) 728 1,622 2,250 0 4,600
Tamaki Regeneration 5,096 13,412 10,011 12,429 40,948
Warkworth - Matakana Link Road 28,427 34,871 44,185 0 107,483
Western Ring Route 8,426 1,578 0 10,004
Wynyard Integrated Road Programme 18,720 28,122 17,998 23,485 88,324

52
On-going Operational Requirements2018/19 2019/20 2020/21
2021/22 to
2027/28
Total RLTP
Cost
$'000 $'000 $'000 $'000 $'000
Business Technology - AT HOP Programme 7,813 8,126 8,451 20,878 45,268
Business Technology - AT Metro (Base) 936 973 1,012 7,990 10,912
Business Technology - Modelling Programme 5,880 5,880
Bus Priority Programme (Base) 4,522 4,703 4,891 38,600 52,715
Digital Technology - Metro Services 7,010 7,291 7,583 59,844 81,728
Dominion Road Double Decker Bus
Improvements9,465 9,465
Encroachments and Legalisations (Base) 1,299 1,351 1,405 11,086 15,139
Improvements Complementing Developments 936 973 1,012 7,990 10,912
Intelligent Transport Programme - Emerging
Technologies (Base)3,016 3,137 3,262 25,746 35,160
Intelligent Transport Systems - One Network 5,200 2,920 5,624 0 13,745
Level Crossing Improvements 127,374 127,374
Local Road Improvements (support Transport
Agency Initiatives)5,771 0 5,771
Low Cost / Low Risk - State Highway 8,500 8,500 8,500 0 25,500
Parking - Minor On-Street works 104 108 112 888 1,212
Parking - Off Street Paid Parking Technology 1,067 2,663 2,308 18,217 24,256
Parking - Pay and Display - On-Street 187 195 202 1,598 2,182
Parking - Residential Parking Permits 146 151 157 1,243 1,697
Parking Programme 1,872 3,677 3,375 6,214 15,138
PT - Minor Improvement Programme 3,120 3,245 3,375 34,072 43,812
PT - Safety, Security and Amenity Improvements 2,704 2,812 2,925 23,082 31,523
Regulatory Controls 104 108 112 888 1,212
Safety Programme (inc. Minor Improvements,
Red Light Cameras, Safer Communities, Speed
Management)
21,944 22,822 23,735 202,880 271,380
Seismic Strengthening 1,067 1,110 2,250 20,482 24,909
Street Light Improvements - LED Programme 5,228 5,660 8,194 35,416 54,498
Street Light Improvements - Regionwide 320 333 346 2,733 3,732

53
Priority Ranked Capital Projects RLTP ProfileTransport Agency Activity
ClassPhase(s)
2018/19 2019/20 2020/21
2021/22 to
2027/28
Total RLTP
Cost
$'000 $'000 $'000 $'000 $'000
1 Lincoln Road Corridor Improvements Road Improvement - Local I, D, C, P 11,648 19,469 30,371 23,172 84,660
2 Supporting Growth - South - Rangi Road Road Improvement - Local D, C, P 171,373 171,373
3 Mill Road Corridor Improvements Road Improvement - Local D, C, P 67,600 73,549 141,733 224,656 507,538
4Supporting Growth - North West - SH6 to SH18
ConnectionRoad Improvement - SH I, D, C, P 10,568 6,531 159,202 175,814 352,114
5 Network Performance - Travel Demand (Base) Road Improvement - Local D, C 8,320 10,816 13,498 165,690 198,324
6 Park and Ride - South Public Transport I, D, C 12,489 12,489
7 Eastern Busway (previously AMETI) - Stage 2Public Transport / Road
Improvement - LocalI, D, C, P 14,902 35,429 106,654 154,117 311,102
8 Carrington Road Upgrade Road Improvement - Local I, D, C, P 22,172 22,172
9 Supporting Growth (Planning / Route Protection) Road Improvement - Local I 10,540 10,962 10,876 48,962 81,340
10 Park and Ride - Albany Public Transport C 2,704 11,249 0 13,953
11 Auckland Metro Rolling Stock (Tranche 3) Public Transport I, D, C 11,249 238,910 250,159
12 Wiri Depot - Stabling Public Transport I, D, C, P 79,971 79,971
13 Wiri Depot - Extension Public Transport I, D, C 58,799 58,799
14 North Western Rapid Transit Corridor (Stations) Public Transport D, C, P 227,695 227,695
15North Western Rapid Transit Corridor (State
Highway Component)0 0
16Smales Allens Road - Widening and Intersection
ImprovementRoad Improvement - Local D, C, P 13,637 13,637
17 Park and Ride - East Public Transport I, D, C 38,525 38,525
18 Eastern Busway (previously AMETI) - Stage 1 Road Improvement - Local D, C, P 41,766 77,345 48,898 0 168,009
19 Eastern Busway (previously AMETI) - Stage 3 Road Improvement - Local I, D, C, P 46,847 58,476 43,405 194,925 343,653
20Intelligent Transport Programme - Emerging
Technologies (Enhanced)Road Improvement - Local C 2,288 2,380 2,475 19,531 26,673
21 Supporting Growth - Southern Stations Public Transport I, D, C, P 51,413 51,413
22Supporting Growth - North - Wainui North / South
ConnectionsRoad Improvement - Local D, C, P 2,521 11,400 145,180 159,101
23Supporting Growth - North West - Redhills
Network (Coatesville Riverhead Highway)Road Improvement - Local D, C, P 9,866 25,081 279,209 314,156
24Supporting Growth - North West - Redhills
Network (Fred Taylor Drive Stage 2)Road Improvement - Local D, C, P 1,096 27,361 106,487 134,944
25 Regional Safety Programme - Urban Road Improvement - Local I, D, C, P 4,160 5,138 14,061 121,415 144,773
26 Business Technology - AT Metro (Enhanced) Public Transport C 25,365 25,365
27 Regional Safety Programme - Rural Road Improvement - Local I, D, C, P 5,200 6,490 6,749 53,267 71,706
28 Regional Improvement Projects Road Improvement - Local I, D, C, P 63,413 63,413
29 Business Technology - Customer Central Public Transport C 62,742 62,742

54
Priority Ranked Capital Projects RLTP ProfileTransport Agency Activity
ClassPhase(s)
2018/19 2019/20 2020/21
2021/22 to
2027/28
Total RLTP
Cost
$'000 $'000 $'000 $'000 $'000
30 Seismic Streghtening - Quay Street Seawall Road Improvement - Resilience C 5,200 16,224 44,995 0 66,419
31 Business Technology - Customer Experience Public Transport C 47,940 47,940
32 Northern Busway Extension to Grand Drive Road Improvement - Local I, D, C, P 30,397 30,397
33Supporting Growth - North West - Squadron
Drive Interchange ImprovementsRoad Improvement - SH I, D, C, P 1,437 21,770 11,211 11,548 45,966
34Supporting Growth - North West - Totara / Trig
Road ExtensionRoad Improvement - Local D, C, P 1,096 2,166 39,283 42,545
35Sylvia Park Bus Lanes (part of AMETI
Programme)Road Improvement - Local C, P 16,347 3,102 0 19,449
36 Network Optimisation along Western Ring Route Road Improvement - SH I, D, C, P 8,032 0 8,032
37 Airport Access - Eastern State Highway Road Improvement - SH I, D, C 7,695 1,633 1,682 490,423 501,433
38 Downtown Interchange Public Transport D, C 35,592 35,592
39 City Centre Bus Infrastructure - Wellesley Street Road Improvement - Local I, D, C 58,472 58,472
40 City Centre Bus Infrastructure - Learning Quarter Public Transport I, D, C 58,472 58,472
41 Cycling Programme - City Centre Access Walking and Cycling I, D, C 2,546 8,672 17,904 150,422 179,544
42 SH16 Gladstone to Alten Road 0 0
43 SH16 Stanley Street Pedestrian Crossing 0 0
44 Eastern Busway (previously AMETI) - Stage 4 Road Improvement - Local I, D, C, P 728 541 7,113 58,799 67,181
45Eastern Busway (previously AMETI) - Stage 4 -
Botany Park and RidePublic Transport I, D, C 127 3,764 3,891
46 Henderson Bus Interchange Public Transport I, D, c 675 1,738 2,413
47 Supporting Growth - South - Drury Road Improvement - Local D, C, P 63,958 63,958
48Supporting Growth - South - SH1 Papakura to
Bombay HillsRoad Improvement - SH D, C, P 2,219 10,885 131,173 234,419 378,696
49Additional Waitemata Harbour Crossing (Planning
and Route Protection)Road Improvement - SH D, C, P 140,716 140,716
50 Bus Priority Programme (Enhanced) Road Improvement - Local C 4,954 5,152 7,980 216,897 234,983
51 Puhinui Bus/Rail Interchange Public Transport I, D, C, P 5,304 29,744 16,873 0 51,921
52 Park and Ride - Westgate Public Transport C, P 9,360 5,192 0 14,552
53Supporting Growth - North - East-West
ConnectionsRoad Improvement - Local D, C, P 2,412 15,961 84,816 103,189
54Ormiston / Preston / East Tamaki Road
ReconfigurationRoad Improvement - Local D, C 572 4,813 11,249 0 16,634
55Airport Access - Short to Medium Term
ImprovementsPublic Transport I, D, C, P 1,040 8,112 6,749 0 15,901
56Airport Access - Short to Medium Term
Improvements (State Highway Component)0 0
57Cycling Programme - Connections to Rapid
Transit Network StationsWalking and Cycling I, D, C 2,701 7,935 2,797 198,695 212,127
58 City Centre Bus Infrastructure Public Transport I, D, C, P 60,036 60,036

55
Priority Ranked Capital Projects RLTP ProfileTransport Agency Activity
ClassPhase(s)
2018/19 2019/20 2020/21
2021/22 to
2027/28
Total RLTP
Cost
$'000 $'000 $'000 $'000 $'000
59 Penlink Toll Road Road Improvement - Local D, C, P 336,189 336,189
60Airport Access - Airport to City Centre (Planning
and Route Protection)
Public Transport / Road
Improvement - LocalI, D, C, P 5,200 10,816 14,623 671,974 702,613
61Airport Access - Airport to City Centre (State
Highway Component)0 0
62Business Technology - Enterprise Asset
ManagementRoad Improvement - Local C 26,234 26,234
63 Business Technology - ??? C 5,200 5,408 0 10,608
64 Business Technology - ??? I, D, C 24,014 24,014
65 Airport Access - Airport to Botany Road Improvement - Local I, D, C, P 11,440 5,408 11,249 216,812 244,909
66 Supporting Growth - Strategic Route to Pukekohe Road Improvement - SH I, D 8,487 2,850 4,032 0 15,370
67 East West Link Road Improvement - SH C, P 1,633 1,682 44,853 48,167
68 Downtown Ferry Basin Development (Stage 1) Public Transport I, D, C 52,631 52,631
69 Auckland Network Operating Plan Road Improvement - SH I 597 0 597
70City Centre Bus Infrastructure - Albert / Vincent
Street ImprovementsRoad Improvement - Local I, D, C 6,779 6,779
71 Neighbourhood Interchange Programme Public Transport I, D, C, P 65,258 65,258
72Cycling Programme - Connections to
Metropolitan CentresWalking and Cycling I, D, C, P 239 2,508 2,522 97,408 102,677
73Supporting Growth - North West - Westgate to
Greenhithe Rapid Transit NetworkRoad Improvement - Local D, C 52,256 52,256
74
Support Growth - North West - Westgate to
Greenhithe Rapid Transit Network (State
Highway Component)
0 0
75 Encroachments and Legalisations (Enhanced) Not Applicable C 1,040 1,082 1,125 8,878 12,124
76 Route Protection - Future Priorities Road Improvement - Local I 63,405 63,405
77 Park and Ride - West Public Transport C, P 1,012 1,506 2,518
78 SH1 : East Tamaki Interchange Upgrade Road Improvement - SH I 2,416 2,416
79 SH1 : Khyber Pass to Gillies Avenue Upgrade Road Improvement - SH I 3,591 3,591
80SH1 : Greenlane and Ellerslie Panmure
Interchange ImprovementsRoad Improvement - SH I 4,256 4,256
81 Improved Access to Port / Grafton Gully (Stage 2) Road Improvement - SH I 4,256 4,256
82 Noise Wall Programme Road Improvement - SH I, D, C, P 94,712 0 94,712
83Airport Access - City Centre to Mt Roskill
Implementation
Public Transport / Road
Improvement - LocalC 861,164 861,164
84Network Performance - Travel Demand
(Enhanced)Road Improvement - Local C 5,624 329,116 334,740
85Supporting Growth - South - Pukekohe Inner
LinkRoad Improvement - Local D, C, P 57,831 57,831
86 Supporting Growth - North - Penlink to Bawden Road Improvement - Local D, C P 38,977 38,977
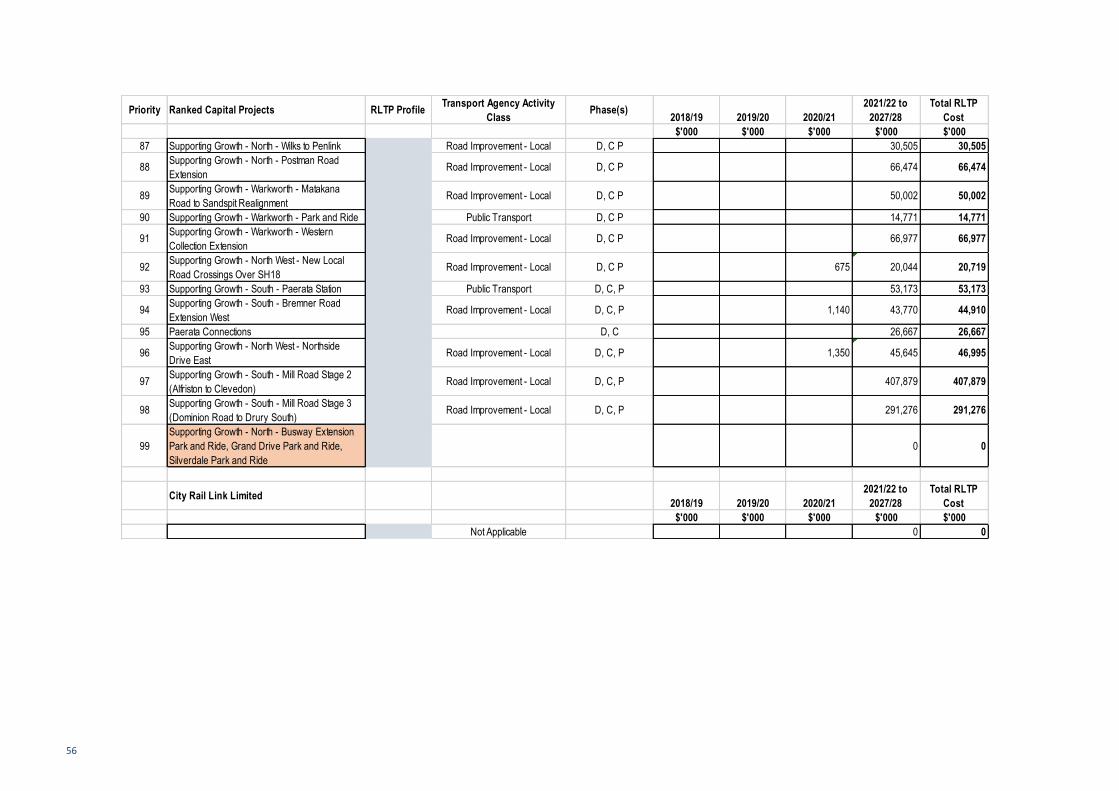
56
Priority Ranked Capital Projects RLTP ProfileTransport Agency Activity
ClassPhase(s)
2018/19 2019/20 2020/21
2021/22 to
2027/28
Total RLTP
Cost
$'000 $'000 $'000 $'000 $'000
87 Supporting Growth - North - Wilks to Penlink Road Improvement - Local D, C P 30,505 30,505
88Supporting Growth - North - Postman Road
ExtensionRoad Improvement - Local D, C P 66,474 66,474
89Supporting Growth - Warkworth - Matakana
Road to Sandspit RealignmentRoad Improvement - Local D, C P 50,002 50,002
90 Supporting Growth - Warkworth - Park and Ride Public Transport D, C P 14,771 14,771
91Supporting Growth - Warkworth - Western
Collection ExtensionRoad Improvement - Local D, C P 66,977 66,977
92Supporting Growth - North West - New Local
Road Crossings Over SH18Road Improvement - Local D, C P 675 20,044 20,719
93 Supporting Growth - South - Paerata Station Public Transport D, C, P 53,173 53,173
94Supporting Growth - South - Bremner Road
Extension WestRoad Improvement - Local D, C, P 1,140 43,770 44,910
95 Paerata Connections D, C 26,667 26,667
96Supporting Growth - North West - Northside
Drive EastRoad Improvement - Local D, C, P 1,350 45,645 46,995
97Supporting Growth - South - Mill Road Stage 2
(Alfriston to Clevedon)Road Improvement - Local D, C, P 407,879 407,879
98Supporting Growth - South - Mill Road Stage 3
(Dominion Road to Drury South)Road Improvement - Local D, C, P 291,276 291,276
99
Supporting Growth - North - Busway Extension
Park and Ride, Grand Drive Park and Ride,
Silverdale Park and Ride
0 0
City Rail Link Limited2018/19 2019/20 2020/21
2021/22 to
2027/28
Total RLTP
Cost
$'000 $'000 $'000 $'000 $'000
Not Applicable 0 0
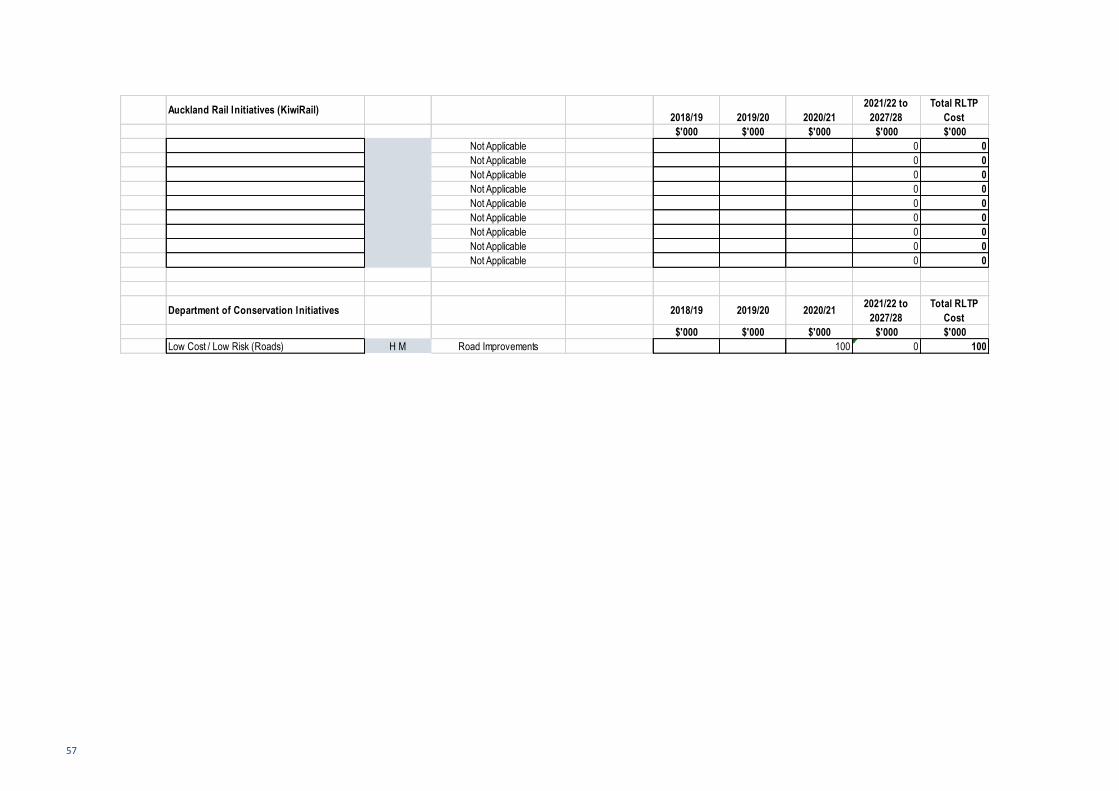
57
Auckland Rail Initiatives (KiwiRail)2018/19 2019/20 2020/21
2021/22 to
2027/28
Total RLTP
Cost
$'000 $'000 $'000 $'000 $'000
Not Applicable 0 0
Not Applicable 0 0
Not Applicable 0 0
Not Applicable 0 0
Not Applicable 0 0
Not Applicable 0 0
Not Applicable 0 0
Not Applicable 0 0
Not Applicable 0 0
Department of Conservation Initiatives 2018/19 2019/20 2020/212021/22 to
2027/28
Total RLTP
Cost
$'000 $'000 $'000 $'000 $'000
Low Cost / Low Risk (Roads) H M Road Improvements 100 0 100

58
Appendix 1: Significance Policy
Background
2.1.1 Requirement to develop a Significance Policy
Section 106(2) of the Land Transport Management Act (LTMA) 2003 requires Auckland Transport to
“adopt a policy that determines significance in respect of:
(a) variations made to the regional land transport plan under section 18D; and
(b) the activities that are included in the regional land transport plan under section 16”.
In adopting its Significance Policy, Auckland Transport is acting in its role as the Regional Transport
Committee for Auckland.
Purpose:
This policy sets out how to:
1. Determine what is a significant activity for the purpose of section 16(3)(d) of the LTMA 2003.
2. Determine the significance of variations to the Auckland RLTP in accordance with section
106(2) of the Act.
3. Determine what is a significant expenditure from other sources in the Auckland RLTP in
accordance with section 16(2)(c) of the Act.
2.1.2 Auckland Council Significance Policy
Auckland Council adopted its Significance and Engagement Policy (25) in November 2014, following
public consultation. The council's Significance and Engagement Policy is required by the Section
76AA of the Local Government Act 2002 and is distinct from Auckland Transport's Significance Policy.
Auckland Council's Significance and Engagement Policy applies to Auckland Transport through the
CCO Accountability Policy.
Some extracts from Auckland Council's policy are quoted below for context:
"The council's thresholds relevant to determining significance are:
• creating a new group of activities;
• stopping carrying out a group of activities;
• increasing (by 33 per cent or more) or decreasing (by 20 per cent decrease or more) spending on a group of activity;
• Transferring the ownership or control of our strategic assets.
Where a decision meets any of these criteria it will be "significant" and will automatically trigger a
requirement to consult."[...]
"."[...]
"The governing body and local boards will consider the following matters when determining the
degree of significance of a decision:
• the number of people affected, the degree to which they are affected and the likely impact of a decision;

59
• whether this type of decision has a history of generating wide public interest within the local board area (for a local board decision) or Auckland or New Zealand generally (for a governing body decision);
• the impact of the decision on the governing body or local board ability to deliver on actions that contribute to the Auckland Plan, as well as any statutory responsibility;
• the impact of the decision on intended service levels for a group of activities, including the start/or stop of any group of activity;
• The degree to which the decision or proposal can be reversed should circumstances warrant."
2.2 Auckland Transport's Significance Policy
Auckland Transport is committed to involving the public in decisions which affect them.
Auckland Transport will undertake public consultation, in accordance with the consultation
principles set out in the Local Government Act, for decisions which it determines are significant
under this Significance Policy.
The RLTP can be varied at any time. In accordance with section 18D of the Act, consultation will be
required on a variation if the variation is deemed to be significant.
If a change to the RLTP is not considered significant, then the change can be made by Auckland
Transport. This includes making the decision in an open and transparent way, and consulting with
those affected, in a way appropriate to the scale of the decision.
The following decisions are significant:
• Decisions which are defined in legislation as significant. This includes o Review of the Regional Land Transport Plan at least every six years; o Replacing or varying this significance policy; and o Any decision involving transfer of ownership or control of a strategic asset.
• Any decision involving transfer of ownership or control of an asset defined by Auckland Council as a strategic asset. Auckland Council has defined as strategic assets any Auckland Council or Auckland Transport-owned asset which is integral to the functioning of:
o The public transport network, including Britomart; and o The roading network
• A new Auckland Transport activity or project, or a change to the scope of an Auckland Transport activity or project, which the Auckland Transport Board considers to represent a 30 per cent or greater increase or a 20 per cent or greater decrease in the nature of a group of activities. The groups of activities delivered by Auckland Transport are defined in Auckland Council's 2018 Long-term Plan and are:
o public transport and travel demand management; o roads and footpaths o parking and enforcement.
• The inclusion of a new activity by the Transport Agency, that increases expenditure by more than $10 million and/or increases expenditure in the relevant activity class by more than 10 per centre, relative to the totals set out in Chapter 10 of this RLTP.
• The inclusion of a construction phase by the Transport Agency for a Transport Agency project with a total activity or project cost greater than 10 per cent of the appropriate activity class in this RLTP (State Highway Improvements or Walking and Cycling).
• Changes to the scope of an activity or project, whether delivered by Auckland Transport or the Transport Agency, that increases expenditure by more than $10 million and/or increases expenditure in the relevant activity class by more than 10 per cent, relative to the totals set out in Chapter 10 of this RLTP.

60
• Public transport decisions which represent a significant variation to the Regional Public Transport Plan (see Section 3.2.1 below).
• Any other decision which Auckland Transport considers to be a significant variation to this Regional Land Transport Plan (see Section 3.2.2 below).
The following decisions will generally not be significant:
• Replacement of an activity or project by another activity or project of the same or substantially similar type.
• Cost or timing changes that do not affect the scope of an activity or project.
• A change arising from the decision of a third party (for example, the declaration or revocation of a State Highway by the Transport Agency).
• An increase in revenue or decrease in costs which does not significantly change the nature of a group of activities (as defined by Auckland Council) or activity class (as defined by the Transport Agency).
• A decision to progress emergency works.
2.2.1 Varying the Regional Public Transport Plan
Auckland Transport recognises that changes to the nature of the public transport network have
historically been of high public interest, can affect residents and ratepayers both positively and
negatively, and can be difficult or impossible to reverse. Therefore, variations the Regional Public
Transport Plan are subject to a more restrictive Significance Policy, as set out in the RPTP.
2.2.2 Varying this Regional Land Transport Plan
Legislation provides for this Regional Land Transport Plan to remain in force for six years. However,
the plan must be reviewed by Auckland Transport, having regard to the views of representative
groups of land transport users and providers, after three years. Following the review, or where good
reason exists, a variation to the RLTP may be prepared by Auckland Transport. The process of
varying the RLTP involves the same steps as preparing the RLTP.
Where necessary due to changing circumstances, a variation to the RLTP may be prepared by
Auckland Transport, acting on behalf of the Regional Transport Committee, before the three-yearly
review.
When considering the significance of a variation, Auckland Transport will consider the following
criteria:
• The extent to which Auckland Transport has responsibility for the relevant activity or project which is subject to the variation.
• Whether the variation has already been consulted on under the Land Transport Management Act 2003 or the Local Government Act 2002, in which case further consultation may be unnecessary.
• The extent to which there is, or is likely to be, a change in the capacity of the parties to the Regional Land Transport Plan (Auckland Transport, the Transport Agency, KiwiRail) to deliver its statutory objective, including giving effect to their Statements of Intent and this Regional Land Transport Plan.
• Alignment with the parties plans and programmes and the Government Policy Statement.
• The costs and benefits of the consultation process.

61
Auckland Transport will use the following procedures in considering future variations to the Regional
Land Transport Plan, and this policy on significance:
• Where possible, and if it is not contrary to the consultation principles of the Local Government Act, consultation on significant variations to this Regional Land Transport Plan will be carried out via the Auckland Council Annual Plan consultation process.
2.3 Inclusion of activities in this Regional Land Transport
Plan
An activity must be named and prioritised in this Regional Land Transport Plan if it has a total cost of
$5 million or more. Projects may either be included separately, or presented as part of a group,
package or programme.

62
Glossary
AC Auckland Council AMETI Auckland-Manukau Eastern Transport Initiative AT Auckland Transport BCR Benefit to cost ratio CRL City Rail Link FTN Frequent Transit Network (key bus and ferry routes) GPS Government Policy Statement on land transport funding HNO Transport Agency’s Highways Network and Operations responsible for
state highways HPMV High productivity motor vehicles KPIs Key performance indicators LGA Local Government Act 2002 LTMA Land Transport Management Act 2003 NLTF National Land Transport Fund NLTP National Land Transport Programme NorSGA Northern Strategic Growth Area NZTA NZ Transport Agency RLTP Regional Land Transport Plan RoNS Roads of National Significance RTN Rapid Transit Network (passenger rail and Northern Busway) SH State Highway