Open Joint Stock Company Obyedinenniye … 2013.pdfNon-controlling Interest ... Stock Company...
59
Open Joint Stock Company Obyedinenniye Mashinostroitelniye Zavody (Uralmash-Izhora Group) International Financial Reporting Standards Consolidated Financial Statements and Auditors’ Report 31 December 2013
-
Upload
nguyenminh -
Category
Documents
-
view
219 -
download
0
Transcript of Open Joint Stock Company Obyedinenniye … 2013.pdfNon-controlling Interest ... Stock Company...

Open Joint Stock Company Obyedinenniye Mashinostroitelniye Zavody (Uralmash-Izhora Group) International Financial Reporting Standards Consolidated Financial Statements and Auditors’ Report 31 December 2013

OMZ Consolidated Financial Statements for the year ended 31 December 2013
Contents AUDITORS’ REPORT Consolidated Statement of Financial Position ............................................................................................................... 1 Consolidated Statement of Profit or Loss and Other Comprehensive Income .............................................................. 2 Consolidated Statement of Cash Flows ......................................................................................................................... 3 Consolidated Statement of Changes in Equity .............................................................................................................. 5 Notes to the Consolidated Financial Statements 1. The OMZ Group and its Operations ..................................................................................................................... 6 2. Basis of Preparation .............................................................................................................................................. 7 3. Summary of Significant Accounting Policies ....................................................................................................... 8 4. Critical Accounting Estimates and Judgements in Applying Accounting Policies ............................................ 19 5. Adoption of New of Revised Standards and Interpretation and Changes in Accounting Policies ..................... 20 6. New Accounting Pronouncements ..................................................................................................................... 21 7. Segment Information .......................................................................................................................................... 22 8. Balances and Transactions with Related Parties ................................................................................................. 27 9. Cash and Cash Equivalents................................................................................................................................. 28 10. Trade and Other Receivables .............................................................................................................................. 29 11. Inventories .......................................................................................................................................................... 30 12. Other Current Financial Assets ........................................................................................................................... 30 13. Property, Plant and Equipment ........................................................................................................................... 31 14. Intangible Assets ................................................................................................................................................ 33 15. Other Non-Current Financial Assets .................................................................................................................. 34 16. Other Non-Current Assets .................................................................................................................................. 34 17. Trade and Other Accounts Payable .................................................................................................................... 34 18. Borrowings ......................................................................................................................................................... 35 19. Other Long-Term Liabilities .............................................................................................................................. 36 20. Equity. ................................................................................................................................................................ 37 21. Construction Contracts ....................................................................................................................................... 38 22. Cost of Sales ....................................................................................................................................................... 38 23. Selling Expenses ................................................................................................................................................. 39 24. General and Administrative Expenses ................................................................................................................ 39 25. Other Operating Income and Expense ................................................................................................................ 39 26. Finance Income and Costs .................................................................................................................................. 40 27. Income Tax ......................................................................................................................................................... 40 28. Provisions for Liabilities and Charges ................................................................................................................ 43 29. Contingencies, Commitments and Operating Risks ........................................................................................... 44 30. Earnings per Share .............................................................................................................................................. 45 31. Principal Subsidiaries ......................................................................................................................................... 45 32. Business Combinations and Disposals ............................................................................................................... 46 33. Investments in associates .................................................................................................................................... 47 34. Non-controlling Interest ..................................................................................................................................... 48 35. Financial Risk and Capital Management ............................................................................................................ 50 36. Fair Value of Financial Instruments ................................................................................................................... 54 37. Reconciliation of Classes of Financial Instruments with Measurement Categories ........................................... 55


OMZ Consolidated Statement of Profit or Loss and Other Comprehensive Income for the year ended 31 December 2013 (in thousands of US dollars unless otherwise stated)
The accompanying notes on pages 6-55 are an integral part of these consolidated financial statements
2
Note
Year ended 31 December
2013
Year ended 31 December
2012 Sales 21 1 045 985 969 905Cost of sales 22 (838 100) (703 657)Gross profit 207 885 266 248 Selling expenses 23 (34 212) (36 608)General and administrative expenses 24 (106 068) (97 041)Other operating income 25 4 388 8 547Other operating expense 25 (14 451) (11 264)Operating profit 57 542 129 882 Finance income 26 12 489 10 570Finance costs 26 (39 967) (28 585)Share of loss of associate 33 (489) -Profit before taxation 29 575 111 867 Income tax expense 27 (13 024) (27 430)Profit for the year 16 551 84 437 Other comprehensive income: Items that may be reclassified to profit or loss: Foreign currency translation differences 2 458 (905)Cash flow hedges, net of income tax (1 897) 152Items that will never be reclassified to profit or loss: Foreign currency translation differences (27 426) 18 459Other comprehensive (loss) / income, net of income tax (26 866) 17 706Total comprehensive (loss) / income (10 315) 102 143 Profit for the year attributable to: Equity holders of the Company 12 524 58 060Non-controlling interest 4 027 26 377Profit for the year 16 551 84 437 Comprehensive (loss)/income attributable to: Equity holders of the Company (10 486) 71 261Non-controlling interest 171 30 882Total comprehensive (loss) / income (10 315) 102 143 Earnings per share attributable to the equity holders of the Company (in US dollars) - basic 30 0,0691 1,8772- diluted 30 0,0691 1,8772
Earnings from continuing operations per share attributable to the ordinary equity holders of the parent entity (in US dollars) - basic 30 0,0691 1,8772- diluted 30 0,0691 1,8772
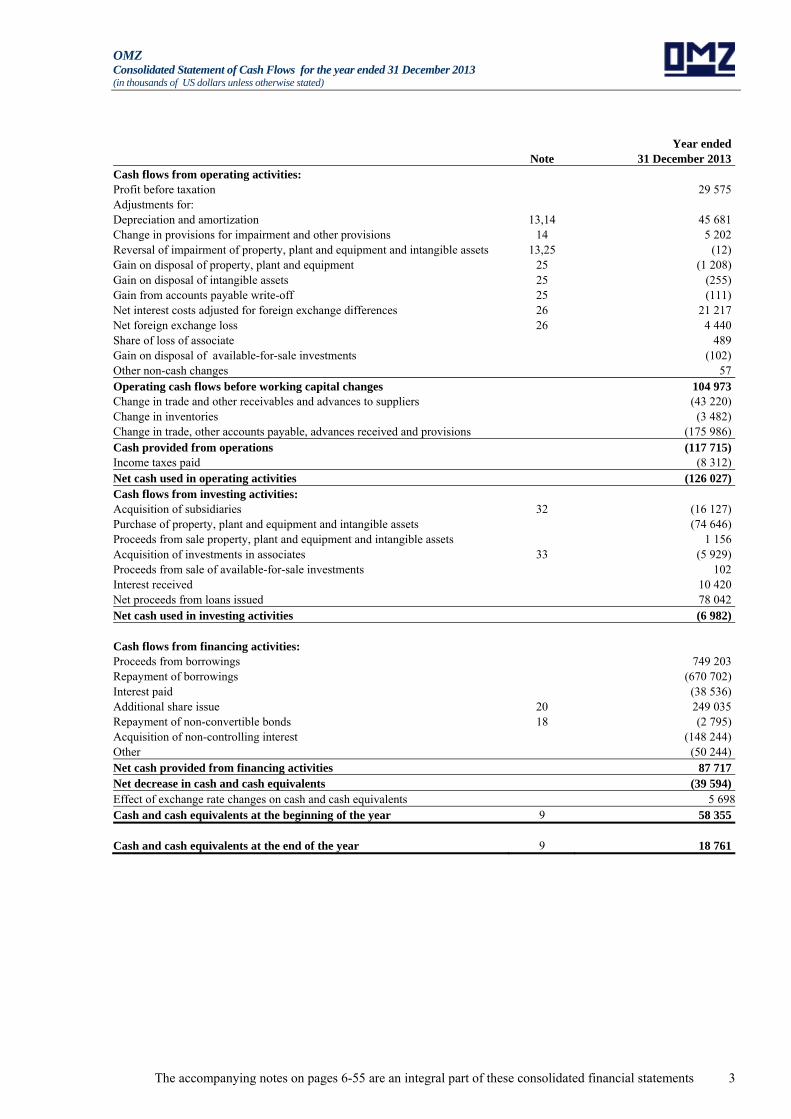
OMZ Consolidated Statement of Cash Flows for the year ended 31 December 2013 (in thousands of US dollars unless otherwise stated)
The accompanying notes on pages 6-55 are an integral part of these consolidated financial statements 3
Note Year ended
31 December 2013Cash flows from operating activities: Profit before taxation 29 575Adjustments for: Depreciation and amortization 13,14 45 681Change in provisions for impairment and other provisions 14 5 202Reversal of impairment of property, plant and equipment and intangible assets 13,25 (12)Gain on disposal of property, plant and equipment 25 (1 208)Gain on disposal of intangible assets 25 (255)Gain from accounts payable write-off 25 (111)Net interest costs adjusted for foreign exchange differences 26 21 217Net foreign exchange loss 26 4 440Share of loss of associate 489Gain on disposal of available-for-sale investments (102)Other non-cash changes 57Operating cash flows before working capital changes 104 973Change in trade and other receivables and advances to suppliers (43 220)Change in inventories (3 482)Change in trade, other accounts payable, advances received and provisions (175 986)Cash provided from operations (117 715)Income taxes paid (8 312)Net cash used in operating activities (126 027)Cash flows from investing activities: Acquisition of subsidiaries 32 (16 127)Purchase of property, plant and equipment and intangible assets (74 646)Proceeds from sale property, plant and equipment and intangible assets 1 156Acquisition of investments in associates 33 (5 929)Proceeds from sale of available-for-sale investments 102Interest received 10 420Net proceeds from loans issued 78 042Net cash used in investing activities (6 982)
Cash flows from financing activities: Proceeds from borrowings 749 203Repayment of borrowings (670 702)Interest paid (38 536)Additional share issue 20 249 035Repayment of non-convertible bonds 18 (2 795)Acquisition of non-controlling interest (148 244)Other (50 244)Net cash provided from financing activities 87 717Net decrease in cash and cash equivalents (39 594)Effect of exchange rate changes on cash and cash equivalents 5 698Cash and cash equivalents at the beginning of the year 9 58 355
Cash and cash equivalents at the end of the year 9 18 761
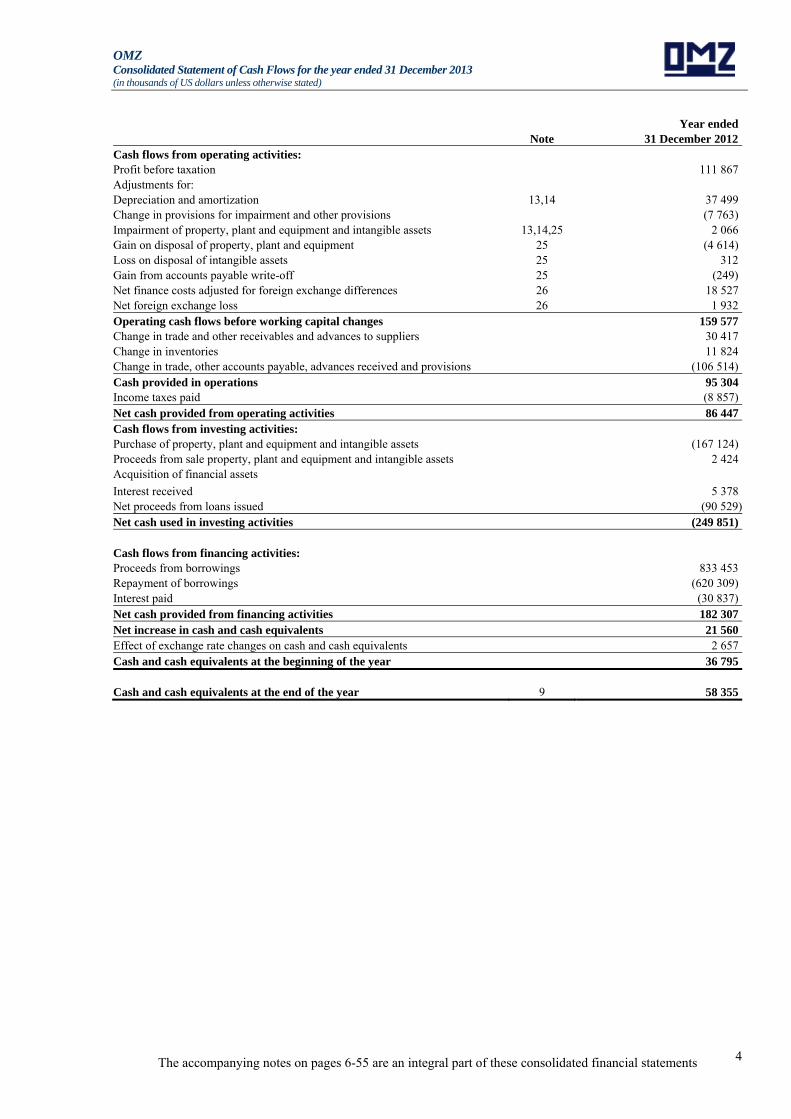
OMZ Consolidated Statement of Cash Flows for the year ended 31 December 2013 (in thousands of US dollars unless otherwise stated)
The accompanying notes on pages 6-55 are an integral part of these consolidated financial statements 4
Note Year ended
31 December 2012Cash flows from operating activities: Profit before taxation 111 867Adjustments for: Depreciation and amortization 13,14 37 499Change in provisions for impairment and other provisions (7 763)Impairment of property, plant and equipment and intangible assets 13,14,25 2 066Gain on disposal of property, plant and equipment 25 (4 614)Loss on disposal of intangible assets 25 312Gain from accounts payable write-off 25 (249)Net finance costs adjusted for foreign exchange differences 26 18 527Net foreign exchange loss 26 1 932Operating cash flows before working capital changes 159 577Change in trade and other receivables and advances to suppliers 30 417Change in inventories 11 824Change in trade, other accounts payable, advances received and provisions (106 514)Cash provided in operations 95 304Income taxes paid (8 857)Net cash provided from operating activities 86 447Cash flows from investing activities: Purchase of property, plant and equipment and intangible assets (167 124)Proceeds from sale property, plant and equipment and intangible assets 2 424Acquisition of financial assets
Interest received 5 378Net proceeds from loans issued (90 529)Net cash used in investing activities (249 851)
Cash flows from financing activities: Proceeds from borrowings 833 453Repayment of borrowings (620 309)Interest paid (30 837)Net cash provided from financing activities 182 307Net increase in cash and cash equivalents 21 560Effect of exchange rate changes on cash and cash equivalents 2 657Cash and cash equivalents at the beginning of the year 36 795
Cash and cash equivalents at the end of the year 9 58 355
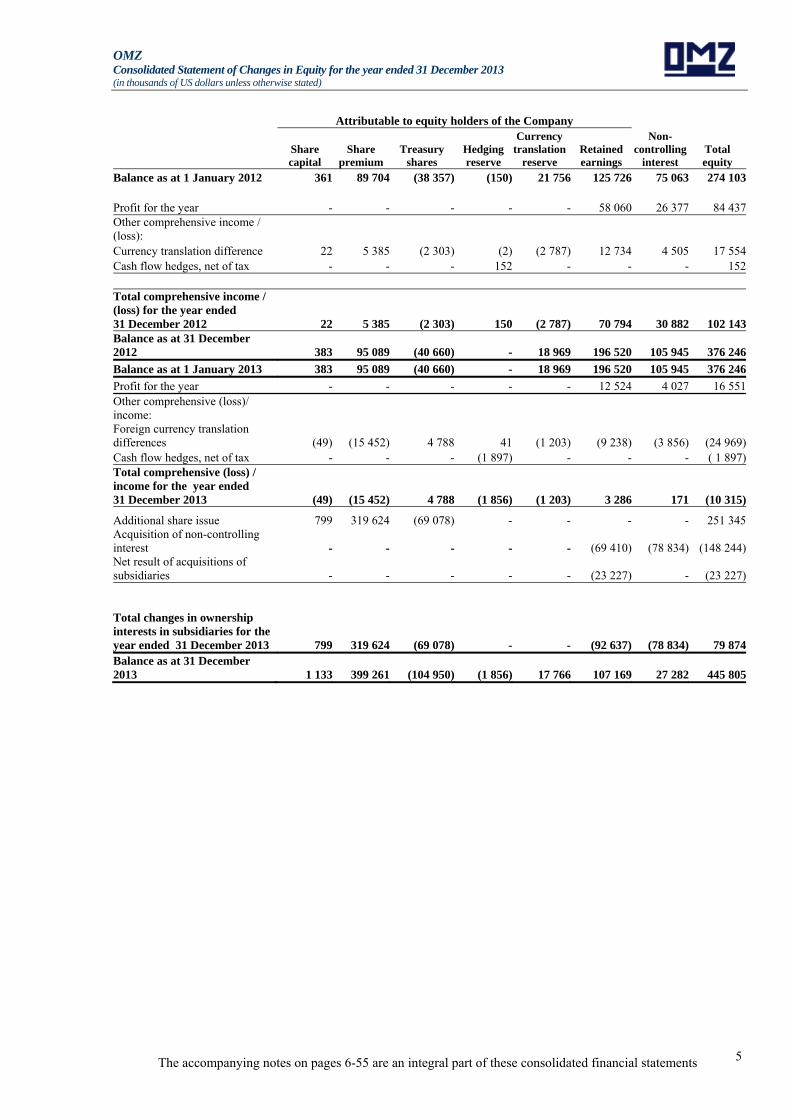
OMZ Consolidated Statement of Changes in Equity for the year ended 31 December 2013 (in thousands of US dollars unless otherwise stated)
The accompanying notes on pages 6-55 are an integral part of these consolidated financial statements 5
Attributable to equity holders of the Company Non-
controlling interest
Total equity
Share capital
Share premium
Treasury shares
Hedging reserve
Currency translation
reserve Retained earnings
Balance as at 1 January 2012 361 89 704 (38 357) (150) 21 756 125 726 75 063 274 103 Profit for the year - - - - - 58 060 26 377 84 437Other comprehensive income / (loss): Currency translation difference 22 5 385 (2 303) (2) (2 787) 12 734 4 505 17 554Cash flow hedges, net of tax - - - 152 - - - 152 Total comprehensive income / (loss) for the year ended 31 December 2012 22 5 385 (2 303) 150 (2 787) 70 794 30 882 102 143Balance as at 31 December 2012 383 95 089 (40 660) - 18 969 196 520 105 945 376 246
Balance as at 1 January 2013 383 95 089 (40 660) - 18 969 196 520 105 945 376 246
Profit for the year - - - - - 12 524 4 027 16 551Other comprehensive (loss)/ income: Foreign currency translation differences (49) (15 452) 4 788 41 (1 203) (9 238) (3 856) (24 969)Cash flow hedges, net of tax - - - (1 897) - - - ( 1 897)Total comprehensive (loss) / income for the year ended 31 December 2013 (49) (15 452) 4 788 (1 856) (1 203) 3 286 171 (10 315)
Additional share issue 799 319 624 (69 078) - - - - 251 345Acquisition of non-controlling interest - - - - - (69 410) (78 834) (148 244)Net result of acquisitions of subsidiaries - - - - - (23 227) - (23 227)
Total changes in ownership interests in subsidiaries for the year ended 31 December 2013 799 319 624 (69 078) - - (92 637) (78 834) 79 874Balance as at 31 December 2013 1 133 399 261 (104 950) (1 856) 17 766 107 169 27 282 445 805

OMZ Notes to the Consolidated Financial Statements for the year ended 31 December 2013 (in thousands of US dollars unless otherwise stated)
6
1. The OMZ Group and its Operations
These consolidated financial statements have been prepared in accordance with International Financial Reporting Standards for the year ended 31 December 2013. These consolidated financial statements incorporate the operations of Open Joint Stock Company Obyedinenniye Mashinostroitelniye Zavody (Uralmash-Izhora Group) (the “Company”) and its subsidiaries (together referred to as the “Group” or “OMZ”).
Open Joint Stock Company Obyedinenniye Mashinostroitelniye Zavody (Uralmash-Izhora Group) was incorporated as an open joint stock company in Ekaterinburg, the Russian Federation in 1996 and was established in accordance with Russian regulations. OMZ’s principal subsidiaries are disclosed in Note 31. These are incorporated under the Laws of the Russian Federation and the Czech Republic. For details of changes in the Group structure during the year ended 31 December 2013 refer to Note 32.
Principal activities. The Group operates in the following industries and countries: production of nuclear power plant equipment in the Russian Federation and in the Czech Republic, and production of speciality steels, manufacturing machinery equipment and mining equipment in the Russian Federation. The Group is engaged in delivery of high tech industry products through provision of engineering, procurement and construction services (including assembly and installation) under EPC-contracts.
Registered address.
The Company’s current registered address is:
Russian Federation Moscow Ovchinnikovskaya nab., 20 building 2
Operating environment of the Group. The Group, through its operations, has a significant exposure to the economy and financial markets of the Russian Federation and the Czech Republic.
Russian Business Environment. The Russian Federation has been experiencing political and economic change that has affected, and may continue to affect, the activities of enterprises operating in this environment. Consequently, operations in the Russian Federation involve risks that typically do not exist in other markets. The consolidated financial statements reflect management’s assessment of the impact of the Russian business environment on the operations and the financial position of the Group. The future business environment may differ from management’s assessment.
The tax, currency and customs legislation within the Russian Federation is subject to varying interpretations and frequent changes. The future economic situation in the Russian Federation is largely dependent upon the effectiveness of economic, financial and monetary measures undertaken by the Government, together with tax, legal, regulatory and political developments.

OMZ Notes to the Consolidated Financial Statements for the year ended 31 December 2013 (in thousands of US dollars unless otherwise stated)
7
2. Basis of Preparation
Statement of compliance.
The Company had also prepared the consolidated financial statements of the Group in accordance with IFRS and the requirements of federal law №208-FZ «About consolidated financial statements » in the Russian Rouble (“RR”) as the presentation currency, for which an audit opinion was issued on 14 April, 2014.
Basis of measurement. The consolidated financial statements are prepared on the historical cost basis except for:
derivative financial instruments, stated at fair value;
the carrying amounts of non-monetary assets, liabilities and equity items in existence at 31 December 2002 include adjustments for the effects of hyperinflation, which were calculated using conversion factors derived from the Russian Federation Consumer Price Index published by the Russian Statistics Agency, GosKomStat. Russia ceased to be hyperinflationary for IFRS purposes as at 1 January 2003.
Functional currency. The functional currency of each of the Group’s consolidated entities is the currency of the primary economic environment in which the entity operates. The functional currency for the Group’s subsidiaries located in Russia is the national currency of the Russian Federation, the Russian Rouble (“RR”). The functional currency for the Group’s subsidiaries located in the Czech Republic is the national currency of the Czech Republic, the Czech Koruna (“CZK”).
Presentation currency. These consolidated financial statements are presented in US Dollars (“US$”) as management believes this is more convenient for users. All financial information has been rounded to the nearest thousand unless otherwise stated.
Foreign currency transactions. Transactions denominated in foreign currencies are translated into the respective functional currencies of Group entities at exchange rates at the dates of the transactions. Monetary assets and liabilities denominated in foreign currencies at the reporting date are translated into each entity’s functional currency at exchange rates at that date. The foreign currency gain or loss on monetary items is the difference between amortised cost in the functional currency at the beginning of the period, adjusted for effective interest and payments during the period, and the amortised cost in foreign currency translated at the end of the period. Non-monetary assets and liabilities denominated in foreign currencies that are measured at fair value are translated to the functional currency at the exchange rate at the date that fair value was determined. Foreign currency differences arising on translation are recognised in profit or loss, except for differences arising on the translation of available-for-sale equity instruments which are recognised in other comprehensive income. Non-monetary items that are measured in terms of historical cost in a foreign currency are translated using the exchange rate at the date of the transaction.
Translation from functional to presentation currency. The results and financial position of each group entity (none of which have a functional currency of a hyperinflationary economy) are translated into the presentation currency as follows:
(i) assets and liabilities are translated into US$ at the exchange rate at the reporting date;
(ii) income and expenses for each statement of profit or loss and other comprehensive income are translated into US $ at average exchange rates (unless this average is not a reasonable approximation of the cumulative effect of the rates prevailing on the transaction dates, in which case income and expenses are translated at the dates of the transactions); and
(iii) all resulting exchange differences are recognised directly in other comprehensive income and presented in the currency translation reserve.
Foreign operations located in the Czech Republic with the functional currency CZK are first translated into RR and then further translated into the presentation currency US$. The assets and liabilities of foreign operations are translated to RR at the exchange rates at the reporting date. The income and expenses of foreign operations are translated to RR at the exchange rates at the dates of the transactions. Foreign currency differences arising from translation of CZK to RR are recognised in other comprehensive income, and presented in the currency translation reserve in equity.
Goodwill and fair value adjustments arising on the acquisition of a foreign operation are treated as assets and liabilities of the foreign operation and are translated at the exchange rates at the reporting date. When a foreign operation is disposed of, in part or in full, through sale, liquidation, repayment of share capital or abandonment, the relevant amount of the foreign currency translation reserve is transferred to profit or loss as part of the profit or loss on disposal.
OMZ Notes to the Consolidated Financial Statements for the year ended 31 December 2013 (in thousands of US dollars unless otherwise stated)
8
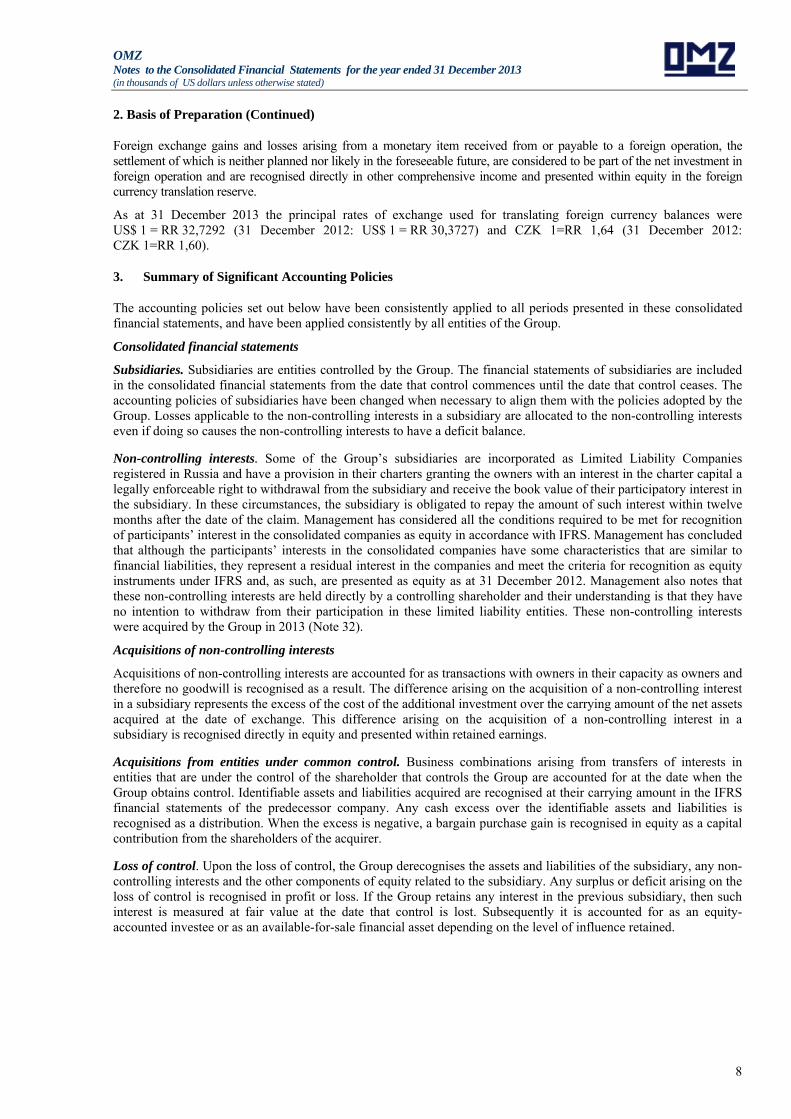
2. Basis of Preparation (Continued)
Foreign exchange gains and losses arising from a monetary item received from or payable to a foreign operation, the settlement of which is neither planned nor likely in the foreseeable future, are considered to be part of the net investment in foreign operation and are recognised directly in other comprehensive income and presented within equity in the foreign currency translation reserve.
As at 31 December 2013 the principal rates of exchange used for translating foreign currency balances were US$ 1 = RR 32,7292 (31 December 2012: US$ 1 = RR 30,3727) and CZK 1=RR 1,64 (31 December 2012: CZK 1=RR 1,60).
3. Summary of Significant Accounting Policies
The accounting policies set out below have been consistently applied to all periods presented in these consolidated financial statements, and have been applied consistently by all entities of the Group.
Consolidated financial statements
Subsidiaries. Subsidiaries are entities controlled by the Group. The financial statements of subsidiaries are included in the consolidated financial statements from the date that control commences until the date that control ceases. The accounting policies of subsidiaries have been changed when necessary to align them with the policies adopted by the Group. Losses applicable to the non-controlling interests in a subsidiary are allocated to the non-controlling interests even if doing so causes the non-controlling interests to have a deficit balance.
Non-controlling interests. Some of the Group’s subsidiaries are incorporated as Limited Liability Companies registered in Russia and have a provision in their charters granting the owners with an interest in the charter capital a legally enforceable right to withdrawal from the subsidiary and receive the book value of their participatory interest in the subsidiary. In these circumstances, the subsidiary is obligated to repay the amount of such interest within twelve months after the date of the claim. Management has considered all the conditions required to be met for recognition of participants’ interest in the consolidated companies as equity in accordance with IFRS. Management has concluded that although the participants’ interests in the consolidated companies have some characteristics that are similar to financial liabilities, they represent a residual interest in the companies and meet the criteria for recognition as equity instruments under IFRS and, as such, are presented as equity as at 31 December 2012. Management also notes that these non-controlling interests are held directly by a controlling shareholder and their understanding is that they have no intention to withdraw from their participation in these limited liability entities. These non-controlling interests were acquired by the Group in 2013 (Note 32).
Acquisitions of non-controlling interests
Acquisitions of non-controlling interests are accounted for as transactions with owners in their capacity as owners and therefore no goodwill is recognised as a result. The difference arising on the acquisition of a non-controlling interest in a subsidiary represents the excess of the cost of the additional investment over the carrying amount of the net assets acquired at the date of exchange. This difference arising on the acquisition of a non-controlling interest in a subsidiary is recognised directly in equity and presented within retained earnings.
Acquisitions from entities under common control. Business combinations arising from transfers of interests in entities that are under the control of the shareholder that controls the Group are accounted for at the date when the Group obtains control. Identifiable assets and liabilities acquired are recognised at their carrying amount in the IFRS financial statements of the predecessor company. Any cash excess over the identifiable assets and liabilities is recognised as a distribution. When the excess is negative, a bargain purchase gain is recognised in equity as a capital contribution from the shareholders of the acquirer.
Loss of control. Upon the loss of control, the Group derecognises the assets and liabilities of the subsidiary, any non-controlling interests and the other components of equity related to the subsidiary. Any surplus or deficit arising on the loss of control is recognised in profit or loss. If the Group retains any interest in the previous subsidiary, then such interest is measured at fair value at the date that control is lost. Subsequently it is accounted for as an equity-accounted investee or as an available-for-sale financial asset depending on the level of influence retained.
OMZ Notes to the Consolidated Financial Statements for the year ended 31 December 2013 (in thousands of US dollars unless otherwise stated)
9
3. Summary of Significant Accounting Policies (Continued)
Investments in associates. Investments in associates (generally investments of between 20% to 50% in a company’s equity) where the Group exercises significant influence are accounted for using the equity method unless they are classified as assets held for sale. Goodwill arising on the acquisition is included in the carrying value of the investment (net of any accumulated impairment loss). Dividends received from associates reduce the carrying value of the investment in associates. Other post-acquisition changes in the Group’s share of net assets of an associate are recognized as follows: (a) the Group’s share of profits or losses is recorded in the consolidated profit or loss for the year as share of result of associates; (b) the Group’s share of other comprehensive income is recognized in other comprehensive income and presented separately. Unrealized gains on transactions between the Group and its associates are eliminated to the extent of the Group’s interest in the associates; unrealized losses are also eliminated unless the transaction provides evidence of an impairment of the asset transferred. When the investee incurs losses the Group recognizes its share of losses until the carrying amount of the investment is reduced to nil. Recognition of further losses is discontinued.
Transactions eliminated on consolidation. Intra-group balances and transactions, and any unrealised income and expenses arising from intra-group transactions, are eliminated in preparing the consolidated financial statements. Unrealised gains arising from transactions with equity accounted investees are eliminated against the investment to the extent of the Group’s interest in the investee. Unrealised losses are eliminated in the same way as unrealised gains, but only to the extent that there is no evidence of impairment.
Financial instruments – key measurement terms. Depending on their classification financial instruments are carried at fair value or amortised cost as described below.
Fair value is the amount for which an asset could be exchanged, or a liability settled, between knowledgeable, willing parties in an arm’s length transaction. Fair value is the current bid price for financial assets and current asking price for financial liabilities which are quoted in an active market. For assets and liabilities with offsetting market risks, the Group may use mid-market prices as a basis for establishing fair values for the offsetting risk positions and apply the bid or asking price to the net open position as appropriate. A financial instrument is regarded as quoted in an active market if quoted prices are readily and regularly available from an exchange or other institution and those prices represent actual and regularly occurring market transactions on an arm’s length basis.
Valuation techniques such as discounted cash flows models or models based on recent arm’s length transactions or consideration of financial data of the investment object are used to fair value certain financial instruments for which external market pricing information is not available. Valuation techniques may require assumptions not supported by observable market data. Disclosures are made in these consolidated financial statements if changing any such assumptions to a reasonably possible alternative would result in significantly different profit, income, total assets or total liabilities.
Transaction costs are incremental costs that are directly attributable to the acquisition, issue or disposal of a financial instrument. An incremental cost is one that would not have been incurred if the transaction had not taken place. Transaction costs include fees and commissions paid to agents (including employees acting as selling agents), advisors, brokers and dealers, levies by regulatory agencies and securities exchanges, and transfer taxes and duties. Transaction costs do not include debt premiums or discounts, financing costs or internal administrative or holding costs.
Amortised cost is the amount at which the financial instrument was recognised at initial recognition less any principal repayments, plus accrued interest, and for financial assets less any write-down for incurred impairment losses. Accrued interest includes amortisation of transaction costs deferred at initial recognition and of any premium or discount to maturity amount using the effective interest method.
The effective interest method is a method of allocating interest income or interest expense over the relevant period so as to achieve a constant periodic rate of interest (effective interest rate) on the carrying amount. The effective interest rate is the rate that exactly discounts estimated future cash payments or receipts (excluding future credit losses) through the expected life of the financial instrument or a shorter period, if appropriate, to the net carrying amount of the financial instrument. The effective interest rate discounts cash flows of variable interest instruments to the next interest repricing date except for the premium or discount which reflects the credit spread over the floating rate specified in the instrument, or other variables that are not reset to market rates. Such premiums or discounts are amortised over the whole expected life of the instrument. The present value calculation includes all fees paid or received between parties to the contract that are an integral part of the effective interest rate.

OMZ Notes to the Consolidated Financial Statements for the year ended 31 December 2013 (in thousands of US dollars unless otherwise stated)
10
3. Summary of Significant Accounting Policies (Continued)
Non-derivative financial instruments
Non-derivative financial instruments comprise investments in equity and debt securities, trade and other receivables, cash and cash equivalents, loans and borrowings, and trade and other payables. The Group initially recognises loans and receivables and deposits on the date that they are originated. All other financial assets (including assets designated at fair value through profit or loss) are recognised initially on the trade date at which the Group becomes a party to the contractual provisions of the instrument.
The Group derecognises a financial asset when the contractual rights to the cash flows from the asset expire, or it transfers the rights to receive the contractual cash flows on the financial asset in a transaction in which substantially all the risks and rewards of ownership of the financial asset are transferred. Any interest in transferred financial assets that is created or retained by the Group is recognised as a separate asset or liability.
Financial assets and liabilities are offset and the net amount presented in the statement of financial position when, and only when, the Group has a legal right to offset the amounts and intends either to settle on a net basis or to realise the asset and settle the liability simultaneously.
The Group has the following non-derivative financial assets: loans and receivables and available-for-sale financial assets.
Loans and receivables Loans and receivables are a category of financial assets with fixed or determinable payments that are not quoted in an active market. Such assets are recognised initially at fair value plus any directly attributable transaction costs. Subsequent to initial recognition loans and receivables are measured at amortised cost using the effective interest method, less any impairment losses. Loans and receivables comprise trade and other receivables and cash and cash equivalents. Cash and cash equivalents Cash and cash equivalents comprise cash balances and call deposits with original maturities of three months or less. Bank overdrafts that are repayable on demand and form an integral part of the Group’s cash management are included as a component of cash and cash equivalents for the purpose of the statement of cash flows.
Available-for-sale financial assets Available-for-sale financial assets are non-derivative financial assets that are designated as available-for-sale and that are not classified in any of the previous categories. The Group’s investments in equity securities and certain debt securities are classified as available-for-sale financial assets. Such assets are recognised initially at fair value plus any directly attributable transaction costs. Subsequent to initial recognition, they are measured at fair value and changes therein, other than impairment losses and foreign currency differences on available-for-sale equity instruments, are recognised in other comprehensive income and presented within equity in the fair value reserve. When an investment is derecognised or impaired, the cumulative gain or loss in other comprehensive income is transferred to profit or loss.
Investments in equity securities that are not quoted on a stock exchange are principally valued using valuation techniques such as discounted cash flow analysis, option pricing models and comparisons to other transactions and instruments that are substantially the same. Where fair value cannot be reliably measured, investments are stated at cost less impairment losses. Impairment of non-derivative financial assets A financial asset not carried at fair value through profit or loss is assessed at each reporting date to determine whether there is any objective evidence that it is impaired. A financial asset is impaired if objective evidence indicates that a loss event has occurred after the initial recognition of the asset, and that the loss event had a negative effect on the estimated future cash flows of that asset that can be estimated reliably.

OMZ Notes to the Consolidated Financial Statements for the year ended 31 December 2013 (in thousands of US dollars unless otherwise stated)
11
3. Summary of Significant Accounting Policies (Continued)
Objective evidence that financial assets (including equity securities) are impaired can include default or delinquency by a debtor, restructuring of an amount due to the Group on terms that the Group would not consider otherwise, indications that a debtor or issuer will enter bankruptcy, adverse changes in the payment status of borrowers or issuers in the Group, economic conditions that correlate with defaults or the disappearance of an active market for a security. In addition, for an investment in an equity security, a significant or prolonged decline in its fair value below its cost is objective evidence of impairment. Loans and receivables The Group considers evidence of impairment for loans and receivables at both a specific asset and collective level. All individually significant loans and receivables are assessed for specific impairment. All individually significant loans and receivables found not to be specifically impaired are then collectively assessed for any impairment that has been incurred but not yet identified. Loans and receivables that are not individually significant are collectively assessed for impairment by grouping together loans and receivables with similar risk characteristics. In assessing collective impairment the Group uses historical trends of the probability of default, timing of recoveries and the amount of loss incurred, adjusted for management’s judgement as to whether current economic and credit conditions are such that the actual losses are likely to be greater or less than suggested by historical trends. An impairment loss in respect of a financial asset measured at amortised cost is calculated as the difference between its carrying amount, and the present value of the estimated future cash flows discounted at the asset’s original effective interest rate. Losses are recognised in profit or loss and reflected in an allowance account against loans and receivables. Interest on the impaired asset continues to be recognised through the unwinding of the discount. When a subsequent event causes the amount of impairment loss to decrease, the decrease in impairment loss is reversed through profit or loss. Available-for-sale financial assets Impairment losses on available-for-sale financial assets are recognised by reclassifying the losses accumulated in the fair value reserve in equity, to profit or loss. The cumulative loss that is reclassified from equity to profit or loss is the difference between the acquisition cost, net of any principal repayment and amortisation, and the current fair value, less any impairment loss previously recognised in profit or loss. Changes in impairment provisions attributable to application of the effective interest method are reflected as a component of interest income. If, in a subsequent period, the fair value of an impaired available-for-sale debt security increases and the increase can be related objectively to an event occurring after the impairment loss was recognised in profit or loss, then the impairment loss is reversed, with the amount of the reversal recognised in profit or loss. However, any subsequent recovery in the fair value of an impaired available-for-sale equity security is recognised in other comprehensive income.
Non-derivative financial liabilities
The Group initially recognises debt securities issued and subordinated liabilities on the date that they are originated. All other financial liabilities (including liabilities designated at fair value through profit or loss) are recognised initially on the trade date at which the Group becomes a party to the contractual provisions of the instrument.
The Group derecognises a financial liability when its contractual obligations are discharged or cancelled or expire.
The Group classifies non-derivative financial liabilities into the other financial liabilities category. Such financial liabilities are recognised initially at fair value plus any directly attributable transaction costs. Subsequent to initial recognition these financial liabilities are measured at amortised cost using the effective interest method.
The Group has the following non-derivative financial liabilities: loans and borrowings, bank overdrafts, and trade and other payables.

OMZ Notes to the Consolidated Financial Statements for the year ended 31 December 2013 (in thousands of US dollars unless otherwise stated)
12
3. Summary of Significant Accounting Policies (Continued)
Derivative financial instruments
Derivatives are recognised initially at fair value; attributable transaction costs are recognised in profit or loss as incurred.
The method of accounting for the fair value gain or loss depends on whether the derivative is designated as a hedging instrument or held for trading. Trading derivatives are presented within Other financial assets or within Trade and other payables when their fair value is positive or negative, respectively. Hedging derivatives with less than one year to maturity are presented within Trade and other receivables or within Trade and other payables when their fair value is positive or negative, respectively. Hedging derivatives with more than one year to maturity are presented as Other non-current financial assets or within Other long-term liabilities when their fair value is positive or negative, respectively. The Group designates as hedging instruments only those contracts, for which it assesses at the hedge inception that the derivative that is used in the hedging transaction is highly effective in offsetting changes in cash flows of the hedged item, and for which proper documentation of the hedging relationship is in place.
The Group uses derivatives to hedge future cash flows. The Group classifies as hedging derivatives only those derivatives that hedge changes in cash flows from highly probable future transactions caused by changes in currency exchange rates and against changes in cash flows from highly probable future transactions caused by changes in commodity prices.
Changes in the fair value of derivatives that qualify as effective cash flow hedges are recognised in the hedging reserve in other comprehensive income. Where a hedged forecasted transaction or firm commitment results in the recognition of a non-financial asset or of a non-financial liability, the gains and losses previously deferred in the hedging reserve are recycled from the hedging reserve and are included in the initial cost of the asset or liability. When a hedged forecasted transaction or firm commitment results in the recognition of a financial asset or of a financial liability, the amounts deferred in the hedging reserve are recycled to profit and loss and classified as income or expense in the periods during which the hedged item affects the profit and loss.
When a hedging instrument expires or is sold, terminated or exercised, or when a hedge no longer meets the criteria for hedge accounting or the Group revokes the hedged derivative designation, any cumulative gain or loss on the hedging instrument, from the period when the hedge was effective, remains recognised in other comprehensive income until the forecast transaction occurs. Derivatives which do not meet the criteria for hedge accounting, or where the Group revokes the hedged derivative designation, are classified as trading derivatives.
When a forecasted transaction is no longer expected to occur, the cumulative gain or loss that was recognised in other comprehensive income is immediately recycled to profit and loss and classified as financial income or financial expense.
Changes in the fair value of derivatives for trading are classified as financial income or financial expense.
The fair value of financial instruments that are not traded in an active market is determined by using valuation techniques, such as discounting the future cash flows or option models. The fair value of forward foreign exchange contracts is determined as the present value of future cash flows based on forward exchange market rates as at the balance sheet date. Fair value of commodity swaps is the present value of future cash flows from commodity derivatives based on the forward price taken from London Metal Exchange as the balance sheet date.
Certain derivative instruments embedded in other financial instruments are treated as separate derivative instruments when their risks and characteristics are not closely related to those of the host contract.
Certain derivative instruments do not qualify for hedge accounting according to IAS 39 “Financial Instruments: Recognition and Measurement”. Changes in the fair value of any derivative instruments that do not qualify for hedge accounting are recognised in profit and loss for the period (as part of financial activities of the Group).
OMZ Notes to the Consolidated Financial Statements for the year ended 31 December 2013 (in thousands of US dollars unless otherwise stated)
13
3. Summary of Significant Accounting Policies (Continued)
Property, plant and equipment. Property, plant and equipment are stated at cost, restated to the equivalent purchasing power of the Russian Rouble as at 31 December 2002 for assets acquired prior to 1 January 2003, less accumulated depreciation and provision for impairment, where required.
Costs include expenditure that is directly attributable to the acquisition or construction of the asset including the costs of dismantling and removing the items and restoring the site on which they are located and capitalised borrowing costs. When parts of an item of property, plant and equipment have different useful lives, they are accounted for as separate items (major components) of property, plant and equipment.
Repairs and maintenance expenditure is expensed as incurred. Major renewals and improvements are capitalised and the net book values of the replaced parts or components is derecognised. Gains and losses arising from the retirement of property, plant and equipment are included in profit and loss as incurred.
The carrying amounts of the Group’s property, plant and equipment are reviewed at each reporting date to determine whether there is any indication of impairment. If any such indication exists, then the asset’s recoverable amount is estimated. An impairment loss is recognised if the carrying amount of an asset or its related cash-generating unit (CGU) exceeds its estimated recoverable amount.
The recoverable amount of an asset or CGU is the greater of its value in use and its fair value less costs to sell. In assessing value in use, the estimated future cash flows are discounted to their present value using a pre-tax discount rate that reflects current market assessments of the time value of money and the risks specific to the asset or CGU. For the purpose of impairment testing, assets that cannot be tested individually are grouped together into the smallest group of assets that generates cash inflows from continuing use that are largely independent of the cash inflows of other assets or CGU.
Impairment losses are recognised in profit or loss. An impairment loss is reversed if there has been a change in the estimates used to determine the recoverable amount. An impairment loss is reversed only to the extent that the asset’s carrying amount does not exceed the carrying amount that would have been determined, net of depreciation or amortisation, if no impairment loss had been recognised.
Gains and losses on disposal are determined by comparing the proceeds with the carrying amount of property, plant and equipment, and is recognised net in other operating income/expense in profit or loss.
Depreciation. Items of property, plant and equipment are depreciated from the date that they are installed and are ready for use, or in respect of internally constructed assets, from the date that the asset is completed and ready for use. Depreciation is based on the cost of an asset less its residual value. Significant components of individual assets are assessed and if a component has a useful life that is different from the remainder of that asset, that component is depreciated separately.
Depreciation is recognised in profit or loss on a straight-line basis over the estimated useful lives of each part of an item of property, plant and equipment, since this most closely reflects the expected pattern of consumption of the future economic benefits embodied in the asset.
Leased assets are depreciated over the shorter of the lease term and their useful lives unless it is reasonably certain that the Group will obtain ownership by the end of the lease term.
The estimated useful lives for the current and comparative periods are as follows: Number of yearsBuildings 20 - 50Machinery and equipment 10 - 25Other 3 - 10
Land and assets under construction are not depreciated.
The residual value of an asset is the estimated amount that the Group would currently obtain from disposal of the asset less the estimated costs of disposal, if the asset were already of the age and in the condition expected at the end of its useful life. The residual value of an asset is nil if the Group expects to use the asset until the end of its physical life. Depreciation methods, useful lives and residual values are reviewed at each financial year end and adjusted if appropriate.
Leased assets. Leases in terms of which the Group assumes substantially all the risks and rewards of ownership are classified as finance leases. Upon initial recognition the leased asset is measured at an amount equal to the lower of its fair value and the present value of the minimum lease payments. Subsequent to initial recognition, the asset is accounted for in accordance with the accounting policy applicable to that asset. Other leases are operating leases and the leased assets are not recognised on the Group’s statement of financial position.
OMZ Notes to the Consolidated Financial Statements for the year ended 31 December 2013 (in thousands of US dollars unless otherwise stated)
14
3. Summary of Significant Accounting Policies (Continued)
Intangible assets
Goodwill. Goodwill represents the excess of the cost of an acquisition over the fair value of the acquirer’s share of the net identifiable assets, liabilities and contingent liabilities of the acquired subsidiary or associate at the date of exchange. When the excess is negative (negative goodwill), it is recognised immediately in profit or loss.
Goodwill is carried at cost less accumulated impairment losses, if any.
Goodwill is allocated to the cash-generating units (CGUs), or groups of CGUs, that are expected to benefit from the synergies of the business combination. Such units or groups of units represent the lowest level at which the Group monitors goodwill and are not larger than a segment. The Group tests goodwill for impairment annually at the reporting date. An impairment loss is recognised if the carrying amount of the cash-generating unit exceeds its recoverable amount. The recoverable amount of the CGU is the greater of its value in use and its fair value less costs to sell. In assessing value in use, the estimated future cash flows are discounted to their present value using a pre-tax discount rate that reflects current market assessments of the time value of money and the risks specific to the CGU. Impairment losses are recognised in the profit or loss. Impairment losses recognised in respect of CGUs are allocated first to reduce the carrying amount of any goodwill allocated to the CGU (group of CGUs) and then to reduce the carrying amount of the other assets in the CGU (group of CGUs) on a pro rata basis. An impairment loss in respect of goodwill is not reversed. Research and development. Expenditure on research activities, undertaken with the prospect of gaining new scientific or technical knowledge and understanding, is recognised in profit or loss as incurred.
Development activities involve a plan or design for the production of new or substantially improved products and processes. Development expenditure is capitalised only if development costs can be measured reliably, the product or process is technically and commercially feasible, future economic benefits are probable, and the Group intends to and has sufficient resources to complete development and to use or sell the asset. The capitalised expenditure includes the cost of materials, direct labour and overhead costs that are directly attributable to preparing the asset for its intended use, and capitalised borrowing costs. Other development expenditure is recognised in the profit or loss as incurred.
Capitalised development expenditure is measured at cost less accumulated amortisation and accumulated impairment losses.
Other intangible assets. All of the Group’s other intangible assets have definite useful lives and primarily include capitalised computer software, patents, trademarks and licences.
Acquired computer software licenses, patents and trademarks are capitalised on the basis of the costs incurred to acquire and bring them to use.
Trademarks are recognised at historical cost. Trademarks have a definite useful life and are carried in the statement of financial position at cost less accumulated amortisation. Amortisation is calculated using the straight-line method to allocate the cost of trademarks and licences over their estimated useful lives (50 years). Where an indication of impairment exists, the carrying amount of trademarks are assessed and, when impaired, the asset is written down immediately to its recoverable amount, which is the higher of fair value less costs to sell and value in use.
Expenditure on acquired patents and licences is capitalised and amortised using the straight-line method over their useful lives, which do not exceed 20 years. The useful lives of other intangible assets do not exceed 15 years.
Intangible assets with definite useful lives are tested for impairment on the same basis as property, plant and equipment.

OMZ Notes to the Consolidated Financial Statements for the year ended 31 December 2013 (in thousands of US dollars unless otherwise stated)
15
3. Summary of Significant Accounting Policies (Continued)
Inventories. Inventories are recorded at the lower of cost and net realisable value. The cost of inventory inventories is determined based on the weighted average cost method. The cost of finished goods and work in progress comprises raw material, direct labour, other direct costs and related production overheads (based on normal operating capacity) but excludes borrowing costs. Net realisable value is the estimated selling price in the ordinary course of business, less the cost of completion and selling expenses, and includes expenditure incurred in acquiring the inventories, production or conversion costs and other costs incurred in bringing them to their existing location and condition. In the case of manufactured inventories and work in progress, cost includes an appropriate share of production overheads based on normal operating capacity. Net realisable value is the estimated selling price in the ordinary course of business, less the estimated costs of completion and selling expenses.
Prepayments. Prepayments are carried at cost less provision for impairment. A prepayment is classified as non-current when the goods or services relating to the prepayment are expected to be obtained after one year, or when the prepayment relates to an asset which will itself be classified as non-current upon initial recognition. Prepayments to acquire assets are transferred to the carrying amount of the asset once the Group has obtained control of the asset and it is probable that future economic benefits associated with the asset will flow to the Group. Other prepayments are written off to profit or loss when the goods or services relating to the prepayments are received. If there is an indication that the assets, goods or services relating to a prepayment will not be received, the carrying value of the prepayment is written down accordingly and a corresponding impairment loss is recognised in profit or loss.
Non-current assets classified as held for sale. Non-current assets and disposal groups (which may include both non-current and current assets) are classified in the consolidated statement of financial position as ‘Non-current assets held for sale’ if their carrying amount will be recovered principally through a sale transaction within twelve months after the reporting date. Assets are reclassified when all of the following conditions are met: (a) the assets are available for immediate sale in their present condition; (b) the Group’s management approved and initiated an active programme to locate a buyer; (c) the assets are actively marketed for a sale at a reasonable price; (d) the sale is expected to occur within one year and (d) it is unlikely that significant changes to the plan to sell will be made or that the plan will be withdrawn. Non-current assets or disposal groups classified as held for sale in the current period’s consolidated statement of financial position are not reclassified or re-presented in the comparative consolidated statement of financial position to reflect the classification at the end of the current period.
A disposal group is assets (current or non-current) to be disposed of, by sale or otherwise, together as a group in a single transaction, and liabilities directly associated with those assets that will be transferred in the transaction. Goodwill is included if the disposal group includes an operation within a cash-generating unit to which goodwill has been allocated on acquisition.
Liabilities directly associated with the disposal group that will be transferred in the disposal transaction are reclassified and presented separately in the consolidated statement of financial position.
Immediately before classification as held for sale, the assets, or components of a disposal group, are remeasured in accordance with the Group’s accounting policies. Thereafter generally the assets, or disposal group, are measured at the lower of their carrying amount and fair value less cost to sell. Any impairment loss on a disposal group first is allocated to goodwill, and then to remaining assets and liabilities on pro rata basis, except that no loss is allocated to inventories, financial assets, deferred tax assets or employee benefit assets, which continue to be measured in accordance with the Group’s accounting policies. Impairment losses on initial classification as held for sale or distribution and subsequent gains or losses on remeasurement are recognised in profit or loss. Gains are not recognised in excess of any cumulative impairment loss.
Intangible assets and property, plant and equipment once classified as held for sale or distribution are not amortised or depreciated. In addition, equity accounting of equity-accounted investees ceases once classified as held for sale or distribution.
Discontinued operations. A discontinued operation is a component of the Group that either has been disposed of, or that is classified as held for sale, and: (a) represents a separate major line of business or geographical area of operations; (b) is part of a single co-ordinated plan to dispose of a separate major line of business or geographical area of operations; or (c) is a subsidiary acquired exclusively with a view to resale. Earnings and cash flows of discontinued operations, if any, are disclosed separately from continuing operations with comparatives being re-presented.
The Group stops classifying its non-current assets (or disposal group) as held for sale if core principles are not met – if its carrying amount will not be recovered principally through a sale transaction rather than through continuing use and if there is no commitment to sell (or exchange for shares in another entity) a substantial share of its interest in the subsidiaries.
OMZ Notes to the Consolidated Financial Statements for the year ended 31 December 2013 (in thousands of US dollars unless otherwise stated)
16
3. Summary of Significant Accounting Policies (Continued)
If an entity ceases to classify a component of the Group as held for sale, the result of operations of the component previously presented in discontinued operations shall be reclassified and included in income from continuing operations for all periods presented. The amounts for prior periods shall be described as having been re-presented.
Share capital. Ordinary shares and non-redeemable preference shares with discretionary dividends are both classified as equity. Incremental costs directly attributable to the issue of new shares are shown in equity as a deduction, net of tax, from the proceeds. Any excess of the fair value of consideration received over the par value of shares issued is presented in the notes as a share premium.
Treasury shares. Where any Group company purchases the Company’s equity share capital, the consideration paid, including any directly attributable incremental costs (net of any tax effects) is deducted from equity attributable to the Company’s equity holders until the shares are cancelled, reissued or disposed of. Where such shares are subsequently sold or reissued, any consideration received, net of any directly attributable incremental transaction costs and the related tax effects, is included in equity attributable to the Company’s equity holders.
Dividends. Dividends are recognised as a liability and deducted from equity at the balance sheet date only if they are declared before or on the balance sheet date. Dividends are disclosed when they are proposed before the balance sheet date or proposed or declared after the balance sheet date but before the consolidated financial statements are authorised for issue.
Value added tax. Output value added tax related to sales is payable to tax authorities on the earlier of (a) collection of the receivables from customers or (b) delivery of the goods or services to customers. Input VAT is generally recoverable against output VAT upon receipt of the VAT invoice. The tax authorities permit the settlement of VAT on a net basis. VAT related to sales and purchases is recognised in the consolidated statement of financial position on a gross basis and disclosed separately as an asset and liability. Where provision has been made for impairment of receivables, an impairment loss is recorded for the gross amount of the debtor, including VAT.
Provisions for liabilities and charges. Provisions for liabilities and charges are recognised when the Group has a present legal or constructive obligation as a result of past events, and it is probable that an outflow of resources will be required to settle the obligation, and a reliable estimate of the amount can be made. Where there are a number of similar obligations, the likelihood that an outflow will be required in settlement is determined by considering the class of obligations as a whole. A provision is recognised even if the likelihood of an outflow with respect to any one item included in the same class of obligations may be small. Where the Group expects a provision to be reimbursed, for example under an insurance contract, the reimbursement is recognised as a separate asset but only when the reimbursement is virtually certain.
The Group recognises the estimated liability to repair or replace products sold still under warranty at the balance sheet date. This provision is calculated based on past history of the level of repairs and replacements.
A provision for onerous contracts is recognised when the expected benefits to be derived by the Group from a contract are lower than the unavoidable cost of meeting its obligations under the contract. The provision is measured at the present value of the lower of the expected cost of terminating the contract and the expected net cost of continuing with the contract. Before a provision is established, the Group recognises any impairment loss on the assets associated with that contract.
Financial guarantees. Financial guarantees are contracts that requires the Group to make specified payments to reimburse the holder of the guarantee for a loss it incurs because a specified debtor fails to make payment when due in accordance with the terms of a debt instrument. Financial guarantees are initially recognised at their fair value, which is normally evidenced by the amount of fees received. This amount is amortised on a straight line basis over the life of the guarantee. At each balance sheet date, the guarantees are measured at the higher of (i) the unamortised balance of the amount at initial recognition and (ii) the best estimate of expenditure required to settle the obligation at the balance sheet date, if it is probable that an outflow of economic resources will be required to settle the obligation.
Construction contracts. Construction contracts generally include long-term contracts to manufacture design-build equipment, including nuclear power plant equipment, continuous casting machines and handling machinery.
Contract costs are recognised when incurred. When the outcome of a construction contract cannot be estimated reliably, contract revenue is recognised only to the extent of contract costs incurred that are probable of recovery. When the outcome of a construction contract can be estimated reliably and it is probable that the contract will be profitable, contract revenue is recognised over the period of the contract. When it is probable that total contract costs will exceed total contract revenue, the expected loss is recognized as an expense immediately.
The Group uses the “percentage of completion method” to determine the appropriate amount of revenues to recognise in a given period.
OMZ Notes to the Consolidated Financial Statements for the year ended 31 December 2013 (in thousands of US dollars unless otherwise stated)
17
3. Summary of Significant Accounting Policies (Continued)
Costs incurred in the year in connection with future activity on a contract but not directly related to a contract are excluded from contract costs in determining the stage of completion. The costs incurred in the year in connection with future activity on a contract are presented as inventories, prepayments or other assets, depending on their nature.
The Group presents as an asset the gross amount due from customers for contract work for all contracts in progress for which costs incurred plus recognised profits (less recognised losses) exceeds progress billings. Due from customers for construction works are included within trade and other receivables.
The Group presents as a liability the gross amount due to customers for contract work for all contracts in progress for which progress billings exceed costs incurred plus recognised profits (less recognised losses).
Revenue recognition. Revenue from the sale of goods in the course of ordinary activities is measured at the fair value of the consideration received or receivable, net of returns, trade discounts and volume rebates.
Revenue is recognised when persuasive evidence exists, usually in the form of an executed sales agreement, that the significant risks and rewards of ownership have been transferred to the buyer, recovery of the consideration is probable, the associated costs and possible return of goods can be estimated reliably, and there is no continuing management involvement with the goods, and the amount of revenue can be measured reliably. If it is probable that discounts will be granted and the amount can be measured reliably, then the discount is recognised as a reduction of revenue as the sales are recognised.
Revenues from sales of goods are recognised at the point of transfer of risks and rewards of ownership of the goods, normally when the goods are shipped. If the Group agrees to transport goods to a specified location, revenue is recognised when the goods are passed to the customer at the destination point.
Sales of services are recognised in the accounting period in which the services are rendered, by reference to stage of completion of the specific transaction assessed on the basis of the actual service provided as a proportion of the total services to be provided.
Employee benefits. Wages, salaries, contributions to the Russian Federation and the Czech Republic state pension and social insurance funds, paid annual leave and sick leave, bonuses, and non-monetary benefits (such as health services and kindergarten services) are accrued in the year in which the associated services are rendered by the employees of the Group.
Pension costs. In the normal course of business the Group contributes to the Russian Federation and the Czech Republic state pension schemes on behalf of its employees. Mandatory contributions to the governmental pension schemes are expensed when incurred.
Discretionary pensions and other post-employment benefits are included in labour costs in the statement of comprehensive income of operations; however, separate disclosures are not provided, as these costs are not material.
Lease Payments. Payments made under operating leases are recognised in profit or loss on a straight-line basis over the term of the lease. Lease incentives received are recognised as an integral part of the total lease expense, over the term of the lease. Minimum lease payments made under finance leases are apportioned between the finance expense and the reduction of the outstanding liability. The finance expense is allocated to each period during the lease term so as to produce a constant periodic rate of interest on the remaining balance of the liability. Finance income and costs. Finance income comprises interest income on funds invested, gains on the disposal of available-for-sale and other financial assets and foreign currency gains. Interest income is recognised as it accrues in profit or loss, using the effective interest method. Finance costs comprise interest expense on borrowings, unwinding of the discount on provisions, dividends on preference shares classified as liabilities, foreign currency losses, and impairment losses recognised on financial assets, other than trade receivables. Borrowing costs that are not directly attributable to the acquisition, construction or production of a qualifying asset are recognised in profit or loss using the effective interest method. Foreign currency gains and losses are reported on a net basis.

OMZ Notes to the Consolidated Financial Statements for the year ended 31 December 2013 (in thousands of US dollars unless otherwise stated)
18
3. Summary of Significant Accounting Policies (Continued)
Income taxes. Income tax expense comprises current and deferred tax. Current tax and deferred tax are recognised in profit or loss except to the extent that it relates to a business combination, or items recognised directly in equity or in other comprehensive income.
Current tax is the expected tax payable or receivable on the taxable income or loss for the year, using tax rates enacted or substantively enacted at the reporting date, and any adjustment to tax payable in respect of previous years.
Deferred tax is recognised in respect of temporary differences between the carrying amounts of assets and liabilities for financial reporting purposes and the amounts used for taxation purposes. Deferred tax is not recognised for the following temporary differences: the initial recognition of assets or liabilities in a transaction that is not a business combination and that affects neither accounting nor taxable profit or loss, and differences relating to investments in subsidiaries and jointly controlled entities to the extent that it is probable that they will not reverse in the foreseeable future. In addition, deferred tax is not recognised for taxable temporary differences arising on the initial recognition of goodwill. Deferred tax is measured at the tax rates that are expected to be applied to the temporary differences when they reverse, based on the laws that have been enacted or substantively enacted by the reporting date. Deferred tax assets and liabilities are offset if there is a legally enforceable right to offset current tax assets and liabilities, and they relate to income taxes levied by the same tax authority on the same taxable entity, or on different tax entities, but they intend to settle current tax liabilities and assets on a net basis or their tax assets and liabilities will be realised simultaneously. In accordance with the tax legislation of the Russian Federation, tax losses and current tax assets of a company in the Group may not be set off against taxable profits and current tax liabilities of other Group companies. In addition, the tax base is determined separately for each of the Group’s main activities and, therefore, tax losses and taxable profits related to different activities cannot be offset.
A deferred tax asset is recognised for unused tax losses, tax credits and deductible temporary differences, to the extent that it is probable that future taxable profits will be available against which they can be utilised. Deferred tax assets are reviewed at each reporting date and are reduced to the extent that it is no longer probable that the related tax benefit will be realised.
Segment reporting. An operating segment is a component of the Group that engages in business activities from which it may earn revenues and incur expenses that relate to transactions with any of the Group’s other components. All operating segments’ operating results are reviewed regularly by the Board of directors to make decisions about resources to be allocated to the segment and assess its performance and for which discrete financial information is available.
Segment results that are reported to the Board of Directors include items directly attributable to a segment as well as those that can be allocated on a reasonable basis. Unallocated items comprise mainly corporate assets, head office expenses, and income tax assets and liabilities.
Segment capital expenditure is the total cost incurred during the year to acquire property, plant and equipment, and intangible assets other than goodwill.
Earnings per share. The Group presents basic and diluted earnings per share (“EPS”) data for its ordinary shares. Basic EPS is calculated by dividing the profit or loss attributable to ordinary shareholders of the Company by the weighted average number of ordinary shares outstanding during the period, adjusted for own shares held. Diluted EPS is determined by adjusting the profit or loss attributable to ordinary shareholders and the weighted average number of ordinary shares outstanding for the effects of all dilutive potential ordinary shares.
OMZ Notes to the Consolidated Financial Statements for the year ended 31 December 2013 (in thousands of US dollars unless otherwise stated)
19
4. Critical Accounting Estimates and Judgements in Applying Accounting Policies
The Group makes estimates and assumptions that affect the amounts recognised in the consolidated financial statements and the carrying amounts of assets and liabilities. Estimates and judgements are continually evaluated and are based on management’s experience and other factors, including expectations of future events that are believed to be reasonable under the circumstances. Revisions to accounting estimates are recognised in the period in which the estimates are revised and in any future periods affected.
Management also makes certain judgements, apart from those involving estimations, in the process of applying the accounting policies. Judgements that have the most significant effect on the amounts recognised in the consolidated financial statements and estimates that can cause a significant adjustment to the carrying amount of assets and liabilities within the next financial year include:
Impairment of non-current assets. The Group tests goodwill for impairment at least annually and other non-financial assets, other than inventories and deferred tax assets, are tested at least at each reporting date if there are indicators of impairment. The recoverable amounts of cash-generating units have been determined based on value-in-use calculations and fair value less cost to sell.
Impairment of inventories. The Group reviews inventories at least annually and assesses the expected method of disposal, the proceeds or other economic benefits, if any, likely to be recovered from the disposal and the expected completion, selling and any other costs likely to be incurred during the disposal process when determining the net realisable value of inventory.
Impairment of trade and other receivables. The primary factors that the Group considers when assessing whether a receivable is impaired is its overdue status and realisability of related collateral, if any. The following other principal criteria are also used to determine whether there is objective evidence that an impairment loss has occurred:
the counterparty experiences a significant financial difficulty as evidenced by its financial information that the Group obtains;
the counterparty considers bankruptcy or a financial reorganisation;
there is adverse change in the payment status of the counterparty as a result of changes in the national or local economic conditions that impact the counterparty.
Tax legislation. Russian tax, currency and customs legislation is subject to varying interpretations (Note 29).
Deferred income tax asset recognition. The recognised deferred tax asset represents income taxes recoverable through future deductions from taxable profits and is recorded in the consolidated statement of financial position. Deferred income tax assets are recorded to the extent that realisation of the related tax benefit is probable.
With respect to deferred taxes, management has assumed that US$ 2 678 of tax losses will be utilised in the future (31 December 2012: US$ 21 905), the effect of which caused a recognition of deferred tax asset recorded as at 31 December 2013 of US$ 536 (31 December 2012: US$ 4 381). If these tax losses could not be utilised, the deferred tax liability would be increased by this amount with a corresponding impact on the tax expense for the year. Tax benefits expire in 2014-2023.
As at 31 December 2013, management assessed that US$ 149 034 (as at 31 December 2012: US$ 100 625) of previously incurred losses would not be utilized before expiration due to lack of sufficient expected tax profits. Consequently US$ 29 807 of deferred tax assets have not been recognized (31 December 2012: US$ 20 125).
Long-term contracts. For the purposes of recognition of revenue and gross margin on construction contracts including the expected “costs to complete”, the Group made estimations of the probability of recovering retentions withheld by customers, variations/claims that have not yet been contractually agreed, the probability of customers making claims for delays under penalty clauses included in contracts as well as the financial impacts of customers cancelling construction contracts prior to their completion when cancellation clauses are included in contracts.
If forecast gross margins on the Group’s contracts are 10% lower than management’s estimates as at 31 December 2013, the Group would need to reduce the carrying value of amounts due from customers under construction contracts recognised using the percentage-of-completion method by US$ 32 425 (31 December 2012: US$ 43 952) with a corresponding effect on operating profit.
See Note 21 for significant judgments made in relation to construction contracts.
OMZ Notes to the Consolidated Financial Statements for the year ended 31 December 2013 (in thousands of US dollars unless otherwise stated)
20
4. Critical Accounting Estimates and Judgements in Applying Accounting Policies (Continued)
Going concern. Management has assumed that the Group will continue as a going concern. In making this judgement management considered current intentions and the financial position of the Group. Over the past years the Group has successfully worked with banks and financial institutions to secure the necessary financing for the long-term contracts in process and for other investing needs. Based on the terms of the existing contracts as well as its recent experience, management of the Group expects to be able to continue to secure necessary short-term and long-term financing for its operational and investing cash flow requirements. See Note 35(c) for further information.
5. Adoption of New of Revised Standards and Interpretation and Changes in Accounting Policies
In 2013 the Group adopted new Standards, amendments to Standards and Interpretations which became effective as at 1 January 2013 and are expected to have an impact on the recognition, measurement, presentation and disclosure of transactions and other matters in its consolidated financial statements. The following new Standards and amendments were applied by the Group from 1 January 2013 and did not have a significant impact on the Group's accounting policies:
IFRS 10 Consolidated Financial Statements is effective for annual periods beginning on or after 1 January 2013. The new standard supersedes IAS 27 Consolidated and Separate Financial Statements and SIC-12 Consolidation – Special Purpose Entities. IFRS 10 introduces a single control model which includes entities that are currently within the scope of SIC-12 Consolidation – Special Purpose Entities. Under the new three-step control model, an investor controls an investee when it is exposed, or has rights, to variable returns from its involvement with that investee, has the ability to affect those returns through its power over that investee and there is a link between power and returns. Consolidation procedures are carried forward from IAS 27 (2008). When the adoption of IFRS 10 does not result in a change in the previous consolidation or non-consolidation of an investee, no adjustments to accounting are required on initial application. When the adoption results in a change in the consolidation or non-consolidation of an investee, the new standard may be adopted with either full retrospective application from date that control was obtained or lost or, if not practicable, with limited retrospective application from the beginning of the earliest period for which the application is practicable, which may be the current period.
IFRS 12 Disclosure of Interests in Other Entities will be effective for annual periods beginning on or after 1 January 2013. The new standard contains disclosure requirements for entities that have interests in subsidiaries, joint arrangements, associates and unconsolidated structured entities. Interests are widely defined as contractual and non-contractual involvement that exposes an entity to variability of returns from the performance of the other entity. The expanded and new disclosure requirements aim to provide information to enable the users to evaluate the nature of risks associated with an entity’s interests in other entities and the effects of those interests on the entity’s financial position, financial performance and cash flows.
IFRS 13 Fair Value Measurement will be effective for annual periods beginning on or after 1 January 2013. The new standard replaces the fair value measurement guidance contained in individual IFRSs with a single source of fair value measurement guidance. It provides a revised definition of fair value, establishes a framework for measuring fair value and sets out disclosure requirements for fair value measurements. IFRS 13 does not introduce new requirements to measure assets or liabilities at fair value, nor does it eliminate the practicability exceptions to fair value measurement that currently exist in certain standards. The standard is applied prospectively with early adoption permitted. Comparative disclosure information is not required for periods before the date of initial application.
Various Improvements to IFRSs have been dealt with on a standard-by-standard basis. All amendments, which result in accounting changes for presentation, recognition or measurement purposes, came into effect not earlier than 1 January 2013.
Additionally, the amendment to IAS 1 Presentation of Financial Statements: Presentation of Items of Other Comprehensive Income came into effect in 2013. The amendment requires that an entity presents separately items of other comprehensive income that may be reclassified to profit or loss in the future from those that will never be reclassified to profit or loss. The Group made these changes in the classification of items of other comprehensive income.
OMZ Notes to the Consolidated Financial Statements for the year ended 31 December 2013 (in thousands of US dollars unless otherwise stated)
21
6. New Accounting Pronouncements
A number of new Standards, amendments to Standards and Interpretations are not yet effective as at 31 December 2013, and have not been applied in preparing these consolidated financial statements. Of these pronouncements, potentially the following will have an impact on the Group’s operations. The Group plans to adopt these pronouncements when they become effective.
IFRS 9 Financial Instruments is to be issued in phases and is intended ultimately to replace International Financial Reporting Standard IAS 39 Financial Instruments: Recognition and Measurement. The first phase of IFRS 9 was issued in November 2009 and relates to the classification and measurement of financial assets. The second phase regarding classification and measurement of financial liabilities was published in October 2010. The third part of the standard was issued in November 2013 and relates to general hedge accounting s. The Group recognises that the new standard introduces many changes to the accounting for financial instruments and is likely to have a significant impact on Group’s consolidated financial statements. The impact of these changes will be analysed during the course of the project as further phases of the standard are issued. The Group does not intend to adopt this standard early.
Investment Entities (Amendments to IFRS 10, IFRS 12 and IAS 27) will be effective for annual periods beginning on or after 1 January 2014. The amendments introduce a mandatory consolidation exception for certain qualifying investment entities. A qualifying investment entity is required to account for investments in controlled entities, as well as investments in associates and joint ventures, at fair value through profit or loss. The consolidation exception will not apply to subsidiaries that are considered an extension of the investment entity's investing activities. The amendments are to be applied retrospectively unless impracticable.
Amendments to IAS 32 Financial Instruments: Presentation - Offsetting Financial Assets and Financial Liabilities specify that an entity currently has a legally enforceable right to set-off if that right is not contingent on a future event; and enforceable both in the normal course of business and in the event of default, insolvency or bankruptcy of the entity and all counterparties. The amendments are effective for annual periods beginning on or after 1 January 2014, and are to be applied retrospectively.
Amendments to IAS 36 Recoverable Amount Disclosures for Non-Financial Assets. The IASB has issued amendments to reverse the unintended requirement in IFRS 13 Fair Value Measurement to disclose the recoverable amount of every cash-generating unit to which significant goodwill or indefinite-lived intangible assets have been allocated. Under the amendments, the disclosure of information about the recoverable amount of impaired assets will be required only when the recoverable amount is based on fair value less costs of disposal. The amendments apply retrospectively for annual periods beginning on or after 1 January 2014. Early application is permitted, which means that the amendments can be adopted at the same time as IFRS 13.
IFRIC 21 Levies provides guidance on accounting for levies in accordance with the requirements of IAS 37 Provisions, Contingent Liabilities and Contingent Assets. The interpretation defines a levy as an outflow from an entity imposed by a government in accordance with legislation. Levies do not arise from executory contracts or other contractual arrangements. However, outflows within the scope of IAS 12 Income taxes, fines and penalties, and liabilities arising from emission trading schemes are explicitly excluded from the scope. The interpretation confirms that an entity recognises a liability for a levy when – and only when – the triggering event specified in the legislation occurs. An entity does not recognise a liability at an earlier date, even if it has no realistic opportunity to avoid the triggering event. The interpretation is effective for annual periods commencing on or after 1 January 2014. The interpretation is applied on a retrospective basis. Early adoption is permitted.
Amendments to IAS 39 Novation of Derivatives and Continuation of Hedge Accounting add a limited exception to IAS 39, to provide relief from discontinuing an existing hedging relationship when a novation that was not contemplated in the original hedging documentation meets specific criteria. The amendments are effective for annual periods beginning on or after 1 January 2014. Early application is permitted.
The Group has not yet analysed the likely impact of new Standards, amendments to Standards and Interpretations on its financial position or performance.

OMZ Notes to the Consolidated Financial Statements for the year ended 31 December 2013 (in thousands of US dollars unless otherwise stated)
22
7. Segment Information
The Group has one chief operating decision maker which is represented by a Management Board, which includes certain members of the Company’s Board of Directors and certain representatives of the ultimate parent company. The Management Board evaluates the results of operations, assets and liabilities of the operating segments on the basis of financial statements prepared in accordance with International Financial Reporting Standards on quarterly basis.
The Group’s operations are organised into five reportable segments which are described below:
Segment Obyedinenniye Mashinostroitelniye Zavody. OJSC. Segment is engaged in delivery of high tech industry products through provision of engineering, procurement and construction services (including assembly and installation) under EPC-contracts.
OJSC Obyedinenniye Mashinostroitelniye Zavody also acts as a general contractor for delivery of equipment for oil
and gas, nuclear power engineering and metallurgy industry, whereby it subcontracts separate components to Group
companies.
Segment Izhorskiye Zavody OJSC. Segment engaged in production of equipment for nuclear power plants in Russia which produces three major types of equipment for the nuclear power industry and machinery equipment:
Primary circuit equipment for nuclear power plants. A standard set of primary circuit equipment produced by the Group comprises a reactor vessel, in-vessel components, and a cover with extending pipes.
Used nuclear fuel containers for nuclear power blocks. The Group manufactures containers for storage and transportation of used nuclear fuel from pressurized water reactors and scientific nuclear reactors.
Machinery equipment based on OMZ’s proprietary engineering and the production of equipment based on third party engineering, for various industries, including oil and gas, mining and metallurgical equipment.
A wide range of spare parts.
In addition, the segment provides services for the installation of nuclear power plant equipment and project management of long-term contracts for the construction of nuclear power plants.
Segment SKODA JS a.s. Segment engaged in production of equipment for nuclear power plants in Czech Republic which produces equipment for the nuclear power plants and provides repair services, installation, upgrading and recycling of equipment for nuclear power plants.
Segment OMZ-Specstal LLC. Segment engaged in production of specialty based steel in Russia, which produces 150 specialty steel grades and a variety of castings and forgings. The Group produces high-strength structural grades, corrosion-resistant, radiation-resistant, heat-resistant, cold-resistant, non-magnetic and high-alloyed grades of steel. Standard types of casting, forging, and moulding production include retaining rings for power generating equipment, chill mould blanks, bearing ring blanks, column equipment, ship spindles, mill rolls, tank courses, as well as similar custom-made metal products. A significant part of the basic metal production is used internally as an input for the machinery equipment manufacturing segment and equipment for nuclear power plants.
Segment IZ-KARTEKS LLC. Segment engaged in production of mining equipment in Russia which specializes in engineering and marketing of three major types of mining equipment: excavators (electric mining excavators and walking draglines), crushing equipment, and rock-drilling machines.
The Board of Directors evaluate the results of operations, assets and liabilities of the operating segments on the basis of financial statements prepared in accordance with International Financial Reporting Standards.
Sales or other transactions between the business segments are determined by management with reference to commercial terms applicable for third parties.

OMZ Notes to the Consolidated Financial Statements for the year ended 31 December 2013 (in thousands of US dollars unless otherwise stated)
23
7. Segment Information (Continued)
Russia:
OMZ OJSCIzhorskiye
Zavody OJSCIZ-KARTEKS
LLC OMZ-Specstal
LLC TotalFor the year ended 31 December 2013 Segment sales 192 920 301 949 185 552 211 765 892 186Intersegment sales 11 360 5 556 3 909 51 421 72 246External sales 181 560 296 393 181 643 160 344 819 940Reportable segment (loss)/ profit for the year (12 071) 18 254 8 488 (29 652) (14 981)Interest income 6 376 8 368 505 - 15 249Interest expense (689) (18 766) (6 090) (12 527) (38 072)Depreciation and amortisation (740) (9 432) (4 846) (22 934) (37 952)Income tax expense 2 607 (1 495) 590 ( 8 592) (6 890) Czech Republic: SKODA JS a.sFor the year ended 31 December 2013 Segment sales 175 268Intersegment sales -External sales 175 268Reportable segment profit for the year 5 676Interest income 24Interest expense (6)Depreciation and amortisation (4 581)Income tax expense (1 350)
The Group’s sales by type of products is presented as follows:
Nuclear equipment
Special steel
Mining equipment
Oil and gas equipment Other Total
For the year ended 31 December 2013 External sales 329 060 187 156 178 595 324 166 27 008 1 045 985
The reconciliation of total reportable segments’ loss to the profit for the year reported in the statement of profit or loss and other comprehensive income is as follows:
For the year ended 31 December 2013
Net loss of segments (9 305)Other profit from non-reportable segments 16 416Effect from elimination of unrealised margin under construction contracts 12 027Effect from elimination of unrealized profit 1 632Effect from elimination intragroup dividends (4 219)Profit for the year 16 551
The effect of the adjustments to external sales of the operating segments to present in conformity with IFRSs as reported in the statement of profit or loss and other comprehensive income is as follows:
For the year ended 31 December 2013
External sales for segments 995 208
Other external sales 41 734Effect from elimination of unrealised margin under construction contracts 9 043Sales in the statement of profit or loss and other comprehensive income 1 045 985

OMZ Notes to the Consolidated Financial Statements for the year ended 31 December 2013 (in thousands of US dollars unless otherwise stated)
24
7. Segment Information (Continued)
The total assets and total liabilities of the operating segments are presented as follows: Russia:
OMZ OJSCIzhorskiye Zavody
OJSCOMZ-Specstal
LLCIZ-KARTEKS
LLC TotalTotal assets of segments 555 298 418 967 374 385 206 820 1 555 470Total liabilities of segments 182 604 248 130 279 225 149 788 859 747
Czech Republic: SKODA JS a.s Total assets of segments 155 505Total liabilities of segments 59 776
The effect of the adjustments to reportable segment assets and liabilities as at 31 December 2013 to present in conformity with IFRSs as reported in statement of financial position is as follows: Total assets for segments 1 710 975
Other assets from non-reportable segments 384 657Elimination of amounts due to and due from entities consolidated within the Group (241 562)Elimination of investments in subsidiaries (566 810)Netting-off of due to and due from under construction contracts (21 085)Unrealized income and expense arising from intragroup transactions (2 001)Effect from elimination of unrealised margin under construction contracts ( 2 523)Other differences (8)Total assets in statement of the financial position 1 261 643
Total liabilities for segments 919 523
Other liabilities from non-reportable segments 159 053Elimination of amounts due to and due from entities consolidated within the Group (241 562)Netting-off of due to and due from under construction contracts (21 085)Unrealized income and expense arising from intragroup transactions (91)Total liabilities in statement of financial position 815 838
In presenting information on the basis of geographical information, revenue is based on the geographical location of customers and non-current assets based on entities location. Sales Non-current assets For the year
ended 31 December 2013 For the year ended 31 December 2013
Russian Federation 799 645 452 463OECD countries 156 530 67 911Other regions 89 810 -Total 1 045 985 520 374

OMZ Notes to the Consolidated Financial Statements for the year ended 31 December 2013 (in thousands of US dollars unless otherwise stated)
25
7. Segment Information (Continued)
Comparative information for 2012 year:
Russia:
OMZ OJSC
Izhorskiye Zavody
OJSCOMZ-Specstal
LLCIZ-KARTEKS
LLC Total
Year ended 31 December 2012 Segment sales 20 275 346 075 222 817 209 454 798 621
Intersegment sales 12 163 13 879 107 582 1 020 134 644
External sales 8 112 332 196 115 235 208 434 663 977
Reportable segment (loss)/profit for the year (3 631) 45 317 970 18 281 60 937Interest income 7 871 5 080 361 573 13 885Interest expense (3 509) (14 268) (14 240) (5 022) (37 039)Depreciation and amortisation (456) (6 849) (18 499) (4 181) (29 985)Income tax expense 577 (16 088) (2 037) (6 445) (23 993)
Czech Republic:
SKODA JS a.sYear ended 31 December 2012 Segment sales 254 757 Intersegment sales - External sales 254 757 Reportable segment profit for the year 10 837 Interest income 114 Depreciation and amortisation (4 914)Income tax expense (2 803)
The sales by types of products presented by following:
Nuclearequipment
Special steel
Mining equipment
Oil and gasequipment Other Total
Year ended 31 December 2012 External sales 440 798 138 639 208 434 134 212 47 822 969 905
The reconciliation of total reportable segments’ profit to the profit for the year reported in the statement of profit or loss and other comprehensive income is as follows:
Year ended
31 December 2012Net profit of segments 71 774Other profit from non-reportable segments 26 183Effect from elimination of unrealised margin under construction contracts (660)Effect from elimination of unrealized profit (815)Effect from elimination intragroup dividends (12 045)Profit for the year 84 437
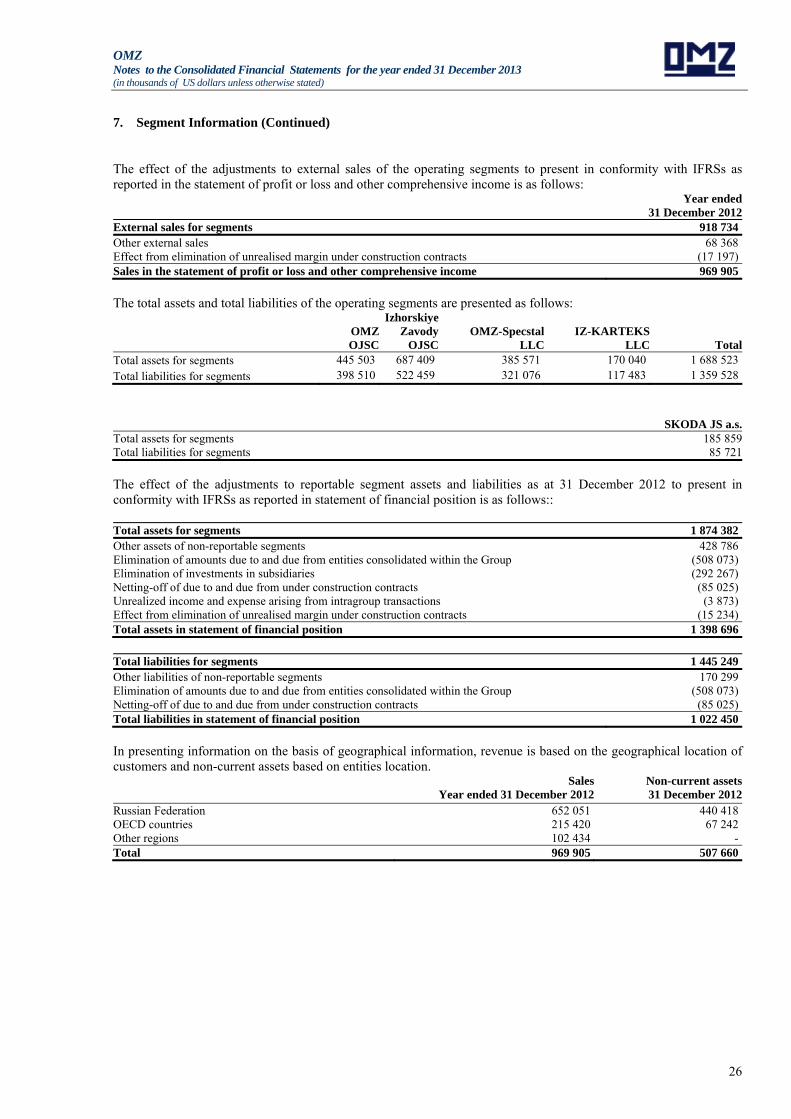
OMZ Notes to the Consolidated Financial Statements for the year ended 31 December 2013 (in thousands of US dollars unless otherwise stated)
26
7. Segment Information (Continued)
The effect of the adjustments to external sales of the operating segments to present in conformity with IFRSs as reported in the statement of profit or loss and other comprehensive income is as follows:
Year ended
31 December 2012External sales for segments 918 734 Other external sales 68 368 Effect from elimination of unrealised margin under construction contracts (17 197)Sales in the statement of profit or loss and other comprehensive income 969 905
The total assets and total liabilities of the operating segments are presented as follows:
OMZ OJSC
Izhorskiye Zavody
OJSCOMZ-Specstal
LLCIZ-KARTEKS
LLC TotalTotal assets for segments 445 503 687 409 385 571 170 040 1 688 523 Total liabilities for segments 398 510 522 459 321 076 117 483 1 359 528
SKODA JS a.s.Total assets for segments 185 859Total liabilities for segments 85 721
The effect of the adjustments to reportable segment assets and liabilities as at 31 December 2012 to present in conformity with IFRSs as reported in statement of financial position is as follows:: Total assets for segments 1 874 382Other assets of non-reportable segments 428 786Elimination of amounts due to and due from entities consolidated within the Group (508 073)Elimination of investments in subsidiaries (292 267)Netting-off of due to and due from under construction contracts (85 025)Unrealized income and expense arising from intragroup transactions (3 873)Effect from elimination of unrealised margin under construction contracts (15 234)Total assets in statement of financial position 1 398 696
Total liabilities for segments 1 445 249Other liabilities of non-reportable segments 170 299Elimination of amounts due to and due from entities consolidated within the Group (508 073)Netting-off of due to and due from under construction contracts (85 025)Total liabilities in statement of financial position 1 022 450
In presenting information on the basis of geographical information, revenue is based on the geographical location of customers and non-current assets based on entities location. Sales Non-current assets Year ended 31 December 2012 31 December 2012Russian Federation 652 051 440 418OECD countries 215 420 67 242Other regions 102 434 -Total 969 905 507 660

OMZ Notes to the Consolidated Financial Statements for the year ended 31 December 2013 (in thousands of US dollars unless otherwise stated)
27
8. Balances and Transactions with Related Parties
Related Parties are defined in IAS 24 “Related Party Disclosures”. Parties are generally considered to be related if one party has the ability to control the other party, is under common control, or can exercise significant influence or joint control over the other party in making financial and operational decisions. In considering each possible relationship, attention is directed to the substance of the relationship, not merely the legal form. The ultimate parent company and the ultimate controlling party of the Group is OJSC “Gazprombank”. The immediate parent company is CJSC “Forpost-Holding”.
During the year 2013 the Group acquired plant and equipment of US$ 21 000 (2012: US$ 43 312) from its immediate parent company.
The outstanding balances with the related parties were as follows:
31 December 2013 31 December 2012
Immediate and ultimate parent
companies
Entities under
common control
Immediate and ultimate parent
companies
Entities under
common control
Cash and cash equivalents 18 094 - 13 570 -
Gross amount of trade receivables - 20 629 - 15 507
Other receivables 37 4 826 3 5 360
Due from customers from construction contracts - 111 879 - -
Advances issued - 9 070 - 82 955
Loans issued - 11 693 - 102 883
Other current financial assets 947 - - 111
Trade and other payables (2 180) (24 372) - (9 945)
Advances received - (2 457) - (58 297)
Long -terms loans and borrowings (244 283) - (201 480) -
Short- terms loans and borrowings (230 964) (16 123) (213 435) -
Amounts due from related parties are unsecured.
Loans and borrowings received from related parties are comprised of loans from OJSC “Gazprombank”. The majority of these loans are denominated in RR.
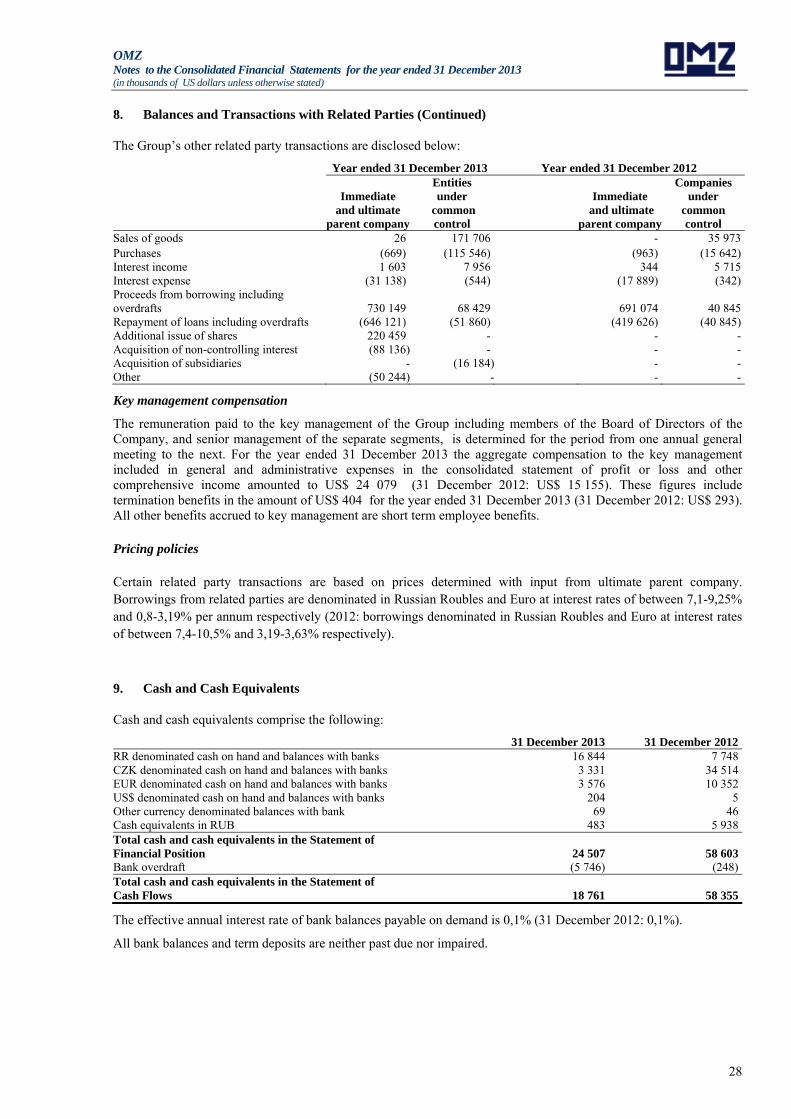
OMZ Notes to the Consolidated Financial Statements for the year ended 31 December 2013 (in thousands of US dollars unless otherwise stated)
28
8. Balances and Transactions with Related Parties (Continued)
The Group’s other related party transactions are disclosed below:
Year ended 31 December 2013 Year ended 31 December 2012
Immediate and ultimate
parent company
Entities under
common control
Immediate and ultimate
parent company
Companies under
common control
Sales of goods 26 171 706 - 35 973Purchases (669) (115 546) (963) (15 642)Interest income 1 603 7 956 344 5 715Interest expense (31 138) (544) (17 889) (342)Proceeds from borrowing including overdrafts 730 149 68 429
691 074 40 845
Repayment of loans including overdrafts (646 121) (51 860) (419 626) (40 845)Additional issue of shares 220 459 - - -Acquisition of non-controlling interest (88 136) - - -Acquisition of subsidiaries - (16 184) - -Other (50 244) - - -
Key management compensation
The remuneration paid to the key management of the Group including members of the Board of Directors of the Company, and senior management of the separate segments, is determined for the period from one annual general meeting to the next. For the year ended 31 December 2013 the aggregate compensation to the key management included in general and administrative expenses in the consolidated statement of profit or loss and other comprehensive income amounted to US$ 24 079 (31 December 2012: US$ 15 155). These figures include termination benefits in the amount of US$ 404 for the year ended 31 December 2013 (31 December 2012: US$ 293). All other benefits accrued to key management are short term employee benefits.
Pricing policies
Certain related party transactions are based on prices determined with input from ultimate parent company. Borrowings from related parties are denominated in Russian Roubles and Euro at interest rates of between 7,1-9,25% and 0,8-3,19% per annum respectively (2012: borrowings denominated in Russian Roubles and Euro at interest rates of between 7,4-10,5% and 3,19-3,63% respectively).
9. Cash and Cash Equivalents
Cash and cash equivalents comprise the following:
31 December 2013 31 December 2012RR denominated cash on hand and balances with banks 16 844 7 748CZK denominated cash on hand and balances with banks 3 331 34 514EUR denominated cash on hand and balances with banks 3 576 10 352US$ denominated cash on hand and balances with banks 204 5Other currency denominated balances with bank 69 46Cash equivalents in RUB 483 5 938Total cash and cash equivalents in the Statement of Financial Position 24 507 58 603Bank overdraft (5 746) (248)Total cash and cash equivalents in the Statement of Cash Flows 18 761 58 355
The effective annual interest rate of bank balances payable on demand is 0,1% (31 December 2012: 0,1%).
All bank balances and term deposits are neither past due nor impaired.
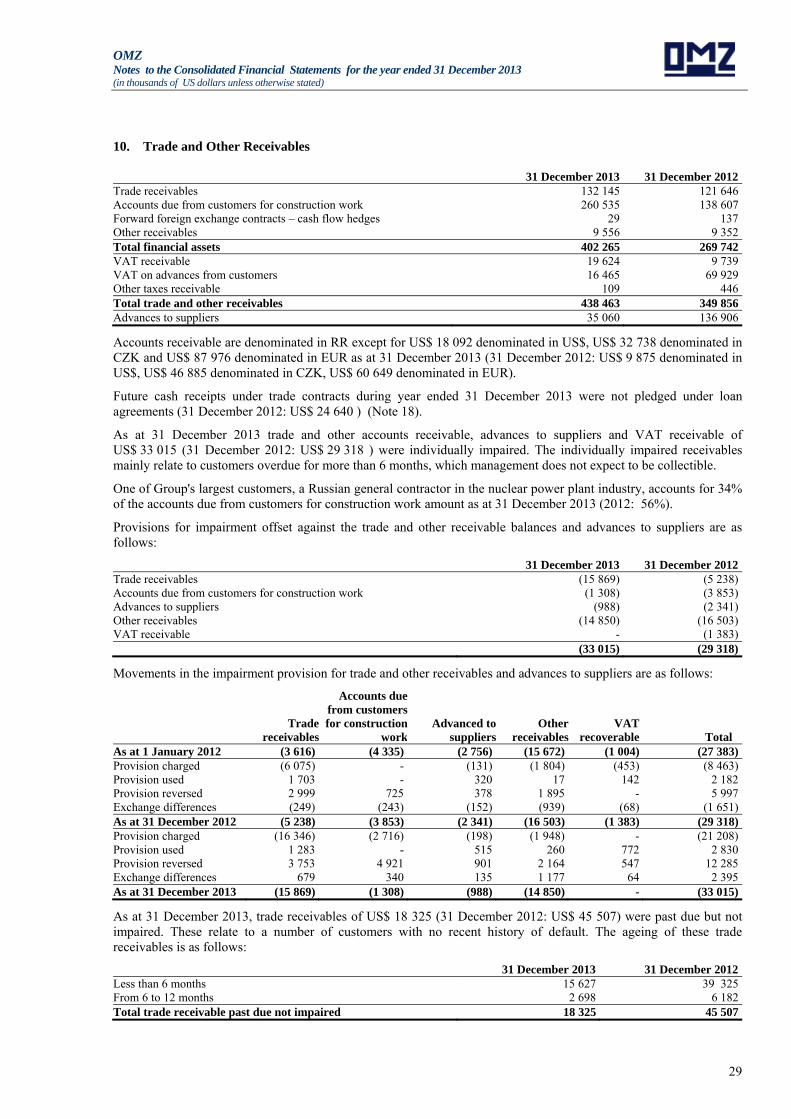
OMZ Notes to the Consolidated Financial Statements for the year ended 31 December 2013 (in thousands of US dollars unless otherwise stated)
29
10. Trade and Other Receivables
31 December 2013 31 December 2012Trade receivables 132 145 121 646Accounts due from customers for construction work 260 535 138 607Forward foreign exchange contracts – cash flow hedges 29 137Other receivables 9 556 9 352Total financial assets 402 265 269 742VAT receivable 19 624 9 739VAT on advances from customers 16 465 69 929Other taxes receivable 109 446Total trade and other receivables 438 463 349 856Advances to suppliers 35 060 136 906
Accounts receivable are denominated in RR except for US$ 18 092 denominated in US$, US$ 32 738 denominated in CZK and US$ 87 976 denominated in EUR as at 31 December 2013 (31 December 2012: US$ 9 875 denominated in US$, US$ 46 885 denominated in CZK, US$ 60 649 denominated in EUR).
Future cash receipts under trade contracts during year ended 31 December 2013 were not pledged under loan agreements (31 December 2012: US$ 24 640 ) (Note 18).
As at 31 December 2013 trade and other accounts receivable, advances to suppliers and VAT receivable of US$ 33 015 (31 December 2012: US$ 29 318 ) were individually impaired. The individually impaired receivables mainly relate to customers overdue for more than 6 months, which management does not expect to be collectible.
One of Group's largest customers, a Russian general contractor in the nuclear power plant industry, accounts for 34% of the accounts due from customers for construction work amount as at 31 December 2013 (2012: 56%).
Provisions for impairment offset against the trade and other receivable balances and advances to suppliers are as follows:
31 December 2013 31 December 2012Trade receivables (15 869) (5 238)Accounts due from customers for construction work (1 308) (3 853)Advances to suppliers (988) (2 341)Other receivables (14 850) (16 503)VAT receivable - (1 383) (33 015) (29 318)
Movements in the impairment provision for trade and other receivables and advances to suppliers are as follows:
Trade
receivables
Accounts due from customers for construction
workAdvanced to
suppliersOther
receivablesVAT
recoverable
Total As at 1 January 2012 (3 616) (4 335) (2 756) (15 672) (1 004) (27 383)Provision charged (6 075) - (131) (1 804) (453) (8 463)Provision used 1 703 - 320 17 142 2 182Provision reversed 2 999 725 378 1 895 - 5 997Exchange differences (249) (243) (152) (939) (68) (1 651)As at 31 December 2012 (5 238) (3 853) (2 341) (16 503) (1 383) (29 318)Provision charged (16 346) (2 716) (198) (1 948) - (21 208)Provision used 1 283 - 515 260 772 2 830Provision reversed 3 753 4 921 901 2 164 547 12 285Exchange differences 679 340 135 1 177 64 2 395 As at 31 December 2013 (15 869) (1 308) (988) (14 850) - (33 015)
As at 31 December 2013, trade receivables of US$ 18 325 (31 December 2012: US$ 45 507) were past due but not impaired. These relate to a number of customers with no recent history of default. The ageing of these trade receivables is as follows:
31 December 2013 31 December 2012Less than 6 months 15 627 39 325From 6 to 12 months 2 698 6 182Total trade receivable past due not impaired 18 325 45 507
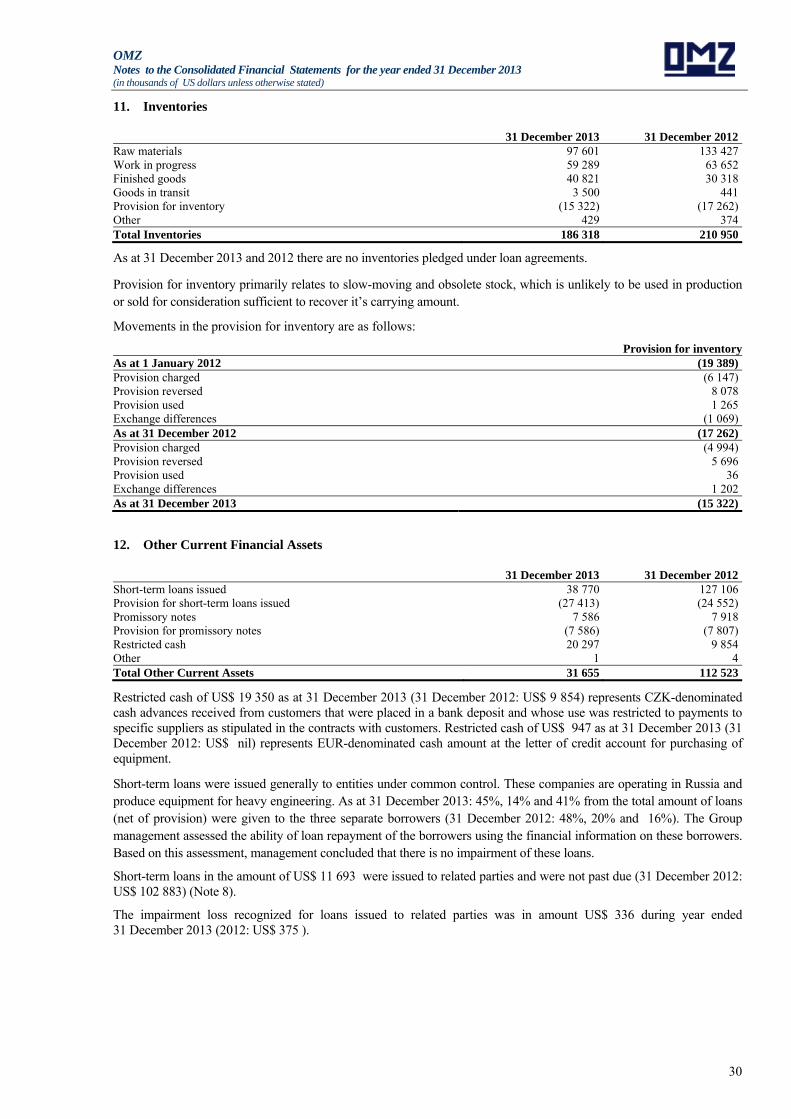
OMZ Notes to the Consolidated Financial Statements for the year ended 31 December 2013 (in thousands of US dollars unless otherwise stated)
30
11. Inventories
31 December 2013 31 December 2012Raw materials 97 601 133 427Work in progress 59 289 63 652Finished goods 40 821 30 318Goods in transit 3 500 441Provision for inventory (15 322) (17 262)Other 429 374Total Inventories 186 318 210 950
As at 31 December 2013 and 2012 there are no inventories pledged under loan agreements.
Provision for inventory primarily relates to slow-moving and obsolete stock, which is unlikely to be used in production or sold for consideration sufficient to recover it’s carrying amount.
Movements in the provision for inventory are as follows:
Provision for inventoryAs at 1 January 2012 (19 389)Provision charged (6 147)Provision reversed 8 078Provision used 1 265Exchange differences (1 069)As at 31 December 2012 (17 262)Provision charged (4 994)Provision reversed 5 696Provision used 36Exchange differences 1 202As at 31 December 2013 (15 322)
12. Other Current Financial Assets
31 December 2013 31 December 2012Short-term loans issued 38 770 127 106Provision for short-term loans issued (27 413) (24 552)Promissory notes 7 586 7 918Provision for promissory notes (7 586) (7 807)Restricted cash 20 297 9 854Other 1 4Total Other Current Assets 31 655 112 523
Restricted cash of US$ 19 350 as at 31 December 2013 (31 December 2012: US$ 9 854) represents CZK-denominated cash advances received from customers that were placed in a bank deposit and whose use was restricted to payments to specific suppliers as stipulated in the contracts with customers. Restricted cash of US$ 947 as at 31 December 2013 (31 December 2012: US$ nil) represents EUR-denominated cash amount at the letter of credit account for purchasing of equipment.
Short-term loans were issued generally to entities under common control. These companies are operating in Russia and produce equipment for heavy engineering. As at 31 December 2013: 45%, 14% and 41% from the total amount of loans (net of provision) were given to the three separate borrowers (31 December 2012: 48%, 20% and 16%). The Group management assessed the ability of loan repayment of the borrowers using the financial information on these borrowers. Based on this assessment, management concluded that there is no impairment of these loans.
Short-term loans in the amount of US$ 11 693 were issued to related parties and were not past due (31 December 2012: US$ 102 883) (Note 8).
The impairment loss recognized for loans issued to related parties was in amount US$ 336 during year ended 31 December 2013 (2012: US$ 375 ).

OMZ Notes to the Consolidated Financial Statements for the year ended 31 December 2013 (in thousands of US dollars unless otherwise stated)
31
12. Other Current Financial Assets (Continued)
Movements in the impairment provision for promissory notes and short-term loans issued are as follows:
Provision for short-term loans issued Provision for promissory notesAs at 1 January 2012 (25 530) (7 470)Provision charged (1 109) (769)Provision reversed 3 544 769Provision used 16 -Exchange differences (1 473) (337)As at 31 December 2012 (24 552) (7 807)Provision charged (1 931) -Provision reversed 13 -Exchange differences (943) 221 As at 31 December 2013 (27 413) (7 586)
13. Property, Plant and Equipment
Movements in the carrying amount of property, plant and equipment were as follows:
Land and buildings
Machinery and equipment Other
Assets under construction Total
Balance as at 1 January 2013 Cost 248 525 417 597 17 342 65 689 749 153 Accumulated depreciation (40 529) (166 719) (12 639) - (219 887) Impairment loss recognised (22 683) (32 810) (14) (409) (55 916) Net book value as at 1 January 2013 185 313 218 068 4 689 65 280 473 350 Effect of movements in exchange rates (13 204) (16 554) (288) (4 171) (34 217)Additions 6 784 42 190 938 35 202 85 114Acquisition of subsidiaries (Note 32) 930 - 7 - 937Transfers 15 142 38 072 35 (53 249) -Disposals (181) (300) (36) (96) (613)Depreciation (7 009) (33 003) (1 316) - (41 328)Reversal of impairment for the period - - - 12 12Net book value as at 31 December 2013 187 775 248 473 4 029 42 978 483 255Balance as at 31 December 2013 Cost 253 442 459 192 16 708 43 027 772 369 Accumulated depreciation (44 310) (181 055) (12 666) - (238 031) Impairment loss recognised (21 357) (29 664) (13) (49) (51 083) Net book value as at 31 December 2013 187 775 248 473 4 029 42 978 483 255
Comparative information for 2012:
Land and buildings
Machinery and equipment Other
Assets under
construction TotalBalance as at 1 January 2012 Cost 164 213 307 190 15 833 59 658 546 894Accumulated depreciation (33 579) (142 495) (12 716) - (188 790)Impairment loss recognised (20 739) (30 293) (14) - (51 046)Net book value as at 1 January 2012 109 895 134 402 3 103 59 658 307 058 Effect of movements in exchange rates 7 961 9 671 200 3 624 21 456 Additions 61 629 92 176 3 009 27 336 184 150 Transfers 12 726 12 085 33 (24 844) - Disposals (1 421) (2 050) (325) (98) (3 894)Impairment for the period (712) (958) - (396) (2 066)Depreciation (4 766) (27 258) (1 330) - (33 354)Net book value as at 31 December 2012 185 312 218 068 4 690 65 280 473 350 Balance as at 31 December 2012 Cost 248 525 417 597 17 342 65 689 749 153 Accumulated depreciation (40 529) (166 719) (12 639) - (219 887)Impairment loss recognised (22 683) (32 810) (14) (409) (55 916)Net book value as at 31 December 2012 185 313 218 068 4 689 65 280 473 350

OMZ Notes to the Consolidated Financial Statements for the year ended 31 December 2013 (in thousands of US dollars unless otherwise stated)
32
13. Property, Plant and Equipment (Continued)
As at 31 December 2013 bank borrowings are secured against property, plant and equipment with a carrying value of US$ 75 182 (31 December 2012: US$ 66 329 ) (Note 18).
Land and buildings include 118 plots of land in Bolevec (Czech Republic) with a total area of 334 719 square meters, 9 plots in Pilzen (Czech Republic) with a total area of 32 443 square meters, 1 plot of land in Brno (Czech Republic) with a total area of 3 333 square meters and 51 plots in Kolpino (Russia) with a total area of 1 496 881 square meters.
The amount of borrowing costs capitalized during the year ended 31 December 2013 is US$ 4 459 (2012:US$ 5 678 ) using a capitalization rate of 8,49% (2012: 8,21%).
LLC OMZ-Specstal
In 2011 management recognised an impairment of the carrying value of the property, plant and equipment of LLC OMZ-Specstal in the amount of US$ 50 966. As at 31 December 2013 and as at 31 December 2012 management performed impairment tests of the carrying value of the property, plant and equipment of LLC OMZ-Specstal, due to indications of an additional impairment.
The recoverable amounts have been determined based on value in use. Cash flows were projected based on historical operating results and a seven-year cash flow forecast.
Assumptions underlying the impairment testing are described below:
The revenue growth was forecasted based on the actual revenue amount and expected growth rate of revenue, which was from 4% to 47% (2012: 4% to 22%).
Earnings before Interest, Taxes, Depreciation, and Amortization (EBITDA) in absolute terms was forecasted based on the EBITDA/Revenue ratio of 6.6% to 19% (2012: 5% to 19%).
A pre-tax discount rate of 15.1% (2012: discount rate 16.32%) was applied in determining the recoverable amount of the property, plant and equipment. The discount rate was estimated based on industry average weighted average cost of capital.
A terminal value was derived at the end of a five-year forecast period with a 3% terminal growth rate.
The values assigned to the key assumptions represent management’s assessment of future trends in specialty steel production industry and are based on both external sources and internal sources (historic data). The results of the impairment test demonstrated that the recoverable amount approximated the carrying amount of the property, plant and equipment. Therefore the impairment loss of RR 1 500 000 remained unchanged.
The model of discounted cash flows is not particularly sensitive to the changes in the principal assumptions:
An increase in WACC by 2 percentage point would not result in an additional impairment charge against property, plant and equipment.
A decrease in revenue and corresponding change in cost of sales by 10 percentage point would not result in an additional impairment charge against property, plant and equipment.
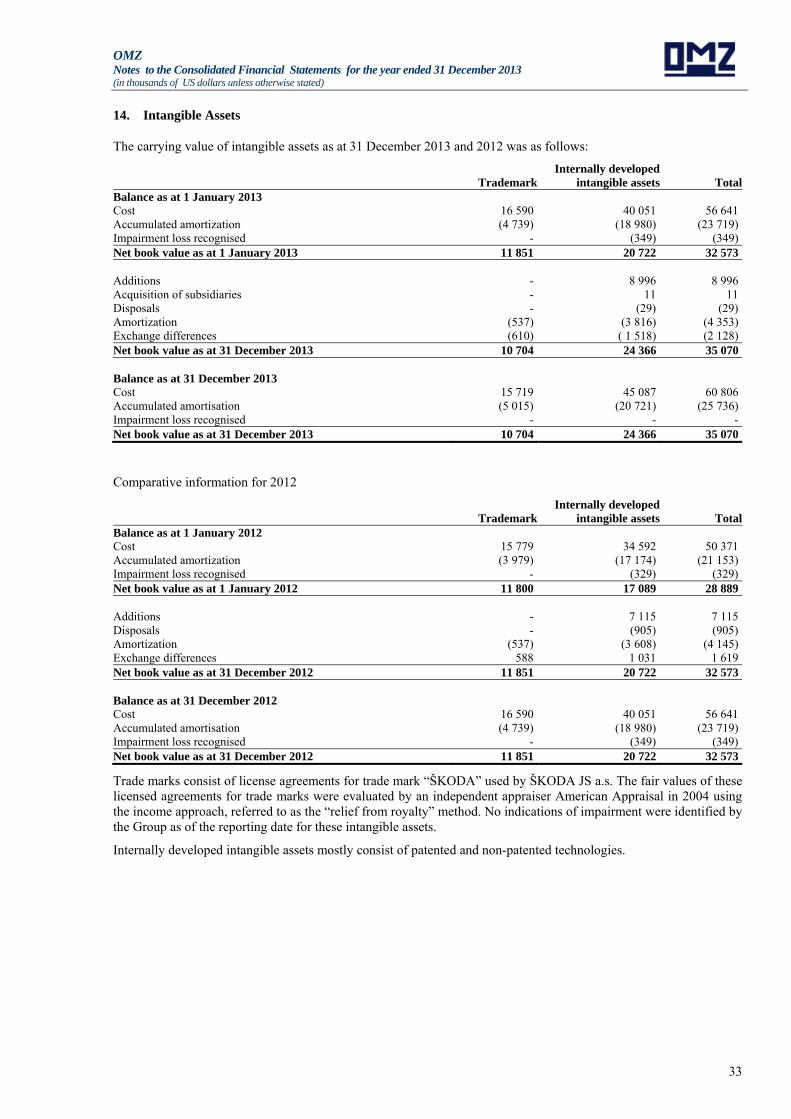
OMZ Notes to the Consolidated Financial Statements for the year ended 31 December 2013 (in thousands of US dollars unless otherwise stated)
33
14. Intangible Assets
The carrying value of intangible assets as at 31 December 2013 and 2012 was as follows:
TrademarkInternally developed
intangible assets TotalBalance as at 1 January 2013 Cost 16 590 40 051 56 641 Accumulated amortization (4 739) (18 980) (23 719) Impairment loss recognised - (349) (349) Net book value as at 1 January 2013 11 851 20 722 32 573 Additions - 8 996 8 996Acquisition of subsidiaries - 11 11Disposals - (29) (29)Amortization (537) (3 816) (4 353)Exchange differences (610) ( 1 518) (2 128)Net book value as at 31 December 2013 10 704 24 366 35 070 Balance as at 31 December 2013 Cost 15 719 45 087 60 806Accumulated amortisation (5 015) (20 721) (25 736)Impairment loss recognised - - -Net book value as at 31 December 2013 10 704 24 366 35 070
Comparative information for 2012
TrademarkInternally developed
intangible assets TotalBalance as at 1 January 2012 Cost 15 779 34 592 50 371Accumulated amortization (3 979) (17 174) (21 153)Impairment loss recognised - (329) (329)Net book value as at 1 January 2012 11 800 17 089 28 889 Additions - 7 115 7 115Disposals - (905) (905)Amortization (537) (3 608) (4 145)Exchange differences 588 1 031 1 619Net book value as at 31 December 2012 11 851 20 722 32 573 Balance as at 31 December 2012 Cost 16 590 40 051 56 641Accumulated amortisation (4 739) (18 980) (23 719)Impairment loss recognised - (349) (349)Net book value as at 31 December 2012 11 851 20 722 32 573
Trade marks consist of license agreements for trade mark “ŠKODA” used by ŠKODA JS a.s. The fair values of these licensed agreements for trade marks were evaluated by an independent appraiser American Appraisal in 2004 using the income approach, referred to as the “relief from royalty” method. No indications of impairment were identified by the Group as of the reporting date for these intangible assets.
Internally developed intangible assets mostly consist of patented and non-patented technologies.
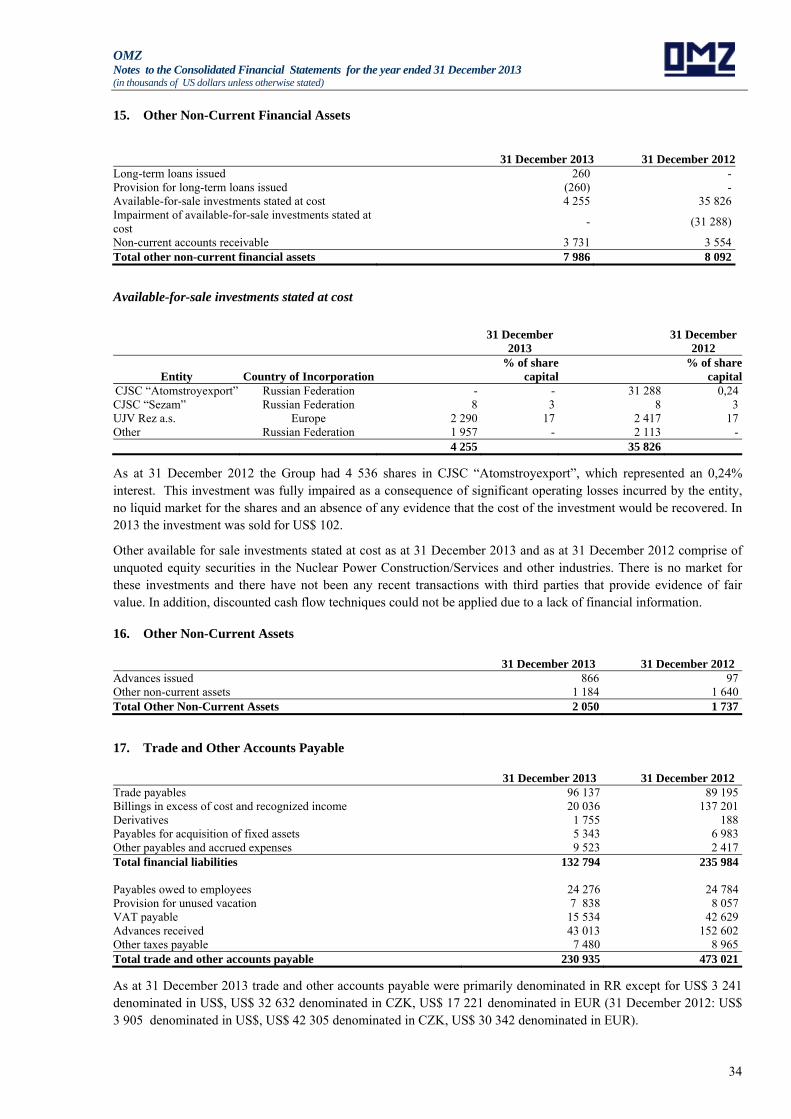
OMZ Notes to the Consolidated Financial Statements for the year ended 31 December 2013 (in thousands of US dollars unless otherwise stated)
34
15. Other Non-Current Financial Assets
31 December 2013 31 December 2012Long-term loans issued 260 -Provision for long-term loans issued (260) -Available-for-sale investments stated at cost 4 255 35 826Impairment of available-for-sale investments stated at cost
- (31 288)
Non-current accounts receivable 3 731 3 554Total other non-current financial assets 7 986 8 092
Available-for-sale investments stated at cost
31 December
2013 31 December
2012
Entity Country of Incorporation % of share
capital % of share
capitalCJSC “Atomstroyexport” Russian Federation - - 31 288 0,24CJSC “Sezam” Russian Federation 8 3 8 3UJV Rez a.s. Europe 2 290 17 2 417 17Other Russian Federation 1 957 - 2 113 - 4 255 35 826
As at 31 December 2012 the Group had 4 536 shares in CJSC “Atomstroyexport”, which represented an 0,24% interest. This investment was fully impaired as a consequence of significant operating losses incurred by the entity, no liquid market for the shares and an absence of any evidence that the cost of the investment would be recovered. In 2013 the investment was sold for US$ 102.
Other available for sale investments stated at cost as at 31 December 2013 and as at 31 December 2012 comprise of unquoted equity securities in the Nuclear Power Construction/Services and other industries. There is no market for these investments and there have not been any recent transactions with third parties that provide evidence of fair value. In addition, discounted cash flow techniques could not be applied due to a lack of financial information.
16. Other Non-Current Assets
31 December 2013 31 December 2012 Advances issued 866 97Other non-current assets 1 184 1 640Total Other Non-Current Assets 2 050 1 737
17. Trade and Other Accounts Payable
31 December 2013 31 December 2012 Trade payables 96 137 89 195Billings in excess of cost and recognized income 20 036 137 201Derivatives 1 755 188Payables for acquisition of fixed assets 5 343 6 983Other payables and accrued expenses 9 523 2 417Total financial liabilities 132 794 235 984 Payables owed to employees 24 276 24 784Provision for unused vacation 7 838 8 057VAT payable 15 534 42 629Advances received 43 013 152 602Other taxes payable 7 480 8 965Total trade and other accounts payable 230 935 473 021
As at 31 December 2013 trade and other accounts payable were primarily denominated in RR except for US$ 3 241 denominated in US$, US$ 32 632 denominated in CZK, US$ 17 221 denominated in EUR (31 December 2012: US$ 3 905 denominated in US$, US$ 42 305 denominated in CZK, US$ 30 342 denominated in EUR).
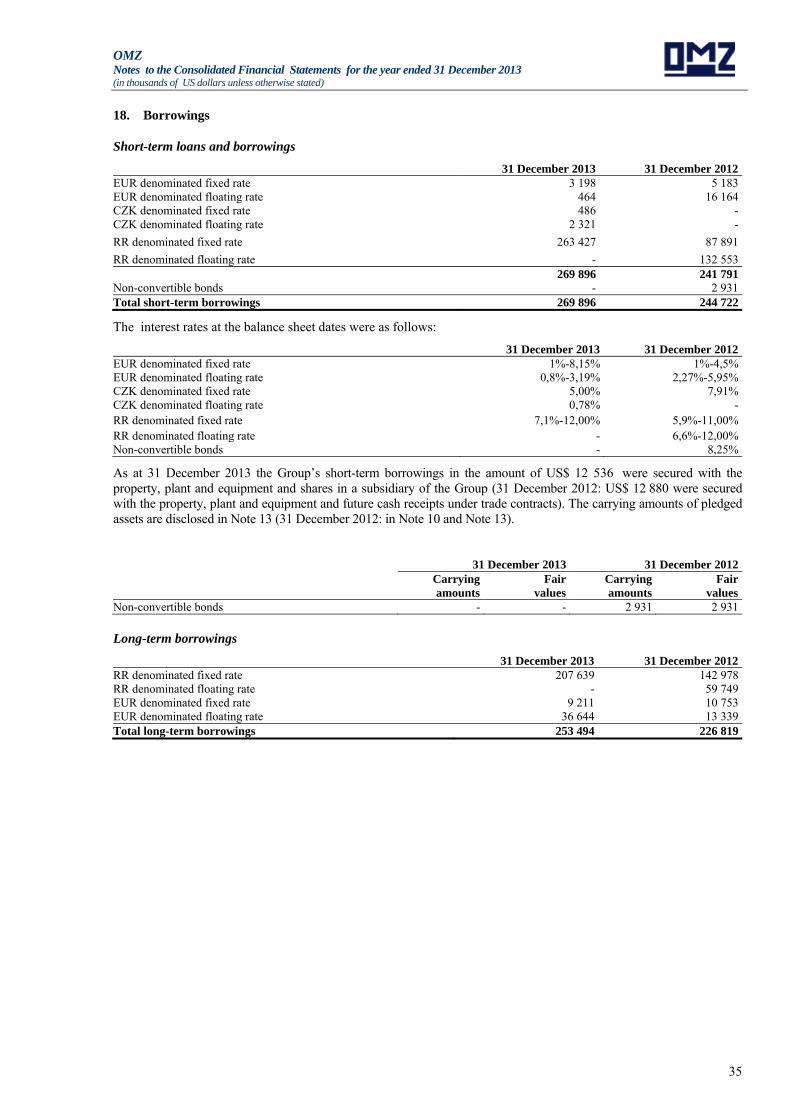
OMZ Notes to the Consolidated Financial Statements for the year ended 31 December 2013 (in thousands of US dollars unless otherwise stated)
35
18. Borrowings
Short-term loans and borrowings
31 December 2013 31 December 2012EUR denominated fixed rate 3 198 5 183EUR denominated floating rate 464 16 164CZK denominated fixed rate 486 -CZK denominated floating rate 2 321 -
RR denominated fixed rate 263 427 87 891
RR denominated floating rate - 132 553 269 896 241 791Non-convertible bonds - 2 931Total short-term borrowings 269 896 244 722
The interest rates at the balance sheet dates were as follows:
31 December 2013 31 December 2012EUR denominated fixed rate 1%-8,15% 1%-4,5%EUR denominated floating rate 0,8%-3,19% 2,27%-5,95%CZK denominated fixed rate 5,00% 7,91%CZK denominated floating rate 0,78% -RR denominated fixed rate 7,1%-12,00% 5,9%-11,00%RR denominated floating rate - 6,6%-12,00%Non-convertible bonds - 8,25%
As at 31 December 2013 the Group’s short-term borrowings in the amount of US$ 12 536 were secured with the property, plant and equipment and shares in a subsidiary of the Group (31 December 2012: US$ 12 880 were secured with the property, plant and equipment and future cash receipts under trade contracts). The carrying amounts of pledged assets are disclosed in Note 13 (31 December 2012: in Note 10 and Note 13).
31 December 2013 31 December 2012Carrying amounts
Fair values
Carrying amounts
Fair values
Non-convertible bonds - - 2 931 2 931
Long-term borrowings
31 December 2013 31 December 2012RR denominated fixed rate 207 639 142 978RR denominated floating rate - 59 749EUR denominated fixed rate 9 211 10 753EUR denominated floating rate 36 644 13 339Total long-term borrowings 253 494 226 819

OMZ Notes to the Consolidated Financial Statements for the year ended 31 December 2013 (in thousands of US dollars unless otherwise stated)
36
18. Borrowings (Continued)
The carrying amounts and fair values of long-term borrowings are as follows:
31 December 2013 31 December 2012Carrying amounts
Fair values
Carrying amounts
Fair values
Long-term borrowings 253 494 253 494 226 819 226 819
The interest rates of long-term borrowings at the reporting date were as follows:
31 December 2013 31 December 2012RR denominated fixed rate 8,15%-12,00% 7,40%-9,25%RR denominated floating rate - 8,20%-12,00%EUR denominated fixed rate 5,28%-8,15% 1,00%-5,95%EUR denominated floating rate 3,19% 2,27%-8,15%
As at 31 December 2013, long-term borrowings totalling US$ 104 444 (31 December 2012: US$ 142 519) are secured with the property, plant and equipment of the Group (Note 13 ).
As at 31 December 2013 long-term loans had the following maturity profile:
2015 2016 and after Total RR denominated fixed rate 172 452 35 187 207 639EUR denominated floating rate 36 644 - 36 644EUR denominated fixed rate - 9 211 9 211 209 096 44 398 253 494
As at 31 December 2012 long-term loans had the following maturity profile:
2014 2015 and after Total RR denominated fixed rate 8 183 134 795 142 978 RR denominated floating rate 58 441 1 308 59 749EUR denominated fixed rate - 10 753 10 753 EUR denominated floating rate 11 091 2 248 13 339
77 715 149 104 226 819
19. Other Long-Term Liabilities
31 December 2013 31 December 2012
Trade payables, long-term 7 985 7 314 Long-term advances received 9 075 8 850 Billings in excess of cost and recognized income - non-current portion 86 8 710 VAT payable - 370
Other long-term liabilities 17 146 25 244
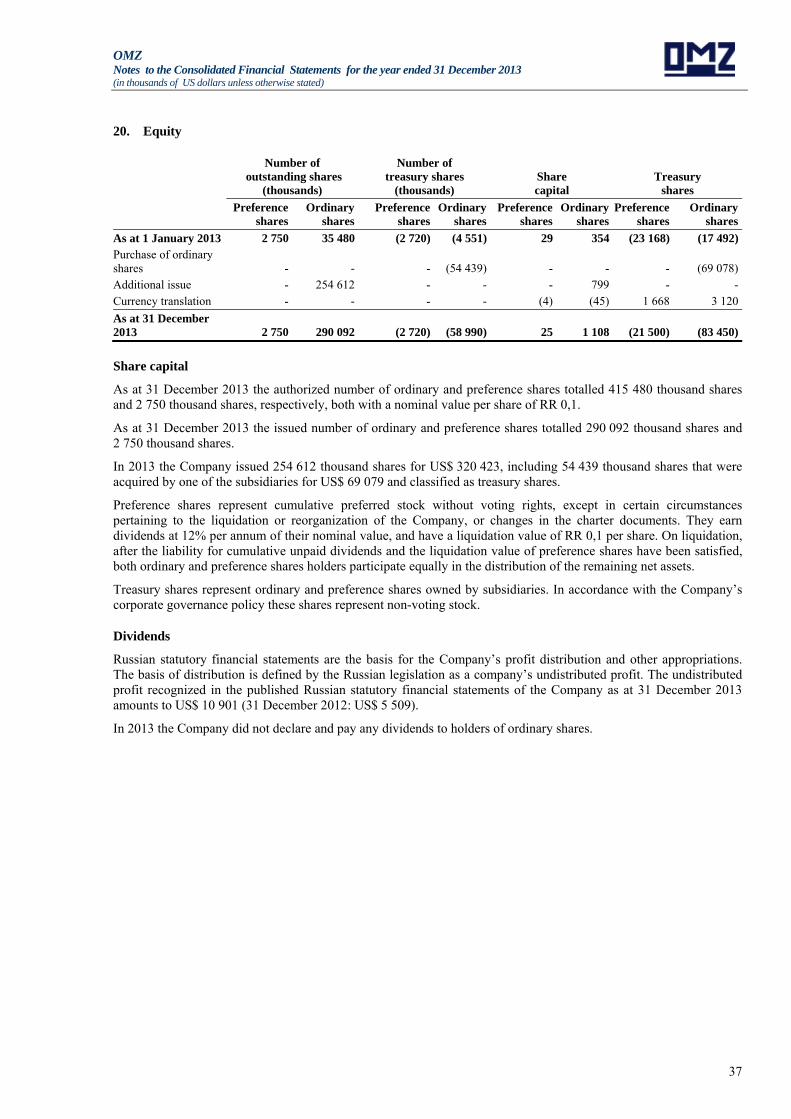
OMZ Notes to the Consolidated Financial Statements for the year ended 31 December 2013 (in thousands of US dollars unless otherwise stated)
37
20. Equity
Number of outstanding shares
(thousands)
Number of treasury shares
(thousands) Share capital
Treasury shares
Preference
shares Ordinary
sharesPreference
sharesOrdinary
sharesPreference
sharesOrdinary
shares Preference
sharesOrdinary
shares
As at 1 January 2013 2 750 35 480 (2 720) (4 551) 29 354 (23 168) (17 492)Purchase of ordinary shares - - - (54 439) - - - (69 078) Additional issue - 254 612 - - - 799 - - Currency translation - - - - (4) (45) 1 668 3 120
As at 31 December 2013 2 750 290 092 (2 720) (58 990) 25 1 108 (21 500) (83 450)
Share capital
As at 31 December 2013 the authorized number of ordinary and preference shares totalled 415 480 thousand shares and 2 750 thousand shares, respectively, both with a nominal value per share of RR 0,1.
As at 31 December 2013 the issued number of ordinary and preference shares totalled 290 092 thousand shares and 2 750 thousand shares.
In 2013 the Company issued 254 612 thousand shares for US$ 320 423, including 54 439 thousand shares that were acquired by one of the subsidiaries for US$ 69 079 and classified as treasury shares.
Preference shares represent cumulative preferred stock without voting rights, except in certain circumstances pertaining to the liquidation or reorganization of the Company, or changes in the charter documents. They earn dividends at 12% per annum of their nominal value, and have a liquidation value of RR 0,1 per share. On liquidation, after the liability for cumulative unpaid dividends and the liquidation value of preference shares have been satisfied, both ordinary and preference shares holders participate equally in the distribution of the remaining net assets.
Treasury shares represent ordinary and preference shares owned by subsidiaries. In accordance with the Company’s corporate governance policy these shares represent non-voting stock.
Dividends
Russian statutory financial statements are the basis for the Company’s profit distribution and other appropriations. The basis of distribution is defined by the Russian legislation as a company’s undistributed profit. The undistributed profit recognized in the published Russian statutory financial statements of the Company as at 31 December 2013 amounts to US$ 10 901 (31 December 2012: US$ 5 509).
In 2013 the Company did not declare and pay any dividends to holders of ordinary shares.

OMZ Notes to the Consolidated Financial Statements for the year ended 31 December 2013 (in thousands of US dollars unless otherwise stated)
38
21. Construction Contracts
The revenues and gross margin recognised on long-term contracts amounted to:
Year ended
31 December 2013
Year ended
31 December 2012Contract revenue 537 278 494 838Contract costs (454 288) (366 034)Gross margin 82 990 128 804
The following information is regarded to the construction contracts that are not fulfilled as at the reporting date including those contracts for which the final settlement of payment had not been carried out:
Year ended 31 December 2013
Year ended 31 December 2012
Progress billings 2 081 406 2 309 938Unbilled revenue 240 413 (7 304)Contract revenue accumulated at the period end 2 321 819 2 302 634Contract costs accumulated at the period end (1 941 029) (1 982 120)Loss-making contracts (6 643) (2 493)Recognized profits less recognized losses 374 147 318 021Contract revenue accumulated at the period end 2 321 819 2 302 634Advances received under construction contracts (2 078 739) (2 308 238)Net-off reserves with assets (2 667) (1 700)Net receivables / (payables) to customers 240 413 (7 304)Accounts due from customers for construction work (Note 10) 260 535 138 607Billings in excess of cost and recognized income (Notes 17,19) (20 122) (145 911)Net receivables/ (payables) to customers 240 413 (7 304)
Retention payments 10 855 9 730
The Group’s financial position with respect to construction contracts is disclosed in Notes 10, 17 and 19.
Advances received on construction contracts were netted off with accrued receivables in accordance with IAS 11 “Construction Contracts”.
As at 31 December 2013 retentions due from customers of construction contracts with a face value of US$ 10 855 (31 December 2012: US$ 9 730) had not been recognised as they could not be reliably measured due to significant uncertainty in respect of the probability and timing of collection of these amounts receivable.
22. Cost of Sales
Year ended
31 December 2013 Year ended
31 December 2012Changes in inventories of finished goods and work in progress 9 566 39 750Materials and components used 425 885 318 023Labour costs 152 101 133 719Services, including sub-contracting costs 139 586 133 852Gas and fuel 51 388 39 245Depreciation 39 343 31 851Amortisation of intangible assets 1 646 1 235Change in provision for inventory (722) (1 931)Other 19 307 7 913 Total cost of sales 838 100 703 657
Total personnel costs recognised in profit and loss amounted to US$ 235 033 (2012: US$ 206 368).
Year ended
31 December 2013 Year ended
31 December 2012Short-term employee benefits 184 204 160 183Termination payments 2 496 1 352Contributions to the Social Funds 48 333 44 833 Total personnel costs 235 033 206 368

OMZ Notes to the Consolidated Financial Statements for the year ended 31 December 2013 (in thousands of US dollars unless otherwise stated)
39
23. Selling Expenses
Year ended
31 December 2013 Year ended
31 December 2012
Transportation 8 172 8 748Services 5 777 10 663Labour costs 12 422 12 081Other 7 841 5 116
Total selling expenses 34 212 36 608
24. General and Administrative Expenses
Year ended
31 December 2013 Year ended
31 December 2012
Labour costs 70 510 60 568Services 17 015 20 210Taxes 7 836 6 487Depreciation 1 762 1 211Amortisation of intangible assets 2 705 2 908Administration overheads 6 240 5 657
Total general and administrative expenses 106 068 97 041
25. Other Operating Income and Expense
Other Operating Income
Year ended
31 December 2013 Year ended
31 December 2012
Gain from disposal inventory 646 760
Gain from disposal of property, plant and equipment 1 208 4 614
Income from operating lease 1 593 1 596
Gain from accounts payable write-off 111 249
Change in provision for VAT receivable 547 -
Gain from disposal of other non-current assets 16 -
Gain from disposal of intangible assets 255 -
Reversal of impairment of property, plant and equipment and intangible assets 12 -
Other income - 1 328
Total other operating income 4 388 8 547
Other Operating Expense
Year ended
31 December 2013 Year ended
31 December 2012
Impairment loss on fixed and intangible assets - (2 066)Loss from disposal of intangible assets - (312)Rent (2 154) (2 491) Fines and penalties ( 1 605) (1 089) Change in provision for doubtful accounts receivable (8 817) (2 737)Change in provision for tax receivable - (453)Other expenses ( 1 875) (2 116)
Total other operating expenses (14 451) (11 264)
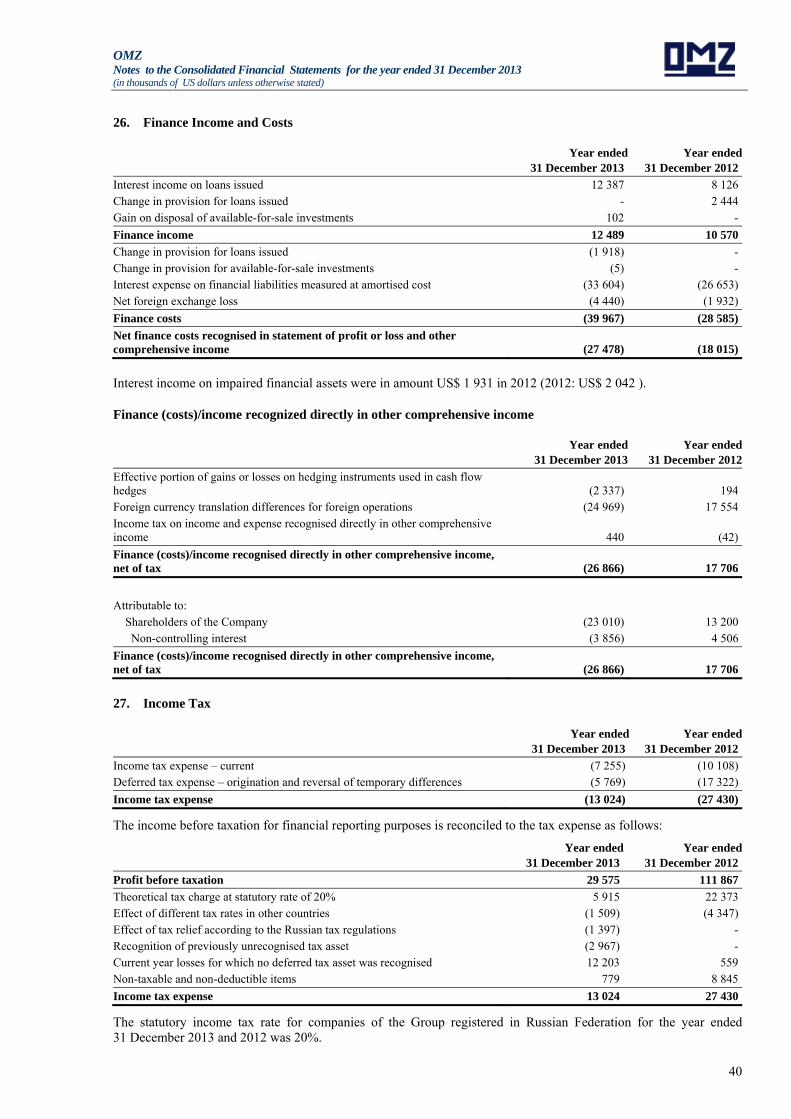
OMZ Notes to the Consolidated Financial Statements for the year ended 31 December 2013 (in thousands of US dollars unless otherwise stated)
40
26. Finance Income and Costs
Year ended
31 December 2013 Year ended
31 December 2012
Interest income on loans issued 12 387 8 126Change in provision for loans issued - 2 444Gain on disposal of available-for-sale investments 102 -
Finance income 12 489 10 570
Change in provision for loans issued (1 918) -Change in provision for available-for-sale investments (5) -Interest expense on financial liabilities measured at amortised cost (33 604) (26 653)Net foreign exchange loss (4 440) (1 932)
Finance costs (39 967) (28 585)
Net finance costs recognised in statement of profit or loss and other comprehensive income (27 478) (18 015)
Interest income on impaired financial assets were in amount US$ 1 931 in 2012 (2012: US$ 2 042 ).
Finance (costs)/income recognized directly in other comprehensive income
Year ended
31 December 2013Year ended
31 December 2012
Effective portion of gains or losses on hedging instruments used in cash flow hedges (2 337) 194Foreign currency translation differences for foreign operations (24 969) 17 554 Income tax on income and expense recognised directly in other comprehensive income 440 (42)
Finance (costs)/income recognised directly in other comprehensive income, net of tax (26 866) 17 706
Attributable to: Shareholders of the Company (23 010) 13 200 Non-controlling interest (3 856) 4 506
Finance (costs)/income recognised directly in other comprehensive income, net of tax (26 866) 17 706
27. Income Tax
Year ended
31 December 2013 Year ended
31 December 2012
Income tax expense – current (7 255) (10 108)Deferred tax expense – origination and reversal of temporary differences (5 769) (17 322)
Income tax expense (13 024) (27 430)
The income before taxation for financial reporting purposes is reconciled to the tax expense as follows:
Year ended
31 December 2013 Year ended
31 December 2012
Profit before taxation 29 575 111 867
Theoretical tax charge at statutory rate of 20% 5 915 22 373Effect of different tax rates in other countries (1 509) (4 347)Effect of tax relief according to the Russian tax regulations (1 397) -Recognition of previously unrecognised tax asset (2 967) -Current year losses for which no deferred tax asset was recognised 12 203 559Non-taxable and non-deductible items 779 8 845
Income tax expense 13 024 27 430
The statutory income tax rate for companies of the Group registered in Russian Federation for the year ended 31 December 2013 and 2012 was 20%.
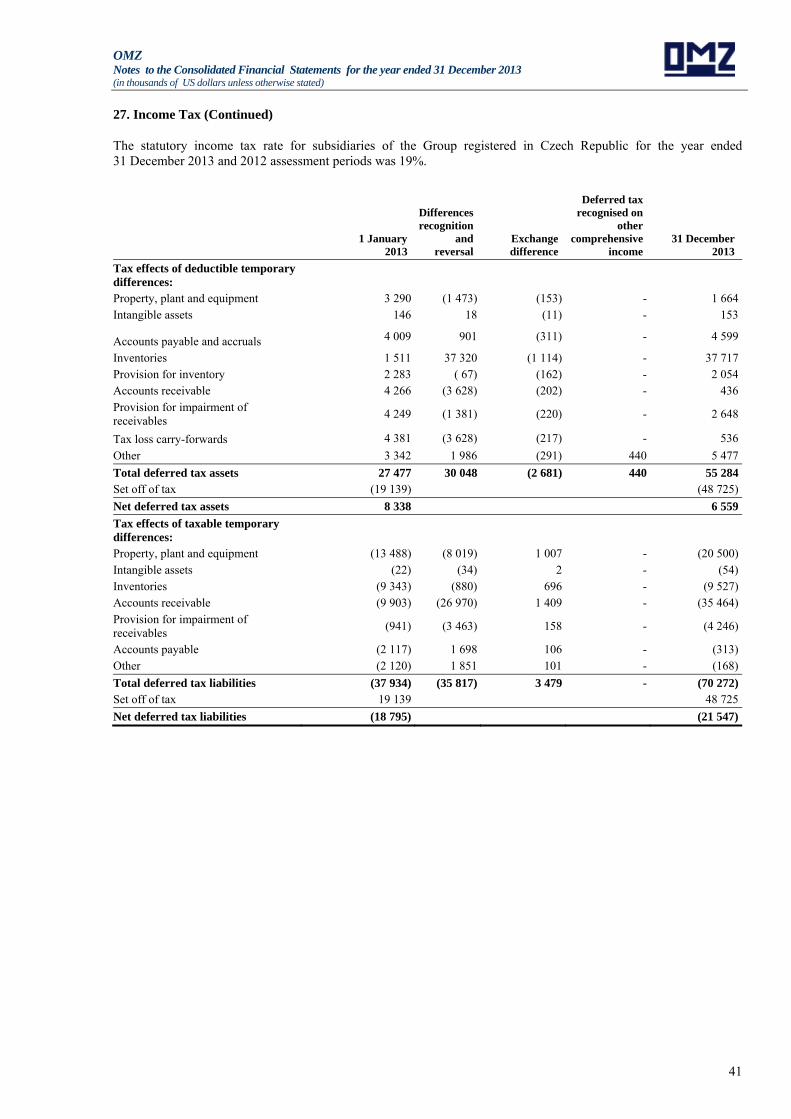
OMZ Notes to the Consolidated Financial Statements for the year ended 31 December 2013 (in thousands of US dollars unless otherwise stated)
41
27. Income Tax (Continued)
The statutory income tax rate for subsidiaries of the Group registered in Czech Republic for the year ended 31 December 2013 and 2012 assessment periods was 19%.
1 January
2013
Differences recognition
and reversal
Exchange difference
Deferred tax recognised on
other comprehensive
income 31 December
2013
Tax effects of deductible temporary differences: Property, plant and equipment 3 290 (1 473) (153) - 1 664Intangible assets 146 18 (11) - 153
Accounts payable and accruals 4 009 901 (311) - 4 599
Inventories 1 511 37 320 (1 114) - 37 717Provision for inventory 2 283 ( 67) (162) - 2 054Accounts receivable 4 266 (3 628) (202) - 436Provision for impairment of receivables
4 249 (1 381) (220) - 2 648
Tax loss carry-forwards 4 381 (3 628) (217) - 536
Other 3 342 1 986 (291) 440 5 477
Total deferred tax assets 27 477 30 048 (2 681) 440 55 284Set off of tax (19 139) (48 725)
Net deferred tax assets 8 338 6 559
Tax effects of taxable temporary differences:
Property, plant and equipment (13 488) (8 019) 1 007 - (20 500)Intangible assets (22) (34) 2 - (54)Inventories (9 343) (880) 696 - (9 527)Accounts receivable (9 903) (26 970) 1 409 - (35 464)Provision for impairment of receivables
(941) (3 463) 158 - (4 246)
Accounts payable (2 117) 1 698 106 - (313)Other (2 120) 1 851 101 - (168)
Total deferred tax liabilities (37 934) (35 817) 3 479 - (70 272)Set off of tax 19 139 48 725
Net deferred tax liabilities (18 795) (21 547)

OMZ Notes to the Consolidated Financial Statements for the year ended 31 December 2013 (in thousands of US dollars unless otherwise stated)
42
27. Income Tax (Continued)
Comparative information for year 2012:
1 January 2012
Differencesrecognition
and reversalExchange difference
Deferred tax recognised on
other comprehensive
income 31 December
2012
Tax effects of deductible temporary differences: Property, plant and equipment 5 490 (2 486) 286 - 3 290 Intangible assets 1 900 (1 797) 43 - 146 Accounts payable and accruals 3 224 578 207 - 4 009 Inventories 3 960 (2 625) 176 - 1 511 Provision for inventory 3 312 (1 200) 171 - 2 283 Accounts receivable 11 040 (7 256) 482 - 4 266 Provision for impairment of receivables 594 3 512 143 - 4 249 Tax loss carry-forwards 2 695 1 489 197 - 4 381 Other 5 558 (2 488) 272 - 3 342
Total deferred tax assets 37 773 (12 273) 1 977 - 27 477Set off of tax (23 948) (19 139)
Net deferred tax assets 13 825 8 338
Tax effects of taxable temporary differences: Property, plant and equipment (10 422) ( 2 458) (608) - (13 488)Intangible assets (226) 213 (9) - (22)Inventories (7 591) (1 267) (485) - (9 343)Accounts receivable (3 488) (6 074) (341) - (9 903)Provision for impairment of receivables (6 542) 5 858 (257) - (941)Accounts payable (624) (1 422) (71) - (2 117)Other (2 057) 101 (122) (42) (2 120)
Total deferred tax liabilities (30 950) (5 049) (1 893) (42) (37 934)Set off of tax 23 948 19 139
Net deferred tax liabilities ( 7 002) (18 795)
In the context of the Group’s current structure, tax losses and current tax assets of the different companies may not be set off against current tax liabilities and taxable profits of other companies and, accordingly, taxes may accrue even where there is a net consolidated tax loss. Therefore, the deferred tax asset of one company of the Group cannot be offset against the deferred tax liability of another company.
The tax losses, for which the deferred tax asset was recognized as at the reporting date, expire in 2018-2023.
Deferred tax assets of US$ 29 807 (31 December 2012: US$ 20 125) have not been recognised in respect of the tax losses because it is not probable that future taxable profit will be available against which the Group can utilise these benefits therefrom. These tax losses in the amount of RR US$ 29 807 will expire in 2018-2023.
As at 31 December 2013 the Group has not recognized a deferred tax liability of US$ 33 078 (31 December 2012: US$ 35 644) in respect of temporary differences associated with investments in subsidiaries as the Company is able to control the timing of the reversal of those temporary differences and does not intend to reverse them in the foreseeable future.
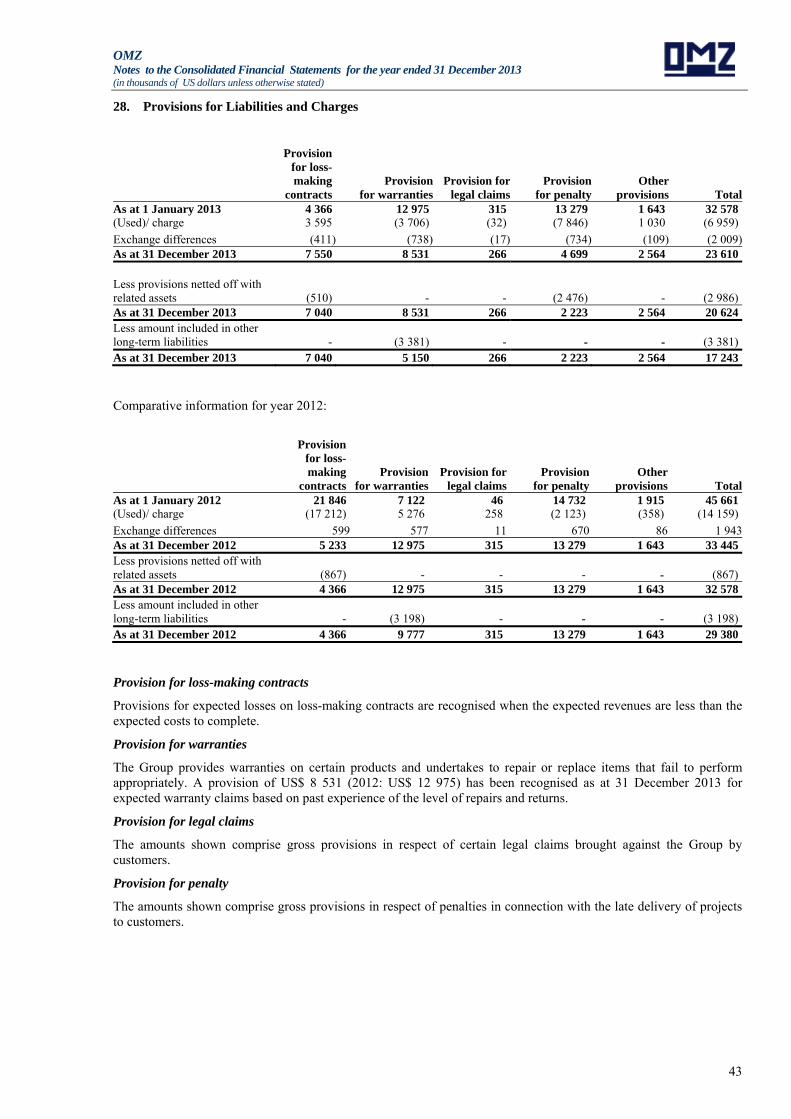
OMZ Notes to the Consolidated Financial Statements for the year ended 31 December 2013 (in thousands of US dollars unless otherwise stated)
43
28. Provisions for Liabilities and Charges
Provision for loss-making
contractsProvision
for warrantiesProvision for
legal claims Provision
for penalty Other
provisions TotalAs at 1 January 2013 4 366 12 975 315 13 279 1 643 32 578 (Used)/ charge 3 595 (3 706) (32) (7 846) 1 030 (6 959)
Exchange differences (411) (738) (17) (734) (109) (2 009)As at 31 December 2013 7 550 8 531 266 4 699 2 564 23 610
Less provisions netted off with related assets (510) - - (2 476) - (2 986)As at 31 December 2013 7 040 8 531 266 2 223 2 564 20 624Less amount included in other long-term liabilities - (3 381) - - - (3 381)As at 31 December 2013 7 040 5 150 266 2 223 2 564 17 243
Comparative information for year 2012:
Provision for loss-making
contractsProvision
for warrantiesProvision for
legal claims Provision
for penalty Other
provisions TotalAs at 1 January 2012 21 846 7 122 46 14 732 1 915 45 661(Used)/ charge (17 212) 5 276 258 (2 123) (358) (14 159)
Exchange differences 599 577 11 670 86 1 943As at 31 December 2012 5 233 12 975 315 13 279 1 643 33 445Less provisions netted off with related assets (867) - - - - (867)As at 31 December 2012 4 366 12 975 315 13 279 1 643 32 578Less amount included in other long-term liabilities - (3 198) - - - (3 198)As at 31 December 2012 4 366 9 777 315 13 279 1 643 29 380
Provision for loss-making contracts
Provisions for expected losses on loss-making contracts are recognised when the expected revenues are less than the expected costs to complete.
Provision for warranties
The Group provides warranties on certain products and undertakes to repair or replace items that fail to perform appropriately. A provision of US$ 8 531 (2012: US$ 12 975) has been recognised as at 31 December 2013 for expected warranty claims based on past experience of the level of repairs and returns.
Provision for legal claims
The amounts shown comprise gross provisions in respect of certain legal claims brought against the Group by customers.
Provision for penalty
The amounts shown comprise gross provisions in respect of penalties in connection with the late delivery of projects to customers.
OMZ Notes to the Consolidated Financial Statements for the year ended 31 December 2013 (in thousands of US dollars unless otherwise stated)
44
29. Contingencies, Commitments and Operating Risks
Capital commitments
As at 31 December 2013 the Group had contractual commitments for the purchase of property, plant and equipment from third parties for US$ 32 235 (31 December 2012: US$ 27 695) and from related parties for US$ 12 485 (31 December 2012: US$ 14 183).
Long-term contracts
For contingencies and operating risks related to long-term construction contracts, see Notes 4 and 21.
Taxation
The taxation system in the Russian Federation continues to evolve and is characterised by frequent changes in legislation, official pronouncements and court decisions, which are sometimes contradictory and subject to varying interpretation by different tax authorities. Taxes are subject to review and investigation by a number of authorities, which have the authority to impose severe fines, penalties and interest charges. A tax year remains open for review by the tax authorities during the three subsequent calendar years; however, under certain circumstances a tax year may remain open longer. Recent events within the Russian Federation suggest that the tax authorities are taking a more assertive and substance-based position in their interpretation and enforcement of tax legislation.
New transfer pricing legislation enacted in the Russian Federation starting from 1 January 2012 provides for major modifications making local transfer pricing rules closer to OECD guidelines, but creating additional uncertainty in practical application of tax legislation in certain circumstances. The new transfer pricing rules introduce an obligation for the taxpayers to prepare transfer pricing documentation with respect to controlled transactions and prescribe new basis and mechanisms for accruing additional taxes and interest in case prices in the controlled transactions differ from the market level. The new transfer pricing rules eliminated the 20-percent price safe harbour that existed under the previous transfer pricing rules applicable to transactions on or prior to 31 December 2011.
The new transfer pricing rules primarily apply to cross-border transactions between related parties, as well as to certain cross-border transactions between independent parties, as determined under the Russian Tax Code. In addition, the rules apply to in-country transactions between related parties if the accumulated annual volume of the transactions between the same parties exceeds a particular threshold (RR 3 billion in 2012, RR 2 billion in 2013, and RR 1 billion in 2014 and thereon). Since there is no practice of applying the new transfer pricing rules by the tax authorities and courts, it is difficult to predict the effect of the new transfer pricing rules on these consolidated financial statements.
These circumstances may create tax risks in the Russian Federation that are substantially more significant than in other countries. Management believes that it has provided adequately for tax liabilities based on its interpretations of applicable Russian tax legislation, official pronouncements and court decisions. However, the interpretations of the relevant authorities could differ and the effect on these consolidated financial statements, if the authorities were successful in enforcing their interpretations, could be significant.
Environmental matters
The enforcement of environmental regulation in the Russian Federation is evolving and the enforcement posture of government authorities is continually being reconsidered. The Group periodically evaluates its obligations under environmental regulations. As obligations are determined, they are recognised immediately. Potential liabilities, which might arise as a result of changes in existing regulations, civil litigation or legislation, cannot be estimated but could be material. In the current enforcement climate under existing legislation, management believes that there are no significant liabilities for environmental damage.
Legal proceedings
During the year, the Group was involved in a number of court proceedings (both as a plaintiff and a defendant) arising in the ordinary course of business. In the opinion of management, there are no current legal proceedings or other claims outstanding, which could have a material effect on the result of operations or financial position of the Group, and which have not been accrued or disclosed in these consolidated financial statements.
Guarantees
As at 31 December 2013 and 2012, the Group had no guarantees for related parties loans payable to an ultimate parent company.
The Group’s borrowings were secured by the ultimate parent company and by third parties in the amount of US$ 8 940 (31 December 2012: US$ 7 730).
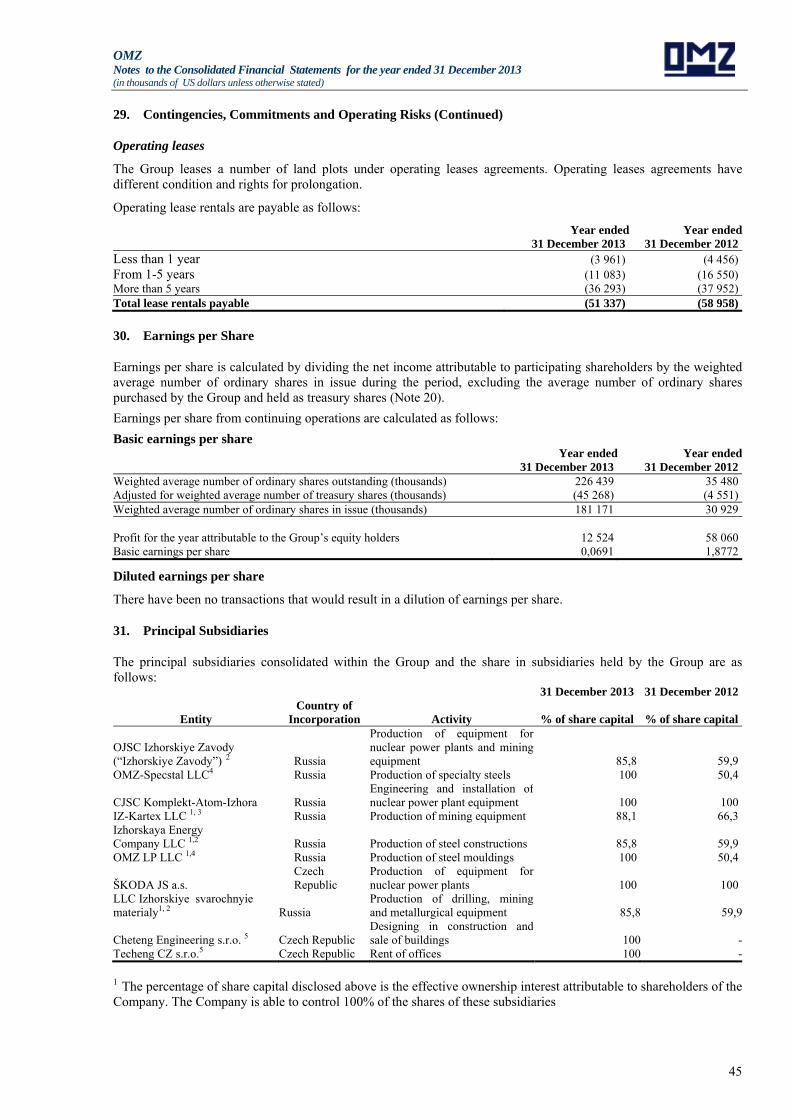
OMZ Notes to the Consolidated Financial Statements for the year ended 31 December 2013 (in thousands of US dollars unless otherwise stated)
45
29. Contingencies, Commitments and Operating Risks (Continued)
Operating leases
The Group leases a number of land plots under operating leases agreements. Operating leases agreements have different condition and rights for prolongation.
Operating lease rentals are payable as follows:
Year ended
31 December 2013 Year ended
31 December 2012Less than 1 year (3 961) (4 456)From 1-5 years (11 083) (16 550)More than 5 years (36 293) (37 952)Total lease rentals payable (51 337) (58 958)
30. Earnings per Share
Earnings per share is calculated by dividing the net income attributable to participating shareholders by the weighted average number of ordinary shares in issue during the period, excluding the average number of ordinary shares purchased by the Group and held as treasury shares (Note 20).
Earnings per share from continuing operations are calculated as follows:
Basic earnings per share
Year ended
31 December 2013 Year ended
31 December 2012Weighted average number of ordinary shares outstanding (thousands) 226 439 35 480Adjusted for weighted average number of treasury shares (thousands) (45 268) (4 551)Weighted average number of ordinary shares in issue (thousands) 181 171 30 929 Profit for the year attributable to the Group’s equity holders 12 524 58 060Basic earnings per share 0,0691 1,8772
Diluted earnings per share
There have been no transactions that would result in a dilution of earnings per share.
31. Principal Subsidiaries
The principal subsidiaries consolidated within the Group and the share in subsidiaries held by the Group are as follows:
31 December 2013 31 December 2012
Entity Country of
Incorporation Activity % of share capital % of share capital
OJSC Izhorskiye Zavody (“Izhorskiye Zavody”) 2 Russia
Production of equipment for nuclear power plants and mining equipment 85,8 59,9
OMZ-Specstal LLC4 Russia Production of specialty steels 100 50,4
CJSC Komplekt-Atom-Izhora Russia Engineering and installation of nuclear power plant equipment 100 100
IZ-Kartex LLC 1, 3 Russia Production of mining equipment 88,1 66,3Izhorskaya Energy Company LLC 1,2 Russia Production of steel constructions 85,8 59,9OMZ LP LLC 1,4 Russia Production of steel mouldings 100 50,4
ŠKODA JS a.s. Czech Republic
Production of equipment for nuclear power plants 100 100
LLC Izhorskiye svarochnyie materialy1, 2 Russia
Production of drilling, mining and metallurgical equipment 85,8 59,9
Cheteng Engineering s.r.o. 5 Czech Republic Designing in construction and sale of buildings 100 -
Techeng CZ s.r.o.5 Czech Republic Rent of offices 100 -
1 The percentage of share capital disclosed above is the effective ownership interest attributable to shareholders of the Company. The Company is able to control 100% of the shares of these subsidiaries

OMZ Notes to the Consolidated Financial Statements for the year ended 31 December 2013 (in thousands of US dollars unless otherwise stated)
46
31. Principal Subsidiaries (Continued)
2The Group increased its ownership interest in OJSC Izhorskiye Zavody by 25,93% increasing its effective ownership interest in OJSC Izhorskiye Zavody and its subsidiaries to 85,84% in March 2013. The price of additional shares was US$ 60 108.
3 As a result of acquisition additional ownership interest in OJSC Izhorskiye Zavody the Group in addition got an effective ownership interest in IZ-Kartex LLC im. P.G. Korobkov for 21,78% in March 2013.
4 The Group increased its ownership interest in OMZ-Specstal LLC for 49,64% increasing its effective ownership interest in OMZ-Specstal LLC and its subsidiaries to 100% in June 2013. The price of additional shares was US$ 88 136.
5 The Group acquired 100% interest in Сhetehg Engineering s.r.o. and Techeng CZ s.r.o. in January 2013 for US$ 12 000 and US$ 4 184 respectively, from an entity under common control.
32. Business Combinations and Disposals
Transactions with non-controlling interest
OJSC Izhorskiye Zavody
The Group increased its ownership interest in OJSC Izhorskiye Zavody by 25,93% increasing its effective ownership interest and its subsidiaries to 85,84% in March 2013. The purchase price of additional shares was US$ 60 108.
As a result, the non-controlling interest in OJSC Izhorskie zavody and its subsidiaries decreased by US$ 46 534 and the Group’s retained earnings decreased by US$ 13 574.
OMZ-Specstal
The Group increased its ownership interest in OMZ-Specstal LLC by 49,64% increasing its effective ownership interest and its subsidiaries to 100% in June 2013. The purchase price of additional shares was US$ 88 136.
As a result, the non-controlling interest in OMZ-Specstal LLC and its subsidiaries decreased by US$ 32 300 and the Group’s retained earnings decreased by US$ 55 836.
Acquisition of subsidiary companies
CHETENG Engineering s.r.o.
In January 2013 the Group obtained control over CHETENG Engineering s.r.o., which is engaged in the design in the construction and sale of buildings, by acquiring 100% of the shares from an entity under common control. In accordance with the Group’s accounting policy, the assets and liabilities of the acquired subsidiary were recognized in the consolidated financial statement on the predecessor basis and the excess of consideration paid over the net assets acquired was recognized directly in the retained earnings. From the date of acquisition to 31 December 2013 CHETENG Engineering s.r.o earned revenue of US$ 89 and incurred loss of US$ 2 166. The following summarizes the major classes of the recognised amounts of assets and liabilities acquired by the Group at the date of the control:

OMZ Notes to the Consolidated Financial Statements for the year ended 31 December 2013 (in thousands of US dollars unless otherwise stated)
47
32. Business Combinations and Disposals (Continued)
Recognised value on acquisitionCash and cash equivalents 54Trade and other receivables 137Advances to suppliers 17Inventories 322Intangible assets 11Trade and other payables (620)Short-term borrowings (6 750)Book value of the subsidiary net assets acquired (6 829)Excess of consideration paid over net assets acquired 18 829Total consideration paid 12 000Less: cash and cash equivalents held by the acquired subsidiary (54)Outflow cash and cash equivalents at acquisition 11 946 TECHENG CZ s.r.o.
In January 2013 the Group obtained control of TECHENG CZ s.r.o., which is engaged in the renting of offices, by acquiring 100% of the shares in the charter capital from an entity under common control. In accordance with the Group’s accounting policy, the assets and liabilities of the acquired subsidiary were recognized in the consolidated financial statement on the predecessor basis and the excess of consideration paid over the net assets acquired was recognized directly in the retained earnings. From the date of acquisition to 31 December 2013 TECHENG CZ s.r.o earned revenue of US$ 319 and incurred loss of US$ 262. The following summarizes the major classes of the recognised amounts of assets and liabilities acquired by the Group at the date of the control: Recognised value on acquisitionCash and cash equivalents 3Trade and other receivables 148Advances to suppliers -Other current financial assets s 1Property, plant and equipment 930Trade and other payables (120)Short-term borrowings (1 176)Book value of the subsidiary net assets acquired (214)Excess of consideration paid over net assets acquired 4 398Total consideration paid 4 184Less: cash and cash equivalents held by the acquired subsidiary (3)Outflow cash and cash equivalents at acquisition 4 181
33. Investments in Associates
In 2013 the Group acquired a 34 % voting share in NPA, a.s. through its subsidiary Skoda JS. The price of the acquired share was US$ 5 929.
NPA a.s. is registered in Czech Republic.
The Group's share of loss of NPA, a.s. for the Year ended 31 December 2013 amounted to US$ 489.
The Group did not receive any dividends from NPA, a.s. during the Year ended 31 December 2013.
The table below sets forth summary financial information of NPA a.s. as at 31 December 2013:
Non-current assets 3 666Current assets 12 553Total assets 16 219Non-current liabilities (110)Current liabilities -Total liabilities (110)Income 1Expenses (1 440)Loss (1 439)

OMZ Notes to the Consolidated Financial Statements for the year ended 31 December 2013 (in thousands of US dollars unless otherwise stated)
48
34. Non-controlling Interest
During 2013 the Group had two subsidiaries with a substantial non-controlling interest.
The information for this subsidiary is as follows as at 31 December 2013:
Entity Country of
incorporation
Non-controlling interest at
31 December 2013, %
Profit/(Loss), distributed to non-controlling interest
for 2013 year
Accumulated non-controlling interest as at 31 December
2013
OJSC Izhorskiye Zavody and its subsidiaries Russia 14,16% 5 175 27 282
OMZ SpecStal (“SpecStal”) LLC and its subsidiaries Russia 0,00% (1 147) -
Total 4 027 27 282
1 In 2013 the Group acquired non-controlling interest (Note 32).
In 2013 the subsidiary did not pay any dividends to the holders of ordinary shares.
Summarized financial information before elimination of intercompany transactions is as follows:
OJSC Izhorskiye Zavody
and its subsidiaries
Non-current assets 181 146
Current assets 417 326
Long-term liabilities (131 238)
Current liabilities (266 315)
Net assets 200 919
Sales 513 272
Profit for the year 36 397
Total comprehensive income 36 397
Operating cash flows 12 507
Cash flows from investing activities 46 813
Cash flows from financing activities (66 102)
Net decrease in cash and cash equivalents (6 782)
Comparative information for year 2012:
Entity Country of
incorporation
Non-controlling interest at
31 December 2012, %
Profit, distributed to non-controlling
interest for 2012 year
Accumulated non-controlling interest as at 31 December
2012
OJSC Izhorskiye Zavody and its subsidiaries Russia 40,09% 24 544 70 878 OMZ-Specstal LLC and its subsidiaries Russia 49,64% 1 833 35 067
Total 26 377 105 945
In 2012 the subsidiaries did not pay any dividends to the holders of ordinary shares.
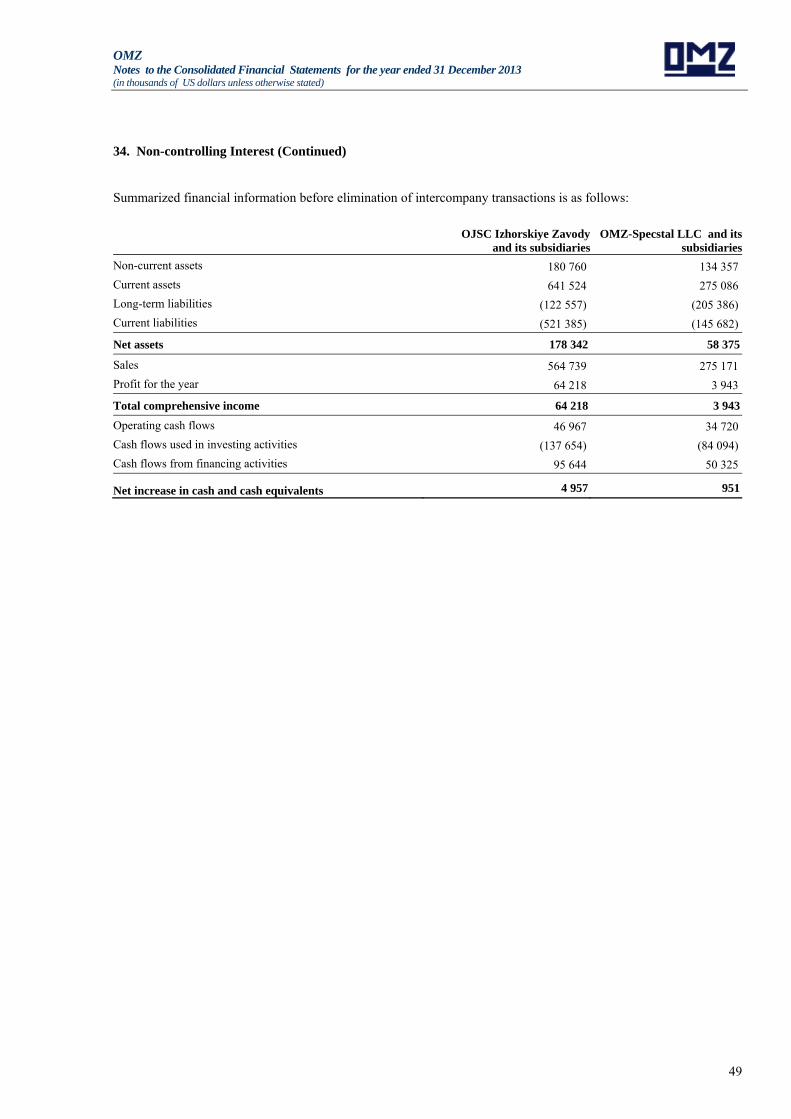
OMZ Notes to the Consolidated Financial Statements for the year ended 31 December 2013 (in thousands of US dollars unless otherwise stated)
49
34. Non-controlling Interest (Continued)
Summarized financial information before elimination of intercompany transactions is as follows:
OJSC Izhorskiye Zavody and its subsidiaries
OMZ-Specstal LLC and its subsidiaries
Non-current assets 180 760 134 357
Current assets 641 524 275 086
Long-term liabilities (122 557) (205 386)
Current liabilities (521 385) (145 682)
Net assets 178 342 58 375
Sales 564 739 275 171
Profit for the year 64 218 3 943
Total comprehensive income 64 218 3 943
Operating cash flows 46 967 34 720
Cash flows used in investing activities (137 654) (84 094)
Cash flows from financing activities 95 644 50 325
Net increase in cash and cash equivalents 4 957 951
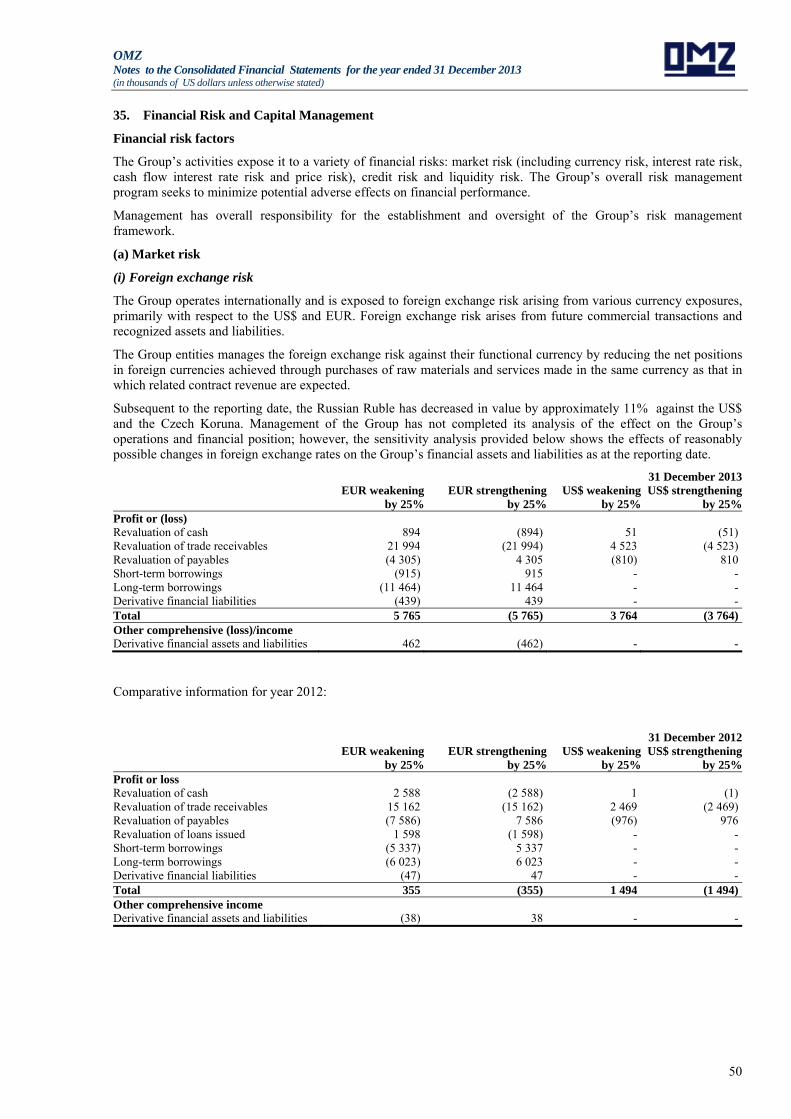
OMZ Notes to the Consolidated Financial Statements for the year ended 31 December 2013 (in thousands of US dollars unless otherwise stated)
50
35. Financial Risk and Capital Management
Financial risk factors
The Group’s activities expose it to a variety of financial risks: market risk (including currency risk, interest rate risk, cash flow interest rate risk and price risk), credit risk and liquidity risk. The Group’s overall risk management program seeks to minimize potential adverse effects on financial performance.
Management has overall responsibility for the establishment and oversight of the Group’s risk management framework.
(a) Market risk
(i) Foreign exchange risk
The Group operates internationally and is exposed to foreign exchange risk arising from various currency exposures, primarily with respect to the US$ and EUR. Foreign exchange risk arises from future commercial transactions and recognized assets and liabilities.
The Group entities manages the foreign exchange risk against their functional currency by reducing the net positions in foreign currencies achieved through purchases of raw materials and services made in the same currency as that in which related contract revenue are expected.
Subsequent to the reporting date, the Russian Ruble has decreased in value by approximately 11% against the US$ and the Czech Koruna. Management of the Group has not completed its analysis of the effect on the Group’s operations and financial position; however, the sensitivity analysis provided below shows the effects of reasonably possible changes in foreign exchange rates on the Group’s financial assets and liabilities as at the reporting date.
31 December 2013
EUR weakening
by 25%EUR strengthening
by 25%US$ weakening
by 25%US$ strengthening
by 25%Profit or (loss) Revaluation of cash 894 (894) 51 (51)Revaluation of trade receivables 21 994 (21 994) 4 523 (4 523)Revaluation of payables (4 305) 4 305 (810) 810Short-term borrowings (915) 915 - -Long-term borrowings (11 464) 11 464 - -Derivative financial liabilities (439) 439 - -Total 5 765 (5 765) 3 764 (3 764)Other comprehensive (loss)/income Derivative financial assets and liabilities 462 (462) - -
Comparative information for year 2012:
31 December 2012
EUR weakening
by 25%EUR strengthening
by 25%US$ weakening
by 25%US$ strengthening
by 25%Profit or loss Revaluation of cash 2 588 (2 588) 1 (1)Revaluation of trade receivables 15 162 (15 162) 2 469 (2 469)Revaluation of payables (7 586) 7 586 (976) 976Revaluation of loans issued 1 598 (1 598) - -Short-term borrowings (5 337) 5 337 - -Long-term borrowings (6 023) 6 023 - -Derivative financial liabilities (47) 47 - -Total 355 (355) 1 494 (1 494)Other comprehensive income Derivative financial assets and liabilities (38) 38 - -

OMZ Notes to the Consolidated Financial Statements for the year ended 31 December 2013 (in thousands of US dollars unless otherwise stated)
51
35. Financial Risk and Capital Management (Continued)
(ii) Interest rate risk
Interest rate risk arises from movements in interest rates which could affect the Group’s financial results or the value of the Group’s equity. A change in interest rates may cause variations in interest income and expense. Monitoring of current market interest rates and analysis of the Group’s interest-bearing position is performed by the corporate finance function as part of interest rate risk management procedures. Monitoring is performed taking into consideration refinancing, renewal of existing positions and alternative financing.
Changes in interest rates impact primarily loans and borrowings by changing either their fair value (fixed rate debt) or their future cash flows (variable rate debt).
Fair value sensitivity analysis for fixed rate instruments
The Group does not account for any fixed rate financial instruments at fair value through profit or loss or as available-for-sale. Therefore a change in interest rates at the reporting date would not have an effect on profit or loss or equity. The carrying amount of fixed interest debt is of US$ 483 961 (31 December 2012: US$ 246 805)
Cash flow sensitivity analysis for variable rate instruments
The carrying amount of variable interest debt is of US$ 39 429 (31 December 2012: US$ 221 805). An increase of 1 percent in variable interest rates at the reporting date would have decreased and profit or loss before tax by US$ 394 (2012: US$ 2 218). A decrease of 1 percent in interest rates at the reporting date would have increased equity and profit or loss before tax by US$ 394 (2012: US$ 2 218). These changes would have had no direct impact on other comprehensive income or equity.
This analysis assumes that all other variables, in particular foreign currency rates, remain constant. The analysis is performed on the same basis for 2012.
(iii) Derivatives
Nominal and fair value of derivatives:
Nominal value
31 December 2013 Nominal value
31 December 2012 Fair value
31 December 2013 Fair value
31 December 2012
Derivativeswith
positivefair value
Derivativeswith
negative fair value
Derivatives with
positive fair value
Derivativeswith
negativefair value Positive Negative Positive Negative
Hedging instruments Currency derivatives 3 681 33 585 - - 29 (1 292) - -Trading instruments Currency derivatives - 8 310 9 749 17 242 - (463) 137 (188)
(b) Credit risk
Credit risk is a risk of financial loss to the Group if a customer or counterparty to transaction fails to meet its contractual obligations and arises principally from the Group’s receivables from customers. The Group’s policy is generally to work with the customers on a partial prepayment basis. Significant advances payments are incorporated into contracts with customers. Bank guarantees and letters of credit are used to secure receivables from some customers. The Group’s standard contractual terms include penalty interest on late payments to encourage timely settlement.
The Group has a decentralized credit risk management function that is performed on an individual company basis. Monitoring of credit quality of customers is performed by analyzing whether they are overdue, in a difficult financial position or subject to bankruptcy. Customers within the equipment for nuclear power plants segment are government agencies or companies controlled by government. As at 31 December 2013 trade receivables and accounts due from customers for contract work related to equipment for nuclear power plants segment amounted to US$ 258 064 (31 December 2012: US$ 138 607). Although collection of receivables can be influenced by economic factors, management believes that there is no significant risk of loss to the Group beyond the provision already recorded (Note 10).
Cash and bank deposits are placed in financial institutions, which are considered to have minimal risk of default. The maximum exposure to credit risk is represented by the carrying amount of each financial asset in the statement of financial position.

OMZ Notes to the Consolidated Financial Statements for the year ended 31 December 2013 (in thousands of US dollars unless otherwise stated)
52
35. Financial Risk and Capital Management (Continued)
(b) Credit risk (Continued)
The table summarizes the maximum exposure to credit risk:
Carrying amount as at 31 December 2013
Non-impaired financial assets
not yet due
Non-impaired financial assets
past dueImpaired
financial assets TotalCash and cash equivalents 24 507 - - 24 507Trade receivables 116 700 17 915 15 869 150 484 Accounts due from customers for contract work 260 535 - 1 308 261 843Other receivables 9 146 410 14 850 24 406Short-term loans issued 11 357 - 27 413 38 770Promissory notes - - 7 586 7 586Positive fair values of financial derivatives 29 - - 29Available for-sale investments 4 255 - - 4 255Restricted cash 20 297 - - 20 297 446 825 18 325 67 027 532 177
Comparative information for year 2012:
Carrying amount as at 31 December 2012
Non-impaired financial assets
not yet due
Non-impaired financial assets
past dueImpaired
financial assets TotalCash and cash equivalents 58 603 - - 58 603Trade receivables 78 508 43 138 5 238 126 884Accounts due from customers for contract work 138 607 - 3 853 142 460Other receivables 6 984 2 368 16 503 25 855Short-term loans issued 81 149 21 405 24 552 127 106Promissory notes 111 - 7 807 7 918Positive fair values of financial derivatives 137 - - 137Available for-sale investments 4 538 31 425 35 963Restricted cash 9 854 - - 9 854 378 491 66 911 89 378 534 780
(c) Liquidity risk
Liquidity risk is the risk that the Group will not be able to meet its financial obligations as they fall due. The Group’s approach the managing liquidity is to ensure, as far as possible, that it will always have sufficient liquidity to meet its liabilities when due, under both normal and stressed conditions, without incurring unacceptable loss or risking damage to the Group’s reputation.
Prudent liquidity risk management includes maintaining sufficient cash and availability of funding from an adequate amount of committed credit facilities. Group maintains flexibility in funding by maintaining availability under committed credit lines. As at 31 December 2013 the Group has unused credit facilities in the amount of US$ 371 184 (31 December 2012: US$ 416 148).
The table below presents the contractual maturities for the Group’s financial liabilities including estimated interest payments and excluding the impact of netting agreements. It is not expected that the cash flows included in the maturity analysis could occur significantly earlier, or at significantly different amounts.
The maturity analysis of financial liabilities other than derivatives as at 31 December 2013 is as follows:
Less than
1 year 1-2 years 2-5 yearsMore than five
years TotalFinancial liabilities 132 794 4 424 3 561 - 140 779Short-term borrowings 269 896 - - - 269 896Long-term borrowings - 209 096 36 194 8 204 253 494Other interest payments 30 611 11 777 7 154 861 50 403 433 301 225 297 46 909 9 065 714 572
Management does not expect that the payments will occur earlier or at different amounts.
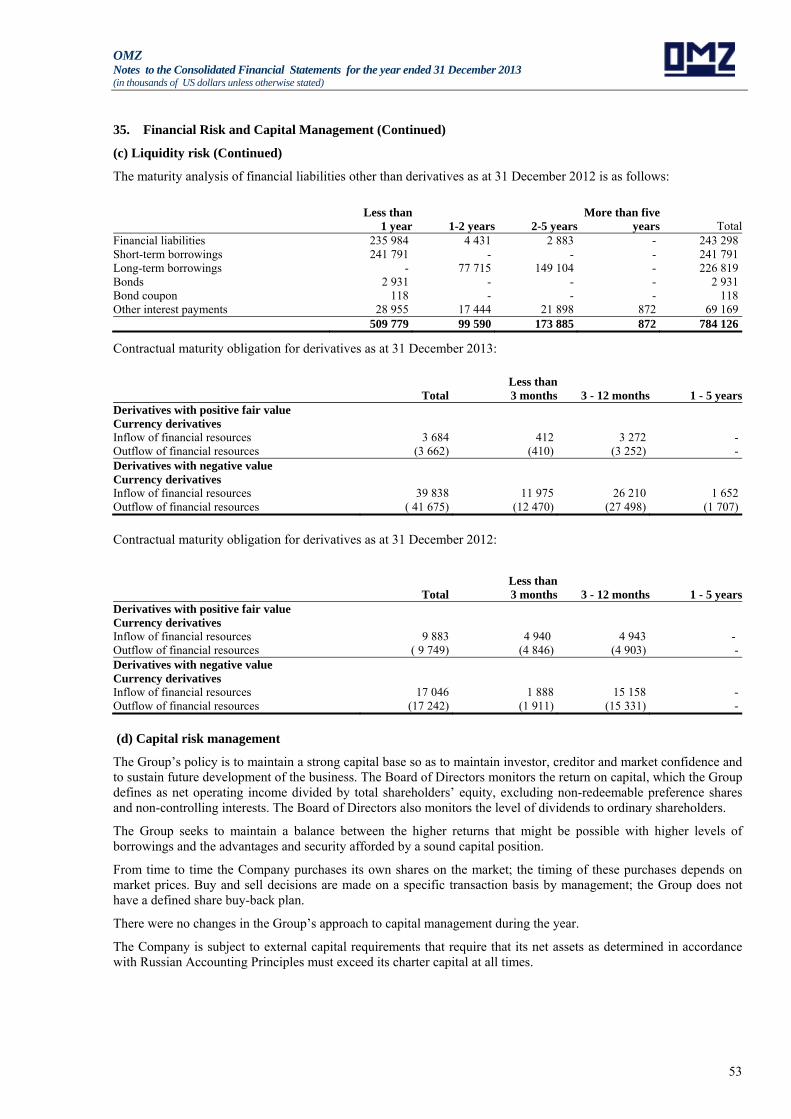
OMZ Notes to the Consolidated Financial Statements for the year ended 31 December 2013 (in thousands of US dollars unless otherwise stated)
53
35. Financial Risk and Capital Management (Continued)
(c) Liquidity risk (Continued)
The maturity analysis of financial liabilities other than derivatives as at 31 December 2012 is as follows:
Less than
1 year 1-2 years 2-5 yearsMore than five
years TotalFinancial liabilities 235 984 4 431 2 883 - 243 298Short-term borrowings 241 791 - - - 241 791Long-term borrowings - 77 715 149 104 - 226 819Bonds 2 931 - - - 2 931Bond coupon 118 - - - 118Other interest payments 28 955 17 444 21 898 872 69 169 509 779 99 590 173 885 872 784 126
Contractual maturity obligation for derivatives as at 31 December 2013:
Total Less than
3 months 3 - 12 months 1 - 5 yearsDerivatives with positive fair value Currency derivatives Inflow of financial resources 3 684 412 3 272 -Outflow of financial resources (3 662) (410) (3 252) -Derivatives with negative value Currency derivatives Inflow of financial resources 39 838 11 975 26 210 1 652Outflow of financial resources ( 41 675) (12 470) (27 498) (1 707)
Contractual maturity obligation for derivatives as at 31 December 2012:
Total Less than
3 months 3 - 12 months 1 - 5 yearsDerivatives with positive fair value Currency derivatives Inflow of financial resources 9 883 4 940 4 943 - Outflow of financial resources ( 9 749) (4 846) (4 903) -Derivatives with negative value Currency derivatives Inflow of financial resources 17 046 1 888 15 158 -Outflow of financial resources (17 242) (1 911) (15 331) -
(d) Capital risk management
The Group’s policy is to maintain a strong capital base so as to maintain investor, creditor and market confidence and to sustain future development of the business. The Board of Directors monitors the return on capital, which the Group defines as net operating income divided by total shareholders’ equity, excluding non-redeemable preference shares and non-controlling interests. The Board of Directors also monitors the level of dividends to ordinary shareholders.
The Group seeks to maintain a balance between the higher returns that might be possible with higher levels of borrowings and the advantages and security afforded by a sound capital position.
From time to time the Company purchases its own shares on the market; the timing of these purchases depends on market prices. Buy and sell decisions are made on a specific transaction basis by management; the Group does not have a defined share buy-back plan.
There were no changes in the Group’s approach to capital management during the year.
The Company is subject to external capital requirements that require that its net assets as determined in accordance with Russian Accounting Principles must exceed its charter capital at all times.
OMZ Notes to the Consolidated Financial Statements for the year ended 31 December 2013 (in thousands of US dollars unless otherwise stated)
54
36. Fair Value of Financial Instruments
Fair value is the amount at which a financial instrument could be exchanged in a current transaction between willing parties, other than in a forced sale or liquidation, and is best evidenced by an active quoted market price.
The estimated fair values of financial instruments have been determined by the Group using available market information, where it exists, and appropriate valuation methodologies. However, judgement is necessarily required to interpret market data to determine the estimated fair value. The Russian Federation continues to display some characteristics of an emerging market and economic conditions continue to limit the volume of activity in the financial markets. Market quotations may be outdated or reflect distress sale transactions and therefore not represent fair values of financial instruments. Management has used all available market information in estimating the fair value of financial instruments.
Financial instruments carried at fair value. Trading and available-for-sale investments and financial derivatives, including those classified as non-current assets held for sale (or disposal groups) are carried on the consolidated statement of financial position at their fair value. Cash and cash equivalents are carried at amortized cost, which approximates current fair value.
Fair values were determined based on quoted market prices except for certain investment securities available-for-sale for which there were no available external independent market price quotations (see Note 15).
Financial assets carried at amortised cost. The fair value of floating rate instruments is normally their carrying amount. The estimated fair value of fixed interest rate instruments is based on estimated future cash flows expected to be received discounted at current interest rates for new instruments with similar credit risk and remaining maturity. Discount rates used depend on credit risk of the counterparty. The carrying amounts of financial assets approximate their fair values.
Liabilities carried at amortised cost. The fair value is based on quoted market prices, if available. The estimated fair value of fixed interest rate instruments with stated maturity, for which a quoted market price is not available, was estimated based on expected cash flows discounted at current interest rates for new instruments with similar credit risk and remaining maturity. The fair value of liabilities repayable on demand or after a notice period (“demandable liabilities”) is estimated as the amount payable on demand, discounted from the first date that the amount could be required to be paid. The carrying amounts of liabilities carried at amortised cost approximate their fair values.
Derivative financial instruments. The fair value of derivatives is based on inputs other than quoted prices that are observable for the asset or liability, either directly (i.e., as prices) or indirectly (i.e., derived from prices).

OMZ Notes to the Consolidated Financial Statements for the year ended 31 December 2013 (in thousands of US dollars unless otherwise stated)
55
37. Reconciliation of Classes of Financial Instruments with Measurement Categories
The following tables provide a reconciliation of classes of financial assets with the measurement categories as at 31 December 2013:
Loans and
receivablesAvailable for sale
financial assets
Financial derivatives -
hedging Total
ASSETS Cash and cash equivalents (Note 9) Cash on hand and balances with the bank 24 024 - - 24 024Cash equivalents 483 - - 483Trade and other receivables (Note 10) Trade receivables 132 145 - - 132 145Accounts due from customers for contract work 260 535 - - 260 535Forward foreign exchange contracts – cash flow hedges - - 29 29Other receivables 9 556 - - 9 556Other current financial assets (Note 12) Short-term loans issued 11 357 - - 11 357Restricted cash 20 297 - - 20 297Other 1 - - 1Other non-current financial assets (Note 15) Available-for-sale investments - 4 255 - 4 255Non-current accounts receivables 3 731 - - 3 731Total financial assets 462 129 4 255 29 466 413Non-financial assets 795 230Total assets 1 261 643
All the Group’s financial liabilities are carried at amortised cost except for currency derivatives used as hedging instruments which are carried at fair value of US$ 1 755 and included in trade and other accounts payable.
Comparative information for 2012:
Loans and
receivablesAvailable for sale
financial assets
Financial derivatives -
hedging Total
ASSETS Cash and cash equivalents (Note 9) Cash on hand and balances with the bank 52 665 - - 52 665Cash equivalents 5 938 - - 5 938Trade and other receivables (Note 10) Trade receivables 121 646 - - 121 646Accounts due from customers for contract work 138 607 - - 138 607Forward foreign exchange contracts – cash flow hedges - - 137 137Other receivables 9 352 - - 9 352Other current financial assets (Note 12) Short-term loans issued 102 554 - - 102 554Restricted cash 9 854 - - 9 854Promissory notes 111 - - 111Other 4 - - 4Other non-current financial assets (Note 15) Available-for-sale investments - 4 538 - 4 538Non-current accounts receivables 3 554 - - 3 554Total financial assets 444 285 4 538 137 448 960Non-financial assets - - - 949 736Total assets 1 398 696
All the Group’s financial liabilities are carried at amortised cost except for currency derivatives used as hedging instruments which are carried at fair value of US$ 188 and included in trade and other accounts payable.