OPEN-FILE REPORT 88-369 · DEPARTMENT OF THE INTERIOR UNITED STATES GEOLOGICAL SURVEY Grain-size...
24
DEPARTMENT OF THE INTERIOR UNITED STATES GEOLOGICAL SURVEY Grain-size and mineralogy of eolian and fluvial sediments in the central Kobuk valley, northwestern Alaska by Jos W.A. Dijkmans^ John P. Galloway 2 and Eduard A. Koster 1 OPEN-FILE REPORT 88-369 This report is preliminary and has not been reviewed for conformity with U.S. Geological Survey editorial standards and stratigraphic nomenclature. Any use of trade names used in this report is for descriptive purposes only and does not imply endorsement by the United States Geological Survey. 1 Rijksuniversiteit Utrecht, Geografisch Instituut, Heidelberglaan 2 Postbus 80.115, 3508 TC Utrecht, THE NETHERLANDS 2 U.S. Geological Survey, 345 Middlefield Road f Menlo Park, Calif.94025
Transcript of OPEN-FILE REPORT 88-369 · DEPARTMENT OF THE INTERIOR UNITED STATES GEOLOGICAL SURVEY Grain-size...
DEPARTMENT OF THE INTERIOR UNITED STATES GEOLOGICAL SURVEY
Grain-size and mineralogy of eolian and fluvial sediments in the central Kobuk valley, northwestern Alaska
by
Jos W.A. Dijkmans^
John P. Galloway2
and
Eduard A. Koster1
OPEN-FILE REPORT 88-369
This report is preliminary and has not been reviewed for conformity with U.S. Geological Survey editorial standards and stratigraphic nomenclature. Any use of trade names used in this report is for descriptive purposes only and does not imply endorsement by the United States Geological Survey.
1 Rijksuniversiteit Utrecht, Geografisch Instituut, Heidelberglaan 2 Postbus 80.115, 3508 TC Utrecht, THE NETHERLANDS
2 U.S. Geological Survey, 345 Middlefield Road f Menlo Park, Calif.94025

CONTENTS
ABSTRACT 1
INTRODUCTION 1
LABORATORY AND STATISTICAL METHODS 3
GRAIN SIZE 3
Great and Little Kobuk Sand Dunes 3Greak Kobuk Sand Dunes and Niveo-eolian Deposits 6Kobuk River Sand Bar Deposits 6
MINERALOGY 6
GRAIN ROUNDNESS 11
DISCUSSION 14
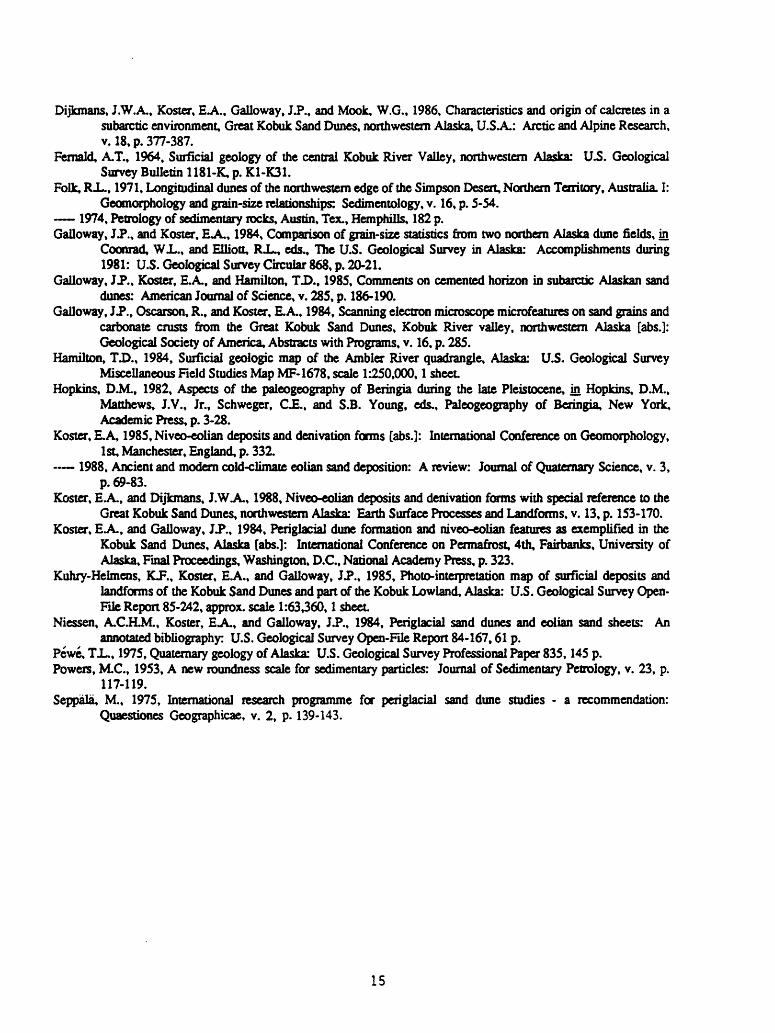
REFERENCES CITED 14
FIGURES
Figure 1.-Location map of the central Kobuk valley showing sample locations. 2
Figure 2.-Cumulative grain size distribution of eolian sands of the Great Kobuk Sand Dunes versus Little Kobuk Sand Dunes. 4
Figure 3. Scatter diagrams of sorting, skewness, and kurtosis versus mean grain size. For comparison the mean and one standard deviation for the Great Kobuk Sand Dunes samples is indicated with a (+). 5
Figure 4. Cumulative grain size distribution of eolian sands from 6 locations with niveo- eolian deposits (Great Kobuk Sand Dunes). 7
Figure 5.-Scatter diagrams of sorting, skewness, and kurtosis versus mean grain size, Great Kobuk Sand Dunes and niveo-eolian deposits. For comparison the mean and one standard deviation for the Great Kobuk Sand Dunes samples is indicated with a (+). 8
Figure 6.~Cumulative grain size distribution of eolians sands of the Great Kobuk Sand Dunes versus Kobuk River sand bars. 9
Figure 7. Histograms of grain size distribution of representative eolian and fluvial sand samples. 10
Figure 8.--Average mineral composition of selected eolian and fluvial sand samples (210- 105 jim, 2.25-3.25 (». 10
Figure 9.~Heavy mineral composition of selected eolian and fluvial sand samples. 12
Figure 10. Average grain roundness of heavy minerals of selected eolian and fluvial sand samples (210-105 Jim, 2.25-3.25 <J>). 13

Figure 11. Selected photomicrographs of typical eolian and fluvial sand grains. 13
TABLES
Table 1. Statistical parameters for eolian and fluvial samples, central Kobuk valley. 16[ samples supplied by T.D. Hamilton. U.S. Geological Survey. Alaska, and are not shown on figure 1]
Table 2.-Average mineral composition in percentages of selected sample groups (210- 105 tun, 2.26-3.25 <j>). 19[ samples not shown on figure 1]
Table 3.- Heavy mineral composition in percentages of three grain size fractions of eolian and fluvial samples from the central Kobuk valley. 20
APPENDIX
Appendix 1. Statistical parameters and verbal classification according to Folk (1974). 21

GRAIN-SIZE AND MINERALOGY OF EOLIAN AND FLUVIAL SEDIMENTS IN THE CENTRAL KOBUK VALLEY, NORTHWESTERN ALASKA
JOS W.A. DIJKMANS, JOHN P. GALLOWAY AND EDUARD A. KOSTER
ABSTRACT
As part of an international research program on cold-climate eolian geomorphology, sand samples collected from active dune fields and river bars in the central Kobuk River valley, northwestern Alaska, were studied. The objectives of this study were to characterize the sediments in terms of grain size distribution, mineral composition, and grain roundness. Grain size data for the eolian sand appears to be consistent with data reported for other inland dune fields. There does not appear to be a trend of decreasing mean grain size and better sorting in the largest dune field as one goes from east to west as is often found in large dune fields with predominatly unidirectional wind regimes. Grain size information related to niveo-eolian deposits is presented and compared to the dune sands. Grain roundness is clearly distinct between the heavy mineral fractions of the eolian and fluvial sands. There are no significant differences in the heavy mineral composition of eolian and fluvial sediments suggesting a commom provenance for the the sands.
INTRODUCTION
In the framework of a research program devoted to the comparison of Pleistocene and modern periglacial eolian sand deposits (Seppala, 1975, Koster, 1988, Niessen and others, 1984), two large dune fields in Alaska were investigated, the Great and Little Kobuk Sand Dunes in the central Kobuk River valley, northwestern Alaska (fig. 1). Results of these studies are presented in Dijkmans and Koster (1987), Dijkmans and others (1986), Galloway and Koster (1984), Galloway and others (1984), Galloway and others (1985), Koster (1985), Koster and Dijkmans (1988), Koster and Galloway (1984), Kuhry-Helmens and others (1985).
The objectives of this study are to characterize the sediment attributes of fifty-three eolian and five fluvial sand samples. The analyses of the following sediment attributes; grain size parameters, mineral composition, and grain roundness are discussed in terms of: (1) possible lateral differences in grain size distribution within and between the dune fields, (2) differences between the mineral composition and(or) roundness of the source material (fluvial sediments) and the dune sands, and (3) the influence of transporting processes on sediment texture and composition.
Partly stabilized dune fields in central and northern Alaska cover an area of more than 30,000 km2 (Pewe, 1975; Hopkins, 1982). The geomorphology and surficial geology of the central Kobuk River valley has been described by Fernald (1964), Hamilton (1984), and Kuhry- Helmens and others (1985). The central part of the valley is filled with sandy sediments derived from glacial erosion of quartzose rocks within the Brooks Range. Sandy till and outwash were transported to the southern flank of the range by glaciofluvial activity and sand was then concentrated and redeposited across the valley floor by glaciolacustrine, alluvial, and eolian processes (Hamilton, 1984). The Kobuk River has formed a meander plain that ranges from about 1 to 7 km in the central part of the valley (Fernald, 1964). The Kobuk Sand Dunes consist of: (1) the Great Kobuk Sand Dunes (GKSD) located 50 km west of the village of Ambler and occupy and area of 62 km2; and (2) the Little Kobuk Sand Dunes (LKSD) situated 18 km east of the GKSD and occupy and area of 8 km2 (fig. 1). These active dune fields comprise only a small part of a 650 km2 area of eolian sand deposits as mapped by Fernald (1964). The GKSD form a NW-SE oriented sand body. The main part of the dune field consists of N-S to NW-SE oriented transverse dune ridges that locally alternate with elongate, relatively flat interdune areas. The LKSD are a parabola-shaped, NW-SE oriented body of eolian sand situated on the downwind side of a large, complex canoe-shaped blowout. A variety of other eolian forms, stabilized

158*
30'
ro
67°1
0'
67° 5
'
Figu
re 1
.-Loc
atio
n m
ap o
f the
cen
tral K
obuk
val
ley
show
ing
sam
ple
loca
tions
.
parabolic,blowout dunes, and longitudinal dunes are found throughout the central Kobuk River valley (Kuhry-Helmens and others, 1985).
Sediments samples used in this study were collected in 1981 and 1985, additional samples were supplied by T.D. Hamilton, U.S. Geological Survey. In the GKSD and LKSD eolian samples were systematically collected from a depth of 20 cm on the crest of dunes, unless otherwise stated. Four grab samples were collected from point bars along the Kobuk River. An additional sample was collected 1 m above river level at the informally named Hunt River dune location.
LABORATORY AND STATISTICAL METHODS
The samples were prepared using standard techniques as described by Folk (1974) to determine grain size distribution. The samples were dry-sieved at half-phi ((]>) intervals. Silt-clay content (material >4 $, < 62.5 pun) is less than 5% in all but one sample. Thus, the fines were not analyzed. Instead a single weight percent is given for the silt-clay fraction. Gravel (material <-l <}>, >2 mm) is absent in all samples. Graphical statistics (mean grain size, sorting, skewness, and kurtosis) were calculated for each sample using formulas of Folk (1974). Mean grain size represents the average grain size; sorting (as a standard deviation) refers to the uniformity of the sediment; skewness measures the asymmetry of the size distribution curve; and kurtosis represents a measure of the "peakedness" of the distribution. Formulas and verbal classification for these parameters are given in appendix 1.
For mineralogical analyses dry bulk samples were sieved and part of the fraction 210-105 |j.m (2.25-3.25 <}>) of each sample was embedded in Canada balsam on a glass slide. Based on the point count of 300 grains per slide four major mineral groups were identified. Additional analyses were carried out on three heavy mineral fractions, a 420-210 Jim fraction, a 210-105 |im fraction, and a 105-50 Jim fraction (1.25-2.25 <j>, 2.25-3.25 <}>, and 3.25-4.25 <]> respectively). Each sample was sieved and treated with H2O2, HC1, and Na2S2O4, to remove organic matter and any cementing agents. The heavy mineral fraction was then separated from the light minerals using bromoform (specific density 2.89) and the grains were embedded in Canada balsam on a glass slide. A point count of 200 grains per slide was performed to determine the percentage of transparent grains present. Weight percentages of heavy minerals were also determined for each sample and size fraction.
Grain roundness was determined by classifying 100 heavy mineral grains per sample in the 210-105 |im (2.25-3.25 <}>) fraction according to Powers (1953) roundness scale for sedimentary particles. SEM (scanning electron microscope) micrographs of selected quartz and carbonate grains were made.
GRAIN SIZE
Great and Little Kobuk Sand Dunes
A preliminary paper comparing cumulative curves of twenty eolian sand samples from the GKSD with twenty samples from a Pleistocene Sand Sea located on the Arctic Coastal Plain (Carter, 1981) shows a similar mean grain size for the eolian sediments (Galloway and Koster, 1984). For this study an additional seven samples were analyzed. Size analysis of twenty-seven eolian sand samples resulted in a mean grain size of 2.56 <]> (170 jim, fine sand, fig. 2). Most of the samples are moderately well sorted (average 0.56), symmetrical (average 0.05), and meso- to leptokurtic (average 1.21; table 1). Figure 3 plots mean grain size versus sorting, skewness, and kurtosis.
Three additional samples were collected from interdune and deflation areas. The grain size parameters for these samples bracket those of the dune samples from the GKSD (table 1).
Five sand samples from the LKSD show they have a mean grain size of 2.64 ty (160 jim, fine sand). They are moderately well sorted (average 0.60), fine-skewed (average 0.12), and

?3C
UM
ULA
TIV
E P
ERC
ENTA
GE
SI
(o O
C
0}co
5: 5? C
JW - 8? a
§5.
CD =
3"a CD
O CO
Q
)
I a 5 CD O 5 CT
to
O
3 ?
3 ?
01
9
10
w
h

'0.7 _
mo_*r_t.ly II .ortcd
0
o
0 £0o
Q o oQ° 0
* 0
Ii1
. '
i!
4°« ' o
0' o o
w«ll orica0.4 _,
ff>
k.wvd
0.3 -
Mn«-
- d °-2 -
01
ymm«tric-l O.O
rO.1 _ca.rt*- k.w.O
-0.2
2.8
2.6 .
2.4 .
««ry
Icptokurtlc
2.0 _
1.8 -
t.e .
______
1.4
ICOlokurtlc1-2 _
mookurtlc '-° -
platykurllc o g
O
°a i ° -
a0 A
0 0 eo o
£BO3 o
_
°o
0
1111
a
a
oo
° o o°*°D ' «o^o
Ol o 0 o1
1
J
o 1
^A~<> °
0 1ft 1
9fo I _
0 1
1111
I 1 1
1 o1111111111 0
11111
00 A °A 1
0 11
A | 0
o 111
t.e 1-« 2.0 2.2 2.4 2.6 2.6 3.0 3.2 phi
330 267 2SO 216 1*O 166 144 126 109 pm
EXPLANATION
O Eolian sand GKSO n = 27
A Eolian sand LKSD n-5
Q Fluvial sandKobuk River bars
n = 5
M moan
_<5 standard deviation
medium sand ltn« .and
MEAN GRAIN SIZE
very fin* _«id
Figure 3.-Scatter diagrams of sorting, skewness, and kurtosis versus mean grain size. For comparison the mean and one standard deviation for the Great Kobuk Sand Dunes samples is indicated with a (+).

meso-to leptokurtic (average 1.14; table 1). Figure 2 compares the cumulative curves of grain size distribution for the GKSD and LKSD, and shows that these are similar.
Great Kobuk Sand Dunes Niveo-eolian Deposits
In the winter temperature and precipitation in the central Kobuk River valley are low enough (-20.1 OG, and 28.7 mm, 3 year average, Dec.-Feb. 1982-1985) to enable transport of snow and sand by wind. This results in the build-up of alternating clean and sandy snow layers on lee slopes of dunes. In early summer these niveo-eolian deposits are mostly covered by a layer of wet sand. The latter either derives from eolian deposition in spring or forms a residual layer after melting of sandy snow. These annual niveo-eolian deposits are described in detail by Koster and Dijkmans (1988), and Koster and Galloway (1984). Although niveo-eolian deposits have often been described (see references in Cailleux, 1978 and Koster and Dijkmans, 1988) grain size information is limited. Cailleux (1978) is of the opinion that niveo-eolian sand sometimes exhibits a smaller degree of sorting than its host material.
A total of eighteen samples were collected at six locations where niveo-eolian deposits were present: six from the sand cover (upper), six from sandy snow layers (niveo-eolian sand), and six from the underlying eolian sand (lower) (fig. 1, locations 28 thru 45). The number of samples is limited. Moreover, the samples are grab samples that may include parts of several layers. Therefore any statistical comparisons should be done with caution. Samples collected above and below the sandy snow lenses have nearly identical mean grain sizes. The average grain size of the niveo-eolian sand is 2.75 <j> (149 Jim, fine sand) which is slightly finer than both the upper and lower samples (fig. 4). Most samples are moderately sorted, symmetrical, and mesokurtic (fig. 5 and table 1). Of the eighteen samples analyzed only the skewness versus mean grain size resembles the average for the twenty-seven GKSD samples, clustering around both means. Comparing sorting versus mean grain size, all but three samples fall outside the mean at one standard deviation as indicated for the GKSD (fig. 5). Fifteen samples are on the positive side, toward the moderately sorted end. When comparing kurtosis versus mean grain size all but one sample fall within the mean at one standard deviation for the GKSD, but on the average they are shifted toward the mesokurtic end.
Kobuk River Sand Bar Deposits
To see if there were any differences between the grain size parameters of the dune sands and its source material, several fluvial samples were analyzed (fig.l, locations 51-55). The grain size parameters of the five fluvial samples are listed in table 1. The average mean grain size of the bar sand deposits is clearly coarser than those of the GKSD and LKSD dune sands (fig. 6) The fluvial sands are better sorted than the dune sands, but show a wide range of skewness and kurtosis values (table 1 and fig. 6). These differences are clearly illustrated in the histograms shown in figure 7.
MINERALOGY
Both eolian and fluvial sand samples were analyzed for mineral composition. The following mineral groups were identified: (1) light minerals (quartz and feldspar), (2) carbonates (3) phyllosilicates (excluding chloritoid), and (4) heavy minerals (including chloritoid). The results are presented in table 2 and figure 8. It appears that dune and fluvial sands are relatively uniform in mineral composition.
The dominant minerals in all samples are quartz and feldspar, and were easily identified by shape and surface texture. Carbonate grains were found in all samples. They are distinguished from other mineral grains by specific shape, roundness, surface texture, and transparency (Dijkmans and others, 1986). The well-rounded and nearly spherical shape of the carbonate grains is distinct from quartz grains and flakes of phyllosilicate minerals. When compared to the irregular surface of conchoidally fractured quartz grains, the carbonate grains

2000 tOOO100
900 260 126 62.6 31 16
GO
80
70
60
50
40
30
20
10
QK8D
L . J upp«r m«an 2.60n«6
nlv«o-«oriann«6
townr m«an 2.66 n«6
-1
t.76 ,/
1 2 3
GRAIN SIZE DIAMETER
6 phi
Figure 4.-Cumulative grain size distribution of eolian sands from 6 locations with niveo-eolian deposits (Great Kobuk Sand Dunes).

1.1 _poorly sorted
1-0 _
0.9 _
moderately sorted
o °-8 -Z
C 0.7 _ Oto
moderately well sorted °' 6 -
____ 0.5 _
well sorted
0.4 _
fi«_ 0.2 _line- skewed
____ 0.1toCOLU Z symmetrical 0.0 _
LU
to -0.1 _coarse*- skewed
-O.2
very 1.6 _leptokurtlc
1.4 _CO
CO leptokurtlc S 1.2 .
OC
mesokurtlc 1.0
platykurtlc 0 a
O
o
A i
A-___ __ _J_ _
_______-i___
i i i i
~B "*"
A
1 o
Ji
i i i i
1
l
a
i i i i
i il 1 1 1
1
l i
l l
-t i
iiil
l
1
i
Q-ff^ |O
a «
I 01 i
ili| 0
1
nA . i o
TS ii i i
.A
1.8 1.8 2.0 2.2 2.4 2.8 2.8 3.0 3.2 Phi
330 287 25O 218 19O 166 144 125 109 tint
EXPLANATION
GKSOEolian sand (upper)
A n--6Niveo-eolian sand
O ns6Eolian sand (lower)
D n=6
M
standard deviation
medium sand fin* sand
MEAN GRAIN SIZE
very fin* sand
Figure 5.-Scatter diagrams of sorting, skewness, and kurtosis versus mean grain size, Great Kobuk Sand Dunes and niveo-eolian deposits. For comparison the mean and one standard deviation for the Great Kobuk Sand Dunes samples is indicated with a (±).

CU
MU
LATI
VE
PE
RC
EN
TAG
E
VO

%60
40-
20
Great Kobuk Sand Dunes LOCATION 8
%60
40-
20-
Kobuk River Bar LOCATION 52
0.5 1 1.5 2 2.5 3 3.5 4 8-p 0.5 1 1.5 2 2.5 3 3.5 4 8 f 707 500 354 250 177 125 88 62.5 33fan 707 600 354 250 177 125 88 62.5 3.9pm
% 60-
40-
20-
Great Kobuk Sand Dunes LOCATION 4
% 60
40-
20-
Kobuk River Bar LOCATION 53
0.5 1.5 2.5 3.5 8 v> 0-5 1 1.5 2 2.5 3 3.5 8707 500 354 250 177 125 88 62.5 3.9/jm 707 500 354 250 177 125 88 62.5 3.9//m
Figure 7.-Histograms of grain size distribution of representative eolian and fluvial sand samples.
Phyllo- Carbo- HeavyQuartz and Faldspar silicates nates minerales Q 20 4P 60 80.% Q 10% p10% Q 10%
Great Kobuk Sand Dunes (n » 5) |
Uttle Kobuk Sand Dunes (n « 4) |
Kobuk River Sand Bars (n « 5) [
I
I
Figure 8.-Average mineral composition of selected eolian and fluvial sand samples (210-105 ^m, 2.25-3.25 <J>).
10

have an exceptionally smooth surface. Finally, most carbonate grains are less transparent than the quartz grains. The occurrence of these detrital carbonate grains proved to play a vital role in the formation of calcretes in the GKSD and are described in detail by Dijkmans and others (1986). Apart from the ubiquitous amount of quartz and some feldspar in the eolian samples the abundance of phyllosilicate minerals is notable. Field observations show that even at relatively low wind speeds, flaky phyllosilicates are transported along the dune surface. Despite this sensitivity to eolian transport and a low weathering resistance, phyllosilicates occur in all samples.
For each sample and each of the chosen grain size fractions weight percentages of heavy minerals were determined. The weight percentage of heavy minerals appear to vary strongly. The average of twenty fluvial and eolian sand samples is 6.5%, but values range from 1.6 to 15.3%. The finer grained fraction (105-50 Jim, 3.25-4.25 <}>) has a higher weight percentage of heavy minerals than does the coarse fraction (420-210 Jim, 1.25-2.25 <}>). However, the reproducibility of these values is low.
All samples contain a notable amount of phyllosilicate minerals. Phyllosilicates form an extensive isomorphic series with a varying degree of atomic substitution, so that they occur in a broad range of specific densities. Thus only part of the phyllosilicates will be found in the heavy fraction. This was checked by separating minerals with a specific density greater than 2.72 from lighter grains by means of a mixture of bromoform and isoamylacetate. An analysis of the 210- 105 p.m (2.25-3.25 <}>) fraction shows that an average of 60% of the grains heavier than 2.72 were phyllosilicates; but only an average of 20% were found in the heavier fraction (greater than 2.89). This explains why weight percentages of heavy minerals in these samples can vary considerably. It is concluded that values for weight percentages of heavy minerals are unreliable and that phyllosilicates should not be considered in the heavy mineral analysis. Chloritoid, on the other hand, is a phyllosilicate with a specific density of about 3.5 and can easily be distinguished from other phyllosilicates. Therefore chloritoid is included in the heavy mineral analysis as a separate mineral group while the other phyllosilicates were excluded. Other phyllosilicates identified are muscovite, biotite, and chlorite.
The results of the heavy mineral analysis are presented in figure 9 and table 3. There is no significant difference in heavy mineral composition between the GKSD, LKSD and fluvial samples. The heavy mineral suite consists of garnet (20-30%), epidote (10-20%), amphibole (10- 20%), and chloritoid (10-20%). Almost all samples included a small percentage of pyroxene and tourmaline. Stable minerals (zircon, rutile, anatase, and sphene) comprise about 10% of the heavy mineral composition in the fine-grained fraction (105-50 Jim, 3.25-4.25 <}>) and only a few percent in the coarser-grained fractions. The heavy minerals were often found to be composite grains (up to 40%) in the fraction 420-210 Jim (1.25-2.25 <}>). Therefore, the percentage of the other mineral groups in this fraction are subdued. The amount of opaque minerals is expressed as a percentage of the transparent heavy minerals. It ranges from about 10% in the coarse-grained fraction to about 30% in the fine-grained fraction.
GRAIN ROUNDNESS
The roundness of heavy mineral sand grains has also been determined for samples collected from the two active dune fields and river bars. The results are presented in figure 10. Although the roundness was not determined for the quartz and feldspar fractions, there is a clear distinction between roundness values of heavy minerals from both dune fields and the Kobuk River sand bars. The eolian sand grains are primarily sub-rounded to well-rounded, whereas the fluvial sand grains are predominantly angular to sub-rounded. Similarly there appears to be a distinct difference in surface characteristics of sand grains from the GKSD and river bars as shown by SEM micrographs of selected quartz grains (fig. 11). Quartz grains from the active dune field exhibit a mixture of glaciofluvial and eolian microfeatures, whereas river bar sediments are dominated by microfeatures typical of sand found in a fluvial environment. A description of these microfeatures is reported by Dijkmans and others (1986), and Galloway and others (1984).
11

loca
tio
n 7
loca
tio
n 9
loca
tio
n 4
7
loca
tio
n 4
8
loca
tio
n 6
1
loca
tio
n 6
6
very
fin
e aa
nd
3.2
6 -
4.2
6 p
hi
106
- 6
0 u
m
Gar
net
Ep
ldo
ta g
roup
Op
aqu
e g
raln
e
Too*
GR
EA
T K
OB
UK
SA
ND
DU
NE
S
LIT
TL
E
KO
BU
K S
AN
D D
UN
ES
KO
BU
K R
IVE
R S
AN
D B
AR
S
100*
fin
e aa
nd
2.2
6 -
3.2
6 p
hi
21
0 -
10
6 ur
n
EX
PL
AN
AT
ION
Am
ph
lbo
le g
roup
Pyr
oxe
ne
grou
p
To
urm
alin
e (d
lsth
ene)
Ch
lorl
told
Iflw
l [
* *
* *
*?*
*;*;
* j
med
ium
aan
d
1.26
- 2
.26 p
hi
420 -
21
0 >
im
L |
Sta
ble
min
eral
s
lill
lJ
Co
mp
osi
te-t
urb
id g
rain
s
Figu
re 9
.-H
eavy
min
eral
com
posi
tion
of s
elec
ted
eolia
n an
d flu
vial
san
d sa
mpl
es.

g» <
Sub- Well-angular Sub-rounded Rounded rounded
0% 9 10% 0 20%0 20 40% 0 20 40 60% 0 20%
Great Kobuk Sand Dunes (n = 2)
Little Kobuk Sand Dunes (n = 2)
Kobuk River Sand Bars (n = 2)
Figure 10.-Average grain roundness of heavy minerals of selected eolian and fluvial sand samples (210-105 jim, 2.25-3.25 $).
EXPLANATION
EOLIAN SAND
A LOCATION 7
LOCATION 1
PLUVIAL SAND
C LOCATION rt
Figure 11.-Selected photomicrographs of typical eolian and fluvial sand grains.
13

DISCUSSION
Based on the analyses of fifty-three eolian sand samples, the majority of these sediments can be classified as fine-grained, moderately well sorted, symmetrical, and meso- to leptokurtic sand. Although there is a slight variation between the statistical parameters of the sediments in the GKSD and other eolian sediments in the central Kobuk River valley the variation does not appear to be significant Grain size data for the eolian sand appear to be consistent with data reported for other inland dune fields (Ahlbrandt, 1979). There does not appear to be a trend of decreasing mean grain size and a better sorting trend from east to west in the GKSD as is often found in large dune fields with predominantly unidirectional wind regimes as observed in other parts of the world (Ahlbrandt, 1974, and Folk, 1971). This is possibly caused by the fact that the predominantly easterly winds responsible for dune migration in the GKSD alternate with westerly summer winds. Although the eolian sands obviously are derived from older fluvial sediments, the comparison of the eolian sands with the present day river bar sands is consistent with the idea that eolian resedimentation of somewhat coarse (fluvial) sediments tends to decrease in mean grain size values (Folk, 1971).
Analysis of niveo-eolian sands show that these sediments are somewhat less sorted than those of the eolian sands from which they derive. This seems to confirm that niveo-eolian sediments can sometimes be somewhat less sorted than the eolian sand from which they are derived as also noted by Cailleux (1978). On the other hand it appears to be impossible to make a clear distinction in grain size attributes of the niveo-eolian sand and the under- and overlying sediments (figs. 4 and 5). Analysis of five fluvial samples show sediment which is coarser grained and better sorted than the eolian dune sand.
The only available data on mineral composition of dune sand from the central Kobuk Valley are two samples collected from the northern end of the GKSD, near Kavet Creek (Fernald, 1964). We disagree with Fernald regarding the percentage of mineral composition reported for quartz and feldspar. Taking the maximum numbers reported, the percentage for the minerals add up to 70% for the coarse sample and 60% for the fine sample. It is difficult to compare this analysis with our results because the size fractions used are not indicated. However, we feel the 60% value for the fines (quartz and feldspar) is too low and should be somewhere around 75%. All other mineral species reported by Femald is consistent with the data we present here.
The eolian and fluvial sediments are relatively uniform in mineral composition. Apart from the normally high quartz and feldspar percentages the relatively abundance of carbonate grains, phyllosilicates, and heavy minerals is exceptional for dune sands and is obviously related to a local provenance rich in these minerals. There are no significant differences in the heavy mineral composition between eolian and fluvial sand which suggests the sediments had a common origin. In spite of a more or less uniform grain size distribution and (heavy) mineral composition of eolian and fluvial samples, these sediments are clearly distinct with respect to grain roundness. Whether this is due to grain form selection or abrasion is unknown.
REFERENCES CITED
Ahlbrandt, T.S., 1974, The source of sand for the Killpecker sand-dune field, southwestern Wyoming: SedimentaryGeology, v. 11, p. 39-57.
1979, Textural parameters of eolian deposits, in McKee, E.D., ed., A study of global sand seas: U.S. GeologicalSurvey Professional Paper 1052, p. 21-52.
Cailleux, A., 1978, Niveo-eolian deposits, in Fair-bridge, R.W., and Bourgeois, J., eds., Encyclopedia of EarthSciences, v. 6, The Encyclodpedia of Sedimentology, p. 501-503.
Carter, L.D., 1981, A Pleistocene sand sea on the Alaskan Arctic Coastal Plain: Science, v. 211, p. 381-383. Dijkmans, J.W.A., and Koster, E.A., 1987, Eolische verschijnselen in (actuele) periglaciale milieu's. Eerste resultaten
van onderzoek in Subarctisch, Noordwest Alaska: Geografisch Tijdschrift 21, p. 152-167.
14
Dijkmans, J.W.A., Koster, E.A., Galloway, J.P., and Mook, W.G., 1986, Characteristics and origin of caJcretes in asubarctic environment. Great Kobuk Sand Dunes, northwestern Alaska, U.S.A.: Arctic and Alpine Research,v. 18, p. 377-387.
Fernald, A.T., 1964, SurficiaJ geology of the central Kobuk River Valley, northwestern Alaska: U.S. GeologicalSurvey Bulletin 1181-K, p. K1-K31.
Folk, RJL. 1971, Longitudinal dunes of the northwestern edge of the Simpson Desert, Northern Territory, Australia. I:Geomorphology and grain-size relationships: Sedimentology, v. 16, p. 5-54.
1974, Petrology of sedimentary rocks, Austin, Tex., Hemphills, 182 p.Galloway, JJP., and Koster, E.A., 1984, Comparison of grain-size statistics from two northern Alaska dune fields, in
Coonrad, WJL., and EUiott, RX., eds.. The U.S. Geological Survey in Alaska: Accomplishments during1981: U.S. Geological Survey Circular 868, p. 20-21.
Galloway, J JP., Koster, E.A., and Hamilton, TJD., 1985, Comments on cemented horizon in subarctic Alaskan sanddunes: American Journal of Science, v. 285, p. 186-190.
Galloway, JJP., Oscarson, R., and Koster, E.A., 1984, Scanning electron microscope microfeatures on sand grains andcarbonate crusts from the Great Kobuk Sand Dunes, Kobuk River valley, northwestern Alaska [abs.]:Geological Society of America, Abstracts with Programs, v. 16, p. 285.
Hamilton, TJD., 1984, SurficiaJ geologic map of the Ambler River quadrangle, Alaska: U.S. Geological SurveyMiscellaneous Field Studies Map MF-1678, scale 1250,000,1 sheet
Hopkins, D.M., 1982, Aspects of the paleogeography of Beringia during the late Pleistocene, in Hopkins, D.M.,Matthews, J.V., Jr., Schweger, CJE., and S.B. Young, eds., Paleogeography of Beringia, New York,Academic Press, p. 3-28.
Koster, E.A, 1985, Niveo-eolian deposits and denivation forms [abs.]: International Conference on Geomorphology,1st, Manchester, England, p. 332.
1988, Ancient and modern cold-climate eolian sand deposition: A review: Journal of Quaternary Science, v. 3,p. 69-83.
Koster, E .A., and Dijkmans, J.W.A., 1988, Niveo-eolian deposits and denivation forms with special reference to theGreat Kobuk Sand Dunes, northwestern Alaska: Earth Surface Processes and Landforms, v. 13, p. 153-170.
Koster, E.A., and Galloway, J.P., 1984, PeriglaciaJ dune formation and nivco-eolian features as exemplified in theKobuk Sand Dunes, Alaska [abs.]: International Conference on Permafrost, 4th, Fairbanks, University ofAlaska, Final Proceedings, Washington, D.C., National Academy Press, p. 323.
Kuhry-Helmens, KJF., Koster, E.A., and Galloway, JP., 1985, Photo-interpretation map of surficiaJ deposits andlandforms of the Kobuk Sand Dunes and part of the Kobuk Lowland, Alaska: U.S. Geological Survey Open- File Report 85-242, approx. scale 1:63360,1 sheet
Niessen, A.CJHLM., Koster, E.A., and Galloway, JP., 1984, Periglacial sand dunes and eolian sand sheets: Anannotated bibliography: U.S. Geological Survey Open-File Report 84-167,61 p.
Pewe, TJL, 1975, Quaternary geology of Alaska: U.S. Geological Survey Professional Paper 835,145 p. Powers, M.C., 1953, A new roundness scale for sedimentary particles: Journal of Sedimentary Petrology, v. 23, p.
117-119. Seppala, M., 1975, International research programme for periglacial sand dune studies - a recommendation:
Quaestiones Geographicae, v. 2, p. 139-143.
15
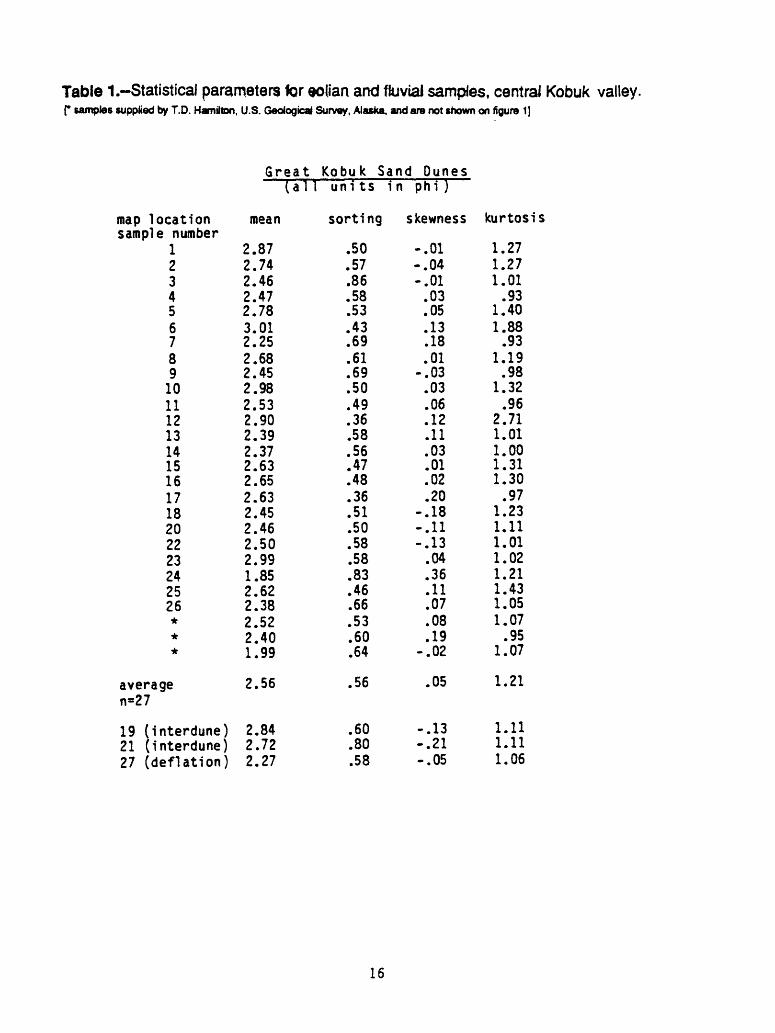
Table 1.-Statistical parameters for eolian and fluvial samples, central Kobuk valley.f* samples supplied by T.D. Hamilton, U.S. Geological Survey, Alaska, and are not shown on figure 1]
Great Kobuk Sand Dunes
map locationsample number
123456789101112131415161718202223242526*if
if
averagen=27
19 (Inter dune)21 (interdune)27 (deflation)
(all
mean
2.872.742.462.472.783.012.252.682.452.982.532.902.392.372.632.652.632.452.462.502.991.852.622.382.522.401.99
2.56
2.842.722.27
unl ts
sorting
.50
.57
.86
.58
.53
.43
.69
.61
.69
.50
.49
.36
.58
.56
.47
.48
.36
.51
.50
.58
.58
.83
.46
.66
.53
.60
.64
.56
.60
.80
.58
in phi )
skewness
-.01-.04-.01.03.05.13.18.01
-.03.03.06.12.11.03.01.02.20
-.18-.11-.13.04.36.11.07.08.19
-.02
.05
-.13-.21-.05
kurtosis
1.271.271.01
.931.401.88
.931.19
.981.32
.962.711.011.001.311.30
.971.231.111.011.021.211.431.051.07
.951.07
1.21
1.111.111.06
16
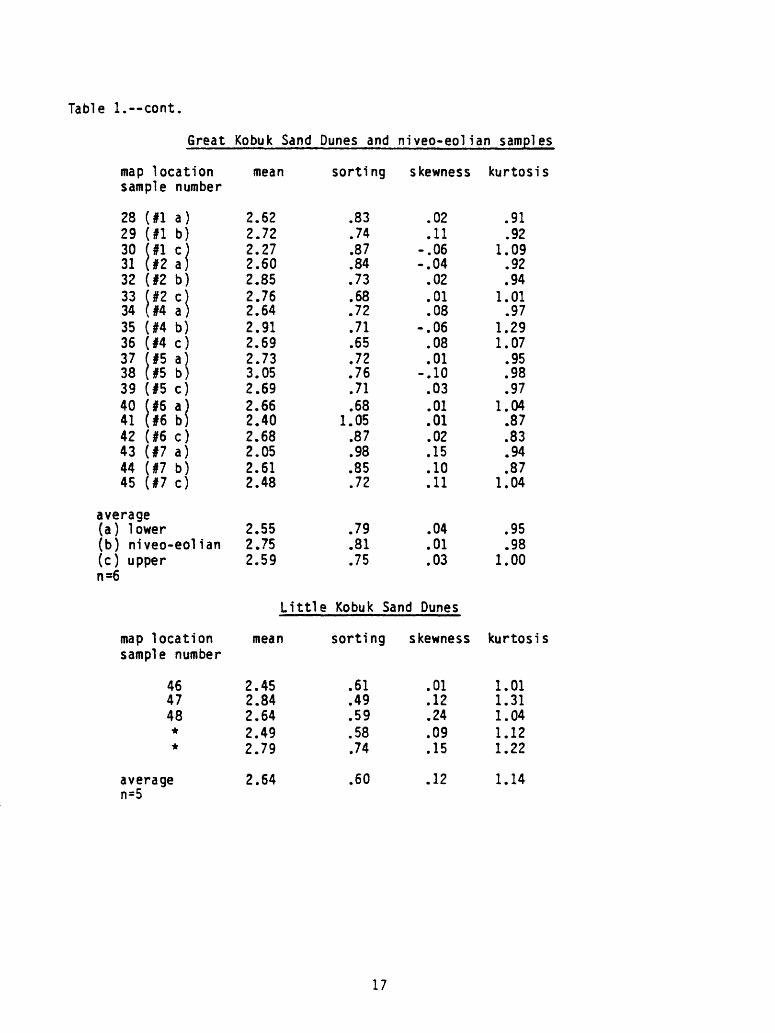
Table l.--cont.
Great Kobuk Sand Dunes and niveo-eolJan samples
map location sample number
mean sorting skewness kurtosis
28 (#1 a)29 (#1 b)30 (11 c)31 (12 a)32 (#2 b)33 #2 c34 (14 a)35 (#4 b)36 (#4 c)37 #5 a)38 (15 b)39 (#5 c)40 #6 a)41 (16 b)42 (#6 c)43 (#7 a)44 #7 b)45 (17 c)
average(a) lower(b) niveo-eol ian(c) upper
map locationsample number
464748**
averagen=5
2.622.722.272.602.852.762.642.912.692.733.052.692.662.402.682.052.612.48
2.552.752.59
Little
mean
2.452.842.642.492.79
2.64
.83
.74
.87
.84
.73
.68
.72
.71
.65
.72
.76
.71
.681.05
.87
.98
.85
.72
.79
.81
.75
.02
.11-.06-.04
.02
.01
.08-.06
.08
.01-.10
.03
.01
.01
.02
.15
.10
.11
.04
.01
.03
.91
.921.09
.92
.941.01
.971.291.07
.95
.98
.971.04
.87
.83
.94
.871.04
.95
.981.00
Kobuk Sand Dunes
sorting
.61
.49
.59
.58.74
.60
skewness
.01
.12
.24
.09
.15
.12
kurtosis
1.011.311.041.121.22
1.14
17

Table 1 cont.
Kobuk River - bar samples
map location mean sorting skewness kurtosis sample number
51 2.34 .44 -.11 1.3152 1.90 .38 .22 1.1153 2.02 .44 -.02 1.0254 1.84 .39 .23 1.6655 1.77 .58 .12 1.53
average 1.97 .45 .09 1.33 n=5
18

Table 2,-Average mineral composition in percentages of selected sample groups (210-105 mm, 2.25-3.25 $).f samptot not shown on figure 1]
Nap Location
792
1027
mean standard deviation
464748*
mean standard deviation
5152535455
mean standard deviation
Light Heavy Phyllosilicates minerals minerals
Great Kobuk Sand Dunes
77.077.277.781.278.0
78.21.5
8.29.9
10.08.77.0
8.81.1
6.67.95.74.93.3
5.71.5
84.886.383.866.2
80.3 8.2
Little Kobuk Sand Dunes
9.3 3.46.3 5.79.7 5.47.1 22.1
8.1 9.21.4 7.5
Kobuk River bars
79.373.769.367.257.3
69.47.3
5.620.024.019.914.0
16.76.4
12.84.74.37.4
23.0
10.47.0
Carbonates
8.2 5.0 6.7 5.2
11.7
7.4 2.5
2.4 1.71.1 4.7
2.5 1.4
2.31.72.3 5.5 5.7
3.5 1.7
19

Tabl
e 3.-
Hea
vy m
iner
al c
ompo
sitio
n in
per
cent
ages
of t
hree
gra
in s
ize
fract
ions
of e
olia
n an
d flu
vial
sam
ples
from
the
cent
ral K
obuk
val
ley.
ftra
at
Koh
uk
Sand
D
unes
t.
Utl
i*
Kob
uk
Sand
fa
nes
K
ohuk
a
u*
r
sand
b
ars
loca
tion
7
locu
tion
9
loca
l lo
o 47
lo
cati
on
4f
t lo
cuti
on
))
lo
cati
on
)l
tjr.
iln
«ls
«
fra
ctio
n:
urn
420-
210-
10)-
420-
21
0-
10)-
420-
210-
10)-
4
20
- 21
0-
10)-
42
0-
210-
10)-
42
0-
210-
10
5-21
0 10
) )0
21
0 10
) )0
21
0 10
) 50
21
0 10
) )0
21
0 10
) 50
21
0 10
) 50
ph
i <*
) 1
.2)-
2.2
)-
1.2
)-
1.2
)-
2.2
)-
1.2
)-
1.2
)-
2.2
)-
1.2
)-
1.2
)-
2.2
)-
1.2
)-
1.2
)-
2.2
)-
1.2
)-
1.2
)-
2.2
)-
1.2
)-
2.1
) 1.2
) 4.2
) 2.2
) 1.2
) 4.2
) 2.1
) 1.2
) 4.2
) 2.2
) 1
.2)
4.2
) 2.2
) 1.2
) 4.2
) 2
.2)
1.2
) 4
.2)
«.r
n«t
apld
ot*
jr
ou
pi
apM
ot*
tola
lts
cll
nocols
lts
ap
hlh
ola
g
rou
pi
horn
bl«n
<U
rvj
O
pyro
««n«
gro
ups
U
t.lt
*
hjr
p«
r*th
en*
tourm
alin
*
dla
thsn
s
chlo
rlto
ld
slrc
on
rut
Us
an
stss
*sp
h*
ns
coaposl
t*-t
urb
ld g
rain
s
1)
10
.)
10
16.)
1
1 10 2 0
.)
2
).)
In
0.)
.)
21
1
41
16
29.)
21 0.)
1) 6 2 11.)
1.)
2.) .) 3.3
2.)
26 12.)
0.)
12 1 2 6 1.)
1
1).
)
17.3
12.)
12
240
.)
0.)
11.3
14.)
1.3
3.)
11
.)
14
2 2
.)1 1
1.)
2.)
17
.)
3.3
2).
6
16.V
29
11
6.6
17.)
It
9.)
1 1
11.6
1
4.)
24
1
2.)
.
1.)
1.)
2.)
0.3
0
.)
1.7
1).
7
16
17.)
6.)
1.3
.5
.a
.)
i.$
4.1
) 1
1
12.2
6
.3
3)
),.) a.)
0.)
12 1 4 11 1 2.)
6.)
2A
21
21
10.2
0.)
1 0.6
2 2.1
.)
.6
17
6.1
2.)
1.)
1.1
) 1.
7
2 18.6
11.)
2)
2)
1)
24.)
10
0.)
0.)
1.)
1.)
1 .)
11
14.)
21
1.)
1.)
.)
2.) .)
.)
) 4
2.)
14.)
2
27.)
10.)
16 0.)
1) 2 1)
.51 1.)
4 14
40 ia.)
0.) .3
11 1.)
14 2 2 1 2.)
Opsqu* (*.
S of tr
ansp
srsn
t 22.)
12
29
12
12
27.S
).)
11.)
IS
.3
9.)
17
27
19
11.)
12.)
12.)
19
11
«ln*
rsl*
)

Graphic Mean
Mz$16 + $50 + $84
Inclusive Graphic Standard Deviation
. »84 - $16 $95 - $5 I 4 * 6.6
Verbal Classification:
O under 0.35$
0.35 to 0.50$
0.50 to 0.71$
0.71 to 1.0$
1.0 to 2.0$
2.0 to 4.0$
over 4.0$
Inclusive Graphic Skevness
$16 * $84 - 2$50Sk,
2 ($84 - $16)
Verbal Classification:
Sk from +1.00 to +0.30
+0.30 to +0.10
+0.10 to -0.10
-0.10 to -0.30
-0.30 to -1.00
very well sorted
well sorted
moderately well sorted
moderately sorted
poorly sorted
very poorly sorted
extremely poorly sorted
$S * $95 - 2$SO 2($95 - $5)
strongly fine-skewed
fine-skewed
symmetrical
coarse-skewed
strongly coarse-skewed
Graphic Kurtosis
$95 - $52.44 ($75 - $25)
Verbal classification:
K under 0.67 G
0.67 to 0.90
0.90 to 1.11
1.11 to 1.50
1.50 to 3.00
over 3.00
very platykurtic
platykurtic
esokurtic
leptokurtic
very leptokurtic
extremely leptokurtic
Appendix 1.- Statistical parameters and verbal classification according to Folk (1974)
21


![Relating MODIS-derived surface albedo to soils and rock ...dust.ess.uci.edu/ppr/ppr_TSG02.pdf · rockor surfacesediment(e.g.,volcanics, intrusives,eolian,fluvial). [8] The three data](https://static.fdocuments.in/doc/165x107/5f5806c42645ce0c3c0180b8/relating-modis-derived-surface-albedo-to-soils-and-rock-dustessuciedupprpprtsg02pdf.jpg)