Open Data i Transport Públic
65
Open Data & Public Transit Esteve Almirall esteve.almirall@esade,edu blog estevealmirall.com
-
Upload
amtu -
Category
Technology
-
view
35 -
download
0
Transcript of Open Data i Transport Públic
Open Data & Public Transit
Esteve Almirall esteve.almirall@esade,edu
blog estevealmirall.com

1 problem 3 strategies 1 why ?

1 problem 3 strategies 1 why ?

Urban Population
0.96
2011 2030
1.06
2.67 3.92
More Developed
Less Developed
• 90% urban growth = developing countries
• 65 million new residents / year
Source: United Nations, Department of Economic and Social Affairs, Population Division (2012). World Urbanization Prospects: The 2011 Revision

Fewer than 500,000
500,000 - 5,000,000
More than 5,000,000
50% will live in small cities
51%
18%
31%
Source: United Nations, Department of Economic and Social Affairs, Population Division (2012). World Urbanization Prospects: The 2011 Revision

Increasing demand for services – quantity – diversity and quality
Technology -- -- Smart Cities
CITIZENS
Decreasing budgets
GOVERNMENTS


- govs. - Service
providers Ecosystem managers
resource assignment (zero sum game)
resources as a lever (non zero sum game)

1 problem 3 strategies 1 why ?

① strategy

Open Data

2008 – The problem
Vivek Kundra, former CTO of Washington DC (now Federal CIO), needed to make DC’s Open Data Catalog useful.


The Old Way 1.0
you know the way it’s done now

The New Way Open Data
+ 2.0 -> Citizen talent
+ Fame and fortune
= ?

Fame & Fortune

Year 1 Results 47 web, iPhone & Facebook apps $2,300,000+ Estimated value
$50,000 in cost
+4000% ROI

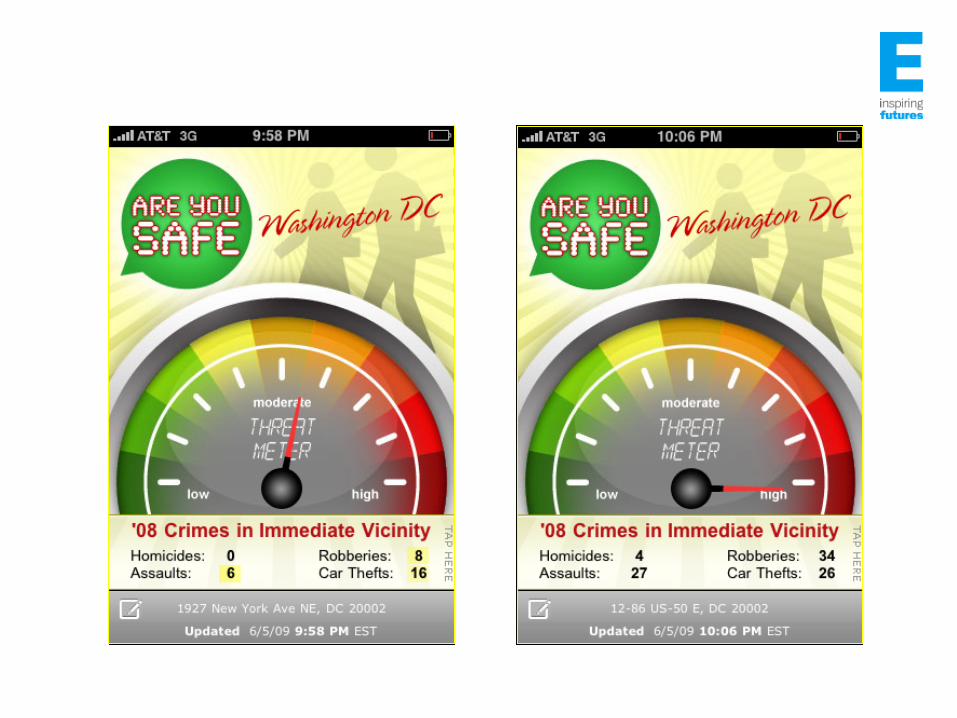
www.AreYouSafeDC.com
Subsequent Innovation
www.AreYouSafeDC.com
Subsequent Innovation


http://www.youtube.com/watch?v=URmKRTU-hxQ&feature=youtu.be
Gov 2.0 Expo 2010: Joshua Robin, "Unlocking Real-Time Data"

Open Data - success story 2 -

unexpected results when sharing data in Public
transportation
Portland - Oregon Sleep soundly. The iNap app will wake snoozing commuters as their stop approaches. Predict arrival. The city doesn't provide live GPS tracking of its trains and buses, but the app ArrivalTracker uses an algorithm and city API data to predict arrival times fairly well. Portland's Tri-County Metropolitan Transportation District was one of the first to release actionable data, way back in 2008.
Fast Company, October 2011

unexpected results when sharing data in Public
transportation
Boston Crowdsource trouble. OpenMBTA searches Twitter to relay what problems riders are reporting. Hear it straight. How Fucked Is the T? bluntly sums up the state of each subway line like a native Bostonian would. Sample: If the Orange Line's average wait time is 5.5 minutes, the line "might be a little fucked.” Massachusetts has more than 200 mobile startups, which have developed dozens of transit apps for navigating the finicky Massachusetts Bay Transportation Authority.
Fast Company, October 2011

unexpected results when sharing data in Public
transportation
New York
Fast Company, October 2011
Come and go efficiently. Exit Strategy NYC lets subway riders fulfill the eternal Gotham need: leave and enter stations at the most convenient staircases. The Metropolitan Transportation Authority has released limited data, so app development is slow. But that may change. The MTA's App Quest contest will give a combined $15,000 in prizes to transit app developers. Winners are announced November 1.

② strategy

Users as sensors

35


37

38

39

40

41

③ strategy

Coordination in the platforms


Is there a better way ?


Where is the coordination ?


3.5€ + 0.45€ /km


1 problem 3 strategies 1 why ?

- govs - Service Providers
Ecosystem Managers
available resources (zero sum game)
resources as a lever (network effects & externalities)

- govs. - Service Providers
Ecosystem Managers
developed in-house always fall short
high-cost no sharing local offer
fragmented
co-developed with users, communities
free and not-free empowering entrepreneurship
driven by innovation stimulating growth

esteve almirall [email protected]