OPEN ACCESS nutrients - Can Manufacturers Institute · NPD’s Nutrient Intake Database used in...
15
Nutrients 2015, 7, 5586-5600; doi:10.3390/nu7075240 OPEN ACCESS nutrients ISSN 2072-6643 www.mdpi.com/journal/nutrients Article Frequent Canned Food Use is Positively Associated with Nutrient-Dense Food Group Consumption and Higher Nutrient Intakes in US Children and Adults Kevin B. Comerford 1, 2 1 Department of Nutrition, University of California at Davis, Davis, CA 95616, USA; E-Mail: [email protected]; Tel.: +1-707-799-0699 2 OMNI Nutrition Science, Sacramento, CA 95819, USA Received: 18 April 2015 / Accepted: 2 July 2015 / Published: 9 July 2015 Abstract: In addition to fresh foods, many canned foods also provide nutrient-dense dietary options, often at a lower price, with longer storage potential. The aim of this study was to compare nutrient-dense food group intake and nutrient intake between different levels of canned food consumption in the US. Consumption data were collected for this cross-sectional study from 9761 American canned food consumers (aged two years and older) from The NPD Group’s National Eating Trends r (NET r ) database during 2011–2013; and the data were assessed using The NPD Group’s Nutrient Intake Database. Canned food consumers were placed into three groups: Frequent Can Users (ě6 canned items/week); n = 2584, Average Can Users (3–5 canned items/week); n = 4445, and Infrequent Can Users (ď2 canned items/week); n = 2732. The results provide evidence that Frequent Can Users consume more nutrient-dense food groups such as fruits, vegetables, dairy products, and protein-rich foods, and also have higher intakes of 17 essential nutrients including the shortfall nutrients—potassium, calcium and fiber—when compared to Infrequent Can Users. Therefore, in addition to fresh foods, diets higher in nutrient-dense canned food consumption can also offer dietary options which improve nutrient intakes and the overall diet quality of Americans. Keywords: canned food; food groups; nutrient-dense; nutrient intake; diet quality 1. Introduction Proper nutrition is one of the most effective and least expensive ways to prevent and treat several chronic- and deficiency-related diseases [1]. A key component to proper nutrition entails finding and
Transcript of OPEN ACCESS nutrients - Can Manufacturers Institute · NPD’s Nutrient Intake Database used in...

Nutrients 2015, 7, 5586-5600; doi:10.3390/nu7075240OPEN ACCESS
nutrientsISSN 2072-6643
www.mdpi.com/journal/nutrients
Article
Frequent Canned Food Use is Positively Associated withNutrient-Dense Food Group Consumption and Higher NutrientIntakes in US Children and AdultsKevin B. Comerford 1,2
1 Department of Nutrition, University of California at Davis, Davis, CA 95616, USA;E-Mail: [email protected]; Tel.: +1-707-799-0699
2 OMNI Nutrition Science, Sacramento, CA 95819, USA
Received: 18 April 2015 / Accepted: 2 July 2015 / Published: 9 July 2015
Abstract: In addition to fresh foods, many canned foods also provide nutrient-dense dietaryoptions, often at a lower price, with longer storage potential. The aim of this studywas to compare nutrient-dense food group intake and nutrient intake between differentlevels of canned food consumption in the US. Consumption data were collected forthis cross-sectional study from 9761 American canned food consumers (aged two yearsand older) from The NPD Group’s National Eating Trendsr (NETr) database during2011–2013; and the data were assessed using The NPD Group’s Nutrient Intake Database.Canned food consumers were placed into three groups: Frequent Can Users (ě6 canneditems/week); n = 2584, Average Can Users (3–5 canned items/week); n = 4445, andInfrequent Can Users (ď2 canned items/week); n = 2732. The results provide evidence thatFrequent Can Users consume more nutrient-dense food groups such as fruits, vegetables,dairy products, and protein-rich foods, and also have higher intakes of 17 essentialnutrients including the shortfall nutrients—potassium, calcium and fiber—when comparedto Infrequent Can Users. Therefore, in addition to fresh foods, diets higher in nutrient-densecanned food consumption can also offer dietary options which improve nutrient intakes andthe overall diet quality of Americans.
Keywords: canned food; food groups; nutrient-dense; nutrient intake; diet quality
1. Introduction
Proper nutrition is one of the most effective and least expensive ways to prevent and treat severalchronic- and deficiency-related diseases [1]. A key component to proper nutrition entails finding and

Nutrients 2015, 7 5587
maintaining a healthy balance between calorie and nutrient intake. However, the ability to achievea balance between calories and nutrients differs for individuals and populations across the globe,depending on a multiplicity of genetic, lifestyle and socioeconomic factors. The federal dietary guidancefor industrially developed and westernized populations such as the general population in the US includesrecommendations to reduce overall calorie intake (especially from added sugars and solid fats) and toincrease intake of nutrient-dense foods such as vegetables, fruits, unsalted nuts and seeds, beans andpeas, low-fat dairy, lean meats, and seafood [2]. All of these recommended foods, with the exception ofdairy products, nuts, and seeds are commonly consumed in both fresh and canned varieties.
Canned foods are a core component of the diets of many Americans. A 2013 survey of more than 1000Americans showed that greater than 60% of the respondents reported using canned foods at least once ortwice each week [3]. Still, many Americans use these products for their cost and/or convenience; and notfor their nutritional properties [3]. In general, fresh foods are recommended as the primary nutrient-densedietary options, but fresh foods are not always available to all Americans due to seasonal, economic andgeographic factors. Recent research has shown that canned options contain comparable nutrient profilesto fresh foods [4–7], therefore nutrient-dense canned foods should be considered as healthy optionsalongside fresh foods, or as nutritious alternatives to fresh foods. Additionally, a study by Kapica et al.,provided evidence that canned foods are some of the most cost-effective and accessible nutrient optionsavailable to Americans [5]. Furthermore, the 2010 Dietary Guidelines for Americans (DGA) promotesnutrient-dense canned foods such as vegetables, fruits, legumes and seafood (especially those which arelow in salt and sugar) along with fresh and frozen options to meet the recommended dietary intakes forfood groups and nutrient levels [2].
Although canned foods are featured in grocery stores, and used in restaurant meals and governmentassistance programs, the frequency of canned food consumption in the US has been on a steady declineover the last 10 years with Annual Eatings per Capita (AEPC) rates decreasing by 7.5% from 2003 to2013. The “eat rate” (i.e., the average number of times a using individual consumes a product duringa two-week period) for canned foods has also declined by 4% over the same time course [8]. Themisconceptions about the nutritional impact and healthfulness of canned foods, and their decreasingusage rate may both be contributing factors to the nutritional inadequacy of the American diet. Theobjective of this study was to compare and contrast the dietary intake and nutritional profiles of cannedfood consumers based on their frequency of canned food use to better understand the role that cannedfoods play in the American diet. This is the first study of its kind to compare food group intake andnutrient intake in US children and adults based on the frequency of canned food consumption.
2. Experimental Section
2.1. Sampling and Data Collection
The National Eating Trends (NETr) database has continuously tracked representative sample ofadults’ and children’s total diet consumption for 30 years and is conducted year round to be able toaccount for changes in weekly and seasonal eating behaviors. For this study, data were collected annuallyfrom 2500 US free-living households in NPD NETr database and NPD’s Nutrient Intake Database overthe course of two years (February 2011 to February 2013). NPD received ethical approval for this study

Nutrients 2015, 7 5588
from the Council of American Survey Research Organizations (CASRO) and adhered to the mandatedCASRO Code of Standards and Ethics for Survey Research. The NETr database is a nationallyrepresentative sample using a stratified quota sample of present demographic composition to meet U.S.Census Bureau demographic targets. Its main purpose is to capture all foods and beverages consumedby each family member in a household, both in home and away from home, during 14 consecutive dayseach year. NPD’s Nutrient Intake Database used in this study provides estimates of daily intake at theindividual level for calories, macronutrients and micronutrients. The database calculates nutrient intakedata by integrating the eating frequency from the NETr database with average serving sizes from theWhat We Eat in America (WWEIA) dietary intake interview component of the National Health andNutrition Examination Survey (NHANES) and nutrient values from the United States Department ofAgriculture’s (USDA) National Nutrient Database for Standard Reference.
Panelists were recruited from a national mail panel to participate in NPD’s NETr survey. Candidatepanelists received a sample diary, instructions, and one actual daily diary to complete and return. Onlypanelists returning acceptable diaries were asked to participate in the 14-day study. Each panelistwas responsible for the food records for their entire household. The individual sample was thereforecomprised of all household members from participating households. All households had to pass qualitycontrol checks on the completeness of their food diary reporting. Households had to return at least 10 of14 diaries to be considered eligible for the quarterly sample. Each diary captured all foods and beveragesconsumed in-home, carried-from-home, and away-from-home, in separate sections. Meal occasionswere identified as main meals or snacks. Information collected included detailed food descriptions,including brand names, preparation methods, and appliances used.
2.2. Analysis
Food diary data were initially analyzed from 2000 households per year (n = 4000 households total),resulting in food diaries from approximately 5000 individuals per year (n = 10,000 total), and over200,000 eating occasions annually (n > 400,000 eating occasions total). The final analysis focusedon individuals two years and older (n = 9761). Depending on their consumption habits, canned foodconsumers were placed into three groups: Frequent Can Users (FCU); n = 2584, Average Can Users(ACU); n = 4445, and Infrequent Can Users (ICU); n = 2732. FCU were defined as those individualswho consumed canned foods six or more times in the two weeks study period, while ICU consumedcanned foods 1–2 times over the two-week study period. ACU consumed canned goods betweenthree to five times during the two-week study period, and were not included in the final analysis.Two groups were singled out and dichotomized for further investigation and comparison of cannedfood consumption—infrequent users relative to frequent users. Additional analysis was performed todetermine the overall and subcomponent diet quality on selected days. Specifically, to compare essentialnutrient intake on days when canned foods were eaten versus days when canned foods were not eaten.
Data extraction and analysis of food and nutrient intake was performed on the NPD’s NETr intakediary panel and Nutrient Intake databases. Foods were placed into categories such as “Canned,”“Ready-to-Eat (RTE),” “Homemade,” “Fresh,” “Frozen,” and “Refrigerated.” Canned foods includedbase dish/additive canned foods (i.e., processed fruit, processed vegetables/legumes, finfish, soup,

Nutrients 2015, 7 5589
processed meat and combination dishes that are canned or in aluminum/metal packaging). Consumptiondata were used to estimate canned food eating occasions over the two-week period.
For each variable, estimates of the mean were given, as were standard deviations where appropriate.A 95% confidence interval (95% CI) was used for the mean. Two-tailed t-tests were used and thesignificance was set at CI > 97.5%, (or p ď 0.025). Tests of significance were completed for participantswho were frequent can users and for participants who were infrequent can users. NPD’s Nutrient Intakedata was processed in SAS software version 9.3 (2011, SAS Institute, Cary, NC, USA).
3. 3. Results
3.1. Study Demographics and Sample Sizes
The final sample consisted of 5316 survey respondents—1165 children and adolescents between theages of 2–17 years and 4151 adults (64% female, 36% male) over the age of 18 years. The ACU group(i.e., those who consumed 3–5 cans in the two-week study period) and children under two years of agewere not included in the final analysis. The data from children over the age of two years, adolescentsand adults were merged and analyzed together in order to focus on the dietary and nutritional differencesbetween frequent and infrequent canned food users in the general American population. The FCU group(n = 2584) consumed canned food six or more times in the two-week study period while the ICU group(n = 2732) consumed canned food two or less times in the two-week study period. There were nosignificant differences in age, gender or body mass index (BMI) between the FCU and ICU groups(Table 1). The percentage of frequent and infrequent canned food users was similar in households earningbetween $10,000 and $70,000 per year, while, households with earnings over $70,000 per year wascomprised of a higher percentage of infrequent can users (31.2%) than frequent users (23.2%) (Table 1).The FCU group was significantly more likely to participate in the Supplemental Nutrition AssistanceProgram (SNAP) government assistance program than the ICU group; and almost twice as likely toparticipate in the Women, Infants and Children (WIC) program, although this difference did not reachstatistical significance (Table 1). When combined, there were approximately 40,000 instances of cannedfood consumption during the two-week period between the two groups, with the FCU group accountingfor approximately 2/3rds of the total consumption of canned foods.
Table 1. Demographics of frequent and infrequent canned food users.
(ICU, n = 2732; FCU, n = 2584)Demographics % Infrequent Can Users (ICU) % Frequent Can Users (FCU) p-Value
Age (years)2–17 20.5 23.4 NS18–65 65.6 59.6 NS65+ 13.9 17.0 NSBMI
Underweight 4.2 3.8 NSOptimal 38.2 36.6 NS
Overweight 28.7 32.1 NSObese 28.8 27.4 NS

Nutrients 2015, 7 5590
Table 1. Cont.
Household IncomeUnder $10,000 6.1 10.0 NS
$10,000–$19,999 7.8 11.8 NS$20,000–$29,999 11.8 17.3 NS$30,000–$39,999 13.9 14.3 NS$40,000–$49,999 10.5 12.2 NS$50,000–$59,999 9.0 5.7 NS$60,000–$69,999 9.6 5.5 NS$70,000 and Over 31.2 23.2 <0.01
Assistance ProgramsSNAP participant 11.9 23.5 <0.01WIC participant 6.3 11.8 NS
Abbreviations: Body Mass Index (BMI), Supplemental Nutrition Assistance Program (SNAP), Woman,Infants and Children (WIC); Percentage of infrequent (n = 2732) and frequent (n = 2584) canned food userssocio-demographic and anthropometric information. Data from the NPD Group’s National Eating Trends intakediary panel 2011–2013 and Nutrient Intake databases. Statistical confidence level set at 95% for two-tailed ttest. p-Value < 0.025% considered significant.
3.2. Food Group Intake and Eat Rate
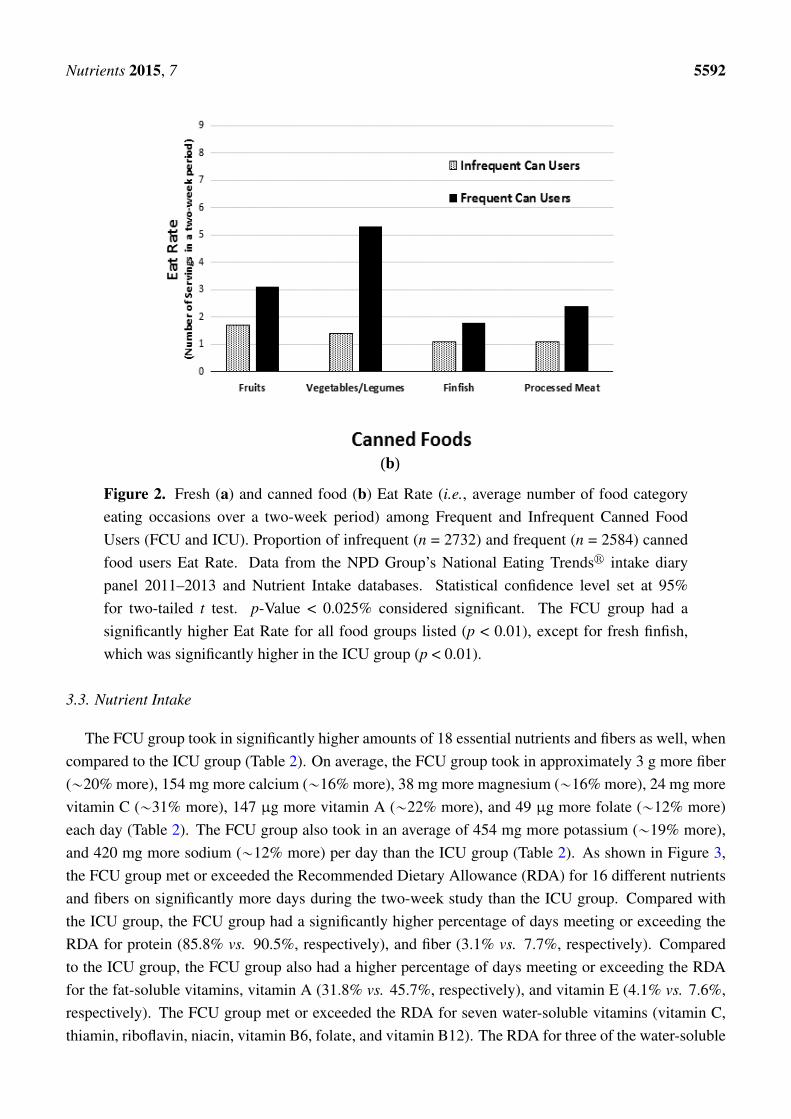
A comparison of food group intake between infrequent and frequent canned food consumers showedthat the FCU group had significantly higher average daily intake of the four primary nutrient-dense foodgroups; fruits, vegetables, dairy and protein foods (p < 0.01) (Figure 1). Compared to the ICU group, theFCU consumed 30.3% more servings of fruit, 21.4% more servings of vegetables, 18.2% more servingsof milk, yogurt and cheese, and 8.5% more servings of protein-rich foods such as meat, fish, poultry,beans, eggs, and nuts (Figure 1). Over the course of two week study period, the average Eat Rate wasalso recorded for fruits, vegetables/legumes, finfish, processed meat and combination dishes (Figure 2).Eat Rate is defined as the average number of times a using individual consumes a product during atwo-week period. When compared to the ICU group, the FCU group had a 116% higher Eat Rate ofcanned vegetables/legumes, and a 58% higher Eat Rate of canned fruits (p < 0.01). Interestingly, whencompared to the ICU group, the FCU group also had a 20% higher Eat Rate of fresh vegetables/legumes,and 6% higher Eat Rate of fresh fruits (p < 0.01). The only category of food in which the ICU group hada significantly higher Eat Rate compared to the FCU group was fresh finfish (13% higher for the ICUgroup), while the ICU group had a 48% lower Eat Rate of canned finfish (p < 0.01).

Nutrients 2015, 7 5591Nutrients 2015, 7 6
Figure 1. Mean number of nutrient-dense food group servings per day among frequent and infrequent canned food users (FCU and ICU). Proportion of infrequent (n = 2732) and frequent (n = 2584) canned food users average daily intake of nutrient-dense food groups. Data from The National Purchase Diary (NPD) Group’s National Eating Trends® intake diary panel 2011–2013 and Nutrient Intake databases. Statistical confidence level set at 95% for two-tailed t test. p-Value < 0.025% considered significant. The FCU group had significantly higher values for all food groups listed (p < 0.01).
(a)
Figure 2. Cont.
Figure 1. Mean number of nutrient-dense food group servings per day among frequentand infrequent canned food users (FCU and ICU). Proportion of infrequent (n = 2732) andfrequent (n = 2584) canned food users average daily intake of nutrient-dense food groups.Data from The NPD Group’s National Eating Trendsr intake diary panel 2011–2013 andNutrient Intake databases. Statistical confidence level set at 95% for two-tailed t test. p-Value< 0.025% considered significant. The FCU group had significantly higher values for all foodgroups listed (p < 0.01).
Nutrients 2015, 7 6
Figure 1. Mean number of nutrient-dense food group servings per day among frequent and infrequent canned food users (FCU and ICU). Proportion of infrequent (n = 2732) and frequent (n = 2584) canned food users average daily intake of nutrient-dense food groups. Data from The National Purchase Diary (NPD) Group’s National Eating Trends® intake diary panel 2011–2013 and Nutrient Intake databases. Statistical confidence level set at 95% for two-tailed t test. p-Value < 0.025% considered significant. The FCU group had significantly higher values for all food groups listed (p < 0.01).
(a)
Figure 2. Cont.
Figure 2. Cont.
Nutrients 2015, 7 5592Nutrients 2015, 7 7
(b)
Figure 2. Fresh (a) and canned food (b) Eat Rate (i.e., average number of food category eating occasions over a two-week period) among Frequent and Infrequent Canned Food Users (FCU and ICU). Proportion of infrequent (n = 2732) and frequent (n = 2584) canned food users Eat Rate. Data from the National Purchase Diary (NPD) Group’s National Eating Trends® intake diary panel 2011–2013 and Nutrient Intake databases. Statistical confidence level set at 95% for two-tailed t test. p-Value < 0.025% considered significant. The FCU group had a significantly higher Eat Rate for all food groups listed (p < 0.01), except for fresh finfish, which was significantly higher in the ICU group (p < 0.01).
3.3. Nutrient Intake
The FCU group took in significantly higher amounts of 18 essential nutrients and fibers as well, when compared to the ICU group (Table 2). On average, the FCU group took in approximately 3 g more fiber (~20% more), 154 mg more calcium (~16% more), 38 mg more magnesium (~16% more), 24 mg more vitamin C (~31% more), 147 µg more vitamin A (~22% more), and 49 µg more folate (~12% more) each day (Table 2). The FCU group also took in an average of 454 mg more potassium (~19% more), and 420 mg more sodium (~12% more) per day than the ICU group (Table 2). As shown in Figure 3, the FCU group met or exceeded the Recommended Dietary Allowance (RDA) for 16 different nutrients and fibers on significantly more days during the two-week study than the ICU group. Compared with the ICU group, the FCU group had a significantly higher percentage of days meeting or exceeding the RDA for protein (85.8% vs. 90.5%, respectively), and fiber (3.1% vs. 7.7%, respectively). Compared to the ICU group, the FCU group also had a higher percentage of days meeting or exceeding the RDA for the fat-soluble vitamins, vitamin A (31.8% vs. 45.7%, respectively), and vitamin E (4.1% vs. 7.6%, respectively). The FCU group met or exceeded the RDA for seven water-soluble vitamins (vitamin C, thiamin, riboflavin, niacin, vitamin B6, folate, and vitamin B12). The RDA for three of the water-soluble vitamins (vitamin C, vitamin B6, and folate) was met or exceeded by an average of over 10% more often
Figure 2. Fresh (a) and canned food (b) Eat Rate (i.e., average number of food categoryeating occasions over a two-week period) among Frequent and Infrequent Canned FoodUsers (FCU and ICU). Proportion of infrequent (n = 2732) and frequent (n = 2584) cannedfood users Eat Rate. Data from the NPD Group’s National Eating Trendsr intake diarypanel 2011–2013 and Nutrient Intake databases. Statistical confidence level set at 95%for two-tailed t test. p-Value < 0.025% considered significant. The FCU group had asignificantly higher Eat Rate for all food groups listed (p < 0.01), except for fresh finfish,which was significantly higher in the ICU group (p < 0.01).
3.3. Nutrient Intake
The FCU group took in significantly higher amounts of 18 essential nutrients and fibers as well, whencompared to the ICU group (Table 2). On average, the FCU group took in approximately 3 g more fiber(„20% more), 154 mg more calcium („16% more), 38 mg more magnesium („16% more), 24 mg morevitamin C („31% more), 147 µg more vitamin A („22% more), and 49 µg more folate („12% more)each day (Table 2). The FCU group also took in an average of 454 mg more potassium („19% more),and 420 mg more sodium („12% more) per day than the ICU group (Table 2). As shown in Figure 3,the FCU group met or exceeded the Recommended Dietary Allowance (RDA) for 16 different nutrientsand fibers on significantly more days during the two-week study than the ICU group. Compared withthe ICU group, the FCU group had a significantly higher percentage of days meeting or exceeding theRDA for protein (85.8% vs. 90.5%, respectively), and fiber (3.1% vs. 7.7%, respectively). Comparedto the ICU group, the FCU group also had a higher percentage of days meeting or exceeding the RDAfor the fat-soluble vitamins, vitamin A (31.8% vs. 45.7%, respectively), and vitamin E (4.1% vs. 7.6%,respectively). The FCU group met or exceeded the RDA for seven water-soluble vitamins (vitamin C,thiamin, riboflavin, niacin, vitamin B6, folate, and vitamin B12). The RDA for three of the water-soluble

Nutrients 2015, 7 5593
vitamins (vitamin C, vitamin B6, and folate) was met or exceeded by an average of over 10% more oftenduring the two-week study period by the FCU group, when compared to the ICU group. Furthermore,the FCU group met or exceeded the RDA for six minerals (calcium, magnesium, phosphorus, iron, zinc,and selenium), with the RDA for calcium, magnesium and zinc being met or exceeded by an average ofover 9% more often during the two-week study period, compared to the ICU group.
Table 2. Average daily nutrient intake between frequent and infrequent can users.
Frequent Can Users: (ICU, n = 2732; FCU, n = 2584)
Nutrient ICU FCU p-ValueFiber (g) 13.1 ˘ 6.2 16.0 ˘ 7.4 <0.01
Protein (g) 69.7 ˘ 26.7 76.3 ˘ 29.9 <0.01Vitamin A (RAE) (µg) 585 ˘ 417 732 ˘ 417 <0.01
Vitamin E (mg) 6.1 ˘ 3.5 7.1 ˘ 4.0 <0.01Vitamin C (mg) 65.9 ˘ 64.6 89.7 ˘ 68.9 <0.01Thiamin (mg) 1.6 ˘ 0.7 1.8 ˘ 0.8 <0.01
Riboflavin (mg) 1.9 ˘ 0.8 2.2 ˘ 0.9 <0.01Niacin (mg) 20.9 ˘ 8.9 23.2 ˘ 9.7 <0.01
Vitamin B6 (mg) 1.6 ˘ 0.8 1.9 ˘ 0.9 <0.01Folate/Folic Acid (µg) 370 ˘ 188 419 ˘ 200 <0.01
Vitamin B12 (µg) 4.8 ˘ 4.2 5.7 ˘ 5.2 <0.01Calcium (mg) 873 ˘ 417 1027 ˘ 493 <0.01
Magnesium (mg) 219 ˘ 87 257 ˘ 101 <0.01Phosphorus (mg) 1178 ˘ 437 1331 ˘ 522 <0.01
Iron (mg) 14.3 ˘ 7.1 16.4 ˘ 7.8 <0.01Zinc (mg) 10.4 ˘ 5.4 11.6 ˘ 5.8 <0.01
Selenium (µg) 101 ˘ 44 108 ˘ 47 <0.01Sodium (mg) 3168 ˘ 1283 3588 ˘ 1482 <0.01
Potassium (mg) 2132 ˘ 827 2586 ˘ 988 <0.01
Average nutrient intake (mean and standard deviation) of infrequent (n = 2732) and frequent (n = 2584) cannedfood users. Data from the NPD Group’s National Eating Trendsr intake diary panel 2011–2013 and NutrientIntake databases. Statistical confidence level set at 95% for two–tailed t test. p-Value <0.025% consideredsignificant. RAE, Retinol Activity Equivalents.
3.4. Canned Food Days vs. Non-Canned Food Days
Further analysis was performed to determine the differences in nutrient intake between the ICU andFCU groups on days when canned foods were or were not consumed. The results showed that on dayswhen canned foods were consumed, a significantly higher percentage of people in FCU group metor exceeded the RDA for 15 different nutrients, compared to the ICU group (Table 3). Additionally,when compared to the ICU group, a significantly higher percentage of the FCU group also met orexceeded the RDA for the same 15 nutrients on days when canned foods were not consumed. Someof the largest differences in nutrient intake between the FCU and ICU groups were for vitamin A (17%higher on canned food days; 10% higher on non-canned food days); vitamin C (17% higher on canned

Nutrients 2015, 7 5594
food days; 15% higher on non-canned food days); folate (15.4% higher on canned food days; 9.9%higher on non-canned food days); vitamin B6 (13.8% higher on canned food days; 8.8% higher onnon-canned food days); and calcium (12.8% higher on canned food days; 8.5% higher on non-cannedfood days). Although the percentage of people meeting or exceeding the RDA for dietary fiber intakedid not significantly differ between the ICU and FCU groups on either canned or non-canned days, therewere nearly three times as many people in the FCU group who met or exceeded the requirement on daysin which canned foods were consumed, compared to the ICU group (9.4% vs. 3.9%, respectively).
Nutrients 2015, 7 9 Although the percentage of people meeting or exceeding the RDA for dietary fiber intake did not significantly differ between the ICU and FCU groups on either canned or non-canned days, there were nearly three times as many people in the FCU group who met or exceeded the requirement on days in which canned foods were consumed, compared to the ICU group (9.4% vs. 3.9%, respectively).
Figure 3. Percentage of days in which participants met or exceeded the Recommended Dietary Allowance (RDA) for different nutrients among Frequent and Infrequent Canned Food Users (FCU and ICU). Percentage of infrequent (n = 2732) and frequent (n = 2584) canned food users survey days in which the RDA was met or exceeded for a nutrient. Data from the National Purchase Diary (NPD) Group’s National Eating Trends® intake diary panel 2011–2013 and Nutrient Intake databases. Statistical confidence level set at 95% for two-tailed t test. p-Value < 0.025% considered significant. The FCU group had significantly higher values for all nutrients listed (p ≤ 0.02).
Table 3. Percentage of Canned vs. Non-Canned consumption days in which participants met or exceeded the Recommended Dietary Allowance (RDA) for a nutrient among Frequent and Infrequent Canned Food Users.
(ICU, n = 2732; FCU, n = 2584)
Variable % Canned Days that the
RDA Was Met or Exceeded % Non-Canned Days that the RDA Was Met or Exceeded
IFU FCU p-Value IFU FCU p-Value Fiber 3.9 9.4 =0.04 3.0 5.5 =0.15
Protein 86.1 91.6 <0.01 85.8 89.1 <0.01 Vitamin A 31.7 48.7 <0.01 31.9 41.9 <0.01 Vitamin E 3.5 7.5 =0.13 4.2 7.7 =0.04 Vitamin C 41.0 58.0 <0.01 41.0 56.0 <0.01 Thiamin 76.3 87.2 <0.01 79.3 86.5 <0.01
Figure 3. Percentage of days in which participants met or exceeded the RecommendedDietary Allowance (RDA) for different nutrients among Frequent and Infrequent CannedFood Users (FCU and ICU). Percentage of infrequent (n = 2732) and frequent (n = 2584)canned food users survey days in which the RDA was met or exceeded for a nutrient. Datafrom the NPD Group’s National Eating Trendsr intake diary panel 2011–2013 and NutrientIntake databases. Statistical confidence level set at 95% for two-tailed t test. p-Value< 0.025% considered significant. The FCU group had significantly higher values for allnutrients listed (p ď 0.02).
Table 3. Percentage of Canned vs. Non-Canned consumption days in which participants metor exceeded the Recommended Dietary Allowance (RDA) for a nutrient among Frequent andInfrequent Canned Food Users.
(ICU, n = 2732; FCU, n = 2584)
Variable% Canned Days that the
RDA Was Met or Exceeded% Non-Canned Days that theRDA Was Met or Exceeded
IFU FCU p-Value IFU FCU p-Value
Fiber 3.9 9.4 =0.04 3.0 5.5 =0.15Protein 86.1 91.6 <0.01 85.8 89.1 <0.01
Vitamin A 31.7 48.7 <0.01 31.9 41.9 <0.01

Nutrients 2015, 7 5595
Table 3. Cont.
Vitamin E 3.5 7.5 =0.13 4.2 7.7 =0.04Vitamin C 41.0 58.0 <0.01 41.0 56.0 <0.01Thiamin 76.3 87.2 <0.01 79.3 86.5 <0.01
Riboflavin 87.5 94.1 <0.01 88.2 93.4 <0.01Niacin 80.5 89.5 <0.01 82.0 87.1 <0.01
Vitamin B6 64.2 78.0 <0.01 63.7 72.5 <0.01Folate 42.1 57.5 <0.01 46.3 56.2 <0.01
Vitamin B12 82.5 90.2 <0.01 82.7 89.1 <0.01Calcium 30.3 43.1 <0.01 31.7 40.2 <0.01
Magnesium 17.6 29.3 <0.01 18.2 25.4 <0.01Phosphorus 85.7 92.0 <0.01 85.5 90.1 <0.01
Iron 71.0 78.4 <0.01 68.5 74.7 <0.01Zinc 64.2 72.4 <0.01 60.3 66.6 <0.01
Selenium 91.7 94.5 <0.01 92.2 94.7 <0.01
Percentage of infrequent (n = 2732) and frequent (n = 2584) canned food users (ICU and FCU, respectively)survey days in which the Recommended Dietary Allowance (RDA) was met or exceeded for a nutrient.Data divided by days in which canned foods were consumed and days in which no canned foods wereconsumed. Data sourced from the NPD Group’s National Eating Trendsr intake diary panel 2011–2013 andNutrient Intake databases. Statistical confidence level set at 95% for two-tailed t test. p-Value < 0.025%considered significant.
4. Discussion
The data show that in an average two-week period, 8 out of 10 Americans surveyed consumed atleast one canned food. Of those 80% of Americans who consumed canned foods, the average individualpartook in approximately five canned food eating occasions in those two weeks, or, roughly one cannedfood every three days. This analysis, however, did not focus on average can users (35.1% of the initialpopulation surveyed) but instead focused on canned food users in the upper and lower tertiles of UScanned food consumption in order to determine how the most frequent and least frequent of canned foodconsumers compared nutritionally to each other.
The results of this study indicate that more frequent canned food consumption is associated withhealthier eating patterns, such as greater intake of several DGA recommended food groups and higherdaily nutrient intakes. This analysis provides evidence that frequent canned food consumers took in morenutrient-dense foods such as fruits, vegetables and legumes, when compared to infrequent canned foodconsumers (Figure 1). The FCU group also ingested significantly higher amounts of fiber and protein,and 17 different essential micronutrients over the two-week study period (Table 2). These results arepromising for health and nutrition professionals and nutrition education programs which have oftenbeen hesitant to recognize canned foods as nutritionally robust options for meeting dietary requirements.However, the overall results regarding nutrient intakes for both the ICU and FCU study groups—and forAmericans in general—are still far from the ideal amounts recommended by the DGA.
Many Americans have the means to follow the recommendations in the 2010 DGA if they choose todo so, but the current US overweight and obesity statistics along with past National Health and Nutrition
Nutrients 2015, 7 5596
Examination Survey (NHANES) data show that the majority of Americans are either not aware of theDGA recommendations, or simply do not understand or conform to them [9,10]. Additionally, the federalrecommendations to consume more nutrient-dense foods and less calorie-dense/nutrient-poor foods posea challenge to a substantial number of Americans who do not have the means to do so (i.e., for reasonshaving to do with cost and/or accessibility). For example, over 14% Americans receive assistance fromthe SNAP program [11], but, even with this assistance, they still tend to have lower diet quality scoresthan non-SNAP participants with similar incomes [12]. Furthermore, 7% of Americans, or roughly23.5 million people live in urban or rural areas known as “food deserts,” which have limited accessto fresh, healthy and affordable food [13]. Therefore, several DGA recommended items such as freshproduce or fresh seafood are not always available options for many Americans. However, canned foodsare a way to get many of these recommended foods and their unique array of nutrients at affordableprices, even in underserved areas such as food deserts.
Relative to the ICU group, the FCU group were twice as likely to be participants in the governmentassistance programs—SNAP (11.9% vs. 23.5%, respectively) and WIC (6.3% vs. 11.8%, respectively)—highlighting the important role canned foods play for individuals facing economic hardships and whohave less access to fresh and frozen food varieties. The percentage of participants in the WIC programdid not reach significant difference between ICU and FCU groups in this study (Table 1), but this lack ofa difference is only due to the fact that children under 6 years old (i.e., all infants and a large percentageof children) were not included in the final analysis. In fact, canned fruits, vegetables, fish and beans areall WIC-eligible foods [14], and WIC recommends low-salt and low-sugar canned and jarred foods aspart of a healthy infant and toddler feeding program [15].
A 2012 study by Kapica et al., provided evidence that canned foods, including vegetables, fruits, fishand beans actually provided nutrients at a lower or comparable cost compared to fresh, frozen or driedoptions [5], showing that cost-effective, accessible, and nutrient-dense food options can be available insome of the lowest income and highest food insecure areas in the US. While fresh produce and seafoodare often perceived as some of the healthiest dietary options [3], the 2010 DGA repetitively suggeststhat fresh, frozen and canned vegetables and fruits all count towards the DGA recommendations [2].Additionally, canned or tinned seafood such as albacore tuna, anchovies, sardines, and salmon are all richsources of the omega-3 fatty acids eicosapentaenoic acid (EPA) and docosahexaenoic acid (DHA), whichare recommended by DGA, especially for pregnant and breastfeeding mothers [2]. Canned seafood isalso a source of three of the four DGA “nutrients of concern”: with canned sardines being a good sourceof calcium; canned salmon, sardines and tuna being good sources of vitamin D; and canned clamscontaining 542 mg of potassium per serving [2].
While potassium is designated as a “nutrient of concern” by the DGA because it is a shortfall nutrientin the US diet, sodium is considered a “nutrient of concern” of because it is generally over consumedin the US diet. The DGA aims to reduce dietary sodium intake in the US diet since excess amountscan negatively affect several chronic diseases such as hypertension, diabetes and kidney disease [2].Canned foods are often associated with sodium intake, but according to the Centers for Disease Controland Prevention (CDC), canned foods such as fruits and vegetables are not one of the top ten sourcesof sodium in the US diet [16]. Additionally, nutrient-dense canned foods such as fruits, vegetablesand legumes come in many low-sodium and sodium-free options. Moreover, studies have shown that

Nutrients 2015, 7 5597
simply rinsing off sodium-containing canned foods such as vegetables and beans can reduce sodiumcontent by up to 41% [17]. The results from this study show that the FCU group consumed more sodiumthan the ICU group (Table 2), however the FCU group also consumed more potassium as well; and thedifference in potassium intake between groups was greater than for sodium intake („19% vs. „12%,respectively). The sodium/potassium ratio was also 7% lower in the group which consumed cannedfoods more frequently (1.49 for ICU vs. 1.39 for FCU). The sodium/potassium ratio has been shown tobe a more representative indicator of cardiovascular disease and hypertension risk than sodium intakelevels alone [18,19], with increased potassium levels being shown to be able to diminish the negativeeffects of sodium on hypertension [20]. Although high sodium intakes are epidemic in the US, they arenot really an issue specific to canned foods, rather they are a ubiquitous part of the US food supply andAmerican eating patterns as a whole.
While this research has focused on canned food consumption and essential nutrient intake, cannedfoods are also comparable to fresh foods as a source of antioxidants and bioactive components. In2012, Durst and Weaver provided evidence that the canning and storage process can increase the contentof certain nutrients and antioxidant function in peaches after 3 months [21]. This phenomenon likelyoccurs during processing in which the inactivation of degradation enzymes inhibits the breakdown ofascorbic acid and other antioxidants. The researchers showed that vitamin C, folate and antioxidantlevels as measured by ferric reducing antioxidant power (FRAP) assay were all higher when comparedto fresh peaches. Importantly, the measurements showed that folate, vitamin C, and antioxidants levelswere stable over the three months storage period in the canned peaches, and most alterations in nutrientcontent occurred during processing and not over the storage period. So, while the thermal treatment usedin the canning process can result in the breakdown or transformation of some water-soluble vitamins,the remaining nutrients are much more stable over time compared to those in fresh or frozen productssince there is less exposure to oxidation and microbial threats [6,7]. Recent research has even shown thatthe thermal processing techniques used in the canning process may actually preserve or enhance somenutritional qualities in nutrient-dense foods such as canned beans, vegetables and fruits when comparedto fresh foods [4,22–24].
Generally, fresh and canned foods contain similar quantities of most fat-soluble vitamins, mineralsand fiber. Although, there is evidence that some nutrient and bioactive losses occur during thecanning process, there is also evidence to the contrary, therefore it is important to recognize that theconsumption of nutrient-dense canned foods are a viable and cost effective way to contribute to theoverall nutritional quality of the diet [6,7]. The canning process may even increase the bioavailablelevels of certain carotenoids with the best known example being the increase in lycopene in processedtomato products [4]. Additionally, processed tomatoes have higher β-carotene levels compared to freshtomatoes, as do a variety of other fruits and vegetables which can range up to 50% higher than their freshcounterparts [25]. Furthermore, the canning process has also been shown to improve the protein (>7%)and fiber (>5%) content of multiple bean varieties, while also reducing the quantity of lectins [22]. Whilethe canning process can improve the nutrient and bioactive levels of certain foods, it is also been shownto reduce the levels of certain nutrients in some foods as well [21,22]. Therefore, the canning processlikely affects all foods differently, and the changes in overall nutrient and bioactive profile cannot befully extrapolated from the currently available body of science. Further research is needed on different

Nutrients 2015, 7 5598
canning processes, storage times, and the resultant nutrient and bioactive profiles of canned foods inorder to better understand how these foods affect the overall nutritional intake of their consumers.
There are several strengths to this analysis. For one, it is based on a large, nationally representativesample including both children and adults. Additionally, the data are drawn from two-week averagesinstead of single-day recall data. This study is limited in scope since it was an observational study;therefore the causality of the observed effects cannot be conclusively determined. As with all dietarysurvey data, the accuracy of the estimates are dependent on the accuracy of survey respondents. Finally,while canned food use is fairly easy for individuals to determine at home cooked meals, they are notas easy to identify when eating out or away from home. Therefore, misidentification and potentialunderestimation of canned food use away from home may have skewed the data towards lower cannedfood use in populations who frequently consume meals away from home.
5. Conclusions
In summary, this analysis indicates that children and adults in the US who frequently consume cannedfoods, have higher nutrient intakes and healthier eating habits compared to those who infrequentlyconsume canned foods. In this study, frequent canned food consumption was associated with higherintakes of 17 essential nutrients including calcium, potassium and fiber—three shortfall nutrientsaccording to the 2010 Dietary Guidelines for Americans. Frequent canned food consumption wasalso associated with a greater likelihood of consuming nutrient-dense food groups recommended bythe Dietary Guidelines for Americans such as: fruits, vegetables, dairy products and protein foods.Therefore, in addition to fresh foods, nutrient-dense canned foods should be promoted by health andnutrition professionals for their ability to improve nutrient intakes and the diet quality of Americans.
Acknowledgments
This research was funded by the Can Manufacturers Institute and utilized data from The NPD Group’sNational Eating Trendsr (NETr) Database and Nutrient Intake Database. I would like to thank JenniferPhillips and her team at The NPD Group for their assistance on data collection and technical research.
Conflicts of Interest
The author received consulting fees from the Can Manufacturers Institute. The funding sponsors hadno role in the design of the study, in the collection, analyses, or interpretation of the data; or in thewriting of the manuscript. All conclusions are those of the author. There are no other potential conflictsto be reported.
References
1. Ohlhorst, S.D.; Russell, R.; Bier, D.; Klurfeld, D.M.; Li, Z.; Mein, J.R.; Milner, J.; Ross, A.C.;Stover, P.; Konopka, E. Nutrition research to affect food and a healthy lifespan. Adv. Nutr. 2013, 4,579–584. [CrossRef] [PubMed]

Nutrients 2015, 7 5599
2. U.S. Department of Agriculture and U.S. Department of Health and Human Services. DietaryGuidelines for Americans 2010, 7th ed.; U.S. Government Printing Office: Washington, DC, USA,2010.
3. Canned Food Alliance. Telephone Survey (Landline and Mobile Numbers) of 1007 AmericanAdults by Caravan(r) Survey, April 4–7 2013. Margin of Error +/´ 3.1%; Canned Food Alliance:Pittsburgh, PA, USA, 2013.
4. Miller, S.R.; Knudson, W.A. Nutrition and cost comparisons of select canned, frozen, and freshfruits and vegetables. Am. J. Lifestyle Med. 2014. [CrossRef]
5. Kapica, C.; Weiss, W. Canned fruits, vegetables, beans and fish provide nutrients at a lower costcompared to fresh, frozen or dried. J. Nutr. Food Sci. 2012, 26. [CrossRef]
6. Rickman, J.C.; Bruhn, C.M.; Barrett, D.M. Nutritional comparison of fresh, frozen, and cannedfruits and vegetables—II. Vitamin A and carotenoids, vitamin E, minerals and fiber. J. Sci. FoodAgric. 2007, 87, 1185–1196. [CrossRef]
7. Rickman, J.C.; Barrett, D.M.; Bruhn, C.M. Nutritional comparison of fresh, frozen and cannedfruits and vegetables. Part 1. Vitamins C and B and phenolic compounds. J. Sci. Food Agric. 2007,87, 930–944. [CrossRef]
8. The NPD Group. National Eating Trendsr (NETr) Database, in-Home Individual Database.Available online: http://tools.nccor.org/css/system/69/ (accessed on 26 October 2014).
9. Krebs-Smith, S.M.; Guenther, P.M.; Subar, A.F.; Kirkpatrick, S.I.; Dodd, K.W. Americans do notmeet federal dietary recommendations. J. Nutr. 2010, 140, 1832–1838. [CrossRef] [PubMed]
10. NCI Applied Research. Cancer Control and Population Sciences. Usual Dietary Intakes:Food Intakes, US Population, 2001–04. Available online: http://appliedresearch.cancer.gov/diet/usualintakes/pop/2001-04/index.html (accessed on 26 October 2014).
11. U.S. Department of Agriculture (USDA) Food and Nutrition Service, Office of Research andAnalysis. Building a Healthy America: A Profile of the Supplemental Nutrition AssistanceProgram; U.S. Department of Agriculture: Washington, DC, USA, 2014.
12. Nguyen, B.T.; Shuval, K.; Njike, V.Y.; Katz, D.L. The supplemental nutrition assistance programand dietary quality among us adults: Findings from a nationally representative survey. Mayo Clin.Proc. 2014, 89, 1211–1219. [CrossRef] [PubMed]
13. USDA. Agricultural marketing service: Food deserts. Available online: http://apps.ams.usda.gov/fooddeserts/fooddeserts.aspx (accessed on 26 October 2014).
14. USDA Women, infants and children (WIC). WIC food packages—Regulatory requirements forWIC-eligible foods. Available online: http://www.fns.usda.gov/wic/wic-food-packages-regulatory-requirements-wic-eligible-foods (accessed on 6 October 2014).
15. Wolfe, D.; Pipes, D.; Lucas, B. I’m ready! Feeding family foods to your baby. Availale online:http://www.nal.usda.gov/wicworks/Sharing_Center/WA/intro_foods.pdf (accessed on 6 October 2014).
16. Center of Disease Control and Prevention (CDC). Top 10 Sources of Sodium. Available online:http://www.cdc.gov/salt/sources.htm (accessed on 6 October 2014).
17. Duyff, R.L.; Mout, J.R.; Jones, J.B. Sodium reduction in canned beans after draining, rinsing. J.Culin. Sci. Technol. 2011, 9, 106–112. [CrossRef]

Nutrients 2015, 7 5600
18. Zhang, Z.; Cogswell, M.E.; Gillespie, C.; Fang, J.; Loustalot, F.; Dai, S.; Carriquiry, A.L.;Kuklina, E.V.; Hong, Y.; Merritt, R.; et al. Association between usual sodium and potassium intakeand blood pressure and hypertension among U.S. adults: NHANES 2005–2010. PLoS ONE 2013,8, e75289. [CrossRef] [PubMed]
19. Cook, N.R.; Obarzanek, E.; Cutler, J.A.; Buring, J.E.; Rexrode, K.M.; Kumanyika, S.K.;Appel, L.J.; Whelton, P.K. Trials of Hypertension Prevention Collaborative Research Group.Joint effects of sodium and potassium intake on subsequent cardiovascular disease: The Trialsof Hypertension Prevention follow-up study. Arch. Intern. Med. 2009, 169, 32–40. [CrossRef][PubMed]
20. Rodrigues, S.L.; Baldo, M.P.; Machado, R.C.; Forechi, L.; Molina Mdel, C.; Mill, J.G. Highpotassium intake blunts the effect of elevated sodium intake on blood pressure levels. J. Am. Soc.Hypertens. JASH 2014, 8, 232–238. [CrossRef] [PubMed]
21. Durst, R.W.; Weaver, G.W. Nutritional content of fresh and canned peaches. J. Sci. Food Agric.2013, 93, 593–603. [CrossRef] [PubMed]
22. Pedrosa, M.M.; Cuadrado, C.; Burbano, C.; Muzquiz, M.; Cabellos, B.; Olmedilla-Alonso, B.;Asensio-Vegas, C. Effects of industrial canning on the proximate composition, bioactivecompounds contents and nutritional profile of two Spanish common dry beans (phaseolus vulgarisL.). Food Chem. 2015, 166, 68–75. [CrossRef] [PubMed]
23. Dewanto, V.; Wu, X.; Adom, K.K.; Liu, R.H. Thermal processing enhances the nutritional valueof tomatoes by increasing total antioxidant activity. J. Agric. Food Chem. 2002, 50, 3010–3014.[CrossRef] [PubMed]
24. Hunter, K.J.; Fletcher, J.M. The antioxidant activity and composition of fresh, frozen, jarred andcanned vegetables. Innov. Food Sci. Emerg. Technol. 2002, 3, 399–406. [CrossRef]
25. Lessin, W.J.; Catigani, G.L.; Schwartz, S.J. Quantification of cis-trans isomers of provitaminA carotenoids in fresh and processed fruits and vegetables. J. Agric. Food Chem. 1997, 45,3728–3732. [CrossRef]
© 2015 by the author; licensee MDPI, Basel, Switzerland. This article is an open access articledistributed under the terms and conditions of the Creative Commons Attribution license(http://creativecommons.org/licenses/by/4.0/).