open access, multilingual journal epaa aape - ERIC · Palabras-clave: La educación artística;...
24
Journal website: http://epaa.asu.edu/ojs/ Manuscript received: 8/31/2012 Facebook: /EPAAA Revisions received: 8/22/2013 Twitter: @epaa_aape Accepted: 8/23/2013 education policy analysis archives A peer-reviewed, independent, open access, multilingual journal Arizona State University Volume 21 Number 83 November 4 th , 2013 ISSN 1068-2341 Access to High School Arts Education: Why Student Participation Matters as Much as Course Availability M. Kathleen Thomas Mississippi State University Priyanka Singh Education Research Center at The University of Texas at Dallas Kristin Klopfenstein Education Innovation Institute at University of Northern Colorado & Thomas Henry U.S. Food and Drug Administration U.S.A. Citation: Thomas, M. K., Singh, P., Klopfenstein, K., & Henry, T. (2013). Access to High School Arts Education: Why Student Participation Matters as Much as Course Availability. Education Policy Analysis Archives, 21 (83) Retrieved [date], from http://epaa.asu.edu/ojs/article/view/1224 Abstract: There is renewed interest in the role of arts education in the curriculum of U.S. public schools not only because of the intrinsic value of the arts and its believed impact on achievement, but because cultivating creativity is thought to promote innovation and fuel economic growth. Still, we know little about basic access to arts education. Using individual- level administrative data from The University of Texas at Dallas Education Research Center (UTD-ERC), we develop several distinct indices of access to identify high schools rich in the arts. We find that high schools offering an extensive number of courses in the arts do not epaa aape
-
Upload
truongthien -
Category
Documents
-
view
216 -
download
0
Transcript of open access, multilingual journal epaa aape - ERIC · Palabras-clave: La educación artística;...
Journal website: http://epaa.asu.edu/ojs/ Manuscript received: 8/31/2012 Facebook: /EPAAA Revisions received: 8/22/2013 Twitter: @epaa_aape Accepted: 8/23/2013
education policy analysis archives A peer-reviewed, independent, open access, multilingual journal
Arizona State University
Volume 21 Number 83 November 4th, 2013 ISSN 1068-2341
Access to High School Arts Education: Why Student Participation Matters as Much as Course Availability
M. Kathleen Thomas
Mississippi State University
Priyanka Singh Education Research Center at The University of Texas at Dallas
Kristin Klopfenstein Education Innovation Institute at University of Northern Colorado
& Thomas Henry
U.S. Food and Drug Administration U.S.A.
Citation: Thomas, M. K., Singh, P., Klopfenstein, K., & Henry, T. (2013). Access to High School Arts Education: Why Student Participation Matters as Much as Course Availability. Education Policy Analysis Archives, 21 (83) Retrieved [date], from http://epaa.asu.edu/ojs/article/view/1224 Abstract: There is renewed interest in the role of arts education in the curriculum of U.S. public schools not only because of the intrinsic value of the arts and its believed impact on achievement, but because cultivating creativity is thought to promote innovation and fuel economic growth. Still, we know little about basic access to arts education. Using individual-level administrative data from The University of Texas at Dallas Education Research Center (UTD-ERC), we develop several distinct indices of access to identify high schools rich in the arts. We find that high schools offering an extensive number of courses in the arts do not
epaa aape

Education Policy Analysis Archives Vol. 21 No. 83 2 necessarily enjoy high rates of student participation. Policymakers who examine access based only on course counts in the arts will identify predominately large, non-rural high schools as having arts-rich environments. Evaluating arts programs along a single dimension, as is common in federal reports and other studies, fails to provide an accurate representation of access to arts education. Any examination of access to arts education should jointly consider course availability and student engagement in the arts. Policymakers can follow our approach and develop similar indices to assess the current state of arts education in their states. Keywords: Art education; music education; theatre arts; dance education; disproportionate representation; secondary school curriculum; course selection (students); Texas; 2010; factor analysis El acceso a la Educación Artística en la Escuela Secundaria: ¿Por qué la participación estudiantil es tan importante como la disponibilidad del curso Resumen: Existe un renovado interés en el papel de la educación artística en el currículo de las escuelas públicas de Estados Unidos, no sólo por el valor intrínseco de las artes y su impacto en el rendimiento, sino porque el cultivo de la creatividad se cree promueve la innovación y el crecimiento económico. Sin embargo, sabemos muy poco sobre el acceso básico a la educación artística. Utilizando los datos administrativos a nivel individual del Centro de Investigación en Educación de la Universidad de Texas en Dallas (UTD-ERC), desarrollamos varios índices de acceso para identificar las escuelas secundarias con mayor acceso a las artes. Encontramos que las escuelas secundarias que ofrecen un gran número de cursos de artes no disfrutan necesariamente de altas tasas de participación de los estudiantes. Las autoridades que examinan acceso basado únicamente en número de cursos de arte identificarán las escuelas secundarias predominantemente grandes, en zonas no rurales, como poseedoras de ambientes ricos en arte. La evaluación de los programas de arte en una sola dimensión, como es común en los informes federales y otros estudios, no proporcionan una representación precisa del acceso a la educación artística. Cualquier examen de acceso a la educación artística debe considerar conjuntamente disponibilidad del curso y la participación del estudiante en las artes. Los políticos pueden seguir nuestro enfoque y desarrollar índices similares para evaluar el estado actual de la educación artística en sus estados. Palabras-clave: La educación artística; educación musical; artes escénicas; enseñanza de la danza; la representación desproporcionada; plan de estudios secundarios; selección de cursos (estudiantes); de Texas; de 2010; análisis factorial Acesso à educação de artes no ensino médio: Porque a participação dos alunos é tão importante quanto à disponibilidade do Curso Resumo: Há um interesse renovado no papel da educação de artes no currículo das escolas públicas dos Estados Unidos, não só por causa do valor intrínseco das artes e seu acreditável impacto no sucesso, mas porque cultivar a criatividade é considerado promover a inovação e servir como combustível no crescimento econômico. Ainda assim, nós sabemos pouco sobre o acesso básico à educação de artes. Usando dados administrativos a nível individual na Universidade de Texas no Centro de Pesquisa Educação Dallas (UTD-ERC), nós desenvolvemos vários índices distintos de acesso para identificar escolas de ensino médio ricas em artes. Nós achamos que escolas de ensino médio que oferecem uma extensa série de cursos em artes não necessariamente desfrutam de altos índices de participação dos alunos. Os legisladores, que examinam o acesso com base apenas na contagem de cursos de artes identificará predominantemente grandes escolas de ensino médio, não-rurais como tendo
Access to High School Arts Education 3 ambientes ricos em artes. Avaliação de programas de artes ao longo de uma única dimensão, como é comum em relatórios federais e outros estudos, não fornecem uma representação precisa do acesso à educação de artes. Qualquer exame de acesso à educação de artes deve considerar em conjunto a disponibilidade do curso e o envolvimento dos alunos nas artes. Os formuladores de políticas podem seguir nossa abordagem e desenvolver índices semelhantes para avaliar o estado atual da educação de artes em seus estados. Palavras-chave: Educação de Artes; Educação musical; artes teatrais; educação de dança; Representação desproporcionada; plano de estudos secundários, Seleção de Cursos (Estudantes); de Texas; de 2010; análise de fator
The Arts-Rich School1
Reed College…offered perhaps the best calligraphy instruction in the country. Throughout the campus every poster, every label on every drawer, was beautifully hand calligraphed. Because I had dropped out and didn’t have to take the normal classes, I decided to take a calligraphy class to learn how to do this. I learned about serif and san serif typefaces, about varying the amount of space between different letter combinations, about what makes great typography great. It was beautiful, historical, artistically subtle in a way that science can’t capture, and I found it fascinating. None of this had even a hope of any practical application in my life. But ten years later, when we were designing the first Macintosh computer, it all came back to me. And we designed it all into the Mac. It was the first computer with beautiful typography. --Steve Jobs, Commencement speech at Stanford University, June 2005 (Stanford Report, June 14, 2005).
In a report released in May 2011, the President’s Committee on the Arts and the Humanities called for a reinvestment in arts education in our nation’s public schools (2011). The recommendations made in the report arise out of two fundamental beliefs held by committee members: 1) the arts are essential subjects in the school curriculum on their own—regardless of their value to learning outcomes in traditionally tested subjects, and 2) current research regarding the value of arts education across a variety of domains is consistently positive.2 This renewed interest in our nation’s commitment to arts education is part of a larger and growing discussion about the importance of fostering creativity, and the argument for doing so is largely economic. Growth requires innovation, and innovators must be creative. Federal agencies, including the National Science Foundation, are supporting efforts to investigate ways the arts can strengthen learning in
1 Disclaimers: a. This research is supported in part by a grant from the Spencer Foundation. The views expressed are those of the authors and do not necessarily reflect the views of the Spencer Foundation. b. The conclusions of this research do not necessarily reflect the opinions or official position of the Texas Education Agency, the Texas Higher Education Coordinating Board, or the State of Texas. c. The findings, interpretations, and conclusions expressed in this paper are those of the authors in their private capacities, and they do not represent the views of the Food and Drug Administration. 2 Studies link arts education to lower drop-out rates (e.g. Barry, Taylor, & Walls, 1990; Catterall, 2009; Mahoney & Cairns, 1997), higher achievement (Catterall, 2009; Heath, 1998) and a host of other life outcomes.

Education Policy Analysis Archives Vol. 21 No. 83 4 STEM “and produce a more creative American workforce” (Robelen, December 7, 2011).3 States such as California, Massachusetts, and Oklahoma are considering developing an index that would identify schools fostering creativity and innovative thinking. A school’s commitment to arts education is one element in these creativity indices being discussed (Robelen, February 1, 2012).
Despite the apparent importance of arts-rich environments, there is no consistent, well-accepted definition of what it means to be an arts-rich school. In fact, according to the President’s Committee on the Arts and the Humanities, we do not even posses “an accurate current picture of arts offerings because there is no required data collection about what schools offer” (2011, p. 31). The committee does characterize arts-rich schools as schools where at-risk students become reengaged in their learning and academically gifted students demonstrate accelerated learning and sustained motivation (President’s Committee on the Arts and the Humanities 2011, p. viii). Such generalizations give little guidance to policymakers attempting to establish a baseline and assess the current state of arts education in their school systems. Using administrative data on the high school offerings and course completion of Texas public high schools students, we explore what it means to be an arts-rich school and develop several indices that measure different dimensions of access to education in the arts. We conclude that analysts must examine course offerings jointly with student participation rates to accurately identify exceptional education programs in the arts, especially because these characteristics tend to move in opposite directions. While Catterall (2009) provides a significant contribution by creating an index describing school commitment to the arts through course availability and teacher resources, ours is the first study to examine arts access at the school level using both measures of course availability and student participation.
As a starting place for developing a reasonable definition of what it means to be an arts-rich school, Arts Education Partnership has compiled a list of elements commonly used to evaluate the strength of arts education programs in public schools (Ruppert & Nelson, 2006). This list, replicated in Table 1, includes data states are likely to have as part of their state longitudinal data systems, including the number and range of course offerings in the arts and the percentage of students participating. UTD-ERC data contain these two elements. Other elements in Table 1 that would be necessary for a comprehensive evaluation of arts access are unlikely to exist without supplemental data collection and site visits—e.g. the frequency of arts-based field trips and the presence of designated arts classrooms.4 Ruppert & Nelson (2006) do not provide commonly accepted criteria with which to use these elements to identify arts-rich schools, we imagine, because no such criteria exist and appropriate criteria depend upon local context. For example, what should the number and range of art courses be to define a school as arts-rich, given school size and access to resources? What percentage of the student body should be participating in any year? How many arts-based field trips should a school sponsor in a given year? Even if the elements listed in Table 1 are available, and most are not, researchers are left to decide appropriate standards given the prevailing body of research and their best judgment.
Documenting the availability of courses in the arts across high schools and the rates at which students participate is a first step in addressing issues of access and the apparent inequities in the distribution of arts education in public secondary schools. We are expanding on the literature that assesses the state of arts education (e.g. Ruppert & Nelson, 2006) by exploiting longitudinal data from Texas and providing a roadmap that policymakers can use to develop similar arts access indices with their own administrative data. We demonstrate that course offerings and student participation
3 See stemtosteam.org for more information about recent efforts by the Rhode Island School of Design to add art and design to the study of science, technology, engineering, and math to transform STEM learning to STEAM. 4 See Third Space (Stevenson & Deasy 2005) for field work evaluating the arts programs for ten low-income primary and secondary schools.

Access to High School Arts Education 5 rates in isolation are poor measures of arts access because they merely proxy for school size and location. We develop a robust, multi-dimensional school-level arts access index using factor analysis that serves as the ideal while recognizing that not all states will have the resources to generate a similar index. Therefore, we also provide a simple two-dimensional alternative that avoids the pitfalls of the single indicator-indices commonly used to measure access to high school arts programs (e.g. Parsad & Spiegleman, 2012). This simple combination index is based only on arts course offerings and student participation rates and can easily be created in a spreadsheet application given the necessary data. We encourage others to follow our lead in their own states to expand our understanding about basic access to arts education. Table 1 12 Commonly Used Indicators to Assess the Status and Condition of Arts Education 1. Time/frequency provided for arts instruction within school schedules 2. Number and range of arts course offerings 3. Percent of students participating in arts courses 4. Number of credits in the arts required for high school graduation 5. Percent of certified or licensed teachers to teach arts education 6. Availability of professional development workshops and teacher planning time 7. Frequency of arts-based field trips, residencies, and extra-curricular activities 8. Presence of designated arts classrooms and use of technology in arts learning 9. Evidence of alignment of arts instruction with state standards 10. Presence of documented arts curricula 11. Type of assessment tools for measuring student arts performance 12. Amount of school and outside funding for arts programs
Source: Excerpted from, From Anecdote to Evidence: Assessing the Status and Condition of Arts Education at the State Level published by the Arts Education Partnership (Ruppert & Nelson, 2006)
Data Description
The Texas Education Agency (TEA) defines fine arts courses to be courses in visual art, music, theatre, or dance.5 In 2010 there were 93 courses in the arts approved for the public high school education system in Texas including Advanced Placement and International Baccalaureate courses. Arts instruction in Texas public high schools is delivered primarily in traditional, standards-based sequential courses taught by certified arts teachers.6 The arts curriculum includes such subjects as sculpture, jazz band, music theory, theatre production, and graphic design. The President’s Committee on the Arts and Humanities recommends an expanded role for arts integration as a delivery mode for arts instruction in public schools (2011), and Texas is supporting that mode of instruction by offering professional development opportunities for teachers on how to best integrate math, science and the arts (General Appropriations Act, 2009). Unfortunately, our data include no information about the implementation of formal or informal arts integration strategies in Texas public high schools.7
5 The more common definition is the fine and performing arts, where visual art is also known as the fine arts and music, theatre, and dance are the performing arts. Unless otherwise noted, “the arts” refers to all four disciplines. 6 See The Center for Educator Development in Fine Arts (CEDFA) for curricular frameworks in visual art, music, theatre, and dance: http://www.cedfa.org/teach-fine-arts/curriculum/curriculum-frameworks/. 7 For a current review of the literature on arts integrations see Burnaford, Brown, Doherty, & McLaughlin (2007). For seminal works in the field see Broudy (1994) and Eisner (1986).
Education Policy Analysis Archives Vol. 21 No. 83 6
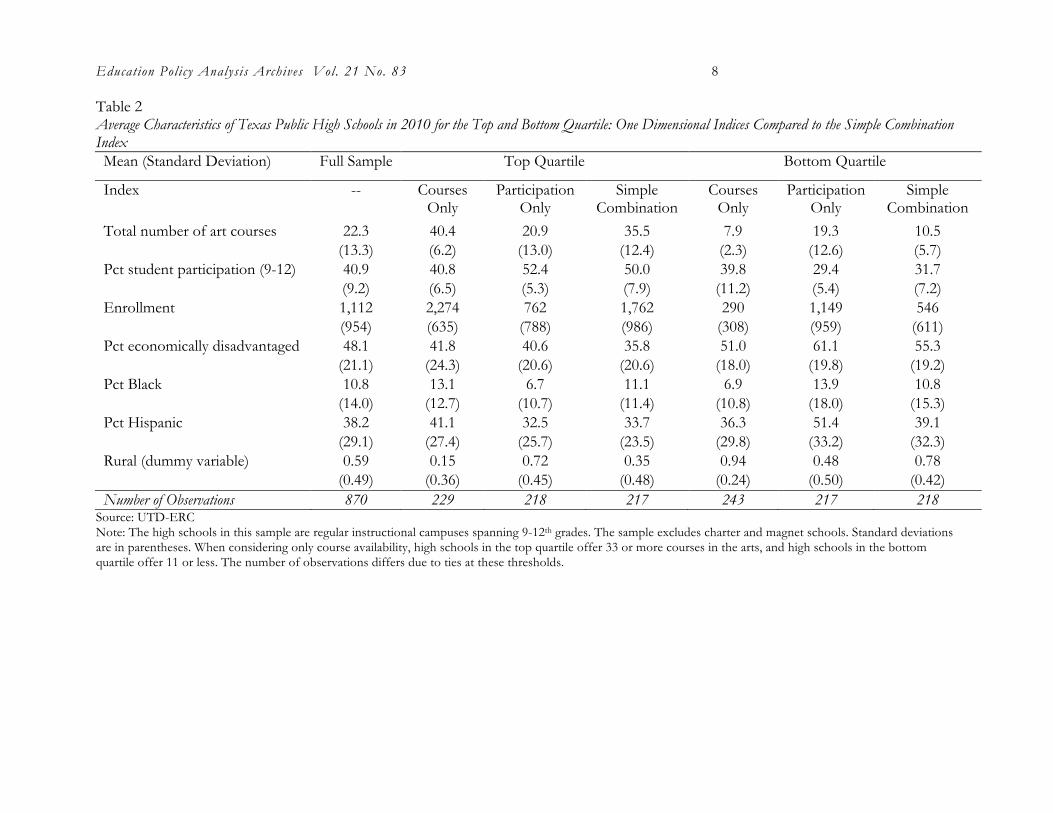
Despite the wide variety of arts courses available system-wide, in reality most high schools offer far less than the number officially approved as a standard course in the arts by the TEA. The average number offered in the arts for the high schools in our sample is 22 courses (Table 2). These offerings vary widely by school size, location, and student demographics. Although districts are required to offer at least two courses from the four fine arts areas, high schools simply must offer enough courses for students to graduate with the recommended diploma: one Carnegie unit in visual art, music, theatre or dance.8 The most popular disciplines in Texas public high schools in 2010 are music and visual art—98 percent of the campuses in our sample offer at least one course in music and 97 percent of the campuses offer at least one course in visual art. A majority of high schools also offer theatre—89 percent of the high schools in our sample. Dance is the artistic discipline least likely to be offered. Only 47 percent of the public high schools in Texas offer courses in dance. Texas fares better than the nation in the percentage of campuses offering courses in each discipline, likely due in part to its fine arts graduation requirement (Parsad & Spiegleman, 2012). According to Arts Education Partnership (2012), currently 23 states do not require students to obtain course credits in the arts to graduate high school.
The Pitfalls of Measuring Access Using Only One Indicator
The most basic approach to defining an arts-rich school is to simply designate those high schools that offer a large number of courses in the arts as arts-rich. Such an approach produces an index primarily driven by school size that disproportionately designates large, wealthy, non-rural high schools as arts-rich. Unfortunately, this approach is often the norm in evaluating the state of arts education and states are left with only vague notions of how their schools or districts are performing.
Access to arts education is still viewed mostly as an issue of course availability. For example, the President's Commission on the Arts and the Humanities (2011) discusses the decline in access to arts education in public schools, bemoaning our lack of information on basic course offerings. In the 2010 survey by NCES, Parsad & Spiegelman (2012) report that 91 percent of U.S. public high schools offered music in 2009 and 46 percent offered 5 or more courses in music. Eighty-nine percent of the high schools offered courses in the visual arts and 40 percent offered 5 or more courses in the visual arts.9 They do not provide detailed information about course offerings, only reporting high schools offering 5 or more courses by discipline, and there is no discussion of student participation rates. This report is only the third study of its kind. NCES published the first one in 1995 (Parsad & Spiegelman, 2012), and it provides policymakers some insight into the current state of arts education on a national scale. Yet it provides states very little context with which to place their own data. We know that Texas public high schools in 2010 offer 22 courses in the arts on average. We do not know whether this is currently typical or atypical of the rest of the nation.10
8 The Texas legislature recently passed House Bill 3 (2009), bringing the fine arts requirement for the minimum high school diploma up to the standard historically required of graduates with the recommended and distinguished diplomas (Texas Education Agency 2009). This new requirement is effective for 9th graders beginning in the 2010-11 academic year and does not affect our analysis. Students must meet certain conditions for admission into the Minimum High School Program (MHSP), but most of the students on this track have failed to be promoted to the 10th grade one or more times. See the following link at the TEA: http://www.tea.state.tx.us/index2.aspx?id=2147484563. 9 This leads a reporter for Education Week to declare that, “Rumors of the death of arts education in public schools have been greatly exaggerated…” (Robelen, April 18, 2012). 10 In the 1995 survey, NCES reports that public high schools offered an average of 5 courses in music, 5 in the visual arts, 2 in theatre, and 2 in dance in the 1993-94 academic year (Carey, Farris, Sikes, & Foy, 1995). The survey does not provide averages for the total number of courses offered in the arts. According to UTD-ERC data, the Texas public high

Access to High School Arts Education 7
Table 2 illustrates the dangers of measuring access using only course offerings. We rank order the high schools in our sample by the total number of courses offered in the arts and provide the average characteristics of the high schools that fall in the top and bottom quartile of this distribution. High schools in the top 25 percent when ranked by course availability offer 33 or more arts courses. Those in the bottom 25 percent offer 11 or less. Examining the top and bottom of a distribution is a common way to discuss “wealth” in many contexts, but we recognize that these cutoffs are purely arbitrary. We have no evidence to suggest that truly arts-rich environments should offer a minimum of 33 courses in the arts. We expect these distributions to vary by state, and we encourage policymakers to consider alternative definitions of richness and to have discussions with arts educators about the goals for course offerings in their state.
According to our Course Only Index, the number of arts courses is overwhelmingly a function of the size of the student body, and no small high school could ever score well on such a ranking, regardless of the program in place. The average high school in the top quartile has nearly 8 times the enrollment of the average high school in the bottom quartile. The Course Only Index designates large, suburban and urban high schools that offer a wide number and variety of arts courses as being arts-rich, even if a significant portion of the student body does not participate in arts education beyond the 1-credit graduation requirement. When course offerings are the only criteria considered, an astounding 94 percent of the arts-poor campuses in Texas are small schools located in rural areas.
The dimension that is perhaps most important in determining whether or not a high school is arts-rich is the engagement of its student body, but viewing arts access only as a participation issue is problematic as well.11 In Table 2 we also rank order high schools in our sample by overall (9-12) student participation rates in the arts. According to the Participation Only Index, arts-rich campuses are now much smaller high schools located predominately in rural areas. Compared to the Course Only Index, the pendulum swings in the opposite direction. Average enrollment for the high schools in the top quartile when only overall participation is considered is one-third the average enrollment when only course offerings are considered. The high schools in the bottom quartile on this index are now more likely to be urban or suburban schools. The Participation Only Index designates much smaller schools in predominately rural areas as being arts-rich because student participation, on average, is much higher in these schools even if the campus cannot offer a significant number of courses in the arts. The average student participation rate for the arts-rich schools according to this index is 52 percent, compared to only 41 percent for the Course Availability Index.
schools in our sample offered an average of 10 courses in music, 6 courses in the visual arts, 5 courses in theatre, and 2 courses in dance in 2010. 11 Although we use the terms engagement and participation interchangeably, we recognize that all students enrolled in an arts course are not necessarily engaged in the subject. However, we believe student participation rates are a reasonable approximation of student engagement in arts education.
Education Policy Analysis Archives Vol. 21 No. 83 8 Table 2 Average Characteristics of Texas Public High Schools in 2010 for the Top and Bottom Quartile: One Dimensional Indices Compared to the Simple Combination Index Mean (Standard Deviation) Full Sample Top Quartile Bottom Quartile
Index -- Courses Only
Participation Only
Simple Combination
Courses Only
Participation Only
Simple Combination
Total number of art courses 22.3 40.4 20.9 35.5 7.9 19.3 10.5 (13.3) (6.2) (13.0) (12.4) (2.3) (12.6) (5.7) Pct student participation (9-12) 40.9 40.8 52.4 50.0 39.8 29.4 31.7 (9.2) (6.5) (5.3) (7.9) (11.2) (5.4) (7.2) Enrollment 1,112 2,274 762 1,762 290 1,149 546 (954) (635) (788) (986) (308) (959) (611) Pct economically disadvantaged 48.1 41.8 40.6 35.8 51.0 61.1 55.3 (21.1) (24.3) (20.6) (20.6) (18.0) (19.8) (19.2) Pct Black 10.8 13.1 6.7 11.1 6.9 13.9 10.8 (14.0) (12.7) (10.7) (11.4) (10.8) (18.0) (15.3) Pct Hispanic 38.2 41.1 32.5 33.7 36.3 51.4 39.1 (29.1) (27.4) (25.7) (23.5) (29.8) (33.2) (32.3) Rural (dummy variable) 0.59 0.15 0.72 0.35 0.94 0.48 0.78 (0.49) (0.36) (0.45) (0.48) (0.24) (0.50) (0.42) Number of Observations 870 229 218 217 243 217 218
Source: UTD-ERC Note: The high schools in this sample are regular instructional campuses spanning 9-12th grades. The sample excludes charter and magnet schools. Standard deviations are in parentheses. When considering only course availability, high schools in the top quartile offer 33 or more courses in the arts, and high schools in the bottom quartile offer 11 or less. The number of observations differs due to ties at these thresholds.

Access to High School Arts Education 9
The main conclusion to draw from this dichotomy is that extensive course offerings in the arts and high rates of student engagement do not necessarily go hand in hand. If we believe that arts-rich environments create a school-wide culture that encourages all students to enroll in arts courses, then some measure of student participation should be an element in any assessment of the high school arts environment, and an index like the Course Availability Index we created will be woefully inadequate in identifying arts-rich schools. Policymakers must also consider the consequences of embracing the other extreme—an index that ignores course availability. We believe that most practitioners and arts education researchers would not consider high schools offering one or two arts courses even with high student participation an example of an arts-rich school, because campuses that offer fewer than 3 courses in the arts are not offering their students a program with depth and breadth.
Despite this potential concern, lack of depth and breadth is not an issue with our top ranking high schools. UTD-ERC data do not indicate the presence of any high schools with less than 3 courses in the arts with above average participation from their 9th-12th graders. The high schools defined as arts-rich on our Participation Only Index offer a minimum of 5 courses, which is sufficient to provide depth in at least one artistic discipline. However, this relationship may not hold in other states. Therefore, we urge policymakers to consider course offerings and student participation rates together when attempting to assess student access to high school arts education.
Simple Combination Index Using Both Course Offerings and Student Participation
Given how tied course offerings are to school resources, it is not surprising there is a positive relationship between course offerings and school size.12 However, we did not expect to find that a high rate of student participation proxies for small school size. Course availability and student participation appear to offset one another and policymakers need a combination of these two elements to produce a more accurate representation of access to arts education. Examining only course offerings places mostly large, non-rural schools at the top of the distribution, while examining only student participation places mostly small, rural schools at the top. Instead of evaluating access by course counts or participation rates in isolation, we suggest policymakers, at a minimum, create a simple combination index that unites course offerings and student participation into a single measure of access to arts education. Analysts can follow our approach using their own state education data.
We begin by choosing the following two observable variables from the UTD-ERC data: total course offerings in the arts and overall student participation in the arts for grades 9-12. We standardize each variable to have a mean of zero and a standard deviation of one.13 The Simple Combination Index is a linear combination of these two standardized variables with each variable given a weight of 0.5. Policymakers should choose the weights most appropriate for their states when conducting their own analysis. We provide the average characteristics of the high schools in the top and bottom quartile on the Simple Combination Index in Table 2. Compared to one-dimensional metrics, school size has less of an impact on which schools are designated as arts-rich or arts-poor, and more rural schools make the top 25 percent on this index while fewer rural schools
12 Because the relationship between school size and course offerings is not linear, we do not scale course offerings by student enrollment in our analysis. 13 To standardize in this manner we began by obtaining the global mean and standard deviation for each variable. We then subtracted the mean from each observation and divided by the standard deviation to create standardized versions of the original variables.

Education Policy Analysis Archives Vol. 21 No. 83 10 are relegated to the bottom 25 percent. The Simple Combination Index is better than a measurement of access that only considers a single indicator, but it still identifies predominately large, urban and suburban high schools as arts-rich and predominately small, rural high schools as arts-poor.
We would like to emphasize that the purpose of these indices is not to rank high schools. Rather, we develop these measures of access to uncover the potential inequities in access to quality arts education, using Texas as an example. The arts access indices that we have created are meant to serve as a starting point for future evaluations that we hope will include site visits and a determination of best practices that struggling schools can adopt to improve the quality of the arts education they provide their students.14 Below we compare the placement of high schools in the top and bottom quartiles on our one dimensional indices with those on the Simple Combination Index to further illustrate the consequences of measuring access using course offerings or student participation in isolation. We make only general comparisons and do not report any characteristics that could potentially identify an individual high school.15
Only 43 schools that make the top quartile on the Courses Only Index also make the top quartile on the Participation Only Index, indicating that the high schools with the highest rates of student participation in the arts do not necessarily offer the most courses in the arts. These high schools can also be found in the top quartile on the Simple Combination Index. In total, 63 percent of the high schools in the top quartile on the Courses Only Index also make the top quartile on the Simple Combination Index. This indicates that while the Simple Combination Index is a vast improvement over a simple course count, this approach to measuring access still prioritizes large high schools. The high schools in the top quartile on the Courses Only Index offer a minimum of 33 courses in the arts. When participation rates are taken into account with the Simple Combination Index, 73 high schools offering less than 33 courses make the top quartile, and one high school offers as few as 7 arts courses. However, the majority of high schools in the top quartile on the Simple Combination Index still have very large student bodies. The average number of courses offered in this group is 35.
Similar patterns emerge when we examine the high schools in the bottom quartile. Eighty high schools appear in the bottom quartile on both one dimensional indices. These same high schools are also in the bottom on the Simple Combination Index. While this combination index has several high schools that make the bottom because of very low course offerings, 11 schools offer close to a dozen courses in the arts. Again, when participation rates are taken into account, larger high schools can end up with low rankings because of a lack of student participation in the arts.
Although it has its shortcomings, the Simple Combination Index is a profound improvement over the typical way we currently examine access to arts education. Sufficient access should not be determined by a basic course count. This is especially true for states with a large proportion of rural districts. The rural high schools in our sample offer an average of 15 arts courses (Table 3). The non-rural high schools in our sample offer an average of 33 arts courses and are, on average, nearly four times the size of the rural schools. Widespread student participation in the arts can and does happen in schools with limited resources to support a wide array of course offerings across the disciplines. Failing to include some measure of student participation ignores a fundamental aspect of
14 We acknowledge that better representations of access as measured by our indices would include variables that capture program quality. Unfortunately, UTD-ERC data contain no direct measures of the quality of arts education programs. 15 Any analysis conducted by a state agency using administrative data would be a matter of public record. However, it would be up to the agency to determine how public it would like individual rankings to be. We recommend agencies release reports similar to ours which do not contain individual school rankings. Citizens interested in obtaining such rankings could file a request through state open records laws.

Access to High School Arts Education 11 art-rich environments that can thrive even in the face of budget cuts and limited resources—students who are encouraged by their families, peers, teachers, and administrators to get involved in arts education. Producing a simple combination index like the one we describe above will improve what we know about access to arts education at the state level, and we encourage all states to substitute this method of measuring access for basic course tallies or other one dimensional measures.
Table 3 Average Characteristics for Texas Public High Schools in 2010 by Rural Location Mean (Standard Deviation) Full Sample Rural Districts Nonrural Districts Total number of art courses 22.3 15.1 32.6 (13.3) (9.1) (11.3) Pct student participation (9-12) 40.9 42.5 38.7 (9.2) (9.5) (8.3) Enrollment 1,112 529 1,949 (954) (499) (818) Pct economically disadvantaged 48.1 46.4 50.4 (21.1) (16.3) (26.3) Pct Black 10.8 7.5 15.6 (14.0) (10.3) (17.0) Pct Hispanic 38.2 31.5 48.0 (29.1) (25.9) (30.7) Rural (dummy variable) 0.59 1 0 (0.49) (0) (0) Number of Observations 870 513 357
Source: UTD-ERC The high schools in this sample are regular instructional campuses spanning 9-12th grades. The sample excludes charter and magnet schools. Standard deviations are in parentheses.
Combination Index Using Multiple Variables to Measure Course Offerings and Student Participation
Although the Simple Index combining total course offerings and overall participation is an improvement over evaluating high school arts programs along one dimension, it lacks important details. We believe that the best way to create an index of arts opportunity is to include multiple variables that capture both course offerings and student participation (Table 4). A tally of total course offerings misses availability by each discipline (breadth) and ignores the extent to which high schools offer advanced instruction in the arts (depth). A total count of four could describe a high school offering only introductory level classes in all four disciplines or it could describe a high school that offers the most advanced courses in a single discipline. Measures of depth can provide important information about a school’s commitment to arts education and do not simply proxy for resources.16
16 We cannot explicitly control for the financial investments that schools make in their arts programs because the UTD-ERC data do not include any information on arts education budgets at the school level.

Education Policy Analysis Archives Vol. 21 No. 83 12 Table 4 Descriptive Statistics for Variables Used in Factor Analysis Variables Mean Std. Dev. Min Max Level I courses offered in visual art 0.96 0.19 0 1 Level II courses offered in visual art 1.72 1.34 0 8 Level III courses offered in visual art 1.37 1.24 0 7 Level IV courses offered in visual art 0.65 0.88 0 8 Level I courses offered in music 3.10 1.78 0 8 Level II courses offered in music 2.55 1.67 0 7 Level III courses offered in music 2.29 1.56 0 6 Level IV courses offered in music 2.14 1.55 0 6 Level I courses offered in theatre 1.72 0.97 0 3 Level II courses offered in theatre 1.36 1.01 0 3 Level III courses offered in theatre 0.97 0.93 0 3 Level IV courses offered in theatre 0.61 0.79 0 3 Courses offered in dance (any level) 1.60 1.83 0 4 AP courses offered in art, music, theatre, or dance 0.96 1.43 0 5 IB courses offered in art, music, theatre, or dance 0.08 0.51 0 7 Pct 12th gr with >= 3 credits in any arts course 22.7 10.8 0 70.3 Pct 9th gr with 1 credit in any arts course in 2010 43.4 16.6 0 93.3 Pct 10th gr with 1 credit in any arts course in 2010 42.8 12.6 0 97.3 Pct 11th gr with 1 credit in any arts course in 2010 39.5 11.3 0 87.5 Pct 12th gr with 1 credit in any arts course in 2010 36.8 12.3 0 92.3 Number of Observations 870
Source: UTD-ERC The high schools in this sample are regular instructional campuses spanning 9-12th grades. The sample excludes charter and magnet schools.
Just as a total course count obscures essential aspects of course availability, overall student participation rates obscure essential aspects of engagement--participation by grade level and long term participation in the arts. Including participation rates by grade level allows us to recognize the high schools that are able to maintain a high level of arts participation from their 11th and 12th graders, a challenge for many schools. According to the UTD-ERC data, student participation tends to decline as students move from one grade to the next, a phenomenon previously confirmed by Catterall’s analysis of the NELS data (2009). Including the percentage of 12th graders who enrolled in multiple arts courses over their high school career allows us to identify high schools with sustained student engagement in the arts. A truly arts-rich environment will encourage students to intensely participate in arts education and not merely satisfy a graduation requirement.
To distill multiple variables into one measure of access to arts education, we utilize exploratory factor analysis. We believe factor analysis is the most suitable analytical tool to employ not only because it allows us to characterize arts-rich environments along multiple dimensions, but because the school characteristics we can observe in our data are the results of school and community cultures that support quality arts education. It is likely there are latent variables that underlie our observable characteristics and interact in unique ways to produce strong education programs in the arts. Using factor analysis, we create two indices using both course availability and

Access to High School Arts Education 13 student participation variables. The first is the Balanced Index which gives equal weight to course offerings in the arts and student participation. The second is the Weight on Participation Index which gives a greater weight to student participation while still retaining course availability as an element in the index. Details regarding the creation of each index are given below.
To develop these more complicated indices we conduct an exploratory factor analysis to identify the underlying construct(s) that typify each high school's arts environment as measured by our course availability and student participation variables. The descriptive statistics for these variables can be found in Table 4. Factor analysis assumes that each observed variable is made up of characteristics unique to that variable as well as characteristics shared with the other related variables. It can take a large number of variables (in our case 15 course variables and 5 student participation variables) and create unobservable factors which are essentially the common elements of all of the observable variables (Bandelos & Boehm-Kaufman, 2009; Fabrigar, Wegener, MacCallum, & Strahan, 1999). The ultimate goal is to produce a score for the high schools in our sample on each factor and apply appropriate weights to create an index that will allow us to identify arts-rich and arts-poor schools.
The primary considerations we face regarding an exploratory factor analysis include the method of factor extraction, the number of factors to retain, the form of rotation to use in order to obtain interpretable results, and the weights to apply to the factors to create each index.17 After extracting the initial factors, we visually inspect a scree plot to inform our decision on the number of factors to retain.18 After determining the number of factors to extract, we conduct another factor analysis to estimate the factor loadings of the observed variables in Table 4 on the extracted factors.19 The factor loadings simply express how correlated the unobservable factors are to our observable variables. If clear patterns emerge, they allow the researcher to effectively name the factors to provide some interpretation. Each factor will have variables with high loadings and low loadings, thus revealing the relationships between the variables describing the high school arts environment and the unobserved factors. A high loading is typically considered to be 0.50 or greater (Costello & Osborne, 2005). Table 5 contains the rotated factor loadings for both combination indices. The factor analysis of all 20 observable variables produces a scree plot that suggests retaining 3-4 factors. Because we know that all of the disciplines except dance dominate course offerings in Texas, and because underextraction can distort the results in an exploratory factor analysis (Ledesma & Valero-Mora, 2007), we choose to retain 4 factors. Factor 1 loads on music courses, factor 2 loads on theatre courses, factor 3 loads on visual art courses, and factor 4 loads on the student participation variables.
After identifying the common elements of arts-rich environments across Texas high schools, we then calculate a score on each factor for every high school to create our combination indices. We standardize all of the observed variables and use a regression scoring method to produce the scoring coefficients. These coefficients generate factors as weighted sums of the standardized versions of our observable variables. We then apply weights to each factor to create our Balanced Index and our Weight on Participation Index. We choose to give equal weight to course availability and student participation for the Balanced Index--a weight of 0.5 for the participation factor, a weight of 0.167 for the music factor, a weight of 0.167 for the theatre factor, and a weight of 0.167 for the visual art 17 See Fabrigar et al, (1999) for a good discussion of the choices researchers must make when conducting exploratory factor analysis. 18 The scree plot graphs the eigenvalues against the number of factors and the typical recommendation is to retain the number of factors up to the point the eigenvalues level off, in essence abandoning the scree (Bandelos & Boehm-Kaufman, 2009). 19 We have no reason to believe that our factors are uncorrelated, so we choose to use an oblique rotation rather than an orthogonal rotation to see the pattern of factor loadings on the original variables (Bandalos & Boehm-Kaufman, 2009).
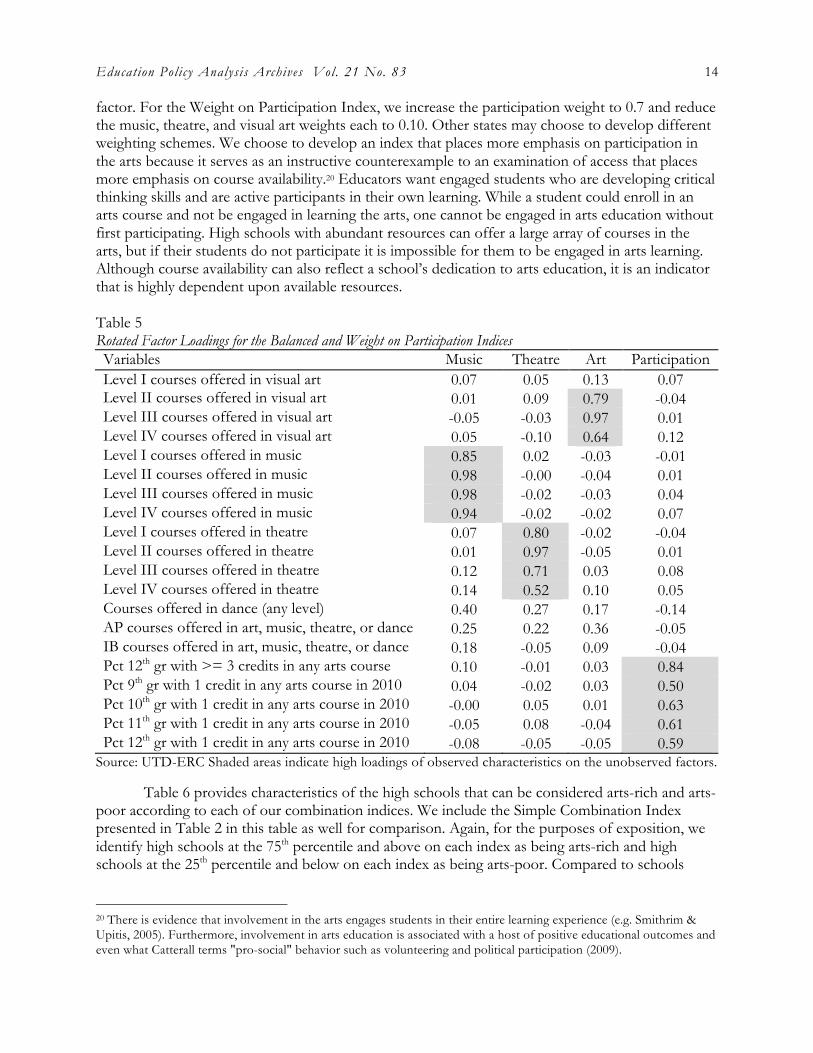
Education Policy Analysis Archives Vol. 21 No. 83 14 factor. For the Weight on Participation Index, we increase the participation weight to 0.7 and reduce the music, theatre, and visual art weights each to 0.10. Other states may choose to develop different weighting schemes. We choose to develop an index that places more emphasis on participation in the arts because it serves as an instructive counterexample to an examination of access that places more emphasis on course availability.20 Educators want engaged students who are developing critical thinking skills and are active participants in their own learning. While a student could enroll in an arts course and not be engaged in learning the arts, one cannot be engaged in arts education without first participating. High schools with abundant resources can offer a large array of courses in the arts, but if their students do not participate it is impossible for them to be engaged in arts learning. Although course availability can also reflect a school’s dedication to arts education, it is an indicator that is highly dependent upon available resources. Table 5 Rotated Factor Loadings for the Balanced and Weight on Participation Indices Variables Music Theatre Art Participation Level I courses offered in visual art 0.07 0.05 0.13 0.07 Level II courses offered in visual art 0.01 0.09 0.79 -0.04 Level III courses offered in visual art -0.05 -0.03 0.97 0.01 Level IV courses offered in visual art 0.05 -0.10 0.64 0.12 Level I courses offered in music 0.85 0.02 -0.03 -0.01 Level II courses offered in music 0.98 -0.00 -0.04 0.01 Level III courses offered in music 0.98 -0.02 -0.03 0.04 Level IV courses offered in music 0.94 -0.02 -0.02 0.07 Level I courses offered in theatre 0.07 0.80 -0.02 -0.04 Level II courses offered in theatre 0.01 0.97 -0.05 0.01 Level III courses offered in theatre 0.12 0.71 0.03 0.08 Level IV courses offered in theatre 0.14 0.52 0.10 0.05 Courses offered in dance (any level) 0.40 0.27 0.17 -0.14 AP courses offered in art, music, theatre, or dance 0.25 0.22 0.36 -0.05 IB courses offered in art, music, theatre, or dance 0.18 -0.05 0.09 -0.04 Pct 12th gr with >= 3 credits in any arts course 0.10 -0.01 0.03 0.84 Pct 9th gr with 1 credit in any arts course in 2010 0.04 -0.02 0.03 0.50 Pct 10th gr with 1 credit in any arts course in 2010 -0.00 0.05 0.01 0.63 Pct 11th gr with 1 credit in any arts course in 2010 -0.05 0.08 -0.04 0.61 Pct 12th gr with 1 credit in any arts course in 2010 -0.08 -0.05 -0.05 0.59
Source: UTD-ERC Shaded areas indicate high loadings of observed characteristics on the unobserved factors.
Table 6 provides characteristics of the high schools that can be considered arts-rich and arts-poor according to each of our combination indices. We include the Simple Combination Index presented in Table 2 in this table as well for comparison. Again, for the purposes of exposition, we identify high schools at the 75th percentile and above on each index as being arts-rich and high schools at the 25th percentile and below on each index as being arts-poor. Compared to schools
20 There is evidence that involvement in the arts engages students in their entire learning experience (e.g. Smithrim & Upitis, 2005). Furthermore, involvement in arts education is associated with a host of positive educational outcomes and even what Catterall terms "pro-social" behavior such as volunteering and political participation (2009).

Access to High School Arts Education 15
Table 6 Average High School Characteristics for the Top and Bottom Quartile: Simple Combination Index Compared to Factor Analysis Indices Mean (Standard Deviation) Full Sample Top Quartile Bottom Quartile Index -- Simple
Combination Balanced
(FA) Weight on
Participation (FA)
Simple Combination
Balanced (FA)
Weight on Participation
(FA) Total number of art courses 22.3 35.5 33.5 27.7 10.5 10.3 13.5 (13.3) (12.4) (13.5) (15.0) (5.7) (5.7) (9.3) Pct student participation (9-12) 40.9 50.0 47.8 50.1 31.7 32.9 31.6 (9.2) (7.9) (7.9) (7.0) (7.2) (7.9) (7.5) Enrollment 1,112 1,762 1,597 1,168 546 534 783 (954) (986) (1,038) (1,024) (611) (587) (805) Pct economically disadvantaged 48.1 35.8 37.3 37.8 55.3 56.0 57.5 (21.1) (20.6) (19.7) (19.4) (19.2) (20.1) (20.5) Pct Black 10.8 11.1 9.8 8.2 10.8 11.4 13.4 (14.0) (11.4) (10.8) (10.1) (15.3) (17.2) (18.0) Pct Hispanic 38.2 33.7 32.6 31.2 39.1 40.0 42.8 (29.1) (23.5) (23.1) (23.5) (32.3) (32.7) (32.8) Rural (dummy variable) 0.59 0.35 0.44 0.60 0.78 0.76 0.65 (0.49) (0.48) (0.50) (0.49) (0.42) (0.43) (0.48) Number of Observations 870 217 218 218 218 218 218
Source: UTD-ERC The high schools in this sample are regular instructional campuses spanning 9-12th grades. The sample excludes charter and magnet schools. Balanced Index = 0.167(Music Factor) + 0.167(Theatre Factor) + 0.167(Visual Art Factor) + 0.50(Student Participation Factor) Weight on Participation Index = 0.10(Music Factor) + 0.10(Theatre Factor) + 0.10(Visual Art Factor) + 0.70(Student Participation Factor)

Education Policy Analysis Archives Vol. 21 No. 83 16 scoring low on our indices, arts-rich schools, on average, are larger schools located in non-rural areas that serve less diverse student bodies and have smaller proportions of low-income students. However, arts-rich schools can be large or small, wealthy or poor, rural or non-rural, with high or low minority student populations. The same can be said of arts-poor schools.
As evident in Table 6, the manner in which researchers construct an arts access index and the weights they choose can have substantial impact on the type of schools that are ultimately identified as arts-rich or arts-poor, with the most striking example from our data being the position of rural schools in these rankings. The top 25 percent on the Simple Combination Index is still largely dominated by non-rural high schools and the bottom 25 percent is still largely dominated by rural schools. More rural schools show up in the top quartile on the Balanced Index created using factor analysis, but the greatest change along this dimension is for the index that places more weight on student participation in arts education. In fact, the Weight on Participation Index is more reflective of the actual percentage of high schools in Texas that are located in rural areas. Nearly 60 percent of the high schools in our sample are located in rural areas. When more weight is given to student participation, 60 percent of the arts-rich high schools are rural, and 65 percent of the arts-poor high schools are rural. Below we discuss the general characteristics of the highest and lowest ranking high schools on our combination indices created using factor analysis and compare them to the Simple Combination Index to illustrate why these are our preferred measures of access to arts education.
When examining the arts-rich schools, 76 percent of the high schools in the top quartile on the Balanced Index also make the top quartile on the Simple Combination Index. When examining the arts-poor schools, 81 percent of the high schools in the bottom quartile on the Balanced Index also make the bottom quartile on the Simple Combination Index. Although there is quite a bit of overlap, there are critical differences in the characteristics of the schools that do not make both lists and those that see significant changes in rankings. For example, there are 52 schools identified as arts-rich on the Balanced Index that fail to make the top quartile on the Simple Combination Index. The average number of courses offered by these schools is 24, which is slightly above the mean for the full sample. However, these schools also appear to enjoy higher than average rates of engagement as evidenced by the percentage of 12th graders who have completed 3 or more courses in the arts (35 percent). To reiterate, while the Simple Combination Index is an improvement over a course count because it takes participation into account, using factor analysis allows us to include multiple variables that measure different aspects of course offerings and participation, such as the breadth of the program, the availability of advanced instruction, and the percentage of students that participate over time and move beyond just satisfying a graduation requirement.
There are 134 Texas high schools that make the top quartile on each combination index. This overlap indicates that 62 percent of the high schools in the top quartile provide the richest environments in the arts for their students no matter how we define arts-rich. It is important to note that 99 high schools hold unique positions in the top quartile on one of the three combination indices. Although the high schools in the top quartile tend to be large schools serving smaller numbers of disadvantaged students, the campus that holds the number one ranking on the Simple Combination Index, the Balanced Index, and the Weight on Participation Index is a medium-sized campus that serves predominately low-income students. This high school holds the number one position on each combination index because it offers a large number of courses in the arts and can boast of one of the highest rates of participation across all grade-levels—upwards of 60 percent. This is uncharacteristic of the rest of the high schools in our sample, where the average overall participation rate is about 41 percent. Only 22 other high schools in our sample can claim overall participation rates above 60 percent.

Access to High School Arts Education 17
Seventy-six high schools are in the bottom quartile on every combination index, indicating that many schools struggle with poor arts education programs no matter how we construct our indices. However, there are 79 Texas public high schools that hold unique positions in the bottom quartile according to our combination indices. Several of the high schools at the very bottom are small schools that offer dual degree programs for at-risk students, specifically targeting low-income, minority, first-generation college students, and students for whom English is not their first language. Given what we know about the involvement of at-risk students in arts education, the placement of these schools at the bottom of the distribution is not surprising. However, their rankings indicate the potential for great change, especially for the educators and policymakers who want to prioritize their efforts to assist the most vulnerable students Texas serves.
Policy Recommendations
Our findings suggest that merely documenting course offerings will not be enough to accurately assess access to high school arts education and will produce a distorted view of where we are if it is the only metric of evaluation. Our analysis points to an unequal distribution of both course offerings and participation in arts education. States would be wise to assess the current distribution of arts course offerings across their districts and schools, as well as which groups of students are or are not participating. Such an evaluation is necessary not only to address issues of equity, but to ensure that public high schools are offering sufficient opportunities that will enable all students to participate in the creative global economy. The fact that 91 percent of our public high schools currently offer music and 89 percent offer courses in visual art (Parsad & Spiegleman, 2012) is not a cause for great celebration when we do not know how many of these schools offer only one or two courses in the arts or struggle with low student involvement. The richness of the UTD-ERC data has allowed us to develop measures of arts access that include both course offerings and student participation rates and is a fundamental improvement in what we currently understand about access. We demonstrate the consequences of a one dimensional measurement of access by creating the Courses Only Index and the Participation Only Index. Course offerings and student participation rates in the arts tend to move in opposite directions, and we urge policymakers, at a minimum, to substitute the Simple Combination Index for a basic tally of arts courses. If states have the available resources and expertise to devote to a more comprehensive analysis, we recommend the creation of indices like the Balanced Index and the Weight on Participation Index that utilize multiple measures of course offerings and participation. These combination indices can identify strong programs in the arts based on the prevalence of individual disciplines, instruction beyond the foundation level, and the percentage of students that participate in the arts over time. Policymakers can choose the weights that most reflect the goals for arts education in their state when creating their indices of arts access. We would like to emphasize that the choice of methodology (simple linear combination versus factor analysis) and the weighting schemes are important decisions that should not be made lightly. Because these choices can result in a dramatic change in the rankings for some schools, we strongly recommend that analysts and policymakers 1) focus on quartiles or quintiles of the generated distribution and not individual school rankings, and 2) thoughtfully choose the weighting schemes that most reflect the values and goals of arts education in their districts and states. While we believe that the ideal specification of the index should place more weight on participation, other states may make different choices when attempting to evaluate arts access using our general approach.

Education Policy Analysis Archives Vol. 21 No. 83 18
The indices we have developed establish a starting point for discussing the state of arts education in Texas and can likely serve as a bellwether for the nation as a whole. We also encourage arts educators and state policymakers to work together to create stated goals for course offerings and student participation rates given school size and available resources. Established guidelines that can give researchers using administrative databases the necessary metrics to evaluate the strength of high school arts programs without having to resort to arbitrary thresholds will produce better evaluations. After all, 25 percent of the high schools in Texas are arts-rich on each index because we say they are. What if arts educators believe that to be truly arts-rich, a high school should offer at least 16 courses in the arts and at least half of the student body should be participating in any year? If these were well-accepted thresholds, then only 7 percent of the high schools in our sample would qualify as arts-rich. We are not proposing that these are appropriate definitions. But we do believe that educators, policymakers, and parents need to have these normative discussions. Furthermore, it is likely that states conducting an analysis like ours will uncover similar patterns of inequities, and we hope this might inspire policymakers to invest the necessary funds for qualified arts educators to collect additional data, particularly on program quality, that researchers can use to conduct a more comprehensive evaluation of public school programs in the arts.
References
Arts Education Partnership. (2012). State of the States 2012: Arts Education State Policy Summary. Retrieved from: http://wp.aep-arts.org/wp-content/uploads/2011/12/State-of-the-states-2012-FINAL.pdf.
Bandalos, D.L. & Boehm-Kauffman, M.R. (2009). Four Common Misconceptions in Exploratory Factor Analysis. In C. E. Lance & R. J. Vanderberg (Eds.), Statistical and Methodological Myths and Urban Legends: Doctrine, Verity and Fable in the Organizational and Social Sciences (pp. 61-87). New York, New York: Routledge.
Barry, N., Taylor, J., & Walls, K. (1990). The Role of the Fine and Performing Arts in High School Dropout Prevention. Center for Music Research, Florida State University, Tallahassee, FL. Broudy, H.S. (1994). Enlightened Cherishing: An Essay on Aesthetic Education. Chicago: University
of Illinois Press. Previously published in 1972 in a cloth edition for Kappa Delta Pi by the University of Illinois Press.
Burnaford, G., Brown, S., Doherty, J., & McLaughlin J. (2007). Arts Integration Frameworks, Research and Practice: A Literature Review. Retrieved from http://209.59.135.52/files/publications/arts_integration_book_final.pdf.
Carey, N.C., Farris, E. Sikes, M. & Foy, R. (1995). Arts Education in Public Elementary and Secondary Schools. NCES 95082. National Center For Education Statistics. Washington, D.C.
Catterall, J.S. (2009). Doing Well and Doing Good by Doing Art: A 12-Year National Study of Education in the Visual and Performing Arts; Effects on the Achievements and Values of Young Adults. Los Angeles, CA: Imagination Group. Costello, A.B. & Osborne, J.W. (2005). Best Practices in Exploratory Factor Analysis: Four
Recommendations for Getting the Most From Your Analysis. Practical Assessment, Research and Evaluation. 10 7), 1-7. Retrieved from http://pareonline.net/getvn.asp?v=10&n=7.
Eisner, E.W. (1986). The Role of the Arts in Cognition and Curriculum. Journal of Art and Design Education. 5(1-2), 57-67.
Fabrigar, L. R., Wegener, D.T. MacCallum, R.C. & Strahan, E.J. (1999). Evaluating the Use of Exploratory Factor Analysis in Psychological Research. Psychological Methods. 4(3), 272-99.
Access to High School Arts Education 19 General Appropriations Act, Article III. (2009). 81st Congress. Legislature of the State of Texas.
Rider 42E. Heath, S. B. (1998). Living the Arts Through Language and Learning: A Report on Community-
Based Youth Organizations. Americans for the Arts Monographs. 2(7), 1-18. Washington, DC. House Bill No. 3 (2009). 81st Congress. Legislature of the State of Texas. Retrieved from
http://www.capitol.state.tx.us/tlodocs/81R/billtext/pdf/HB00003F.pdf. Ledesma, R.D. & Valero-Mora, P. (2007). Determining the Number of Factors to Retain in EFA:
An Easy-to-Use Computer Program for Carrying Out Parallel Analysis. Practical Assessment, Research and Evaluation. 12(2), 1-11. Retrieved from http://pareonline.net/getvn.asp?v=12&n=2.
Mahoney, J. L. & Cairns, R. B. (1997). Do Extracurricular Activities Protect Against Early School Dropout? Developmental Psychology. 33(2), 241-53.
Parsad, B., & Spiegelman, M. (2012). Arts Education in Public Elementary and Secondary Schools: 1999-2000 and 2009–10 (NCES 2012–014). National Center for Education Statistics, Institute of Education Sciences, U.S. Department of Education. Washington, DC.
President’s Committee on the Arts and the Humanities. (2011). Reinvesting in Arts Education: Winning America’s Future Through Creative Schools. Washington, DC.
Robelen, E.W. (2012, April 18). No Obituary Needed for Arts Education, Data Suggest. Education Week, (31)28, p. 8.
-----(2012, February 1). Coming to Schools: Creativity Indexes. Education Week, 31(19), pp. 1, 12.
-----(2011, December 7). Building STEAM: Blending the Arts with STEM Subjects. Education Week, (31)13, pp. 8-9.
Ruppert, S.S. & Nelson, A.L. (2006). From Anecdote to Evidence: Assessing the Status and condition of Arts Education at the State Level. Washington, DC: Arts Education Partnership.
Smithrim, K. & R. Upitis (2005). Learning Through the Arts: Lessons of Engagement. Canadian Journal of Education. 28(1&2), 109-27.
Stanford Report. (2005, June 14). ‘You’ve Got to Find What you Love,’ Jobs Says. Retrieved from: http://news.stanford.edu/news/2005/june15/jobs-061505.html.
Stevenson, L. M. & Deasy, R. J. (2005). Third Space: When Learning Matters. Washington, D.C.: Arts Education Partnership.

Education Policy Analysis Archives Vol. 21 No. 83 20
About the Author
M. Kathleen Thomas Mississippi State University [email protected] M. Kathleen Thomas is an associate professor of economics in the Department of Finance and Economics at Mississippi State University. She is also a research affiliate with the Texas Schools Project at The University of Texas at Dallas. Dr. Thomas is currently using administrative education data to examine how participation in arts education influences achievement. Priyanka Singh Education Research Center at The University of Texas at Dallas [email protected] Priyanka Singh is a research scientist at the Education Research Center at The University of Texas at Dallas. Her research interests focus on the economics of education, labor economics, and applied microeconometrics. Dr. Singh received her doctorate degree in economics from The University of Texas at Dallas. Kristin Klopfenstein Education Innovation Institute at University of Northern Colorado [email protected] Kristin Klopfenstein is the founding executive director of the Education Innovation Institute at the University of Northern Colorado where she works to connect researchers, policymakers, and educators to improve education. Prior to joining EII, Dr. Klopfenstein was the interim director of Texas Schools Project at The University of Texas at Dallas and associate professor of economics at Texas Christian University. Thomas Henry U.S. Food and Drug Administration [email protected] Thomas Henry is an economist in the Office of the Commissioner of the U.S. Food and Drug Administration. Prior to joining FDA, he was an instructor of economics and a doctoral student at Mississippi State University. His dissertation examined the impact of participation in the performing arts in high school on education, labor market, and occupational choice outcomes using the National Longitudinal Survey of Youth.

Access to High School Arts Education 21
education policy analysis archives Volume 21 Number 83 November 4th, 2013 ISSN 1068-2341
Readers are free to copy, display, and distribute this article, as long as the work is attributed to the author(s) and Education Policy Analysis Archives, it is distributed for non-commercial purposes only, and no alteration or transformation is made in the work. More details of this Creative Commons license are available at http://creativecommons.org/licenses/by-nc-sa/3.0/. All other uses must be approved by the author(s) or EPAA. EPAA is published by the Mary Lou Fulton Institute and Graduate School of Education at Arizona State University Articles are indexed in CIRC (Clasificación Integrada de Revistas Científicas, Spain), DIALNET (Spain), Directory of Open Access Journals, EBSCO Education Research Complete, ERIC, Education Full Text (H.W. Wilson), QUALIS A2 (Brazil), SCImago Journal Rank; SCOPUS, SOCOLAR (China).
Please contribute commentaries at http://epaa.info/wordpress/ and send errata notes to Gustavo E. Fischman [email protected] Join EPAA’s Facebook community at https://www.facebook.com/EPAAAAPE and Twitter feed @epaa_aape.
Education Policy Analysis Archives Vol. 21 No. 83 22
education policy analysis archives editorial board
Editor Gustavo E. Fischman (Arizona State University) Associate Editors: Audrey Amrein-Beardsley (Arizona State University) Rick Mintrop, (University of California, Berkeley) Jeanne M. Powers (Arizona State University) Jessica Allen University of Colorado, Boulder Christopher Lubienski University of Illinois, Urbana-
Champaign Gary Anderson New York University Sarah Lubienski University of Illinois, Urbana-
Champaign Michael W. Apple University of Wisconsin, Madison Samuel R. Lucas University of California, Berkeley Angela Arzubiaga Arizona State University Maria Martinez-Coslo University of Texas, Arlington David C. Berliner Arizona State University William Mathis University of Colorado, Boulder Robert Bickel Marshall University Tristan McCowan Institute of Education, London Henry Braun Boston College Heinrich Mintrop University of California, Berkeley Eric Camburn University of Wisconsin, Madison Michele S. Moses University of Colorado, Boulder Wendy C. Chi* University of Colorado, Boulder Julianne Moss University of Melbourne Casey Cobb University of Connecticut Sharon Nichols University of Texas, San Antonio Arnold Danzig Arizona State University Noga O'Connor University of Iowa Antonia Darder University of Illinois, Urbana-
Champaign João Paraskveva University of Massachusetts,
Dartmouth Linda Darling-Hammond Stanford University Laurence Parker University of Illinois, Urbana-
Champaign Chad d'Entremont Strategies for Children Susan L. Robertson Bristol University
John Diamond Harvard University John Rogers University of California, Los Angeles Tara Donahue Learning Point Associates A. G. Rud Purdue University Sherman Dorn University of South Florida Felicia C. Sanders The Pennsylvania State University Christopher Joseph Frey Bowling Green State
University Janelle Scott University of California, Berkeley
Melissa Lynn Freeman* Adams State College Kimberly Scott Arizona State University Amy Garrett Dikkers University of Minnesota Dorothy Shipps Baruch College/CUNY Gene V Glass Arizona State University Maria Teresa Tatto Michigan State University Ronald Glass University of California, Santa Cruz Larisa Warhol University of Connecticut Harvey Goldstein Bristol University Cally Waite Social Science Research Council Jacob P. K. Gross Indiana University John Weathers University of Colorado, Colorado
Springs Eric M. Haas WestEd Kevin Welner University of Colorado, Boulder Kimberly Joy Howard* University of Southern
California Ed Wiley University of Colorado, Boulder
Aimee Howley Ohio University Terrence G. Wiley Arizona State University Craig Howley Ohio University John Willinsky Stanford University Steve Klees University of Maryland Kyo Yamashiro University of California, Los Angeles
Jaekyung Lee SUNY Buffalo * Members of the New Scholars Board

Access to High School Arts Education 23
archivos analíticos de políticas educativas consejo editorial
Editor: Gustavo E. Fischman (Arizona State University) Editores. Asociados Alejandro Canales (UNAM) y Jesús Romero Morante (Universidad de Cantabria)
Armando Alcántara Santuario Instituto de
Investigaciones sobre la Universidad y la Educación, UNAM México
Fanni Muñoz Pontificia Universidad Católica de Perú
Claudio Almonacid Universidad Metropolitana de Ciencias de la Educación, Chile
Imanol Ordorika Instituto de Investigaciones Economicas – UNAM, México
Pilar Arnaiz Sánchez Universidad de Murcia, España Maria Cristina Parra Sandoval Universidad de Zulia, Venezuela
Xavier Besalú Costa Universitat de Girona, España Miguel A. Pereyra Universidad de Granada, España Jose Joaquin Brunner Universidad Diego Portales,
Chile Monica Pini Universidad Nacional de San Martín,
Argentina Damián Canales Sánchez Instituto Nacional para la
Evaluación de la Educación, México Paula Razquin UNESCO, Francia
María Caridad García Universidad Católica del Norte, Chile
Ignacio Rivas Flores Universidad de Málaga, España
Raimundo Cuesta Fernández IES Fray Luis de León, España
Daniel Schugurensky Arizona State University
Marco Antonio Delgado Fuentes Universidad Iberoamericana, México
Orlando Pulido Chaves Universidad Pedagógica Nacional, Colombia
Inés Dussel FLACSO, Argentina José Gregorio Rodríguez Universidad Nacional de Colombia
Rafael Feito Alonso Universidad Complutense de Madrid, España
Miriam Rodríguez Vargas Universidad Autónoma de Tamaulipas, México
Pedro Flores Crespo Universidad Iberoamericana, México
Mario Rueda Beltrán Instituto de Investigaciones sobre la Universidad y la Educación, UNAM México
Verónica García Martínez Universidad Juárez Autónoma de Tabasco, México
José Luis San Fabián Maroto Universidad de Oviedo, España
Francisco F. García Pérez Universidad de Sevilla, España
Yengny Marisol Silva Laya Universidad Iberoamericana, México
Edna Luna Serrano Universidad Autónoma de Baja California, México
Aida Terrón Bañuelos Universidad de Oviedo, España
Alma Maldonado Departamento de Investigaciones Educativas, Centro de Investigación y de Estudios Avanzados, México
Jurjo Torres Santomé Universidad de la Coruña, España
Alejandro Márquez Jiménez Instituto de Investigaciones sobre la Universidad y la Educación, UNAM México
Antoni Verger Planells University of Amsterdam, Holanda
José Felipe Martínez Fernández University of California Los Angeles, USA
Mario Yapu Universidad Para la Investigación Estratégica, Bolivia

Education Policy Analysis Archives Vol. 21 No. 83 24
arquivos analíticos de políticas educativas conselho editorial
Editor: Gustavo E. Fischman (Arizona State University) Editores Associados: Rosa Maria Bueno Fisher e Luis A. Gandin
(Universidade Federal do Rio Grande do Sul) Dalila Andrade de Oliveira Universidade Federal de
Minas Gerais, Brasil Jefferson Mainardes Universidade Estadual de Ponta
Grossa, Brasil Paulo Carrano Universidade Federal Fluminense, Brasil Luciano Mendes de Faria Filho Universidade Federal
de Minas Gerais, Brasil Alicia Maria Catalano de Bonamino Pontificia
Universidade Católica-Rio, Brasil Lia Raquel Moreira Oliveira Universidade do Minho,
Portugal Fabiana de Amorim Marcello Universidade Luterana
do Brasil, Canoas, Brasil Belmira Oliveira Bueno Universidade de São Paulo,
Brasil Alexandre Fernandez Vaz Universidade Federal de
Santa Catarina, Brasil António Teodoro Universidade Lusófona, Portugal
Gaudêncio Frigotto Universidade do Estado do Rio de Janeiro, Brasil
Pia L. Wong California State University Sacramento, U.S.A
Alfredo M Gomes Universidade Federal de Pernambuco, Brasil
Sandra Regina Sales Universidade Federal Rural do Rio de Janeiro, Brasil
Petronilha Beatriz Gonçalves e Silva Universidade Federal de São Carlos, Brasil
Elba Siqueira Sá Barreto Fundação Carlos Chagas, Brasil
Nadja Herman Pontificia Universidade Católica –Rio Grande do Sul, Brasil
Manuela Terrasêca Universidade do Porto, Portugal
José Machado Pais Instituto de Ciências Sociais da Universidade de Lisboa, Portugal
Robert Verhine Universidade Federal da Bahia, Brasil
Wenceslao Machado de Oliveira Jr. Universidade Estadual de Campinas, Brasil
Antônio A. S. Zuin Universidade Federal de São Carlos, Brasil