Op Access Estimationlofkdailylintakelofklycopene,l ...
11
Park et al. Appl Biol Chem (2020) 63:50 https://doi.org/10.1186/s13765-020-00534-w ARTICLE Estimation of daily intake of lycopene, antioxidant contents and activities from tomatoes, watermelons, and their processed products in Korea Hyunjeong Park 1 , Young‑Jun Kim 2* and Youngjae Shin 1* Abstract Tomatoes, watermelons, and processed tomato products contain abundant antioxidant compounds, including lyco‑ pene. In spite of the interest in the role of lycopene, little is known about the contribution of tomatoes and tomato products commonly consumed in Korea to the intake of lycopene. In this study, the daily per capita intake values of lycopene and antioxidant compounds and activities of tomatoes, watermelons, and their processed products in Korea were estimated. The daily per capita intake values of lycopene from raw tomatoes, watermelons, tomato ketchup, and tomato juice were measured to be 1.07, 0.54, 0.26, and 0.08 mg/capita/day, respectively. The average lycopene intake of male and female were 1.98 and 1.92 mg/capita/day, respectively. The daily per capita intake value of total phenolics was highest in raw tomatoes (7.21 mg/capita/day), followed by watermelons (1.72 mg/capita/day), tomato ketchup (1.41 mg/capita/day), and tomato juice (0.80 mg/capita/day). The daily per capita intake value of total antioxidant activities also showed a similar pattern to total phenolic results. The overall daily per capita intake of antioxidant content and activities was affected by both the daily per capita intake of each product and the levels of antioxidant content and activities of each product. The daily per capita intake of these products in Korea is currently considerably low, compared to the U.S. and Europe. Thus, an adequate consumption of lycopene‑rich products is recommended. Keywords: Antioxidant, Daily intake per capita, Lycopene, Tomato, Watermelon © The Author(s) 2020. This article is licensed under a Creative Commons Attribution 4.0 International License, which permits use, sharing, adaptation, distribution and reproduction in any medium or format, as long as you give appropriate credit to the original author(s) and the source, provide a link to the Creative Commons licence, and indicate if changes were made. The images or other third party material in this article are included in the article’s Creative Commons licence, unless indicated otherwise in a credit line to the material. If material is not included in the article’s Creative Commons licence and your intended use is not permitted by statutory regulation or exceeds the permitted use, you will need to obtain permission directly from the copyright holder. To view a copy of this licence, visit http://creativeco mmons.org/licenses/by/4.0/. Introduction As nutrition improved at the national level, the problems related to nutrient deficiency decreased; however, the western dietary pattern has caused nutritional imbal- ance to emerge, along with various chronic diseases, such as hypertension, cancer, and diabetes [1]. Accord- ing to the 2018 report of the World Health Organiza- tion (WHO), cancer is the cause of death for one in six individuals worldwide, with one of the five factors of carcinogenesis being low intake of fruits and vegetables [2]. Further, numerous epidemiological investigations have proved the effects of fruits and vegetables on pre- venting chronic diseases [3, 4]. Tomato (Solanum lycopersicum L.) is an annual or perennial plant of the Solanaceae family. It is one of the widely consumed vegetables that is available both raw and in the form of various types of processed prod- ucts, such as ketchup, juice, and sauce [5, 6]. Korean tomato production increased from 276,663 tons in 2000 to 374,677 tons in 2017, indicating an annual positive increase rate [7]. Tomato is a vegetable that is rich in lycopene and accounts for 80% of the carotenoids in ripe tomatoes [4, 6]. Watermelons, apricots, and guavas also contain lycopene. However, more than 85% of our dietary Open Access *Correspondence: [email protected]; [email protected] 1 Department of Food Engineering, Dankook University, Cheonan, Chungnam 31116, Republic of Korea 2 Department of Food Science and Technology, Seoul National University of Science and Technology, Seoul 01811, Republic of Korea
Transcript of Op Access Estimationlofkdailylintakelofklycopene,l ...

Park et al. Appl Biol Chem (2020) 63:50 https://doi.org/10.1186/s13765-020-00534-w
ARTICLE
Estimation of daily intake of lycopene, antioxidant contents and activities from tomatoes, watermelons, and their processed products in KoreaHyunjeong Park1, Young‑Jun Kim2* and Youngjae Shin1*
Abstract
Tomatoes, watermelons, and processed tomato products contain abundant antioxidant compounds, including lyco‑pene. In spite of the interest in the role of lycopene, little is known about the contribution of tomatoes and tomato products commonly consumed in Korea to the intake of lycopene. In this study, the daily per capita intake values of lycopene and antioxidant compounds and activities of tomatoes, watermelons, and their processed products in Korea were estimated. The daily per capita intake values of lycopene from raw tomatoes, watermelons, tomato ketchup, and tomato juice were measured to be 1.07, 0.54, 0.26, and 0.08 mg/capita/day, respectively. The average lycopene intake of male and female were 1.98 and 1.92 mg/capita/day, respectively. The daily per capita intake value of total phenolics was highest in raw tomatoes (7.21 mg/capita/day), followed by watermelons (1.72 mg/capita/day), tomato ketchup (1.41 mg/capita/day), and tomato juice (0.80 mg/capita/day). The daily per capita intake value of total antioxidant activities also showed a similar pattern to total phenolic results. The overall daily per capita intake of antioxidant content and activities was affected by both the daily per capita intake of each product and the levels of antioxidant content and activities of each product. The daily per capita intake of these products in Korea is currently considerably low, compared to the U.S. and Europe. Thus, an adequate consumption of lycopene‑rich products is recommended.
Keywords: Antioxidant, Daily intake per capita, Lycopene, Tomato, Watermelon
© The Author(s) 2020. This article is licensed under a Creative Commons Attribution 4.0 International License, which permits use, sharing, adaptation, distribution and reproduction in any medium or format, as long as you give appropriate credit to the original author(s) and the source, provide a link to the Creative Commons licence, and indicate if changes were made. The images or other third party material in this article are included in the article’s Creative Commons licence, unless indicated otherwise in a credit line to the material. If material is not included in the article’s Creative Commons licence and your intended use is not permitted by statutory regulation or exceeds the permitted use, you will need to obtain permission directly from the copyright holder. To view a copy of this licence, visit http://creat iveco mmons .org/licen ses/by/4.0/.
IntroductionAs nutrition improved at the national level, the problems related to nutrient deficiency decreased; however, the western dietary pattern has caused nutritional imbal-ance to emerge, along with various chronic diseases, such as hypertension, cancer, and diabetes [1]. Accord-ing to the 2018 report of the World Health Organiza-tion (WHO), cancer is the cause of death for one in six individuals worldwide, with one of the five factors of
carcinogenesis being low intake of fruits and vegetables [2]. Further, numerous epidemiological investigations have proved the effects of fruits and vegetables on pre-venting chronic diseases [3, 4].
Tomato (Solanum lycopersicum L.) is an annual or perennial plant of the Solanaceae family. It is one of the widely consumed vegetables that is available both raw and in the form of various types of processed prod-ucts, such as ketchup, juice, and sauce [5, 6]. Korean tomato production increased from 276,663 tons in 2000 to 374,677 tons in 2017, indicating an annual positive increase rate [7]. Tomato is a vegetable that is rich in lycopene and accounts for 80% of the carotenoids in ripe tomatoes [4, 6]. Watermelons, apricots, and guavas also contain lycopene. However, more than 85% of our dietary
Open Access
*Correspondence: [email protected]; [email protected] Department of Food Engineering, Dankook University, Cheonan, Chungnam 31116, Republic of Korea2 Department of Food Science and Technology, Seoul National University of Science and Technology, Seoul 01811, Republic of Korea

Page 2 of 11Park et al. Appl Biol Chem (2020) 63:50
lycopene comes from tomato fruit and tomato-based products [8, 9]. The lycopene in tomatoes showed a steep increase during the maturation process [10].
Watermelon (Citrullus vulgaris) is a representative summer fruit and a dicotyledoneae that belongs to the Cucurbitaceae family of the order Cucurbitales. The cur-rent major watermelon producers are the U.S., Turkey, South Korea, and China [11]. In South Korea, water-melon production in 2017 was approximately 295,422 tons [7]. Lycopene accounts for approximately 70–90% of carotenoids in mesocarp cell chromoplasts of watermel-ons [12]. The lycopene in watermelons is responsible for the red pulp, and it acts as the main phytochemical com-pound that effectively reduces oxidative stress [13].
Lycopene is one of the 600 or more carotenoids that are found in nature. In the past, the correlation between carotenoids and human health was limited to compounds such as, α-carotene and β-carotene, which contain the pro-vitamin A form. However, other carotenoids have known as key phytochemical compounds, and lycopene was especially found to cause the most prominent effect on human health [14]. Lycopene is a natural fat-soluble pigment that is synthesized by plants and microorgan-isms, but not by animals. Structurally, it is an acyclic carotenoid with a long sequence of 11 conjugated double bonds in all-trans forms, and approximately 72 geometri-cal isomers have been reported to exist [15]. In addition, unlike other carotenoids, the β-ionone ring structure is absent in lycopene, and thus pro-vitamin A activity is known to be low [11, 14].
As of recent, no studies have estimated the Korean daily per capita intake of antioxidant compounds and activities, such as those of lycopene, that are present in tomatoes, watermelons, and their processed products. Thus, the present study aimed to analyze the antioxidant compounds and activities with special emphasis on lyco-pene from tomatoes, watermelons, and their processed products. The study also estimated the daily per capita consumption of each food product using the food intake data of the Korea National Health and Nutrition Exami-nation Survey (KNHANES) that was conducted by the Korea Disease Control Division in 2017 [16]. Then, based on the findings, the daily per capita intake values of lyco-pene and antioxidant compounds and activities of toma-toes, watermelons, and their processed products in Korea were estimated.
Materials and methodsMaterialsThe samples were purchased from local fruit markets and hypermarkets in the city of Cheonan, South Korea. A total of 35 different types of samples were used, which include 4 types of common tomatoes, 4 types of cherry
tomatoes, 15 types of watermelons, 8 types of tomato ketchup, and 4 types of tomato juice. Each product was labeled with a number to not disclose the name of the manufacturer. Common tomatoes, cherry tomatoes, and watermelons were rapidly frozen with − 196 °C liquid nitrogen and stored in − 25 °C freezer for subse-quent extraction to analyze antioxidant compounds and activities. In addition, the samples of tomato ketchup and tomato juice were stored according to the condition that was indicated in the product label for subsequent analysis.
Extraction to measure antioxidant compounds and activitiesA total of 300 mL of 80% methanol was mixed with 30 g of samples of freeze-stored common tomatoes, cherry tomatoes, and watermelons. Afterwards, using a blender (JB 3060, Braun Co., Kronberg, Germany), homogeniza-tion was implemented for three minutes twice and for two minutes once. The supernatant was then filtered using Whatman # 2 filter paper and concentrated using a rotary evaporator (N-1000, Eyela, Tokyo, Japan). It was then stored at − 25 °C for subsequent measurements of lycopene content, antioxidant compounds, and activities.
Total flavonoid analysisThe total flavonoid content of samples was measured using the colorimetric assay method [17, 18]. Briefly, 0.3 mL of 5% NaNO2 was added to a mixture of deion-ized water and 1 mL aliquot of the diluted sample. After vortexing, the mixture rested at room temperature for 5 min. Next, 0.3 mL of 10% AlCl3 was added, and after vortexing, the mixture was placed at room temperature for 6 min. Finally, 2 mL of 1 N NaOH and 2.4 mL of dis-tilled water were added to adjust the volume to 10 mL. The absorbance was measured at 510 nm using a spec-trophotometer (Optizen POP, Mecasys, Daejeon, Korea), and the total flavonoid content was expressed as mg rutin equivalents (RE) kg/fresh weight (FW).
Total phenolic analysisThe total phenolic content of samples was measured using the Folin-Ciocalteu colorimetric assay method [17, 18]. After adding 0.2 mL of the Folin-Ciocalteu phenol reagent to 0.2 mL aliquot of the diluted sample that was mixed with deionized water, the mixture was vortexed and made to rest at room temperature for 6 min. Next, 2 mL of 7% NaCO3 were added, and the mixture was vor-texed, and placed at room temperature in a dark place for 90 min. The absorbance was measured at 750 nm using a spectrophotometer, and the total phenolic content was expressed as mg gallic acid equivalents (GAE)/kg FW.
Page 3 of 11Park et al. Appl Biol Chem (2020) 63:50
Lycopene analysisThe lycopene content of the samples was measured according to Bicanic’s method with some modifications [19, 20]. For each 1.0 g of samples, a small amount of deionized water and methanol was added, and the mix-ture was vortexed after placing Celite powder (No. 545). A glass filter (3G3) was inserted to a glass vessel, and then using an aspirator (AAA71015, Jeio Tech Co. Ltd., Daejeon, Korea), aspiration-filtration was implemented while methanol was simultaneously added until the yellow color of the sample solution turned a transpar-ent color. Next, the glass filter was moved and fixed to another glass vessel, and then aspiration-filtration was implemented while benzene was added until the color of the filtrate turned transparent. The filtrate was then transferred to a 100 mL flask, and benzene was used as the sample solution after adjusting to a constant volume. The absorbance was measured at 487 nm using a spectro-photometer, and the lycopene content was expressed as mg/kg FW.
DPPH radical scavenging activity analysisThe DPPH radical scavenging activity was measured using a modified method by Shin [18] and Brand-Wil-liams et al. [21]. Briefly, 2.95 mL of DPPH solution were added to a mixture of 50 µL of the sample and deionized water. Then, the homogenized mixture sat and reacted at room temperature in a dark place for 30 min. The absorb-ance was measured at 517 nm using a spectrophotome-ter, and the measured DPPH radical scavenging activity was expressed as mg vitamin C equivalents (VCE)/kg FW.
ABTS radical scavenging activity analysisThe ABTS radical scavenging activity of the extracted samples was measured using a modified method by Floegel et al. [22] and Re et al. [23]. Briefly, 980 µL of ABTS solution were added to a mixture of 20 µL sam-ple and deionized water. The homogenized mixture was then allowed to react at 37 °C for 10 min. The absorbance was measured at 734 nm using a spectrophotometer, and the measured ABTS radical scavenging activity was expressed as mg VCE/kg FW.
Daily intake of tomatoes, watermelons, and their processed productsThe daily intake values of tomatoes, watermelons, and their processed products were estimated using the Korea National Health and Nutrition Examination Sur-vey (KNHANES VII-2) that was conducted by the Korea Center for Disease Control and Prevention in 2017 [16]. The KNHANES consisted of a health survey, an
examination survey, and a nutrition survey. The nutrition survey was conducted by visiting the target households, while the survey consisted of a dietary life survey, a food safety survey, a food intake frequency investigation, and a food intake investigation. The food intake investiga-tion examined all foods that were ingested by the subject during the previous day. The investigation was based on individual interviews, using the 24 h recall method. The investigation object of the 2017 KNHANES VII-2 that was used in this study recruited 10,430 subjects, among who 8,127 participated in at least one of the following three surveys: the health survey, examination survey, and nutrition survey, with an overall 77.9% participation rate and an 80% rate for the nutrition survey.
Estimation of daily per capita intake of antioxidant compounds and activitiesTo estimate the daily per capita intake of lycopene and the antioxidant compounds and activities of tomatoes, watermelons, and their processed products, the results of the KNHANES and chemical analysis of the measured contents were used. The calculations were based on the following equations:
Daily per capita intake of total flavonoids (mg RE/person/day) =
∑CiFi
Ci indicates the daily per capita intake of tomatoes, watermelons, and their processed products based on raw data; Fi indicates the total flavonoid content of tomatoes, watermelons, and their processed products.
Daily per capita intake of total phenolics (mg GAE/person/day) =
∑CiPi
Ci indicates the daily per capita intake of tomatoes, watermelons, and their processed products based on raw data; Pi indicates the total phenolic content of tomatoes, watermelons, and their processed products.
Daily per capita intake of lycopene (mg/person/day) =
∑CiLi
Ci indicates the daily per capita intake of tomatoes, watermelons, and their processed products based on raw data; Li indicates the lycopene content of tomatoes, watermelons, and their processed products.
Daily per capita intake regarding DPPH radical scav-enging activity (mg VCE/person/day) =
∑CiDi
Ci indicates the daily per capita intake of tomatoes, watermelons, and their processed products based on raw data; Di indicates the level of DPPH radical scavenging activity of tomatoes, watermelons, and their processed products.
Daily per capita intake regarding ABTS radical scav-enging activity (mg VCE/person/day) =
∑CiAi
Ci indicates the daily per capita intake of tomatoes, watermelons, and their processed products based on raw data; Ai indicates the level of ABTS radical scavenging

Page 4 of 11Park et al. Appl Biol Chem (2020) 63:50
activity of tomatoes, watermelons, and their processed products.
Statistical analysisFor statistical analysis, the SPSS 20 program (SPSS Inc., Chicago, IL, USA) was used. For each test group, a one-way analysis of variance (ANOVA) was implemented, and Duncan’s multiple range test was used for the signifi-cance of each average value (p < 0.05).
Results and discussionTotal flavonoid contentThe total flavonoid content of tomatoes, watermelons, and their processed products, is as presented in Table 1. The total flavonoid content of tomatoes was measured to be between 172.86 and 556.19 mg RE/kg FW, while that of watermelons was between 89.52 and 268.57 mg RE/kg FW. For tomato ketchup and tomato juice, the range was between 1,570.00 and 2,784.29 mg RE/kg FW, and between 446.67 and 956.67 mg RE/kg FW, respectively.
Compared to common tomatoes, the total flavonoid content of cherry tomatoes showed higher levels with significant differences. According to the study by Hall-mann [24] on the bioactive compounds in different types of tomatoes, the total flavonoid content of cherry toma-toes was 98.54 ± 8.22 mg/100 g in dry weight (DW), while that of common tomatoes was 59.20 ± 7.65 mg/100 g in DW, which agrees with the results of this study. In addi-tion, processed tomato products (ketchup and juice) showed 2–16 times higher flavonoid content compared to raw tomatoes. This is because naringenin, which is a flavanone that is most abundant in tomatoes, increases during such processes as part of heat treatment [25]. Likewise, apple juice has been reported to show approxi-mately a 50% increase in the flavonoid content following heat treatment at 40–70 ℃ [26]. In addition, according to a study by Tlili et al. [12], antioxidant compounds and activities varies based the maturity of watermelons, and the total flavonoid content of red-ripe watermelons was 193.1 ± 4.8 mg RE/kg FW, which is consistent with this study. Not only in the case of watermelons, but also for raw tomatoes and processed tomato products, differ-ences in total flavonoid content were shown according to the cultivar, country of origin, and manufacturer. This may be caused by the fact that each sample and product raw material differ in terms of the cultivar, country of ori-gin, harvest period, and processing [27, 28].
Total phenolic contentThe total phenolic content of the products is as pre-sented in Table 1. The total phenolic content of tomatoes was measured between 267.18 and 775.04 mg GAE/kg FW, while that of watermelons was between 133.75 and
176.83 mg GAE/kg FW. For tomato ketchup and tomato juice, the range was between 800.00 and 1,200.00 mg GAE/kg FW, and between 293.25 and 472.75 mg GAE/kg FW, respectively.
Tomato ketchup, compared to raw tomatoes, showed approximately 2.2 times higher mean content. Accord-ing to a study by Gahler et al. [29] as the time of heat treatment increased during the sterilization processing of tomatoes, the total phenolic content increased. Thus, in the case of tomato ketchup, various processing steps, such as heat treatment, have been found to increase the total phenolic content higher than in the case of raw tomatoes. In the case of tomato juice, on the other hand, the content was shown to be lower than that of raw toma-toes. This pattern is believed to be due to the peeling pro-cess during the production of tomato juice, whereby the abundant phenolic compounds, such as rutin, rutin apio-side, naringenin, and naringenin chalcone in the peel, are reduced [25]. However, according to Klopotek et al. [30], antioxidant compounds and activities of processed straw-berry products were lower than those of raw strawber-ries, as based on the processing. Notably, in the case of strawberry juice after the low-temperature sterilization processing step, the total phenolic content was shown to be 27% lower than that of raw strawberries. This may be due to the loss of the anthocyanin component in straw-berries by the heat that is provided during the steriliza-tion processing step, which lowered the total phenolic content. In addition, according to Nagal et al. [31], the total phenolic content of watermelons was measured to be between 13.05 and 18.08 mg GAE/100 g FW, which is in accord with the results of this study.
Lycopene contentThe lycopene content of the products is presented in Table 1. The lycopene content of tomatoes was meas-ured to be between 40.19 and 108.06 mg/kg FW, while that of watermelons was between 24.23 and 69.12 mg/kg FW. For tomato ketchup, the range was 116.59 and 254.98 mg/kg FW; for tomato juice, the range was 9.90 and 54.21 mg/kg FW.
According to Martinez-Valverde et al. [32], the lyco-pene content of various tomato cultivars in Spain was 18.60–64.98 mg/kg FW, which is a range that is lower than in this study. In contrast, the lycopene content of tomatoes in Croatia was 1.82–11.19 mg/100 g FW, which is consistent with this study [33]. This may be due to the differences in the cultivar, maturity, and cultivation conditions with influence on the lycopene content of tomatoes. Moreover, for tomato ketchup, the products across different brands showed signifi-cant differences. This is believed to be due to the differ-ences in the content of tomato paste in each product,
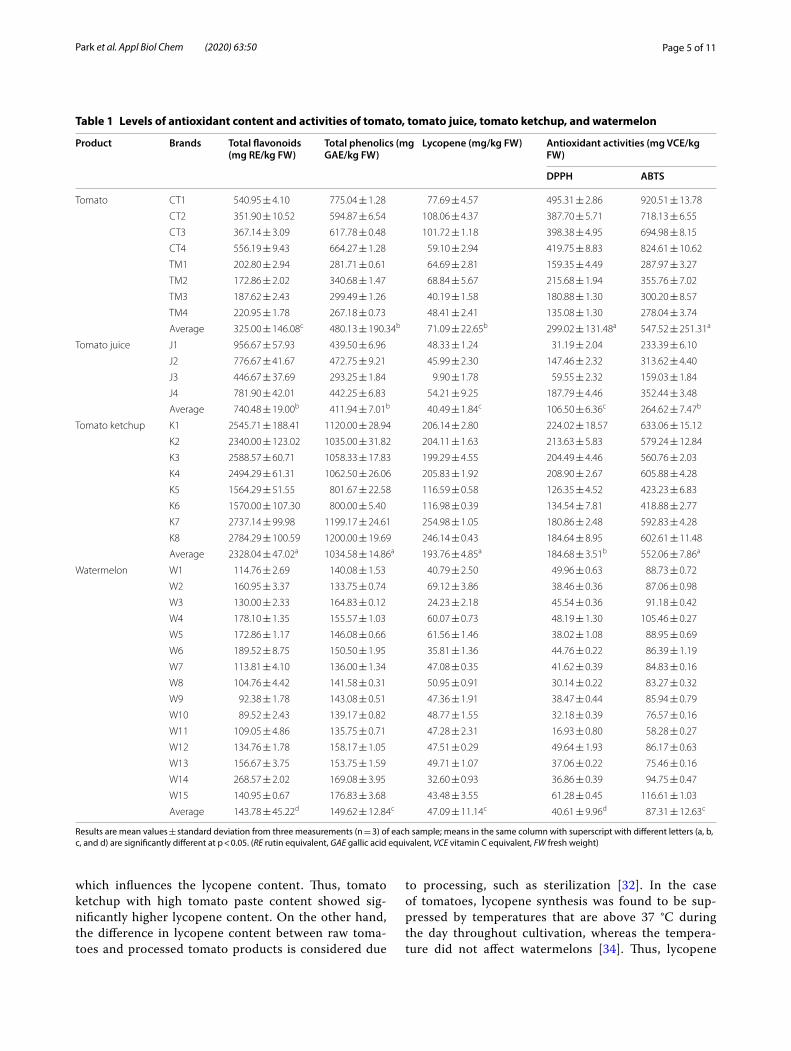
Page 5 of 11Park et al. Appl Biol Chem (2020) 63:50
which influences the lycopene content. Thus, tomato ketchup with high tomato paste content showed sig-nificantly higher lycopene content. On the other hand, the difference in lycopene content between raw toma-toes and processed tomato products is considered due
to processing, such as sterilization [32]. In the case of tomatoes, lycopene synthesis was found to be sup-pressed by temperatures that are above 37 °C during the day throughout cultivation, whereas the tempera-ture did not affect watermelons [34]. Thus, lycopene
Table 1 Levels of antioxidant content and activities of tomato, tomato juice, tomato ketchup, and watermelon
Results are mean values ± standard deviation from three measurements (n = 3) of each sample; means in the same column with superscript with different letters (a, b, c, and d) are significantly different at p < 0.05. (RE rutin equivalent, GAE gallic acid equivalent, VCE vitamin C equivalent, FW fresh weight)
Product Brands Total flavonoids (mg RE/kg FW)
Total phenolics (mg GAE/kg FW)
Lycopene (mg/kg FW) Antioxidant activities (mg VCE/kg FW)
DPPH ABTS
Tomato CT1 540.95 ± 4.10 775.04 ± 1.28 77.69 ± 4.57 495.31 ± 2.86 920.51 ± 13.78
CT2 351.90 ± 10.52 594.87 ± 6.54 108.06 ± 4.37 387.70 ± 5.71 718.13 ± 6.55
CT3 367.14 ± 3.09 617.78 ± 0.48 101.72 ± 1.18 398.38 ± 4.95 694.98 ± 8.15
CT4 556.19 ± 9.43 664.27 ± 1.28 59.10 ± 2.94 419.75 ± 8.83 824.61 ± 10.62
TM1 202.80 ± 2.94 281.71 ± 0.61 64.69 ± 2.81 159.35 ± 4.49 287.97 ± 3.27
TM2 172.86 ± 2.02 340.68 ± 1.47 68.84 ± 5.67 215.68 ± 1.94 355.76 ± 7.02
TM3 187.62 ± 2.43 299.49 ± 1.26 40.19 ± 1.58 180.88 ± 1.30 300.20 ± 8.57
TM4 220.95 ± 1.78 267.18 ± 0.73 48.41 ± 2.41 135.08 ± 1.30 278.04 ± 3.74
Average 325.00 ± 146.08c 480.13 ± 190.34b 71.09 ± 22.65b 299.02 ± 131.48a 547.52 ± 251.31a
Tomato juice J1 956.67 ± 57.93 439.50 ± 6.96 48.33 ± 1.24 31.19 ± 2.04 233.39 ± 6.10
J2 776.67 ± 41.67 472.75 ± 9.21 45.99 ± 2.30 147.46 ± 2.32 313.62 ± 4.40
J3 446.67 ± 37.69 293.25 ± 1.84 9.90 ± 1.78 59.55 ± 2.32 159.03 ± 1.84
J4 781.90 ± 42.01 442.25 ± 6.83 54.21 ± 9.25 187.79 ± 4.46 352.44 ± 3.48
Average 740.48 ± 19.00b 411.94 ± 7.01b 40.49 ± 1.84c 106.50 ± 6.36c 264.62 ± 7.47b
Tomato ketchup K1 2545.71 ± 188.41 1120.00 ± 28.94 206.14 ± 2.80 224.02 ± 18.57 633.06 ± 15.12
K2 2340.00 ± 123.02 1035.00 ± 31.82 204.11 ± 1.63 213.63 ± 5.83 579.24 ± 12.84
K3 2588.57 ± 60.71 1058.33 ± 17.83 199.29 ± 4.55 204.49 ± 4.46 560.76 ± 2.03
K4 2494.29 ± 61.31 1062.50 ± 26.06 205.83 ± 1.92 208.90 ± 2.67 605.88 ± 4.28
K5 1564.29 ± 51.55 801.67 ± 22.58 116.59 ± 0.58 126.35 ± 4.52 423.23 ± 6.83
K6 1570.00 ± 107.30 800.00 ± 5.40 116.98 ± 0.39 134.54 ± 7.81 418.88 ± 2.77
K7 2737.14 ± 99.98 1199.17 ± 24.61 254.98 ± 1.05 180.86 ± 2.48 592.83 ± 4.28
K8 2784.29 ± 100.59 1200.00 ± 19.69 246.14 ± 0.43 184.64 ± 8.95 602.61 ± 11.48
Average 2328.04 ± 47.02a 1034.58 ± 14.86a 193.76 ± 4.85a 184.68 ± 3.51b 552.06 ± 7.86a
Watermelon W1 114.76 ± 2.69 140.08 ± 1.53 40.79 ± 2.50 49.96 ± 0.63 88.73 ± 0.72
W2 160.95 ± 3.37 133.75 ± 0.74 69.12 ± 3.86 38.46 ± 0.36 87.06 ± 0.98
W3 130.00 ± 2.33 164.83 ± 0.12 24.23 ± 2.18 45.54 ± 0.36 91.18 ± 0.42
W4 178.10 ± 1.35 155.57 ± 1.03 60.07 ± 0.73 48.19 ± 1.30 105.46 ± 0.27
W5 172.86 ± 1.17 146.08 ± 0.66 61.56 ± 1.46 38.02 ± 1.08 88.95 ± 0.69
W6 189.52 ± 8.75 150.50 ± 1.95 35.81 ± 1.36 44.76 ± 0.22 86.39 ± 1.19
W7 113.81 ± 4.10 136.00 ± 1.34 47.08 ± 0.35 41.62 ± 0.39 84.83 ± 0.16
W8 104.76 ± 4.42 141.58 ± 0.31 50.95 ± 0.91 30.14 ± 0.22 83.27 ± 0.32
W9 92.38 ± 1.78 143.08 ± 0.51 47.36 ± 1.91 38.47 ± 0.44 85.94 ± 0.79
W10 89.52 ± 2.43 139.17 ± 0.82 48.77 ± 1.55 32.18 ± 0.39 76.57 ± 0.16
W11 109.05 ± 4.86 135.75 ± 0.71 47.28 ± 2.31 16.93 ± 0.80 58.28 ± 0.27
W12 134.76 ± 1.78 158.17 ± 1.05 47.51 ± 0.29 49.64 ± 1.93 86.17 ± 0.63
W13 156.67 ± 3.75 153.75 ± 1.59 49.71 ± 1.07 37.06 ± 0.22 75.46 ± 0.16
W14 268.57 ± 2.02 169.08 ± 3.95 32.60 ± 0.93 36.86 ± 0.39 94.75 ± 0.47
W15 140.95 ± 0.67 176.83 ± 3.68 43.48 ± 3.55 61.28 ± 0.45 116.61 ± 1.03
Average 143.78 ± 45.22d 149.62 ± 12.84c 47.09 ± 11.14c 40.61 ± 9.96d 87.31 ± 12.63c

Page 6 of 11Park et al. Appl Biol Chem (2020) 63:50
content in watermelons has been found to be influ-enced by maturity, soil fertility, and light intensity.
DPPH radical scavenging activityThe DPPH radical scavenging activity values of the prod-ucts are presented in Table 1. The DPPH radical scav-enging activity of tomatoes was measured be within the range of 135.08 and 495.31 mg VCE/kg FW, while that of watermelons was measured to be within the range of 16.93 and 61.28 mg VCE/kg FW. For tomato ketchup, the range was 126.35 and 224.02 mg VCE/kg FW; for tomato juice, the range was 31.19 and 187.79 mg VCE/kg FW. According to Floegel et al. [22], the DPPH radical scavenging activity values of raw tomatoes and tomato juice were 44.2 and 62.6 mg VCE/100 g, respectively. The results of the present study indicate a similar trend for raw tomatoes, whereas a relatively lower level of content was demonstrated by tomato juice. This may be due to differences in tomato paste content in tomato juice, prod-uct processing methods, and tomato cultivars.
ABTS radical scavenging activityThe ABTS radical scavenging activity values of the prod-ucts are presented in Table 1. The ABTS radical scaveng-ing activity of tomatoes were found to be within the range of 278.04 and 920.51 mg VCE/kg FW, while that of water-melons was relatively low and within the range of 58.28 and 116.61 mg VCE/kg FW. For tomato ketchup, the range was 418.88 and 633.06 mg VCE/kg FW; for tomato juice, the range was 159.03 and 352.44 mg VCE/kg FW. Floegel et al. [22] found that the ABTS radical scavenging
activity of tomato ketchup was 48.1 ± 1.2 mg VCE/100 g FW, while Chun et al. [35] reported the ABTS radical scavenging activity of tomatoes to be 29.44 ± 1.60 mg VCE/100 g FW, which all implicate a similar trend to that of this study.
Daily intake of tomatoes, watermelons, and their processed productsTable 2 presents the data that were obtained from ana-lyzing the 2017 KNHANES VII-2 data regarding the daily per capita intake of the products in Korea [16]. The daily per capita intake of the products, according to gender and age, are presented in Table 3. Analyzing the intake according to gender showed that the daily per capita intake was higher in males than in females in terms of total consumption of watermelons, tomato ketchup, and juice, but not raw tomatoes. The intake of raw toma-toes in women according to age showed a decrease in the order of age: 50 ~ 64 > 30 ~ 49 > 65 or above > 19 ~ 29 > 3 ~ 5 > 6 ~ 11 > 12 ~ 18 > 1 ~ 2. In addition, analyzing the intake according to age showed that the intake of raw tomatoes in male and female who were aged 30 or above was approximately 60.35% and 64.39% from total consumption, respectively. The intake of raw tomatoes was relatively lower in male and female who were aged below 30. In contrast, for tomato ketchup, the intake in males and females who were aged below 30 was approxi-mately 81.82% and 78.79%, respectively. Hence, the group of those who are aged ≥ 30 has been determined to have preference for raw tomatoes over tomato ketchup or juice. According to a study on the daily intake of tomatoes
Table 2 Daily per capita consumption (g/capita/day) from tomato, processed tomato product, and watermelon according to gender and age on the basis of the analysis of the existing dataset in the Korea Health and Nutrition Examination Survey 2017
Various commercial lycopene-rich products in the Korean diet were selected from the existing dataset of the 2017 Korea National Health and Nutrition Examination Survey (KNHANES). n/a data not available
Gender Product Age (yr) Average
1 ~ 2 3 ~ 5 6 ~ 11 12 ~ 18 19 ~ 29 30 ~ 49 50 ~ 64 ≥ 65
Male Tomato 4.67 5.46 7.77 4.88 11.21 14.84 18.27 18.63 13.88
Tomato juice 3.48 n/a 0.74 2.39 1.55 3.53 n/a 2.12 2.30
Tomato ketchup 0.36 1.05 3.09 3.51 3.33 1.78 0.58 0.16 1.72
Watermelon 4.95 5.26 11.24 11.78 6.38 16.79 10.42 12.36 12.01
Female Tomato 0.80 8.75 7.09 6.28 9.71 18.27 23.52 17.20 16.15
Tomato juice n/a n/a 1.85 n/a n/a 1.72 3.12 n/a 1.57
Tomato ketchup 0.47 0.34 2.04 2.45 1.35 1.20 0.44 0.15 1.00
Watermelon 13.02 8.79 8.89 11.75 4.51 13.32 14.77 7.24 11.00
Average Tomato 2.86 7.04 7.44 5.55 10.50 16.51 20.90 17.80 15.01
Tomato juice 1.85 n/a 0.94 1.25 2.65 2.65 2.41 n/a 1.94
Tomato ketchup 0.41 0.95 2.58 3.01 2.40 1.50 0.51 0.15 1.36
Watermelon 8.73 6.95 10.09 11.77 5.50 15.10 12.60 9.41 11.51

Page 7 of 11Park et al. Appl Biol Chem (2020) 63:50
and tomato ketchup in Greece, the intake was 112.5 and 0.25 g/day, respectively. The daily per capita intake of raw tomatoes was higher than that of processed tomato prod-ucts, which is similar to out result [36].
Estimation of daily per capita intake of antioxidant compoundsThe estimation of the daily per capita intake of antioxi-dant compounds from the products (Table 3), was based on the daily per capita consumption of the products, as calculated using the 2017 KNHANES VII-2 data [16] (Table 2), and the quantitative analysis results of antioxi-dant compounds in the products (Table 1).
The daily per capita intake values of total flavonoids from tomatoes, watermelons, tomato ketchup and juice were found to be 4.88 ± 2.19, 1.65 ± 0.52, 3.17 ± 0.62, and 1.44 ± 0.36 mg RE/capita/day, respectively (Table 3). For raw tomatoes, the total flavonoid content was lower than that of tomato ketchup (Table 1); however, the daily per capita intake of total flavonoids was significantly higher (Table 3). This was found to be due to the markedly higher daily intake of raw tomatoes than that of tomato ketchup with its contribution to the relatively high daily per capita total flavonoid content. In addition, for tomato ketchup, the daily per capita intake of total flavonoids based on gender was 4.00 and 2.33 mg RE/capita/day in males and females, respectively (Table 3). Although the total flavonoid content of each product was the same, the
difference in the intake resulted in the gender differences. Based on the results, the daily per capita total flavonoid intake is likely to be largely influenced by the daily per capita intake, rather than the antioxidant content of each product.
The daily per capita intake values of total phenolics from the products were found to be the highest for raw tomatoes (7.21 ± 2.86 mg GAE/capita/day) (Table 3). According to Chun et al. [35], the daily per capita total phenolic intake based on the intake of tomatoes was 24.4 mg GAE/capita/day. The total phenolic intake in the U.S. is approximately 3.38 times higher than the results of this study, which suggests that the daily per capita intake of antioxidant compounds is influenced by daily intake.
Estimation of daily per capita intake of lycopeneThe estimated daily intakes of lycopene from the Korean diet according to gender and age are presented in Fig. 1. The daily intake value of lycopene for male and female from the Korean diet was in the order of tomato > water-melon > tomato ketchup > tomato juice (Table 4). Addi-tionally, Table 4 indicates that males and females between the ages of 1–11 consumed high levels of lycopene. It is assumed that this is due to their relatively low body weight compared to the lycopene intake of 1–11 chil-dren. Consequently, the average estimated daily intake of lycopene is 0.03 mg/kg body weight/day for males and females. There was an increasing trend by age, with the
Table 3 Estimated daily intake of antioxidant contents and activities from tomato, tomato processed product, and watermelon in the Korean diet according to gender
Results are mean values ± standard deviation from three measurements (n = 3) of each sample; means in the same column with superscript with different letters (a, b, c, and d) are significantly different at p < 0.05. (RE rutin equivalent, GAE gallic acid equivalent, VCE vitamin C equivalent)
Gender Brands Total flavonoids (mg RE/capita/day)
Total phenolics (mg GAE/capita/day)
Lycopene (mg/capita/day)
Antioxidant capacities (mg VCE/capita/day)
DPPH ABTS
Male Tomato 4.51 ± 2.03a 6.67 ± 2.64a 0.99 ± 0.31a 4.15 ± 1.82a 7.60 ± 3.49a
Tomato juice 1.71 ± 0.42b 0.95 ± 0.16b 0.09 ± 0.04d 0.25 ± 0.15b 0.61 ± 0.17b
Tomato ketchup 4.00 ± 0.79a 1.78 ± 0.25b 0.33 ± 0.08c 0.32 ± 0.06b 0.95 ± 0.13b
Watermelon 1.73 ± 0.54b 1.80 ± 0.15b 0.57 ± 0.13b 0.49 ± 0.12b 1.05 ± 0.15b
Sum 11.95 11.19 1.98 5.20 10.21
Female Tomato 5.25 ± 2.36a 7.76 ± 3.08a 1.15 ± 0.36a 4.83 ± 2.12a 8.84 ± 4.06a
Tomato juice 1.16 ± 0.29b 0.65 ± 0.11b 0.07 ± 0.03c 0.28 ± 0.15b 0.42 ± 0.12b
Tomato ketchup 2.33 ± 0.46b 1.04 ± 0.15b 0.20 ± 0.05c 0.18 ± 0.03b 0.55 ± 0.08b
Watermelon 1.58 ± 0.50b 1.65 ± 0.14b 0.52 ± 0.12b 0.45 ± 0.11b 0.96 ± 0.14b
Sum 10.32 11.08 1.92 5.73 10.77
Average Tomato 4.88 ± 2.19a 7.21 ± 2.86a 1.07 ± 0.34a 4.49 ± 1.97a 8.22 ± 3.77a
Tomato juice 1.44 ± 0.36c 0.80 ± 0.14b 0.08 ± 0.03c 0.21 ± 0.12b 0.51 ± 0.14b
Tomato ketchup 3.17 ± 0.62b 1.41 ± 0.20b 0.26 ± 0.07c 0.25 ± 0.05b 0.75 ± 0.11b
Watermelon 1.65 ± 0.52c 1.72 ± 0.15b 0.54 ± 0.13b 0.47 ± 0.11b 1.00 ± 0.15b
Sum 11.14 11.14 1.95 5.41 10.49

Page 8 of 11Park et al. Appl Biol Chem (2020) 63:50
Fig. 1 Total estimated daily intakes of lycopene from tomato, tomato processed product, watermelon in the Korean diet according to gender and age (mg/capita/day)
Table 4 Estimated daily intake of lycopene from tomato, tomato processed product, and watermelon in the Korean diet according to gender and age (mg/capita/day)
bw body weight
Gender Age Estimated daily intake of lycopene by food stuff (mg/capita/day) Estimated total daily intake of lycopene (mg/kg bw/day)
Tomato Tomato juice Tomato ketchup
Watermelon
Males 1–2 0.33 0.14 0.07 0.23 0.06
3–5 0.39 0.00 0.20 0.25 0.05
6–11 0.55 0.03 0.60 0.53 0.05
12–18 0.35 0.09 0.68 0.55 0.03
19–29 0.80 0.06 0.65 0.30 0.02
30–49 1.05 0.14 0.34 0.79 0.03
50–64 1.30 0.00 0.11 0.49 0.03
≥ 65 1.32 0.08 0.03 0.58 0.03
Average 0.99 0.09 0.33 0.57 0.03
Females 1–2 0.06 0.00 0.09 0.61 0.06
3–5 0.62 0.00 0.07 0.41 0.06
6–11 0.50 0.07 0.40 0.42 0.04
12–18 0.45 0.00 0.47 0.55 0.03
19–29 0.69 0.00 0.26 0.21 0.02
30–49 1.30 0.07 0.23 0.63 0.04
50–64 1.67 0.12 0.09 0.70 0.04
≥ 65 1.22 0.00 0.03 0.34 0.03
Average 1.15 0.06 0.19 0.52 0.03

Page 9 of 11Park et al. Appl Biol Chem (2020) 63:50
highest intake of 2.33 mg/capita/day between the age of 30–49 years old for males, then the lycopene intake has decreased at the age of 50. In the same way, females also showed a similar tendency to males, with the high-est intake of 2.58 mg/capita/day between the age of 50–64 years old. After 65 years old, the tendency has dropped down. The average lycopene intake of male and female were 1.98 and 1.92 mg/capita/day, respectively (Fig. 1).
Table 5 shows estimated daily intake of lycopene in some countries from representative references [33, 37–46]. However, the comparison with these crude data should be considered carefully because the sam-ple size and methodology differ between studies. When
comparing the lycopene intake of the Korean popula-tion with that of populations in other countries, it was observed that the intake in Korean is still low comparing to USA (10.41 ~ 10.50 mg/capita/day), Canada (6.36 mg/capita/day), Netherland (4.86 mg/capita/day), France (4.75 mg/capita/day). The differences between countries may be related to various dietary habits, the quality of the food composition used and the variation of lycopene content within foods.
The average contributive composition percentage (%) of lycopene from the products according to males and females are presented in Fig. 2. Males consumed 50.01% lycopene from raw tomato followed by tomato juice, tomato ketchup, and watermelon. Females consumed 59.55% lycopene from raw tomato, which was higher than that of males. Overall, the total average composi-tion of lycopene was 54.70% from raw tomato followed by watermelon (27.81%), tomato ketchup (13.52%), and tomato juice (3.97%). The assessment of the data reveals that the dominant source of lycopene for intake by peo-ple is raw tomato.
Estimation of daily per capita intake of antioxidant activitiesThe daily per capita intake of antioxidant activities that was estimated based on the DPPH radical scavenging activity showed the following order: tomato > water-melon > tomato ketchup > tomato juice (Table 3). The ABTS radical scavenging activity result also reveals a similar trend. According to Chun et al. [35], the estimated daily per capita intake of antioxidant activities for tomato was 30.3 mg VCE/capita/day, which is approximately 3.7 times higher than the value obtained in this study. This is believed to be due to the difference in the daily per cap-ita tomato intake. In addition, the daily per capita intake values of antioxidant activities by ABTS method in males and females, regarding raw tomato intake, were 7.60 and
Table 5 Comparison of estimated daily intake of lycopene in some countries
Country Lycopene (mg/capita/day) Year References
The Netherlands 1.0 (male), 1.3 (female) 1998 [37]
Germany 1.28 1998 [38]
France 4.75 2001 [39]
Spain 1.64 2001 [39]
Republic of Ireland 4.43 2001 [39]
Netherlands 4.86 2001 [39]
UK 1.07 2001 [39]
USA 10.50 (male), 10.41 (female) 2001 [40]
Canada 6.36 2002 [41]
Hungary 2.99 (children), 4.26 (adults) 2003 [42]
Poland 1.93 2005 [43]
Australia 3.81 2005 [44]
Croatia 4.11 (school children),3.35 (university students)
2006 [33]
Belgium 1.49 (male), 1.17 (female) 2013 [45]
Lithuania 1.37 2015 [46]
Republic of Korea 1.98 (male), 1.92 (female) 2020 Current study
Fig. 2 The average contributive composition percentage (%) of lycopene from tomato, tomato processed product, watermelon in the Korean diet: Males, Females, and Average

Page 10 of 11Park et al. Appl Biol Chem (2020) 63:50
8.84 mg VCE/capita/day, respectively (Table 3). This find-ing suggests that the higher daily per capita intake of antioxidant activities in women is due to the markedly higher daily raw tomato intake. It has thus been found that the daily per capita intake of antioxidant activities is influenced by the daily intake of each product.
In conclusion, tomatoes, watermelons, and processed tomato products (ketchup and juice) contain an abun-dance of different antioxidant compounds, including lycopene. For high-level intake of antioxidant compounds and activities from each product, the intake of the prod-uct itself should be increased. However, the daily per capita intake of the products in Korea is considerably low, compared to the U.S. and Europe. Thus, an adequate intake of lycopene-rich products is recommended. This study is highly significant in that it involves the estima-tion of the daily per capita intake of antioxidant com-pounds including lycopene, and antioxidant activities in Korea, based on the data on the intake of tomatoes, watermelons, and their processed products, as drawn from the quantitative analysis of each product and the KNHANES data.
AcknowledgementsNone.
Authors’ contributionsConceptualization, YK and YS; methodology, HP, YK, and YS; formal analysis, HP, YK, and YS; writing—original draft preparation, HP; writing—review and edit‑ing, YK and YS. All authors read and approved the final manuscript.
FundingThis research received no external funding.
Availability of data and materialsThe datasets used and analyzed in this study are available from the corre‑sponding authors on reasonable request.
Competing interestsThe authors declare that they have no competing interests.
Received: 30 June 2020 Accepted: 28 August 2020
References 1. Kwon JH, Shim JE, Park MK (2005) Paik HY (2009) Evaluation of fruit and
vegetables intake for prevention of chronic disease in Korean adults aged 30 years and over: Using the third Korea national health and nutrition examination survey (KNHANES III). Korean J Nutr 42(2):146–157
2. WHO (World Health Organization). Cancer fact sheet, 2018. Available online: https ://www.who.int/en/news‑room/fact‑sheet s/detai l/cance r. Accessed 12 Sept 2018
3. Engelhard YN, Gazer B, Paren E (2006) Natural antioxidants from tomato extract reduce blood pressure in patients with grade‑1 hyperten‑sion: A double blind, placebo‑controlled pilot study. J Am Heart Assoc 151(1):1–6
4. Lenucci MS, Cadinu D, Taurino M, Piro G, Dalessandro G (2006) Antioxi‑dant composition in cherry and high‑pigment tomato cultivars. J Agric Food Chem 54(7):2606–2613
5. Frusciante L, Carli P, Ercolano MR, Pemice R, Di‑Matteo A, Fogliano V, Pel‑legrini N (2007) Antioxidant nutritional quality of tomato. Mol Nutr Food Res 51(5):609–617
6. Kamiloglu S, Demirci M, Selen S, Toydemir G, Boyacioglu D, Capanoglu E (2014) Home processing of tomatoes (Solanum lycopersicum): effects on in vitro bioaccessibility of total lycopene, phenolics, flavonoids, and antioxidant capacity. J Sci Food Agric 94(11):2225–2233
7. FAO (Food and Agriculture Organization of the United Nations). FAOSTAT, Production, 2019. Available online: https ://www.fao.org/faost at/en/#data/QC. Accessed 18 Jan 2019
8. Bohm F, Edge R, Burke M, Truscott TG (2001) Dietary uptake of lycopene protects human cells from singlet oxygen and nitrogen dioxide‑ROS components from cigarette smoke. J Photochem Photobiol B: Biol 64(2–3):176–178
9. Nguyen ML, Schwartz SJ (1999) Lycopene: chemical and biological prop‑erties. Food Technol 53(2):38–45
10. Singh P, Goyal GK (2016) Dietary lycopene: Its properties and anticarcino‑genic effects. Compr Rev Food Sci Food Saf 7(3):255–270
11. Naz A, Butt MS, Pasha I, Nawaz H (2013) Antioxidant indices of water‑melon juice and lycopene extract. Pak J Nutr 12:255–260
12. Tlili I, Hdider C, Lenucci MS, Ilahy R, Jebari H, Dalessandro G (2011) Bioactive compounds and antioxidant activities during fruit ripening of watermelon cultivars. J Food Comps Anal 24(7):923–928
13. Hong MY, Hartig N, Kaufman K, Hooshmand S, Figueroa A, Kern M (2015) Watermelon consumption improves inflammation and antioxidant capacity in rats fed an atherogenic diet. Nutr Res 35(3):251–258
14. Ghavipour M, Saedisomeolia A, Djalali M, Sotoudeh G, Eshranghyan MR, Moghada AM, Wood LG (2013) Tomato juice consumption reduces systemic inflammation in overweight and obese females. Br J Nutr 109(11):2031–2035
15. Ferruzzi MG, Nguyen ML, Sander LC, Rock CL, Schwartz SJ (2001) Analysis of lycopene geometrical isomers in biological microsamples by liquid chromatography with coulometric array detection. J Chromatography B 760(2):289–299
16. Korea Health Statistics (2017) Korea National Health and Nutrition Exami‑nation Survey (KNHANES VII‑2). Korea Center for Disease Control and Prevention; Seoul, Korea, pp 3–25
17. Meyers KJ, Watkins CB, Pritts MP, Liu RH (2003) Antioxidant and antiprolif‑erative activities of strawberries. J Agric Food Chem 51(23):6887–6892
18. Shin Y (2012) Correlation between antioxidant concentrations and activi‑ties of Yuja (Citrus junos Sieb ex Tanaka) and other citrus fruits. Food Sci Biotechnol 21(5):1477–1482
19. Bicanic D, Fogliano V, Luterotti S, Swarts J, Piani G, Graziani G (2005) Quan‑tification of lycopene in tomato products: comparing the performances of a newly proposed direct photothermal method and high‑performance liquid chromatography. J Sci Food Agric 85(7):1149–1153
20. Bicanic D, Swarts J, Luterotti S, Helander P, Fogliano V, Anese M (2005) Optothermistor as a breakthrough in the quantification of lycopene content of thermally processed tomato‑based foods: Verification versus absorption spectrophotometry and high‑performance liquid chromatog‑raphy. J Agric Food Chem 53(9):3295–3299
21. Brand‑Williams W, Cuvelier ME, Berset C (1995) Use of a free radical method to evaluate antioxidant activity. LWT‑Food Sci Technol 28:25–30
22. Floegel A, Kim DO, Chung SJ, Koo SI, Chun OK (2011) Comparison of ABTS/DPPH assays to measure antioxidant capacity in popular antioxi‑dant‑rich US foods. J Food Comp Anal 24(7):1043–1048
23. Re R, Pellegrini N, Proteggente A, Pannala A, Yang M, Rice‑Evans C (1999) Antioxidant activity applying an improved ABTS radical cation decoloriza‑tion assay. Free Radical Biol Med 26(9–10):1231–1237
24. Hallmann E (2012) The influence of organic and conventional cultivation systems on the nutritional value and content of bioactive compounds in selected tomato types. J Sci Food Agric 92(14):2840–2848
25. Kamiloglu S, Boyacioglu D, Capanoglu E (2013) The effect of food pro‑cessing on bioavailability of tomato antioxidants. J Berry Res 3(2):65–77
26. Gerard KA, Robert JS (2004) Microwave heating of apple mash to improve juice yield and quality. Food Sci Technol 37(5):551–557
27. Tlili I, Hdider C, Lenucci MS, Riadh I, Jebari H, Dalessandro G (2011) Bioactive compounds and antioxidant activities of different watermelon (Citrullus lanatus (Thunb.) Mansfeld) cultivars as affected by fruit sampling area. J Food Comp Anal 24(3):307–314

Page 11 of 11Park et al. Appl Biol Chem (2020) 63:50
28. Lee BH, Kim SY, Cho CH, Chung DK, Chun OK, Kim DO (2011) Estimation of daily per capita intake of total phenolics, total flavonoids, and antioxi‑dant capacities from fruit and vegetable juices in the Korean diet based the Korea National Health and Nutrition Examination survey 2008. Korean J Food Sci Technol 43(4):475–482
29. Gahler S, Otto K, Bohm V (2003) Alterations of vitamin C, total phenolics, and antioxidant capacity as affected by processing tomatoes to different products. J Agric Food Chem 51(27):7962–7968
30. Klopotek Y, Otto K, Böhm V (2005) Processing strawberries to different products alters contents of vitamin c, total phenolics, total anthocyanins, and antioxidant capacity. J Agric Food Chem 53(14):5640–5646
31. Nagal S, Kaur C, Choudhary H, Singh J, Bhushan‑Singh B, Singh KN (2012) Lycopene content, antioxidant capacity and colour attributes of selected watermelon (Citrullus lanatus (Thunb.) Mansfeld) cultivars grown in India. Int J Food Sci Nutr 63(8):996–1000
32. Martinez‑Valverde I, Periago MJ, Provan G, Chesson A (2002) Phenolic compounds, lycopene and antioxidant activity in commercial varieties of tomato (Lycopersicum esculentum). J Sci Food Agric 82(3):323–330
33. Markovic K, Hruskar M, Vahcic N (2006) Lycopene content of tomato products and their contribution to the lycopene intake of Croatians. Nutr Res 26(11):556–560
34. Perkins‑Veazie P, Collins JK, Pair SD, Roberts W (2001) Lycopene content differs among red‑fleshed watermelon cultivars. J Sci Food Agric 81(10):983–987
35. Chun OK, Kim DO, Smith N, Schroeder D, Han JT, Lee CY (2005) Daily consumption of phenolics and total antioxidant capacity from fruit and vegetables in the American diet. J Sci Food Agric 85(10):1715–1724
36. Jenab M, Ferrari P, Mazuir M, Tjonneland A, Clavel‑chapelon F, Linseisen J, Trichopoulou A, Tumino R, Bueno‑de‑Mesquita HB, Lund E, Gonzalez CA, JohanssonJ‑Key T, Riboli E G (2036S) Variations in lycopene blood levels and tomato consumption across European countries based on the Euro‑pean Prospective Investigation into Cancer and Nutrition(EPIC) study. J Nutr 135(8):2032S–2036S
37. Goldbohm RA, Brants HA, Hulshof KF, Van Den Brandt PA (1998) The contribution of various foods to intake of vitamin A and carotenoids in The Netherlands. Int J Vitam Nutr Res 68(6):378–383
38. Pelz R, Schmidt‑Faber B, Heseker H (1998) Carotenoid intake in the Ger‑man national food consumption survey. Z Ernahrungswiss 37(4):319–327
39. O’Neill ME, Carroll Y, Corridan B, Olmedilla B, Granado F, Blanco I, Van Den Berg H, Hininger I, Rousell AM, Chopra M, Southon S, Thurnham DI (2001) A European carotenoid database to assess carotenoid intakes and its use in a five‑country comparative study. British J Nutr 85(4):499–507
40. Porrini M, Riso P (2045S) What are typical lycopene intakes? J Nutr 135(8):2042S–2045S
41. Johnson‑Down L, Saudny‑Unterberger H, Gray‑Donald K (2002) Food habits of Canadians: lutein and lycopene intake in the Canadian popula‑tion. J Am Diet Assoc 102(7):988–991
42. Lugasi A, Brio L, Hovarie J, Sagi KV, Brandt S, Barna E (2003) Lycopene content of foods and lycopene intake in two groups of the Hungarian population. Nutr Res 23(8):1035–1044
43. Wawrzyniak A, Marciniak A, Rajewska J (2005) Lycopene content of selected foods available on the Polish market and estimation of its intake. Pol J Food Nutr Sci 14(55):195–200
44. McNaughton SA, Marks GC, Gaffney P, Williams G, Green A (2005) Valida‑tion of a food‑frequency questionnaire assessment of carotenoid and vitamin E intake using weighed food records and plasma biomarkers: the method of triads model. Eur J Clin Nutr 59(2):211–218
45. Vandevijvere S, Cucu T, Vinkx C, Huvaere K, Huybrechts I, Van Loco J (2014) Dietary intake of lycopene by the Belgian adult population. Public Health Nutr 17(2):248–255
46. Mazeikiene A, Jakaitiene A, Karciauskaite D, Kucinskiene ZA, Abaravicius JA, Kaminskas A, Kucinskas V (2015) Dietary lycopene and cardiovascular health in ethnic Lithuanians. Acta Med Litu 22(4):179–187
Publisher’s NoteSpringer Nature remains neutral with regard to jurisdictional claims in pub‑lished maps and institutional affiliations.