OOREDOO Q.P.S.C. DOHA - QATAR CONDENSED … · The Group has offerings where it provides customer...
40
OOREDOO Q.P.S.C. DOHA - QATAR CONDENSED CONSOLIDATED INTERIM FINANCIAL STATEMENTS AND INDEPENDENT AUDITOR’S REVIEW REPORT FOR THE NINE-MONTH PERIOD ENDED 30 SEPTEMBER 2018
Transcript of OOREDOO Q.P.S.C. DOHA - QATAR CONDENSED … · The Group has offerings where it provides customer...
OOREDOO Q.P.S.C.
DOHA - QATAR
CONDENSED CONSOLIDATED INTERIM
FINANCIAL STATEMENTS AND
INDEPENDENT AUDITOR’S REVIEW REPORT
FOR THE NINE-MONTH PERIOD ENDED
30 SEPTEMBER 2018
OOREDOO Q.P.S.C.
CONDENSED CONSOLIDATED INTERIM FINANCIAL STATEMENTS AND INDEPENDENT
AUDITOR'S REVIEW REPORT
For the nine-month period ended 30 September 2018
CONTENTS Page (s)
Independent auditor’s review report --
Condensed consolidated interim financial statements
Condensed consolidated interim statement of profit or loss 1
Condensed consolidated interim statement of comprehensive income 2
Condensed consolidated interim statement of financial position 3 - 4
Condensed consolidated interim statement of changes in equity 5 - 6
Condensed consolidated interim statement of cash flows 7 - 8
Notes to the condensed consolidated interim financial statements 9 - 37
OOREDOO Q.P.S.C.
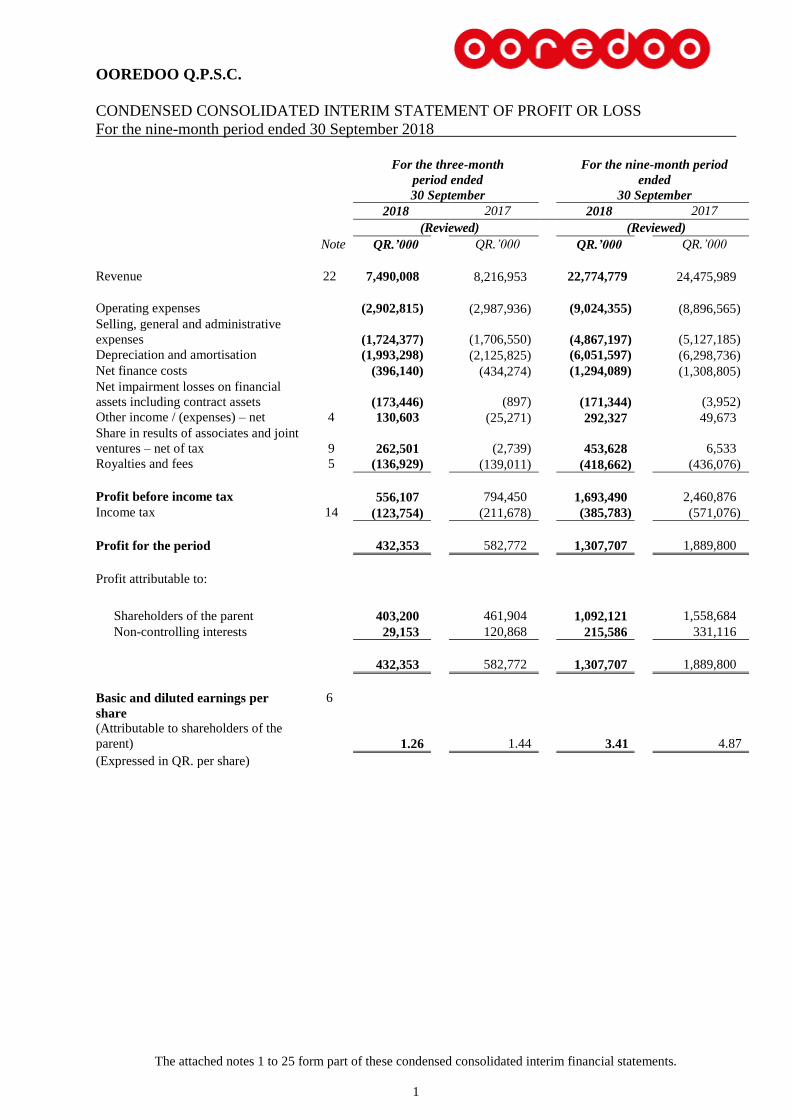
CONDENSED CONSOLIDATED INTERIM STATEMENT OF PROFIT OR LOSS
For the nine-month period ended 30 September 2018
The attached notes 1 to 25 form part of these condensed consolidated interim financial statements.
1
For the three-month
period ended
30 September
For the nine-month period
ended
30 September
2018 2017 2018 2017
(Reviewed) (Reviewed)
Note QR.’000 QR.’000 QR.’000 QR.’000
Revenue 22 7,490,008 8,216,953 22,774,779 24,475,989
Operating expenses (2,902,815) (2,987,936) (9,024,355) (8,896,565)
Selling, general and administrative
expenses
(1,724,377)
(1,706,550)
(4,867,197) (5,127,185)
Depreciation and amortisation (1,993,298) (2,125,825) (6,051,597) (6,298,736)
Net finance costs (396,140) (434,274) (1,294,089) (1,308,805)
Net impairment losses on financial
assets including contract assets
(173,446)
(897)
(171,344) (3,952)
Other income / (expenses) – net 4 130,603 (25,271) 292,327 49,673
Share in results of associates and joint
ventures – net of tax 9 262,501
(2,739)
453,628 6,533
Royalties and fees 5 (136,929) (139,011) (418,662) (436,076)
Profit before income tax 556,107 794,450 1,693,490 2,460,876
Income tax 14 (123,754) (211,678) (385,783) (571,076)
Profit for the period
432,353
582,772
1,307,707 1,889,800
Profit attributable to:
Shareholders of the parent
403,200
461,904
1,092,121 1,558,684
Non-controlling interests 29,153 120,868 215,586 331,116
432,353 582,772 1,307,707 1,889,800
Basic and diluted earnings per
share
6
(Attributable to shareholders of the
parent)
1.26
1.44
3.41 4.87
(Expressed in QR. per share)
OOREDOO Q.P.S.C.
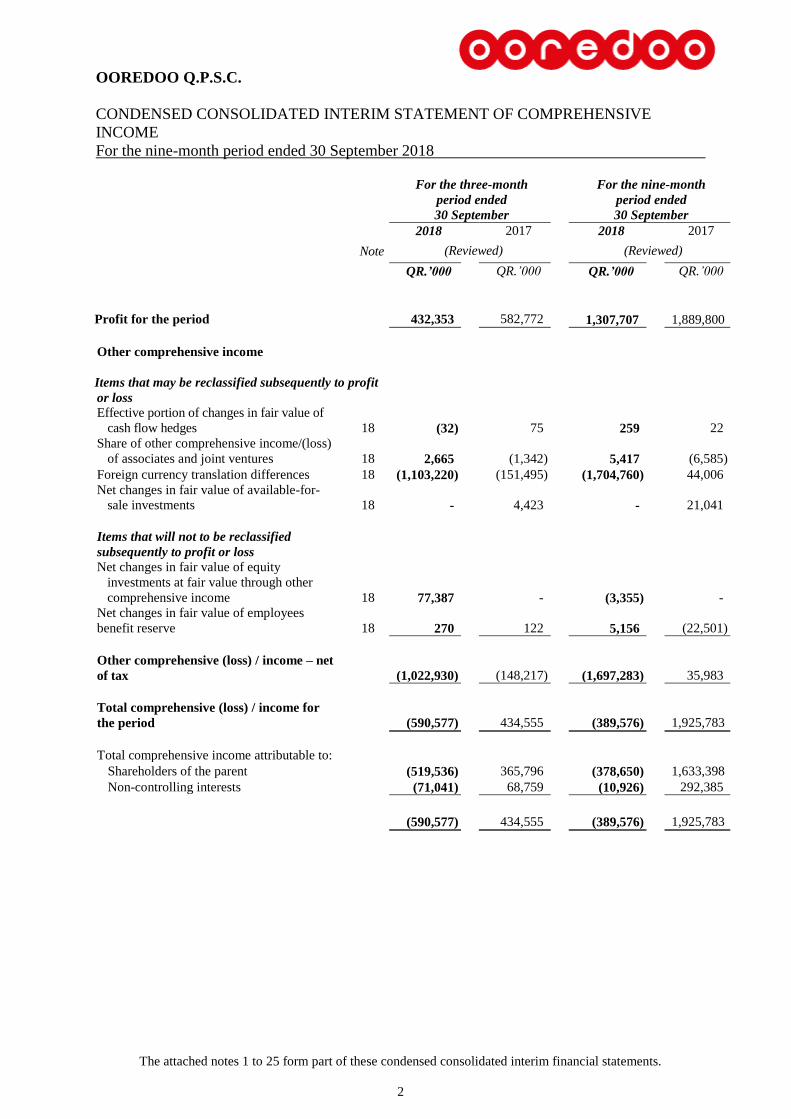
CONDENSED CONSOLIDATED INTERIM STATEMENT OF COMPREHENSIVE
INCOME
For the nine-month period ended 30 September 2018
The attached notes 1 to 25 form part of these condensed consolidated interim financial statements.
2
For the three-month
period ended
30 September
For the nine-month
period ended
30 September
2018 2017 2018 2017
Note (Reviewed) (Reviewed)
QR.’000 QR.’000 QR.’000 QR.’000
Profit for the period 432,353 582,772 1,307,707 1,889,800
Other comprehensive income
Items that may be reclassified subsequently to profit
or loss
Effective portion of changes in fair value of
cash flow hedges 18 (32)
75
259 22
Share of other comprehensive income/(loss)
of associates and joint ventures 18 2,665
(1,342)
5,417 (6,585)
Foreign currency translation differences 18 (1,103,220) (151,495) (1,704,760) 44,006
Net changes in fair value of available-for-
sale investments 18 -
4,423
- 21,041
Items that will not to be reclassified
subsequently to profit or loss
Net changes in fair value of equity
investments at fair value through other
comprehensive income 18 77,387
-
(3,355) -
Net changes in fair value of employees
benefit reserve 18 270
122
5,156 (22,501)
Other comprehensive (loss) / income – net
of tax
(1,022,930)
(148,217)
(1,697,283) 35,983
Total comprehensive (loss) / income for
the period
(590,577)
434,555
(389,576) 1,925,783
Total comprehensive income attributable to:
Shareholders of the parent (519,536) 365,796 (378,650) 1,633,398
Non-controlling interests (71,041) 68,759 (10,926) 292,385
434,555
(590,577) (389,576) 1,925,783
OOREDOO Q.P.S.C.
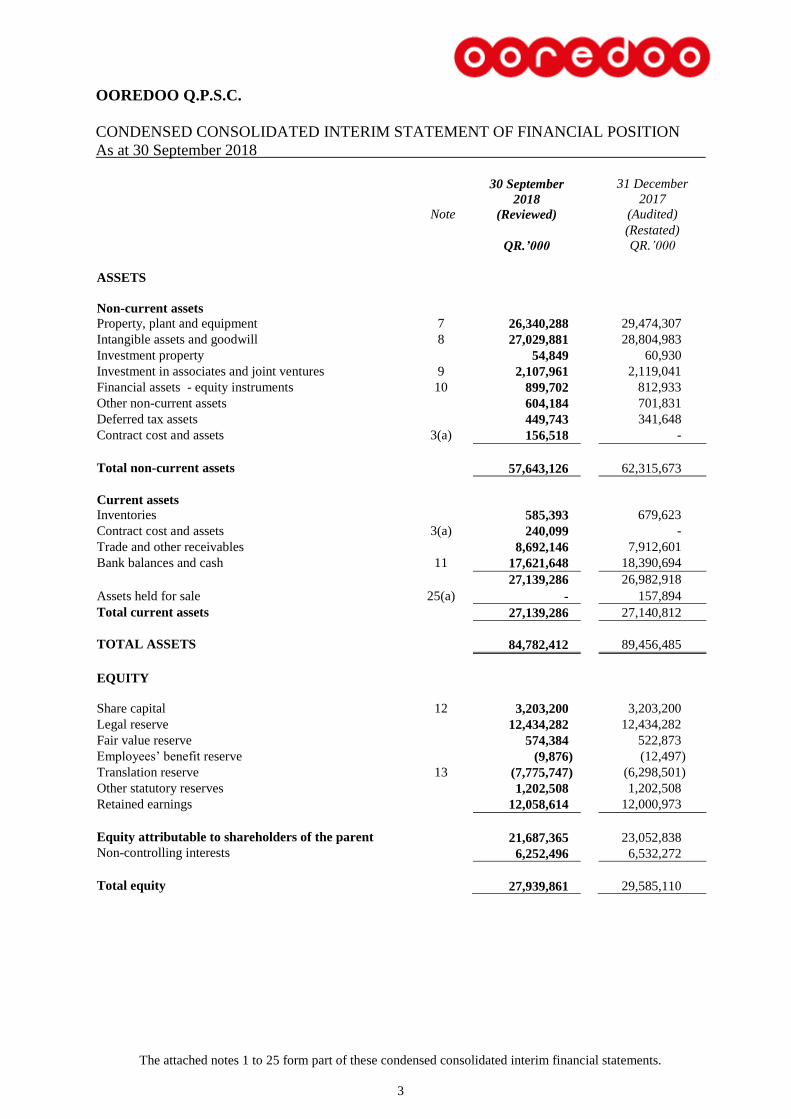
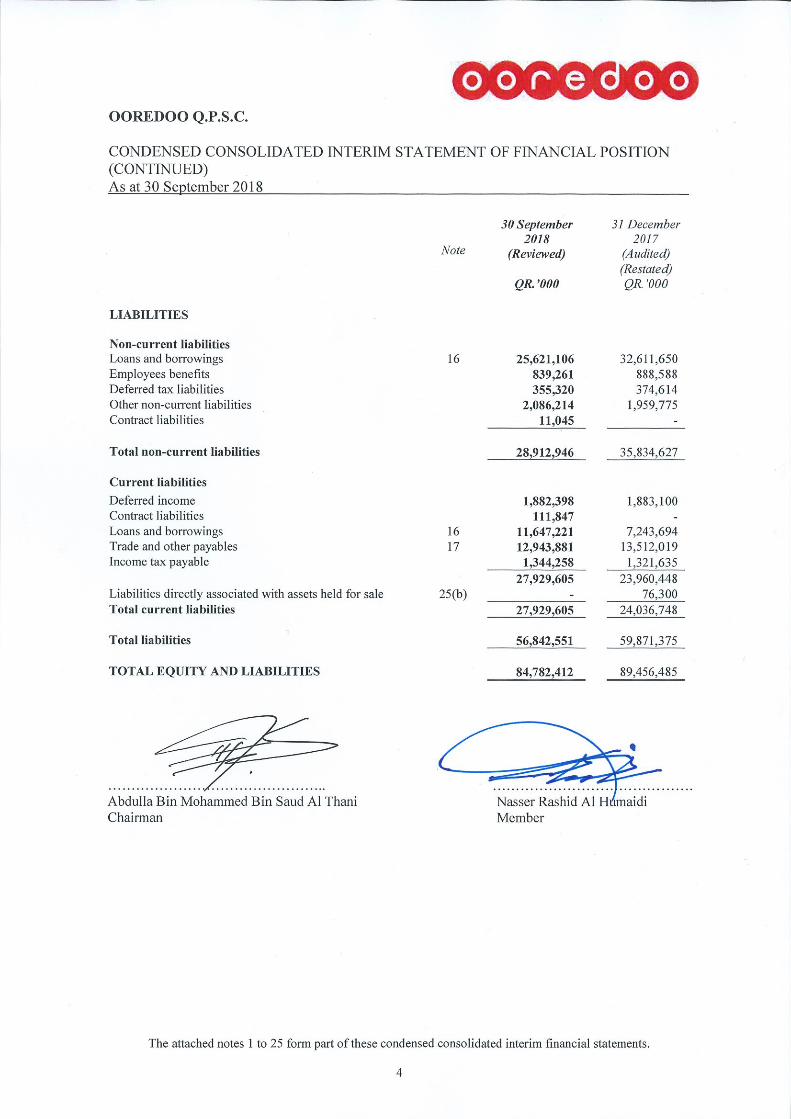
CONDENSED CONSOLIDATED INTERIM STATEMENT OF FINANCIAL POSITION
As at 30 September 2018
The attached notes 1 to 25 form part of these condensed consolidated interim financial statements.
3
Note
30 September
2018
(Reviewed)
31 December
2017
(Audited)
(Restated)
QR.’000 QR.’000
ASSETS
Non-current assets
Property, plant and equipment 7 26,340,288 29,474,307
Intangible assets and goodwill 8 27,029,881 28,804,983
Investment property 54,849 60,930
Investment in associates and joint ventures 9 2,107,961 2,119,041
Financial assets - equity instruments 10 899,702 812,933
Other non-current assets 604,184 701,831
Deferred tax assets 449,743 341,648
Contract cost and assets 3(a) 156,518 -
Total non-current assets 57,643,126 62,315,673
Current assets
Inventories 585,393 679,623
Contract cost and assets 3(a) 240,099 -
Trade and other receivables 8,692,146 7,912,601
Bank balances and cash 11 17,621,648 18,390,694
27,139,286 26,982,918
Assets held for sale 25(a) - 157,894
Total current assets 27,139,286 27,140,812
TOTAL ASSETS 84,782,412 89,456,485
EQUITY
Share capital 12 3,203,200 3,203,200
Legal reserve 12,434,282 12,434,282
Fair value reserve 574,384 522,873
Employees’ benefit reserve (9,876) (12,497)
Translation reserve 13 (7,775,747) (6,298,501)
Other statutory reserves 1,202,508 1,202,508
Retained earnings 12,058,614 12,000,973
Equity attributable to shareholders of the parent 21,687,365 23,052,838
Non-controlling interests 6,252,496 6,532,272
Total equity 27,939,861 29,585,110
OOREDOO Q.P.S.C.
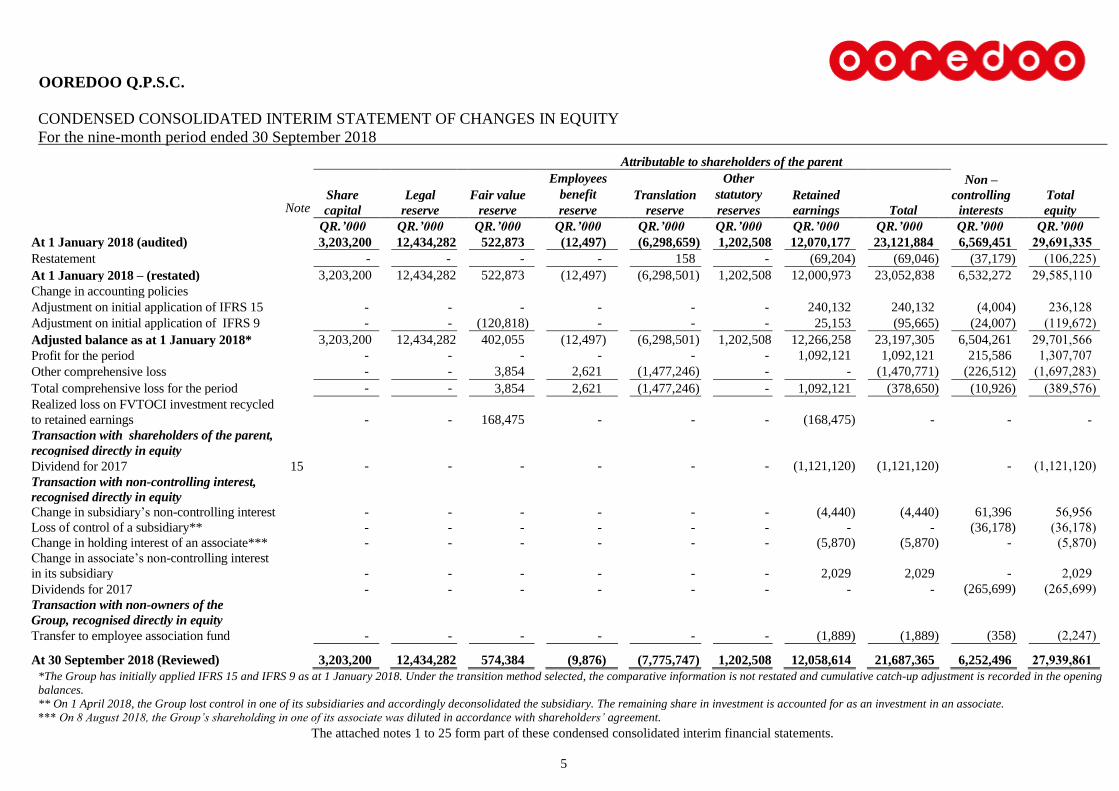
CONDENSED CONSOLIDATED INTERIM STATEMENT OF CHANGES IN EQUITY
For the nine-month period ended 30 September 2018
The attached notes 1 to 25 form part of these condensed consolidated interim financial statements.
5
Attributable to shareholders of the parent
Note
Share
capital
Legal
reserve
Fair value
reserve
Employees
benefit
reserve
Translation
reserve
Other
statutory
reserves
Retained
earnings
Total
Non –
controlling
interests
Total
equity
QR.’000 QR.’000 QR.’000 QR.’000 QR.’000 QR.’000 QR.’000 QR.’000 QR.’000 QR.’000
At 1 January 2018 (audited) 3,203,200 12,434,282 522,873 (12,497) (6,298,659) 1,202,508 12,070,177 23,121,884 6,569,451 29,691,335
Restatement - - - - 158 - (69,204) (69,046) (37,179) (106,225)
At 1 January 2018 – (restated) 3,203,200 12,434,282 522,873 (12,497) (6,298,501) 1,202,508 12,000,973 23,052,838 6,532,272 29,585,110
Change in accounting policies
Adjustment on initial application of IFRS 15 - - - - - - 240,132 240,132 (4,004) 236,128
Adjustment on initial application of IFRS 9 - - (120,818) - - - 25,153 (95,665) (24,007) (119,672)
Adjusted balance as at 1 January 2018* 3,203,200 12,434,282 402,055 (12,497) (6,298,501) 1,202,508 12,266,258 23,197,305 6,504,261 29,701,566
Profit for the period - - - - - - 1,092,121 1,092,121 215,586 1,307,707
Other comprehensive loss - - 3,854 2,621 (1,477,246) - - (1,470,771) (226,512) (1,697,283)
Total comprehensive loss for the period - - 3,854 2,621 (1,477,246) - 1,092,121 (378,650) (10,926) (389,576)
Realized loss on FVTOCI investment recycled
to retained earnings
- - 168,475 - - - (168,475) - - -
Transaction with shareholders of the parent,
recognised directly in equity
Dividend for 2017 15 - - - - - - (1,121,120) (1,121,120) - (1,121,120)
Transaction with non-controlling interest,
recognised directly in equity
Change in subsidiary’s non-controlling interest - - - - - - (4,440) (4,440) 61,396 56,956
Loss of control of a subsidiary** - - - - - - - - (36,178) (36,178)
Change in holding interest of an associate*** - - - - - - (5,870) (5,870) - (5,870)
Change in associate’s non-controlling interest
in its subsidiary - - - - - - 2,029 2,029 - 2,029
Dividends for 2017 - - - - - - - - (265,699) (265,699)
Transaction with non-owners of the
Group, recognised directly in equity
Transfer to employee association fund - - - - - - (1,889) (1,889) (358) (2,247)
At 30 September 2018 (Reviewed)
3,203,200 12,434,282 574,384 (9,876) (7,775,747) 1,202,508 12,058,614 21,687,365 6,252,496 27,939,861
*The Group has initially applied IFRS 15 and IFRS 9 as at 1 January 2018. Under the transition method selected, the comparative information is not restated and cumulative catch-up adjustment is recorded in the opening
balances.
** On 1 April 2018, the Group lost control in one of its subsidiaries and accordingly deconsolidated the subsidiary. The remaining share in investment is accounted for as an investment in an associate.
*** On 8 August 2018, the Group’s shareholding in one of its associate was diluted in accordance with shareholders’ agreement.
OOREDOO Q.P.S.C.
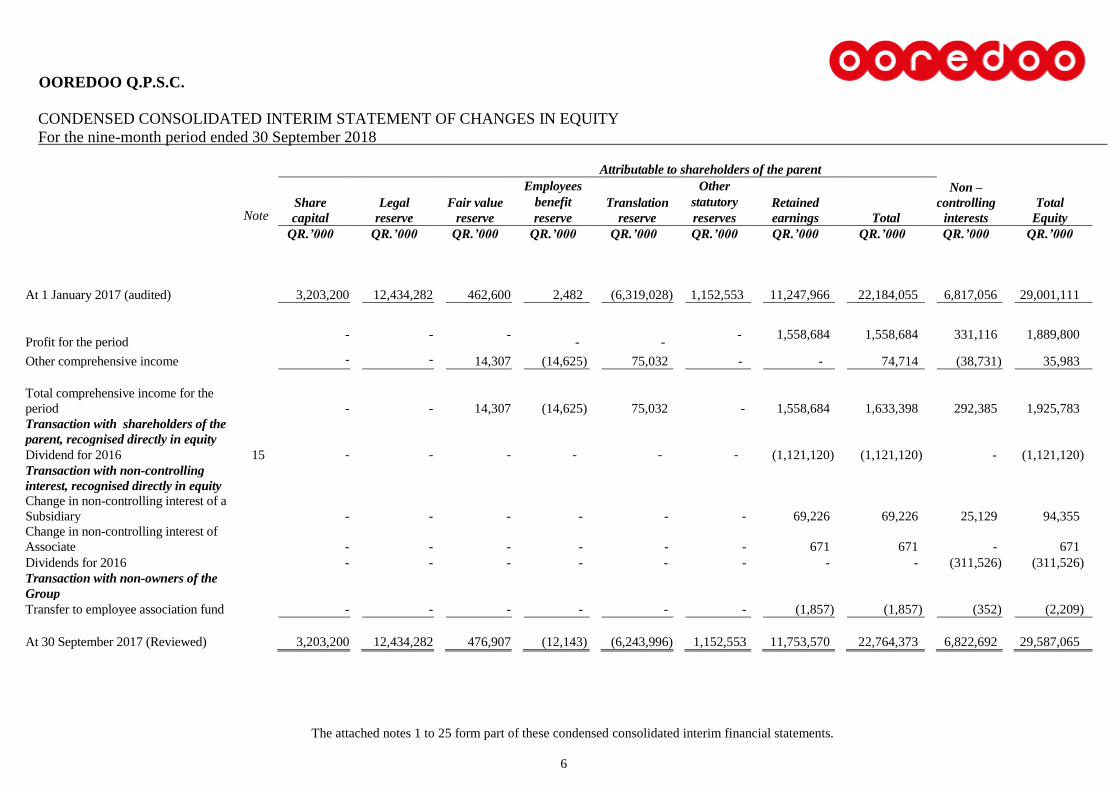
CONDENSED CONSOLIDATED INTERIM STATEMENT OF CHANGES IN EQUITY
For the nine-month period ended 30 September 2018
The attached notes 1 to 25 form part of these condensed consolidated interim financial statements.
6
Attributable to shareholders of the parent
Note
Share
capital
Legal
reserve
Fair value
reserve
Employees
benefit
reserve
Translation
reserve
Other
statutory
reserves
Retained
earnings
Total
Non –
controlling
interests
Total
Equity
QR.’000 QR.’000 QR.’000 QR.’000 QR.’000 QR.’000 QR.’000 QR.’000 QR.’000 QR.’000
At 1 January 2017 (audited)
3,203,200
12,434,282
462,600
2,482 (6,319,028)
1,152,553
11,247,966 22,184,055 6,817,056 29,001,111
Profit for the period
- - -
-
- - 1,558,684 1,558,684 331,116 1,889,800
Other comprehensive income - - 14,307 (14,625) 75,032 - - 74,714 (38,731) 35,983
Total comprehensive income for the
period
- -
14,307 (14,625) 75,032 - 1,558,684 1,633,398 292,385 1,925,783
Transaction with shareholders of the
parent, recognised directly in equity
Dividend for 2016 15 - - - - - - (1,121,120) (1,121,120) - (1,121,120)
Transaction with non-controlling
interest, recognised directly in equity
Change in non-controlling interest of a
Subsidiary - - - - - - 69,226 69,226 25,129 94,355
Change in non-controlling interest of
Associate - - - - - - 671 671 - 671
Dividends for 2016 - - - - - - - - (311,526) (311,526)
Transaction with non-owners of the
Group
Transfer to employee association fund - - - - - - (1,857) (1,857) (352) (2,209)
At 30 September 2017 (Reviewed) 3,203,200 12,434,282 476,907 (12,143) (6,243,996) 1,152,553 11,753,570 22,764,373 6,822,692 29,587,065
OOREDOO Q.P.S.C.
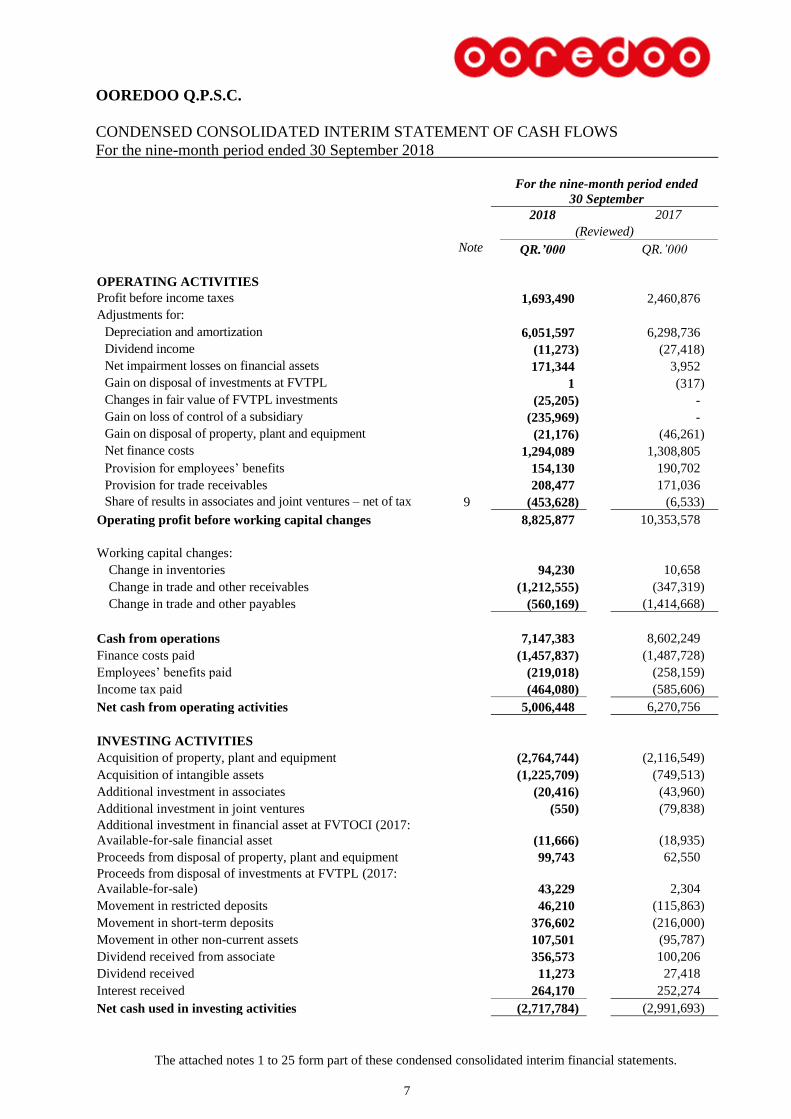
CONDENSED CONSOLIDATED INTERIM STATEMENT OF CASH FLOWS
For the nine-month period ended 30 September 2018
The attached notes 1 to 25 form part of these condensed consolidated interim financial statements.
7
For the nine-month period ended
30 September
2018 2017
(Reviewed)
Note QR.’000 QR.’000
OPERATING ACTIVITIES
Profit before income taxes 1,693,490 2,460,876
Adjustments for:
Depreciation and amortization 6,051,597 6,298,736
Dividend income (11,273) (27,418)
Net impairment losses on financial assets 171,344 3,952
Gain on disposal of investments at FVTPL 1 (317)
Changes in fair value of FVTPL investments (25,205) -
Gain on loss of control of a subsidiary (235,969) -
Gain on disposal of property, plant and equipment (21,176) (46,261)
Net finance costs 1,294,089 1,308,805
Provision for employees’ benefits 154,130 190,702
Provision for trade receivables 208,477 171,036
Share of results in associates and joint ventures – net of tax 9 (453,628) (6,533)
Operating profit before working capital changes 8,825,877 10,353,578
Working capital changes:
Change in inventories 94,230 10,658
Change in trade and other receivables (1,212,555) (347,319)
Change in trade and other payables (560,169) (1,414,668)
Cash from operations 7,147,383 8,602,249
Finance costs paid (1,457,837) (1,487,728)
Employees’ benefits paid (219,018) (258,159)
Income tax paid (464,080) (585,606)
Net cash from operating activities 5,006,448 6,270,756
INVESTING ACTIVITIES
Acquisition of property, plant and equipment (2,764,744) (2,116,549)
Acquisition of intangible assets (1,225,709) (749,513)
Additional investment in associates (20,416) (43,960)
Additional investment in joint ventures (550) (79,838)
Additional investment in financial asset at FVTOCI (2017:
Available-for-sale financial asset
(11,666) (18,935)
Proceeds from disposal of property, plant and equipment 99,743 62,550
Proceeds from disposal of investments at FVTPL (2017:
Available-for-sale)
43,229 2,304
Movement in restricted deposits 46,210 (115,863)
Movement in short-term deposits 376,602 (216,000)
Movement in other non-current assets 107,501 (95,787)
Dividend received from associate 356,573 100,206
Dividend received 11,273 27,418
Interest received 264,170 252,274
Net cash used in investing activities (2,717,784) (2,991,693)

OOREDOO Q.P.S.C.
CONDENSED CONSOLIDATED INTERIM STATEMENT OF CASH FLOWS
(CONTINUED)
For the nine-month period ended 30 September 2018
The attached notes 1 to 25 form part of these condensed consolidated interim financial statements.
8
For the nine-month period ended
30 September
2018 2017
(Reviewed)
Note QR.’000 QR.’000
FINANCING ACTIVITIES
Proceeds from rights issue of a subsidiary 56,956 -
Proceeds from loans and borrowings 3,782,808 2,971,354
Repayment of loans and borrowings (5,894,931) (3,774,991)
Proceeds from IPO transaction - 94,355
Additions to deferred financing costs (5,129) (5,507)
Dividend paid to shareholders of the parent 15 (1,121,120) (1,121,120)
Dividend paid to non-controlling interests (265,699) (311,526)
Movement in other non-current liabilities 195,748 (410,236)
Net cash used in financing activities (3,251,367) (2,557,671)
NET CHANGE IN CASH AND CASH EQUIVALENTS (962,703) 721,392
Effect of exchange rate fluctuations 540,883 5,123
Cash and cash equivalents at 1 January 17,095,602 15,562,730
CASH AND CASH EQUIVALENTS 30 September 11 16,673,782 16,289,245
Please refer to Note 11 for details of non-cash transactions.
OOREDOO Q.P.S.C.
NOTES TO THE CONDENSED CONSOLIDATED INTERIM FINANCIAL STATEMENTS
For the nine-month period ended 30 September 2018
9
1 REPORTING ENTITY
Qatar Public Telecommunications Corporation (the “Corporation”) was formed on 29 June 1987 domiciled in the
State of Qatar by Law No. 13 of 1987 to provide domestic and international telecommunication services within the
State of Qatar. The Company’s registered office is located at 100 Westbay Tower, Doha, State of Qatar.
The Corporation was transformed into a Qatari Shareholding Company under the name of Qatar Telecom (Qtel)
Q.P.S.C. (the “Company”) on 25 November 1998, pursuant to Law No. 21 of 1998.
In June 2013, the legal name of the Company was changed to Ooredoo Q.S.C. This change had been duly approved
by the shareholders at the Company’s extraordinary general assembly meeting held on 31 March 2013.
The Company changed its legal name from Ooredoo Q.S.C. to Ooredoo Q.P.S.C. to comply with the provisions of
the new Qatar Commercial Companies Law issued on 7 July 2015.
The Company is a telecommunications service provider licensed by the Communications Regulatory Authority
(CRA) (formerly known as Supreme Council of Information and Communication Technology (ictQATAR)) to
provide both fixed and mobile telecommunications services in the state of Qatar. As a licensed service provider, the
conduct and activities of the Company are regulated by CRA pursuant to Law No. 34 of 2006 (Telecommunications
Law) and the Applicable Regulatory Framework.
The Company and its subsidiaries (together referred to as the “Group”) provides domestic and international
telecommunication services in Qatar and elsewhere in the Asia and Middle East and North African (MENA) region.
Qatar Holding L.L.C. is the ultimate Parent Company of the Group.
In line with an amendment issued by Qatar Financial Market Authority (“QFMA”), effective from May 2018, listed
entities are required to maintain and implement an effective internal control system in order to comply with its
corporate governance code. The Company has taken appropriate steps to comply with the requirements of this
amendment.
The condensed consolidated interim financial statements of the Group for nine-month period ended 30 September
2018 were authorised for issuance in accordance with a resolution of the Board of Directors of the Group on 29
October 2018.
2 BASIS OF PREPARATION
The condensed consolidated interim financial statements for the nine-month period ended 30 September 2018 have
been prepared in accordance with International Accounting Standard 34 Interim Financial Reporting (“IAS 34”).
The condensed consolidated interim financial statements are prepared in Qatari Riyals, which is the Company’s
functional and presentation currency and all values are rounded to the nearest thousands (QR.’000) except when
otherwise indicated.
The condensed consolidated interim financial statements do not include all information and disclosures required
in the annual consolidated financial statements and should be read in conjunction with the Group’s annual
consolidated financial statements for the year ended 31 December 2017. In addition, results for the nine-month
period ended 30 September 2018 are not necessarily indicative of the results that may be expected for the financial
year ending 31 December 2018.
Judgments, estimates and risk management
The preparation of the condensed consolidated interim financial statements requires management to make
judgments, estimates and assumptions that affects the application of accounting policies and the reported amounts
of assets, liabilities, income and expenses. Actual results may differ from these estimates. The significant
judgments made by management in applying the Group's accounting policies and the key sources of estimation
uncertainty were the same as those that applied to the Group’s annual consolidated financial statements for the
year ended 31 December 2017, except as mentioned in Note 3.
OOREDOO Q.P.S.C.
NOTES TO THE CONDENSED CONSOLIDATED INTERIM FINANCIAL STATEMENTS
For the nine-month period ended 30 September 2018
10
3 SIGNIFICANT ACCOUNTING POLICIES
The accounting policies used in the preparation of these condensed consolidated interim financial statements are
consistent with those used in the preparation of the Group’s annual consolidated financial statements for the year
ended 31 December 2017, and the notes attached thereto, except for the adoption of certain new and revised
standards, that became effective in the current period as set out below.
(i) New and amended standards adopted by the Group
A number of new and amended standards became applicable for the current reporting period and the Group had
to change its accounting policies and made modified retrospective adjustments as a result of adopting the
following standards:
IFRS 9, Financial Instruments; and
IFRS 15 Revenue from Contracts with Customers
The impact of the adoption of these standards and the new accounting policies are disclosed below. The other
standards did not have any material impact on the Group’s accounting policies and did not require any
adjustments.
)ii(Revised Standards:
Effective for annual periods beginning on or after 1 January 2018
IFRS 2 (Revised) Amendments regarding classification and measurement of share
based payment transactions
IFRS 7 (Revised) Amendments relating to disclosures about the initial application of
IFRS 9
IAS 40 (Revised) Investment Property – Amendments to paragraph 57
Annual Improvements 2014-
2016 Cycle
Amendments to IFRS 1 and IAS 28
IFRIC 22 Foreign Currency Transactions and Advance Consideration
(iii) New and revised standards and interpretations but not yet effective:
Effective for annual periods beginning on or after 1 January 2019
IFRS 16 Leases
IFRIC 23 Uncertainty over Income Tax Treatments
IFRS 17 Insurance contracts
IFRS 16 Leases
IFRS 16 was issued in January 2016. It will result in almost all leases being recognised on the condensed
consolidated interim statement of financial position, as the distinction between operating and finance leases is
removed. Under the new standard, an asset (the right to use the leased item) and a financial liability to pay rentals
are recognised. The only exceptions are short-term and low-value leases.
The standard will affect primarily the accounting for the Group’s operating leases. As at the reporting date, the
Group has non-cancellable operating lease commitments. However, the Group has not yet determined to what
extent these commitments will result in the recognition of assets and liabilities for future payments and how this
will affect the Group’s profit and classification of cash flows.
OOREDOO Q.P.S.C.
NOTES TO THE CONDENSED CONSOLIDATED INTERIM FINANCIAL STATEMENTS
For the nine-month period ended 30 September 2018
11
3a. CHANGES IN ACCOUNTING POLICIES
(i.) IFRS 15 Revenue from Contracts with Customers – Impact of Adoption
IFRS 15 establishes a comprehensive framework for determining whether, how much and when revenue is
recognised. It replaced IAS 18 Revenue, IAS 11 Construction Contracts and related interpretations.
The Group has adopted IFRS 15 Revenue from Contracts with Customers from 1 January 2018. The Group has
elected not to restate comparative figures but any adjustments to the carrying amounts of assets and liabilities at
transition date were recognized in the opening balance of retained earnings and non-controlling interest.
Set out below is the IFRS 15 transition impact disclosure for the Group.
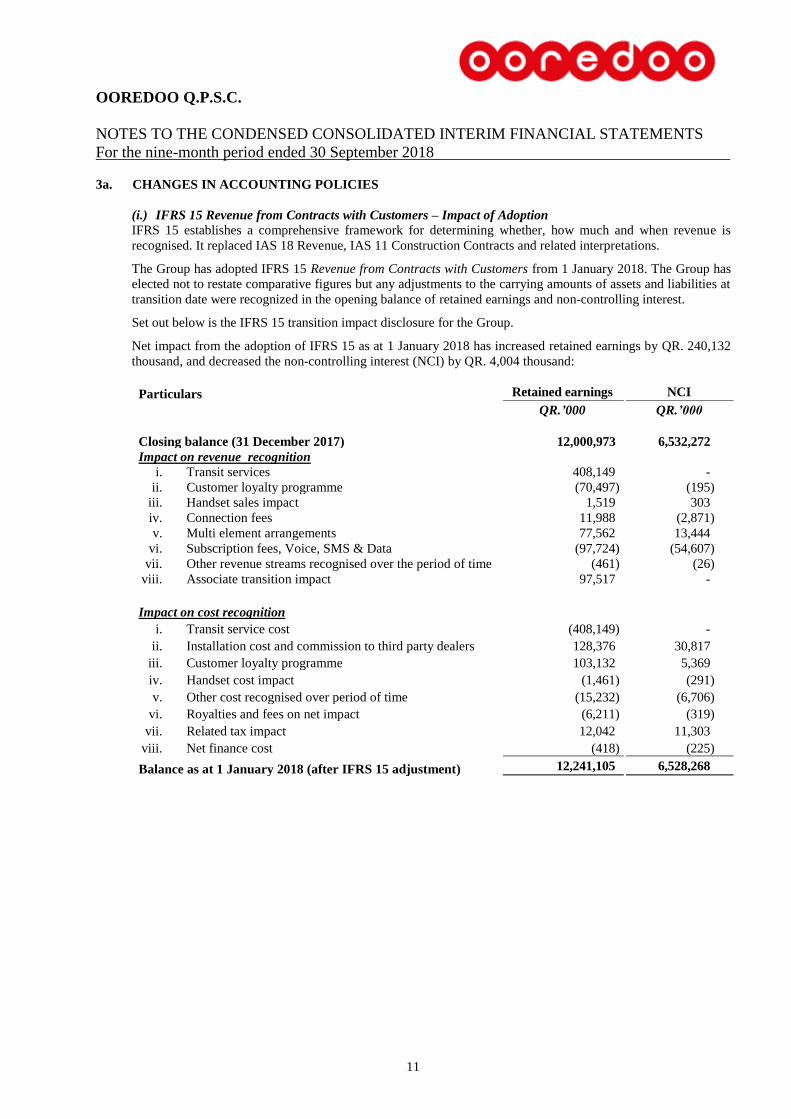
Net impact from the adoption of IFRS 15 as at 1 January 2018 has increased retained earnings by QR. 240,132
thousand, and decreased the non-controlling interest (NCI) by QR. 4,004 thousand:
Particulars Retained earnings NCI
QR.’000 QR.’000
Closing balance (31 December 2017) 12,000,973 6,532,272
Impact on revenue recognition
i. Transit services 408,149 -
ii. Customer loyalty programme (70,497) (195)
iii. Handset sales impact 1,519 303
iv. Connection fees 11,988 (2,871)
v. Multi element arrangements 77,562 13,444
vi. Subscription fees, Voice, SMS & Data (97,724) (54,607)
vii. Other revenue streams recognised over the period of time (461) (26)
viii. Associate transition impact 97,517 -
Impact on cost recognition
i. Transit service cost (408,149) -
ii. Installation cost and commission to third party dealers 128,376 30,817
iii. Customer loyalty programme 103,132 5,369
iv. Handset cost impact (1,461) (291)
v. Other cost recognised over period of time (15,232) (6,706)
vi. Royalties and fees on net impact (6,211) (319)
vii. Related tax impact 12,042 11,303
viii. Net finance cost (418) (225)
Balance as at 1 January 2018 (after IFRS 15 adjustment) 12,241,105 6,528,268
OOREDOO Q.P.S.C.
NOTES TO THE CONDENSED CONSOLIDATED INTERIM FINANCIAL STATEMENTS
For the nine-month period ended 30 September 2018
12
3a. CHANGES IN ACCOUNTING POLICIES (CONTINUED)
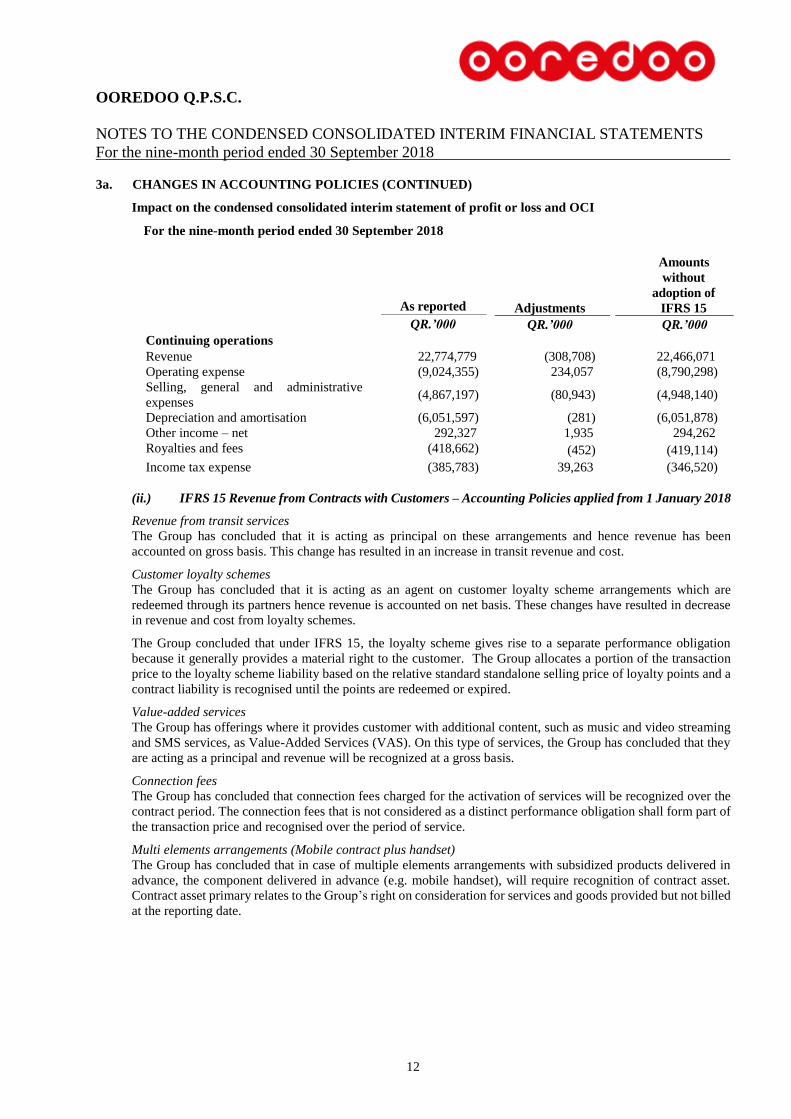
Impact on the condensed consolidated interim statement of profit or loss and OCI
For the nine-month period ended 30 September 2018
As reported Adjustments
Amounts
without
adoption of
IFRS 15
QR.’000 QR.’000 QR.’000
Continuing operations
Revenue 22,774,779 (308,708) 22,466,071
Operating expense (9,024,355) 234,057 (8,790,298)
Selling, general and administrative
expenses
(4,867,197) (80,943) (4,948,140)
Depreciation and amortisation (6,051,597) (281) (6,051,878)
Other income – net 292,327 1,935 294,262
Royalties and fees (418,662) (452) (419,114)
Income tax expense (385,783) 39,263 (346,520)
(ii.) IFRS 15 Revenue from Contracts with Customers – Accounting Policies applied from 1 January 2018
Revenue from transit services
The Group has concluded that it is acting as principal on these arrangements and hence revenue has been
accounted on gross basis. This change has resulted in an increase in transit revenue and cost.
Customer loyalty schemes
The Group has concluded that it is acting as an agent on customer loyalty scheme arrangements which are
redeemed through its partners hence revenue is accounted on net basis. These changes have resulted in decrease
in revenue and cost from loyalty schemes.
The Group concluded that under IFRS 15, the loyalty scheme gives rise to a separate performance obligation
because it generally provides a material right to the customer. The Group allocates a portion of the transaction
price to the loyalty scheme liability based on the relative standard standalone selling price of loyalty points and a
contract liability is recognised until the points are redeemed or expired.
Value-added services
The Group has offerings where it provides customer with additional content, such as music and video streaming
and SMS services, as Value-Added Services (VAS). On this type of services, the Group has concluded that they
are acting as a principal and revenue will be recognized at a gross basis.
Connection fees
The Group has concluded that connection fees charged for the activation of services will be recognized over the
contract period. The connection fees that is not considered as a distinct performance obligation shall form part of
the transaction price and recognised over the period of service.
Multi elements arrangements (Mobile contract plus handset)
The Group has concluded that in case of multiple elements arrangements with subsidized products delivered in
advance, the component delivered in advance (e.g. mobile handset), will require recognition of contract asset.
Contract asset primary relates to the Group’s right on consideration for services and goods provided but not billed
at the reporting date.
OOREDOO Q.P.S.C.
NOTES TO THE CONDENSED CONSOLIDATED INTERIM FINANCIAL STATEMENTS
For the nine-month period ended 30 September 2018
13
3a. CHANGES IN ACCOUNTING POLICIES (CONTINUED)
(ii.) IFRS 15 Revenue from Contracts with Customers – Accounting Policies applied from 1 January 2018
(continued)
Installation cost, commissions to third party dealers, marketing expenses
The Group has concluded that commissions and installation costs meet the definition of incremental costs to
acquire a contract or a costs to fulfil a contract. The Group has capitalized these expenses as contract cost assets
and amortized as per portfolio approach. Recognized contract assets will be subject to impairment assessment
under IFRS 9 requirements.
Significant financing component
The Group has decided to recognize interest expense at appropriate annual interest rate over the contract period
and total transaction price including financing component is recognized when equipment is delivered to customer.
Contract assets and liabilities
The Group has determined that contract assets and liabilities are to be recognised at the performance obligation
level and not at the contract level and both contract assets and liabilities are to be shown separately in the
condensed consolidated interim financial statements.
Discounts and promotions
The Group provides various discounts and promotions to its customers, which may be agreed at inception or
provided during the contract term.
The impact and accounting of these discounts and promotions vary under IFRS 15 which may result in recognition
of contract asset and increase/decrease in opening retained earnings.
Contract modification
The Group has applied IFRS 15 using modified retrospective approach using practical expedient in paragraph
C5(c) of IFRS 15, under which, for contracts that were modified before 1 January 2018, the Group need not to
retrospectively restate the contract for those contract modifications. Instead, the Group reflected the aggregate
effect of all of the modifications that occur before 1 January 2018 and presented when (i) the performance
obligations were satisfied and unsatisfied; (ii) determined the transaction price; and (iii) allocated the transaction
price.
As a result of using this practical expedient, all contracts not yet completed as at 1 January 2018, were reassessed
to determine the portion of satisfied and unsatisfied performance obligation and the effect (i.e., a reduction of
revenue and an increase in deferred income) was adjusted in the retained earnings opening balance.
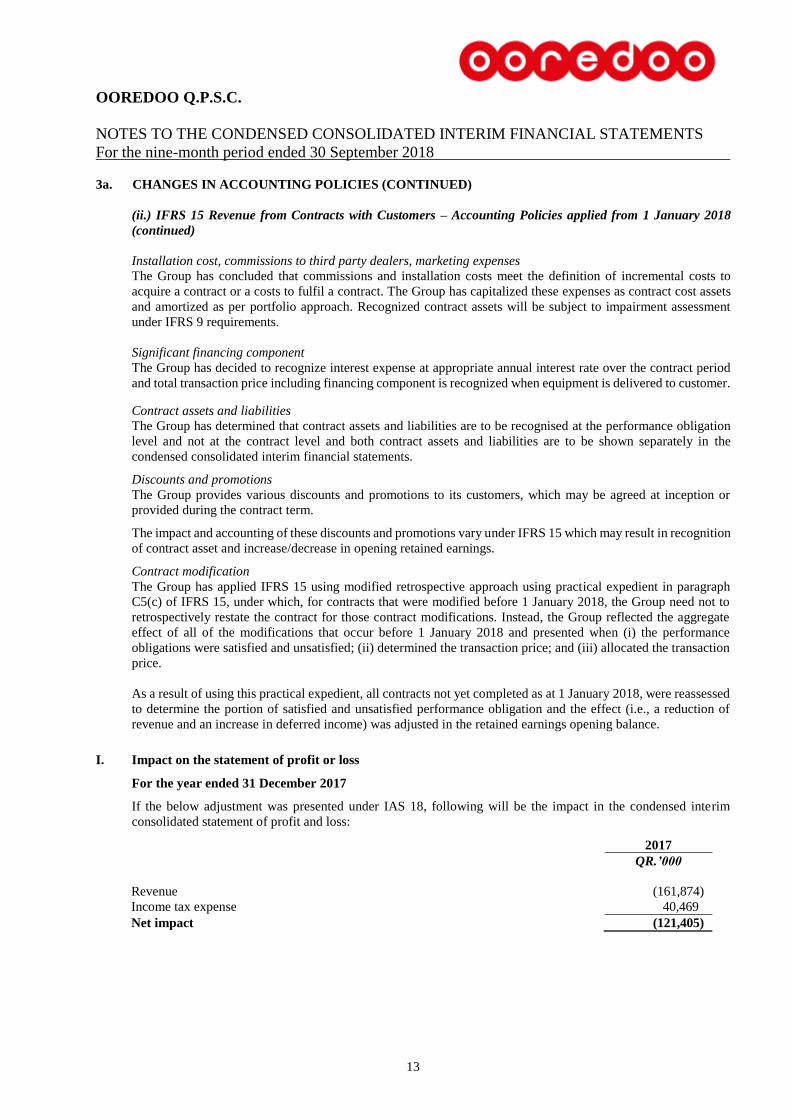
I. Impact on the statement of profit or loss
For the year ended 31 December 2017
If the below adjustment was presented under IAS 18, following will be the impact in the condensed interim
consolidated statement of profit and loss:
2017
QR.’000
Revenue (161,874)
Income tax expense 40,469
Net impact (121,405)
OOREDOO Q.P.S.C.
NOTES TO THE CONDENSED CONSOLIDATED INTERIM FINANCIAL STATEMENTS
For the nine-month period ended 30 September 2018
14
3a. CHANGES IN ACCOUNTING POLICIES (CONTINUED)
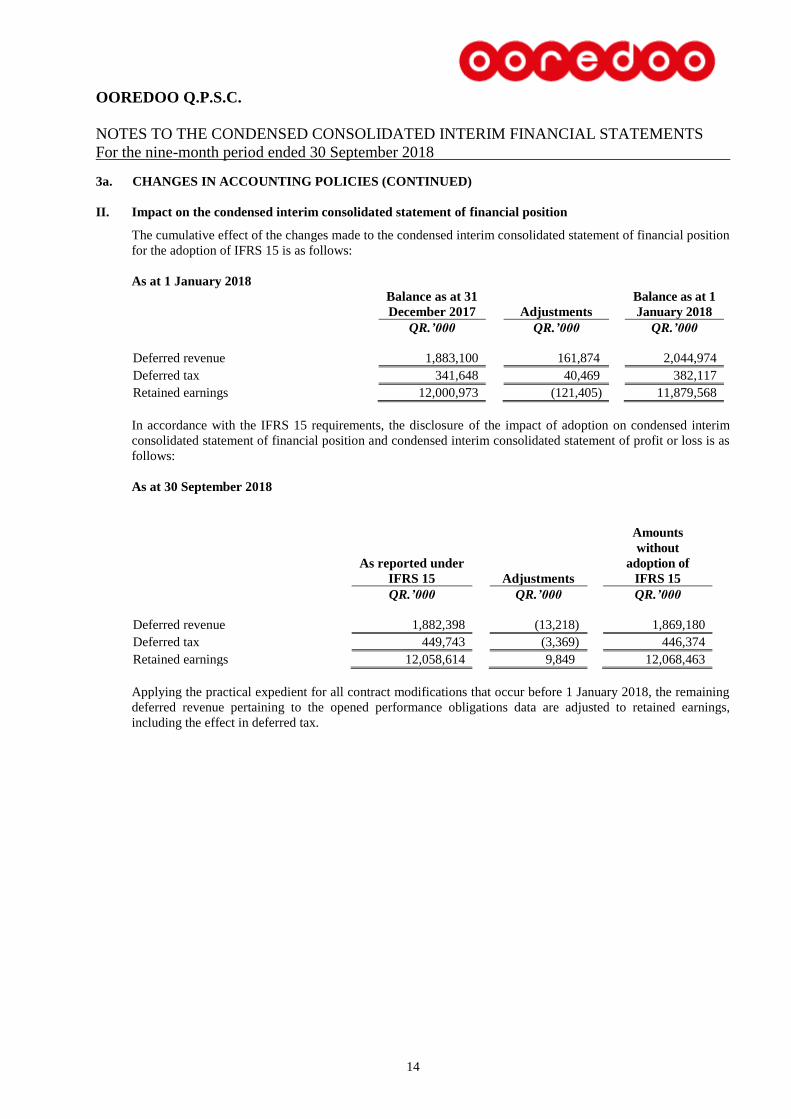
II. Impact on the condensed interim consolidated statement of financial position
The cumulative effect of the changes made to the condensed interim consolidated statement of financial position
for the adoption of IFRS 15 is as follows:
As at 1 January 2018
Balance as at 31
December 2017
Adjustments
Balance as at 1
January 2018
QR.’000 QR.’000 QR.’000
Deferred revenue 1,883,100 161,874 2,044,974
Deferred tax 341,648 40,469 382,117
Retained earnings 12,000,973 (121,405) 11,879,568
In accordance with the IFRS 15 requirements, the disclosure of the impact of adoption on condensed interim
consolidated statement of financial position and condensed interim consolidated statement of profit or loss is as
follows:
As at 30 September 2018
As reported under
IFRS 15
Adjustments
Amounts
without
adoption of
IFRS 15
QR.’000 QR.’000 QR.’000
Deferred revenue 1,882,398 (13,218) 1,869,180
Deferred tax 449,743 (3,369) 446,374
Retained earnings 12,058,614 9,849 12,068,463
Applying the practical expedient for all contract modifications that occur before 1 January 2018, the remaining
deferred revenue pertaining to the opened performance obligations data are adjusted to retained earnings,
including the effect in deferred tax.
OOREDOO Q.P.S.C.
NOTES TO THE CONDENSED CONSOLIDATED INTERIM FINANCIAL STATEMENTS
For the nine-month period ended 30 September 2018
15
3a. CHANGES IN ACCOUNTING POLICIES (CONTINUED)
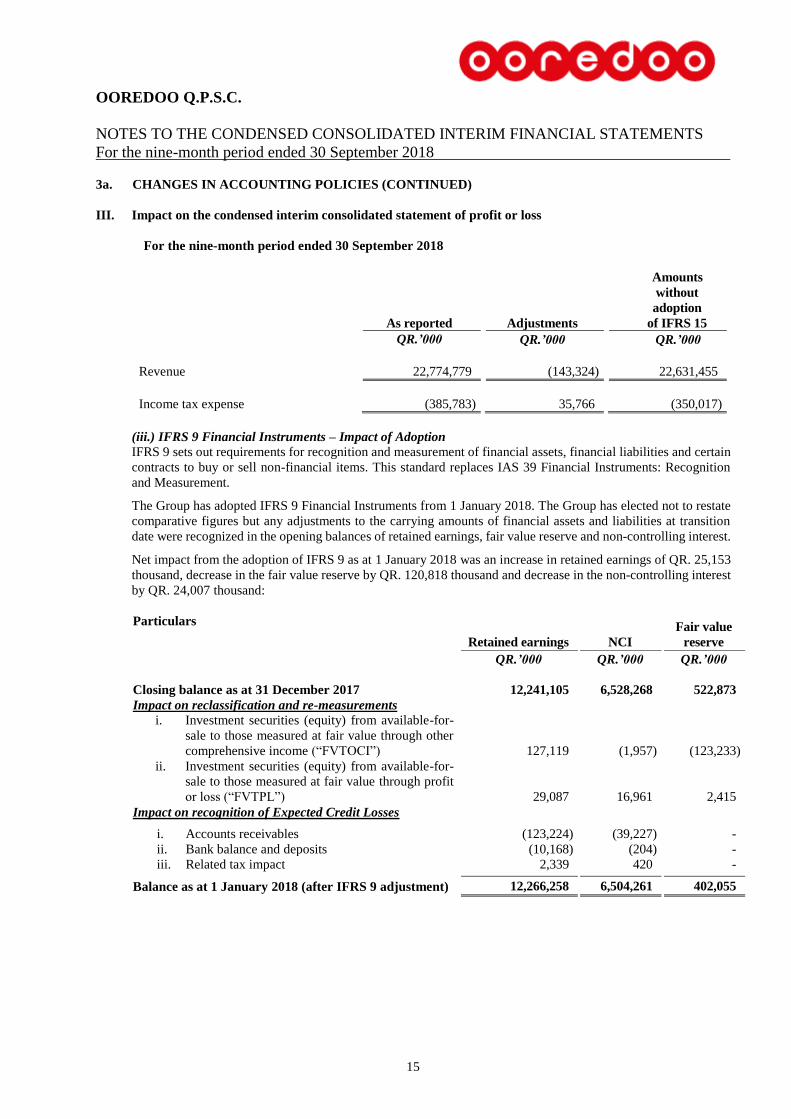
III. Impact on the condensed interim consolidated statement of profit or loss
For the nine-month period ended 30 September 2018
As reported Adjustments
Amounts
without
adoption
of IFRS 15
QR.’000 QR.’000 QR.’000
Revenue 22,774,779 (143,324) 22,631,455
Income tax expense (385,783) 35,766 (350,017)
(iii.) IFRS 9 Financial Instruments – Impact of Adoption
IFRS 9 sets out requirements for recognition and measurement of financial assets, financial liabilities and certain
contracts to buy or sell non-financial items. This standard replaces IAS 39 Financial Instruments: Recognition
and Measurement.
The Group has adopted IFRS 9 Financial Instruments from 1 January 2018. The Group has elected not to restate
comparative figures but any adjustments to the carrying amounts of financial assets and liabilities at transition
date were recognized in the opening balances of retained earnings, fair value reserve and non-controlling interest.
Net impact from the adoption of IFRS 9 as at 1 January 2018 was an increase in retained earnings of QR. 25,153
thousand, decrease in the fair value reserve by QR. 120,818 thousand and decrease in the non-controlling interest
by QR. 24,007 thousand:
Particulars
Retained earnings NCI
Fair value
reserve
QR.’000 QR.’000 QR.’000
Closing balance as at 31 December 2017 12,241,105 6,528,268 522,873
Impact on reclassification and re-measurements
i. Investment securities (equity) from available-for-
sale to those measured at fair value through other
comprehensive income (“FVTOCI”) 127,119 (1,957) (123,233)
ii. Investment securities (equity) from available-for-
sale to those measured at fair value through profit
or loss (“FVTPL”) 29,087 16,961 2,415
Impact on recognition of Expected Credit Losses
i. Accounts receivables (123,224) (39,227) -
ii. Bank balance and deposits (10,168) (204) -
iii. Related tax impact 2,339 420 -
Balance as at 1 January 2018 (after IFRS 9 adjustment) 12,266,258 6,504,261 402,055
OOREDOO Q.P.S.C.
NOTES TO THE CONDENSED CONSOLIDATED INTERIM FINANCIAL STATEMENTS
For the nine-month period ended 30 September 2018
16
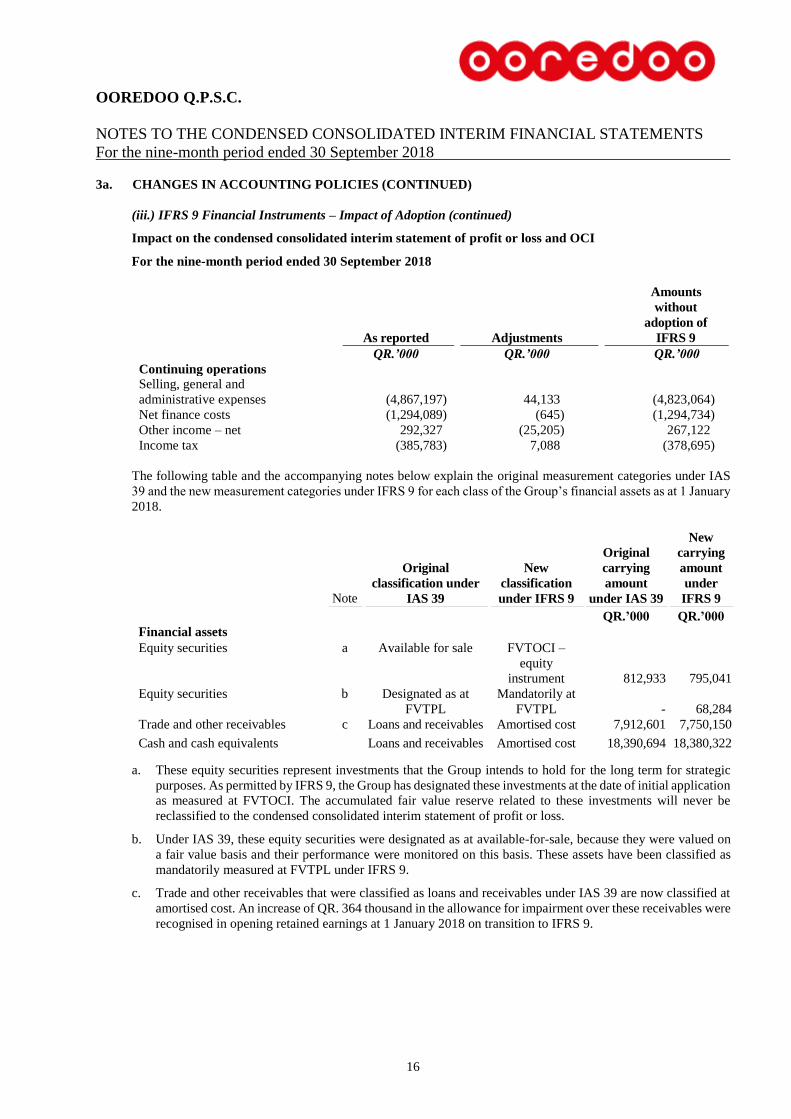
3a. CHANGES IN ACCOUNTING POLICIES (CONTINUED)
(iii.) IFRS 9 Financial Instruments – Impact of Adoption (continued)
Impact on the condensed consolidated interim statement of profit or loss and OCI
For the nine-month period ended 30 September 2018
As reported Adjustments
Amounts
without
adoption of
IFRS 9
QR.’000 QR.’000 QR.’000
Continuing operations
Selling, general and
administrative expenses
(4,867,197) 44,133 (4,823,064)
Net finance costs (1,294,089) (645) (1,294,734)
Other income – net 292,327 (25,205) 267,122
Income tax (385,783) 7,088 (378,695)
The following table and the accompanying notes below explain the original measurement categories under IAS
39 and the new measurement categories under IFRS 9 for each class of the Group’s financial assets as at 1 January
2018.
Note
Original
classification under
IAS 39
New
classification
under IFRS 9
Original
carrying
amount
under IAS 39
New
carrying
amount
under
IFRS 9
QR.’000 QR.’000
Financial assets
Equity securities a Available for sale FVTOCI –
equity
instrument 812,933 795,041
Equity securities b Designated as at
FVTPL
Mandatorily at
FVTPL - 68,284
Trade and other receivables c Loans and receivables Amortised cost 7,912,601 7,750,150
Cash and cash equivalents Loans and receivables Amortised cost 18,390,694 18,380,322
a. These equity securities represent investments that the Group intends to hold for the long term for strategic
purposes. As permitted by IFRS 9, the Group has designated these investments at the date of initial application
as measured at FVTOCI. The accumulated fair value reserve related to these investments will never be
reclassified to the condensed consolidated interim statement of profit or loss.
b. Under IAS 39, these equity securities were designated as at available-for-sale, because they were valued on
a fair value basis and their performance were monitored on this basis. These assets have been classified as
mandatorily measured at FVTPL under IFRS 9.
c. Trade and other receivables that were classified as loans and receivables under IAS 39 are now classified at
amortised cost. An increase of QR. 364 thousand in the allowance for impairment over these receivables were
recognised in opening retained earnings at 1 January 2018 on transition to IFRS 9.
OOREDOO Q.P.S.C.
NOTES TO THE CONDENSED CONSOLIDATED INTERIM FINANCIAL STATEMENTS
For the nine-month period ended 30 September 2018
17
3a. CHANGES IN ACCOUNTING POLICIES (CONTINUED)
(iv.) IFRS 9 Financial Instruments– Accounting Policies applied from 1 January 2018
a. Investments and other financial assets
Classification
From 1 January 2018, the Group classified its financial assets in the following categories:
Those to be measured subsequently at fair value through OCI without recycling;
Those to be measured subsequently at fair value through profit or loss; and
Those to be measured at amortised cost.
The Group performed a detailed analysis of its business models for managing financial assets as well as analysing
the contractual terms of the cash flows. There were no changes to the classification and measurement of financial
liabilities.
Measurement
At initial recognition, the Group measures a financial asset at its fair value plus, in the case of a financial asset
not at fair value through profit or loss, transaction costs that are directly attributable to the acquisition of the
financial asset. Transaction costs of financial assets carried at fair value through profit or loss are expensed in the
condensed consolidated statement of profit or loss.
The following accounting policies apply to the subsequent measurement of financial assets.
Financial assets at FVTPL These assets are subsequently measured at fair value. Net gains and
losses, including any interest or dividend income, are recognised in
profit or loss. See (iii) below for derivatives designated as hedging
instruments.
Financial assets at amortised cost These assets are subsequently measured at amortised cost using the
effective interest method. The amortised cost is reduced by impairment
losses (see (ii) below). Interest income, foreign exchange gains and
losses and impairment are recognised in profit or loss. Any gain or loss
on derecognition is recognised in profit or loss.
Debt investments at FVOCI These assets are subsequently measured at fair value. Interest income
calculated using the effective interest method, foreign exchange gains
and losses and impairment are recognised in profit or loss. Other net
gains and losses are recognised in OCI. On derecognition, gains and
losses accumulated in OCI are reclassified to profit or loss.
Equity investments at FVOCI These assets are subsequently measured at fair value. Dividends are
recognised as income in profit or loss unless the dividend clearly
represents a recovery of part of the cost of the investment. Other net
gains and losses are recognised in OCI and are never reclassified to
profit or loss.
Equity instruments
The Group subsequently measures all equity investments at fair value. Where the Group’s management has
elected to present fair value gains and losses on equity investments in other comprehensive income, there is no
subsequent reclassification of fair value gains and losses to profit or loss. Dividends from such investments
continue to be recognised in condensed consolidated interim statement of profit or loss as other income when the
Group’s right to receive payments is established.
Changes in the fair value of financial assets at fair value through profit or loss are recognised in other gain/(losses)
in the condensed consolidated interim statement of profit or loss as applicable. Impairment losses (and reversal
of impairment losses) on equity investments measured at FVTOCI are not reported separately from the changes
in fair value.
Impairment
IFRS 9 replaces the ‘incurred loss’ model in IAS 39 with an ‘expected credit loss’ model. The new impairment
model applies to accounts receivable, bank deposits, financialguarantees and loan commitments. The Group
applied a simplified approach to measuring expected credit losses (“ECL”).
OOREDOO Q.P.S.C.
NOTES TO THE CONDENSED CONSOLIDATED INTERIM FINANCIAL STATEMENTS
For the nine-month period ended 30 September 2018
18
3a. CHANGES IN ACCOUNTING POLICIES (CONTINUED)
(iv.) IFRS 9 Financial Instruments– Accounting Policies applied from 1 January 2018 (continued)
Significant increase in credit risk
When determining the risk of default the Group considers both quantitative and qualitative information and
analysis based on the Group’s historical experience and expert credit assessment and including forward-looking
information.
Generating the term structure of Probability of Default (PD)
The Group employs statistical models to analyse the data collected and generate estimates of PD of exposures
with the passage of time. This analysis includes the identification for any changes in default rates and changes in
key macro-economic factors across various geographies of the Group.
(v) Fair value accounting
The Group accounts for its share in the results, assets and liabilities of one of its joint ventures which is an
investment entity and measured at fair value using equity method of accounting.
Changes in judgement, estimate and risk management
Classification of investment securities
On acquisition of an investment security, the Group decides whether it should be classified as fair value through
profit or loss or fair value through other comprehensive income or financial assets to be measured at amortized
cost.
The Group follows the guidance of IFRS 9 on classifying its investments in securities. Business models and Solely Payments of Principal and Interest (“SPPI”) as significant judgments
Determining the appropriate business models and assessing the SPPI requirements for financial assets may require
significant accounting judgement and have a significant impact on the condensed consolidated interim financial
statements. Details of the Group’s classification of financial assets are given in Note 3a (iii).
Measurement of the expected credit loss allowance
The measurement of the expected credit loss allowance for financial assets measured at amortised cost and
applicable FVTOCI is an area that requires the use of complex models and significant assumptions about future
economic conditions and credit behaviour (e.g. the likelihood of customers defaulting and the resulting losses).
A number of significant judgements are also required in applying the accounting requirements for measuring
ECL, such as:
Determining criteria for significant increase in credit risk;
Choosing appropriate models and assumptions for the measurement of ECL;
Establishing the number and relative weightings of forward-looking scenarios for each type of
product/market and the associated ECL; and
Establishing groups of similar financial assets for the purposes of measuring ECL.
Principal versus agent
The Group determines whether it is acting as a principal or an agent, for each of the arrangement, to provide good
or service promised to the customer by:
a) identifying the specified goods or services to be provided to the customer; and
b) assessing whether it controls each specified good or service before that good or service is transferred to the
customer.
The Group is a principal if it controls the specified good or service before that good or service is transferred to a
customer while the Group is an agent if the Group’s performance obligation is to arrange for the delivery of the
specified good or service for another party.
OOREDOO Q.P.S.C.
NOTES TO THE CONDENSED CONSOLIDATED INTERIM FINANCIAL STATEMENTS
For the nine-month period ended 30 September 2018
19
3a. CHANGES IN ACCOUNTING POLICIES (CONTINUED)
Recognition revenue
Management considers recognizing revenue overtime, if one of the following criteria is met, otherwise revenue
will be recognized at a point in time:
a) the customer simultaneously receives and consumes the benefits provided by the Group’s performance as
the Group performs;
b) the Group’s performance creates or enhances an asset that the customer controls as the asset is created or
enhanced; or
c) the Group’s performance does not create an asset with an alternative use to the entity and the entity has an
enforceable right to payment for performance completed to date.
Capitalisation of costs
Management determines whether the Group will recognise an asset from the costs incurred to fulfil a contract if
the costs meet all the following criteria:
a) the costs relate directly to a contract or to an anticipated contract that the Group can specifically identify;
b) the costs generate or enhance resources of the Group that will be used in satisfying performance obligations
in the future; and
c) the costs are expected to be recovered.
Such asset will be amortised on a systematic basis that is consistent with the transfer to the customer of the goods
or services to which the asset relates.
The Group's financial risk management objectives and policies are consistent with those disclosed in the Group’s
annual consolidated financial statements as at and for the year ended 31 December 2017, except for the below:
Credit risk measurement
The assessment of credit risk of a portfolio of assets entails further estimations as to the likelihood of defaults
occurring, of the associated loss ratios and of default correlations between counterparties. The Group measures
credit risk using Probability of Default (PD), Exposure at Default (EAD) and Loss Given Default (LGD).
Credit quality assessments
The Group has mapped its internal credit rating scale to Moody’s rating scale as at 30 September 2018.
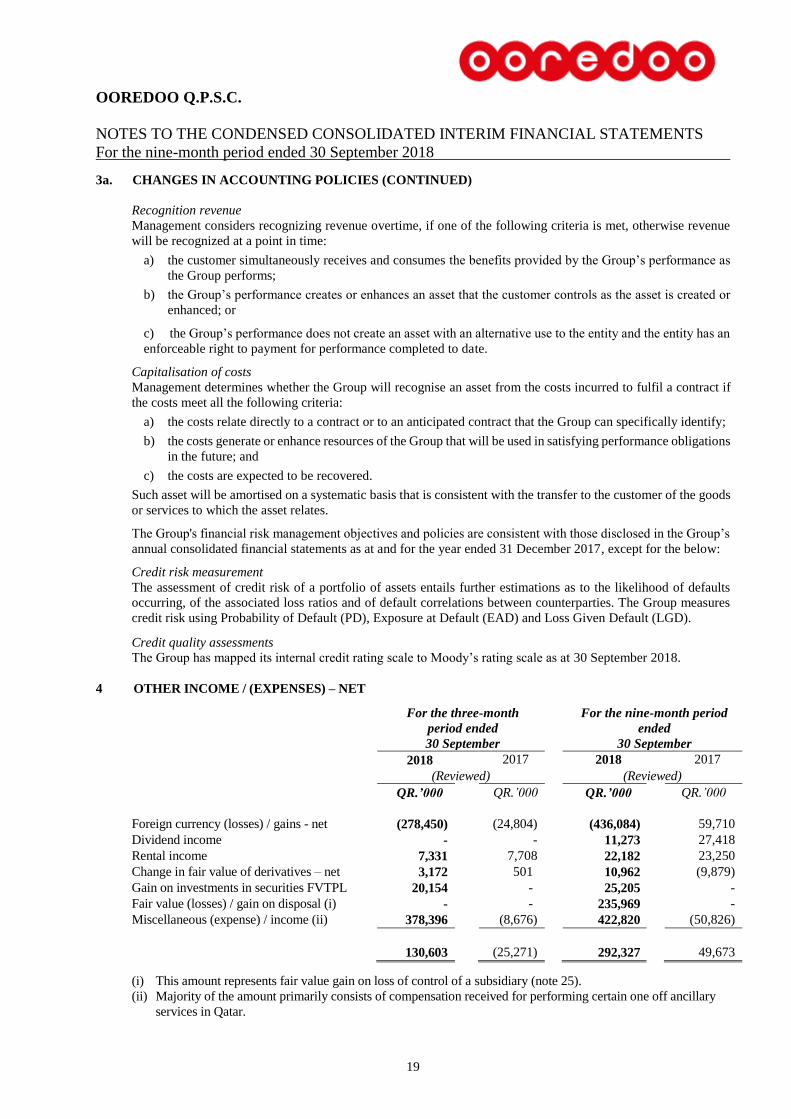
4 OTHER INCOME / (EXPENSES) – NET
For the three-month
period ended
30 September
For the nine-month period
ended
30 September
2018 2017 2018 2017
(Reviewed) (Reviewed)
QR.’000 QR.’000 QR.’000 QR.’000
Foreign currency (losses) / gains - net (278,450) (24,804) (436,084) 59,710
Dividend income - - 11,273 27,418
Rental income 7,331 7,708 22,182 23,250
Change in fair value of derivatives – net 3,172 501 10,962 (9,879)
Gain on investments in securities FVTPL 20,154 - 25,205 -
Fair value (losses) / gain on disposal (i) - - 235,969 -
Miscellaneous (expense) / income (ii) 378,396 (8,676) 422,820 (50,826)
130,603 (25,271) 292,327 49,673
(i) This amount represents fair value gain on loss of control of a subsidiary (note 25).
(ii) Majority of the amount primarily consists of compensation received for performing certain one off ancillary
services in Qatar.
OOREDOO Q.P.S.C.
NOTES TO THE CONDENSED CONSOLIDATED INTERIM FINANCIAL STATEMENTS
For the nine-month period ended 30 September 2018
20
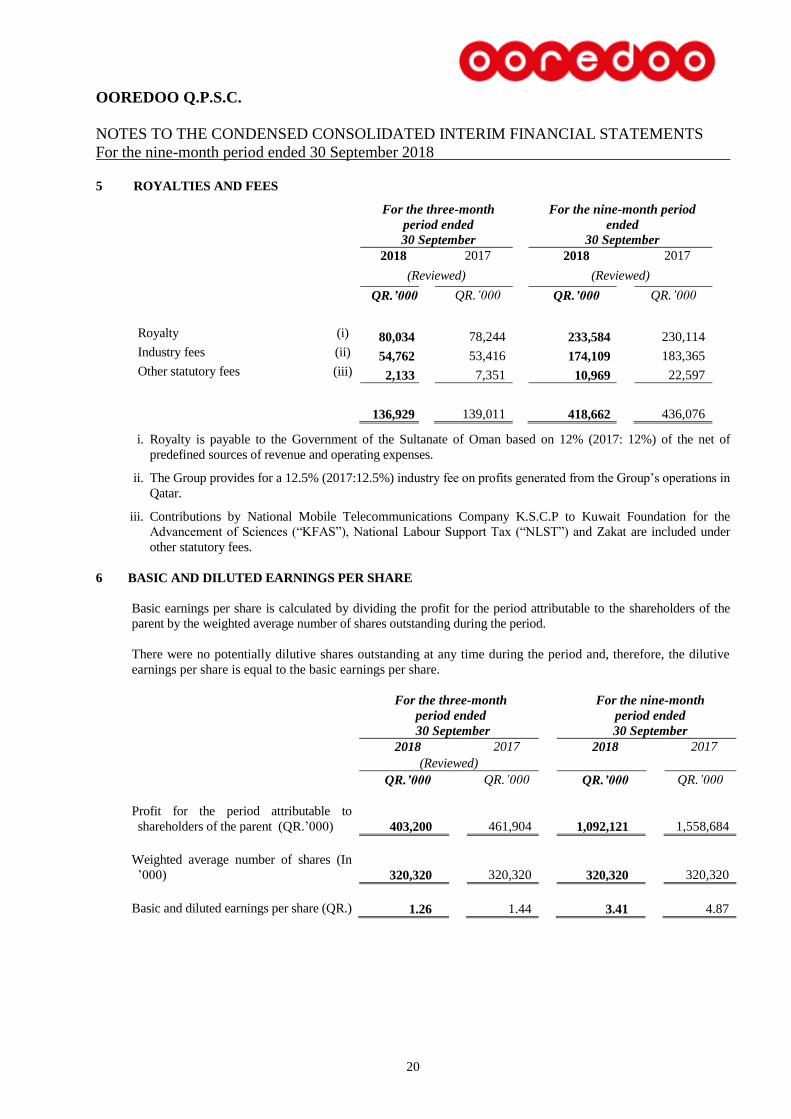
5 ROYALTIES AND FEES
For the three-month
period ended
30 September
For the nine-month period
ended
30 September
2018 2017 2018 2017
(Reviewed) (Reviewed)
QR.’000 QR.’000 QR.’000 QR.’000
Royalty (i) 80,034 78,244 233,584 230,114
Industry fees (ii) 54,762 53,416 174,109 183,365
Other statutory fees (iii) 2,133 7,351 10,969 22,597
136,929 139,011 418,662 436,076
i. Royalty is payable to the Government of the Sultanate of Oman based on 12% (2017: 12%) of the net of
predefined sources of revenue and operating expenses.
ii. The Group provides for a 12.5% (2017:12.5%) industry fee on profits generated from the Group’s operations in
Qatar.
iii. Contributions by National Mobile Telecommunications Company K.S.C.P to Kuwait Foundation for the
Advancement of Sciences (“KFAS”), National Labour Support Tax (“NLST”) and Zakat are included under
other statutory fees.
6 BASIC AND DILUTED EARNINGS PER SHARE
Basic earnings per share is calculated by dividing the profit for the period attributable to the shareholders of the
parent by the weighted average number of shares outstanding during the period.
There were no potentially dilutive shares outstanding at any time during the period and, therefore, the dilutive
earnings per share is equal to the basic earnings per share.
For the three-month
period ended
30 September
For the nine-month
period ended
30 September
2018 2017 2018 2017
(Reviewed)
QR.’000 QR.’000 QR.’000 QR.’000
Profit for the period attributable to
shareholders of the parent (QR.’000) 403,200
461,904
1,092,121 1,558,684
Weighted average number of shares (In
’000) 320,320
320,320
320,320 320,320
Basic and diluted earnings per share (QR.) 1.26 1.44 3.41 4.87
OOREDOO Q.P.S.C.
NOTES TO THE CONDENSED CONSOLIDATED INTERIM FINANCIAL STATEMENTS
For the nine-month period ended 30 September 2018
21
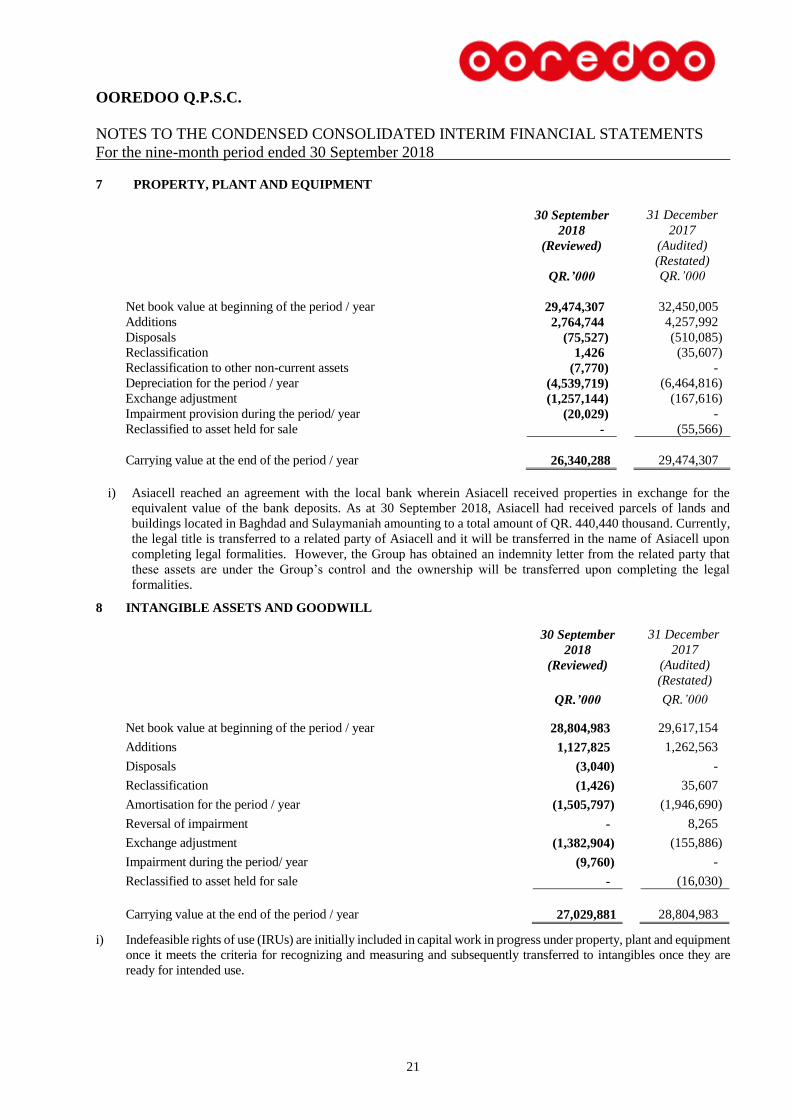
7 PROPERTY, PLANT AND EQUIPMENT
30 September 31 December
2018 2017
(Reviewed) (Audited)
(Restated)
QR.’000 QR.’000
Net book value at beginning of the period / year 29,474,307 32,450,005
Additions 2,764,744 4,257,992
Disposals (75,527) (510,085)
Reclassification 1,426 (35,607)
Reclassification to other non-current assets (7,770) -
Depreciation for the period / year (4,539,719) (6,464,816)
Exchange adjustment (1,257,144) (167,616)
Impairment provision during the period/ year (20,029) -
Reclassified to asset held for sale - (55,566)
Carrying value at the end of the period / year 26,340,288 29,474,307
i) Asiacell reached an agreement with the local bank wherein Asiacell received properties in exchange for the
equivalent value of the bank deposits. As at 30 September 2018, Asiacell had received parcels of lands and
buildings located in Baghdad and Sulaymaniah amounting to a total amount of QR. 440,440 thousand. Currently,
the legal title is transferred to a related party of Asiacell and it will be transferred in the name of Asiacell upon
completing legal formalities. However, the Group has obtained an indemnity letter from the related party that
these assets are under the Group’s control and the ownership will be transferred upon completing the legal
formalities.
8 INTANGIBLE ASSETS AND GOODWILL
30 September 31 December
2018 2017
(Reviewed) (Audited)
(Restated)
QR.’000 QR.’000
Net book value at beginning of the period / year 28,804,983 29,617,154
Additions 1,127,825 1,262,563
Disposals (3,040) -
Reclassification (1,426) 35,607
Amortisation for the period / year (1,505,797) (1,946,690)
Reversal of impairment - 8,265
Exchange adjustment (1,382,904) (155,886)
Impairment during the period/ year (9,760) -
Reclassified to asset held for sale - (16,030)
Carrying value at the end of the period / year 27,029,881 28,804,983
i) Indefeasible rights of use (IRUs) are initially included in capital work in progress under property, plant and equipment
once it meets the criteria for recognizing and measuring and subsequently transferred to intangibles once they are
ready for intended use.
OOREDOO Q.P.S.C.
NOTES TO THE CONDENSED CONSOLIDATED INTERIM FINANCIAL STATEMENTS
For the nine-month period ended 30 September 2018
22
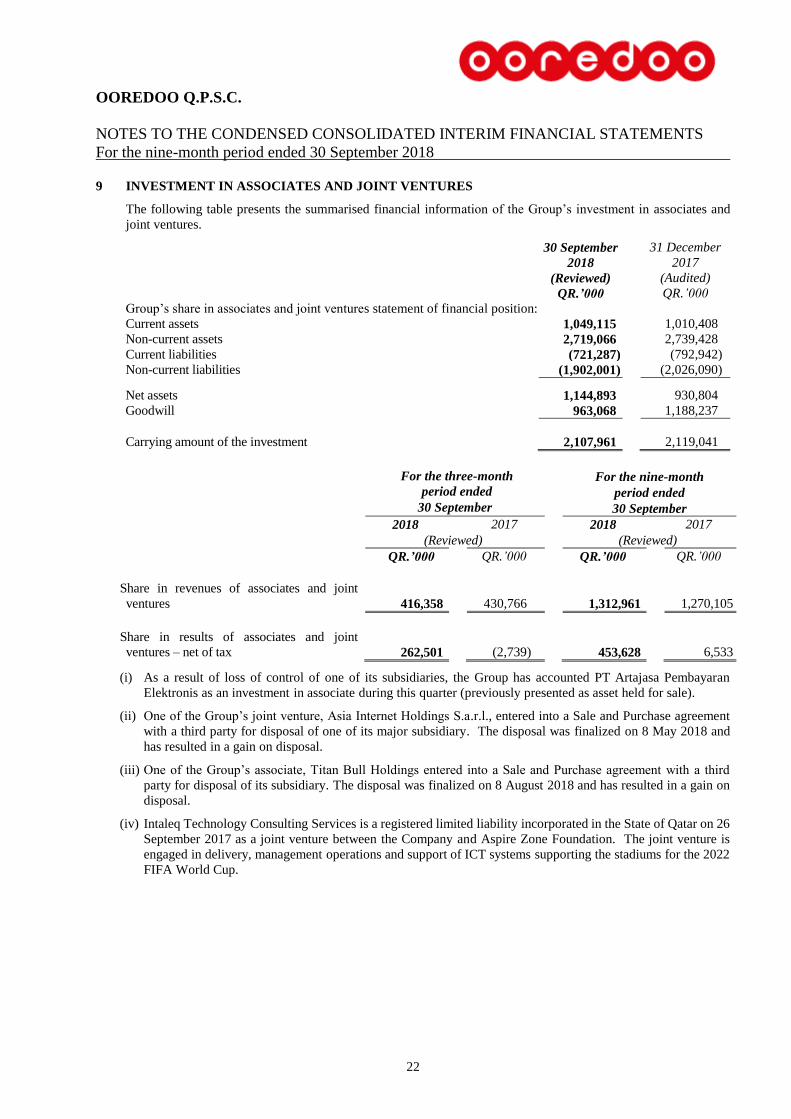
9 INVESTMENT IN ASSOCIATES AND JOINT VENTURES
The following table presents the summarised financial information of the Group’s investment in associates and
joint ventures.
30 September 31 December
2018 2017
(Reviewed) (Audited)
QR.’000 QR.’000
Group’s share in associates and joint ventures statement of financial position:
Current assets 1,049,115 1,010,408
Non-current assets 2,719,066 2,739,428
Current liabilities (721,287) (792,942)
Non-current liabilities (1,902,001) (2,026,090)
Net assets 1,144,893 930,804
Goodwill 963,068 1,188,237
Carrying amount of the investment 2,107,961 2,119,041
For the three-month
period ended
30 September
For the nine-month
period ended
30 September
2018 2017 2018 2017
(Reviewed) (Reviewed)
QR.’000 QR.’000 QR.’000 QR.’000
Share in revenues of associates and joint
ventures 416,358
430,766
1,312,961 1,270,105
Share in results of associates and joint
ventures – net of tax 262,501
(2,739)
453,628 6,533
(i) As a result of loss of control of one of its subsidiaries, the Group has accounted PT Artajasa Pembayaran
Elektronis as an investment in associate during this quarter (previously presented as asset held for sale).
(ii) One of the Group’s joint venture, Asia Internet Holdings S.a.r.l., entered into a Sale and Purchase agreement
with a third party for disposal of one of its major subsidiary. The disposal was finalized on 8 May 2018 and
has resulted in a gain on disposal.
(iii) One of the Group’s associate, Titan Bull Holdings entered into a Sale and Purchase agreement with a third
party for disposal of its subsidiary. The disposal was finalized on 8 August 2018 and has resulted in a gain on
disposal.
(iv) Intaleq Technology Consulting Services is a registered limited liability incorporated in the State of Qatar on 26
September 2017 as a joint venture between the Company and Aspire Zone Foundation. The joint venture is
engaged in delivery, management operations and support of ICT systems supporting the stadiums for the 2022
FIFA World Cup.
OOREDOO Q.P.S.C.
NOTES TO THE CONDENSED CONSOLIDATED INTERIM FINANCIAL STATEMENTS
For the nine-month period ended 30 September 2018
23
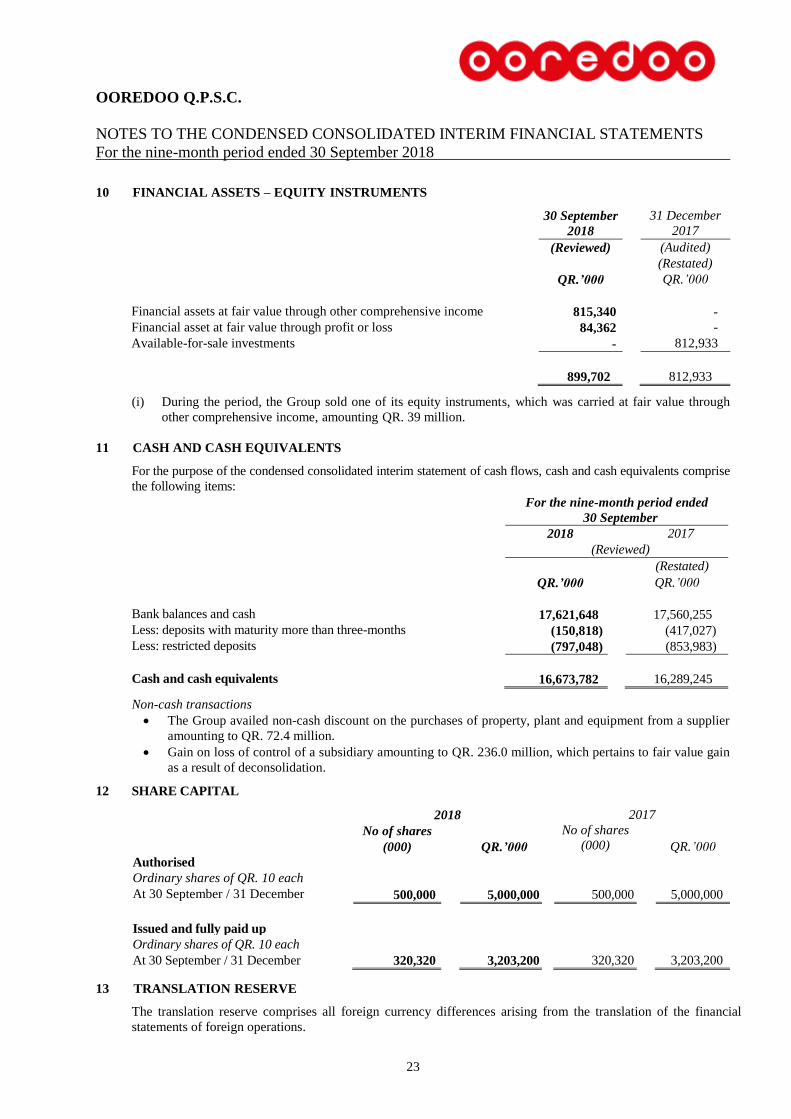
10 FINANCIAL ASSETS – EQUITY INSTRUMENTS
30 September 31 December
2018 2017
(Reviewed) (Audited)
(Restated)
QR.’000 QR.’000
Financial assets at fair value through other comprehensive income 815,340 -
Financial asset at fair value through profit or loss 84,362 -
Available-for-sale investments - 812,933
899,702 812,933
(i) During the period, the Group sold one of its equity instruments, which was carried at fair value through
other comprehensive income, amounting QR. 39 million.
11 CASH AND CASH EQUIVALENTS
For the purpose of the condensed consolidated interim statement of cash flows, cash and cash equivalents comprise
the following items:
For the nine-month period ended
30 September
2018 2017
(Reviewed)
(Restated)
QR.’000 QR.’000
Bank balances and cash 17,621,648 17,560,255
Less: deposits with maturity more than three-months (150,818) (417,027)
Less: restricted deposits (797,048) (853,983)
Cash and cash equivalents 16,673,782 16,289,245
Non-cash transactions
The Group availed non-cash discount on the purchases of property, plant and equipment from a supplier
amounting to QR. 72.4 million.
Gain on loss of control of a subsidiary amounting to QR. 236.0 million, which pertains to fair value gain
as a result of deconsolidation.
12 SHARE CAPITAL
2018 2017
No of shares
(000)
QR.’000
No of shares
(000)
QR.’000
Authorised
Ordinary shares of QR. 10 each
At 30 September / 31 December 500,000 5,000,000 500,000 5,000,000
Issued and fully paid up
Ordinary shares of QR. 10 each
At 30 September / 31 December 320,320 3,203,200 320,320 3,203,200
13 TRANSLATION RESERVE
The translation reserve comprises all foreign currency differences arising from the translation of the financial
statements of foreign operations.
OOREDOO Q.P.S.C.
NOTES TO THE CONDENSED CONSOLIDATED INTERIM FINANCIAL STATEMENTS
For the nine-month period ended 30 September 2018
24
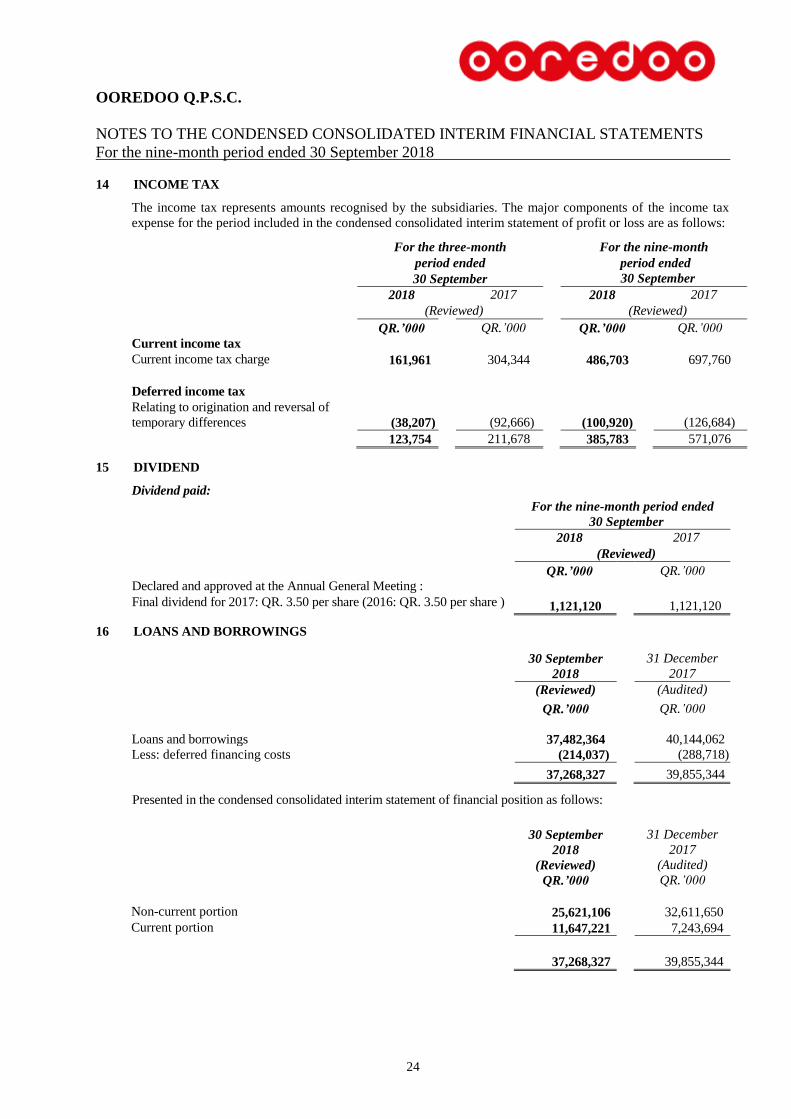
14 INCOME TAX
The income tax represents amounts recognised by the subsidiaries. The major components of the income tax
expense for the period included in the condensed consolidated interim statement of profit or loss are as follows:
For the three-month
period ended
30 September
For the nine-month
period ended
30 September
2018 2017 2018 2017
(Reviewed) (Reviewed)
QR.’000 QR.’000 QR.’000 QR.’000
Current income tax
Current income tax charge 161,961 304,344 486,703 697,760
Deferred income tax
Relating to origination and reversal of
temporary differences (38,207)
(92,666)
(100,920) (126,684)
123,754 211,678 385,783 571,076
15 DIVIDEND
Dividend paid:
For the nine-month period ended
30 September
2018 2017
(Reviewed)
QR.’000 QR.’000
Declared and approved at the Annual General Meeting :
Final dividend for 2017: QR. 3.50 per share (2016: QR. 3.50 per share ) 1,121,120 1,121,120
16 LOANS AND BORROWINGS
30 September 31 December
2018 2017
(Reviewed) (Audited)
QR.’000 QR.’000
Loans and borrowings 37,482,364 40,144,062
Less: deferred financing costs (214,037) (288,718)
37,268,327 39,855,344
Presented in the condensed consolidated interim statement of financial position as follows:
30 September 31 December
2018 2017
(Reviewed) (Audited)
QR.’000 QR.’000
Non-current portion 25,621,106 32,611,650
Current portion 11,647,221 7,243,694
37,268,327 39,855,344
OOREDOO Q.P.S.C.
NOTES TO THE CONDENSED CONSOLIDATED INTERIM FINANCIAL STATEMENTS
For the nine-month period ended 30 September 2018
25
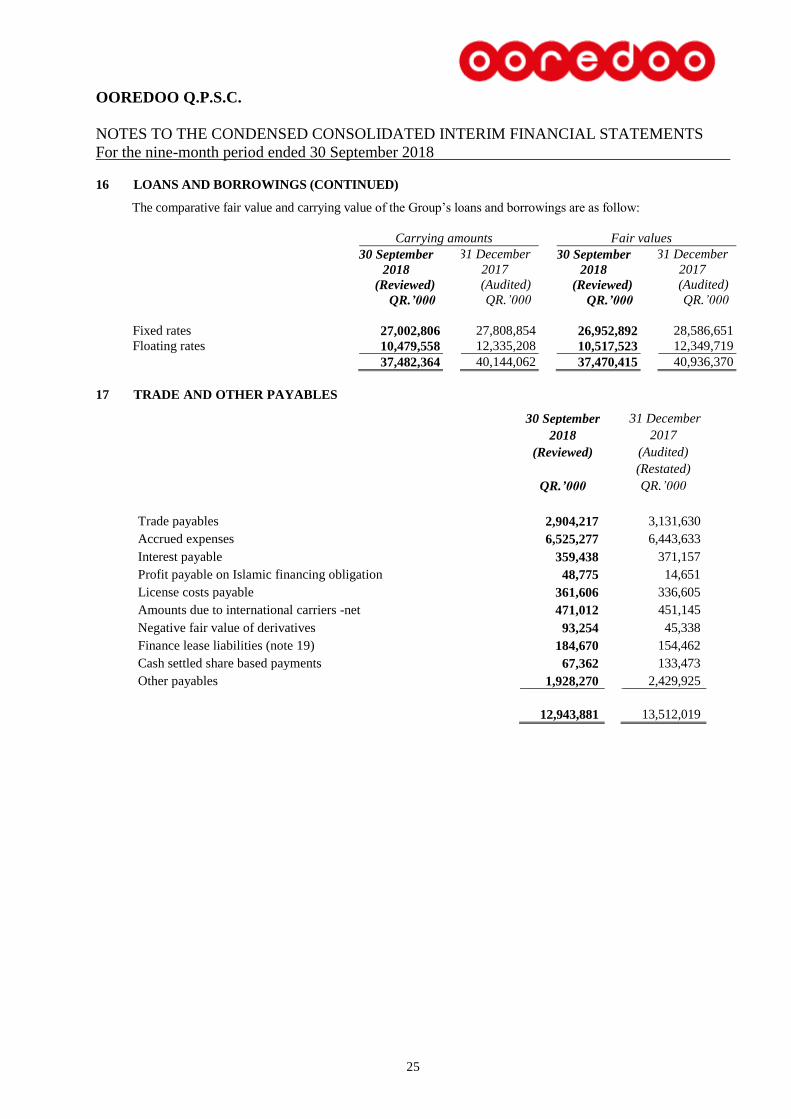
16 LOANS AND BORROWINGS (CONTINUED)
The comparative fair value and carrying value of the Group’s loans and borrowings are as follow:
Carrying amounts Fair values
30 September 31 December 30 September 31 December
2018 2017 2018 2017
(Reviewed) (Audited) (Reviewed) (Audited)
QR.’000 QR.’000 QR.’000 QR.’000
Fixed rates 27,002,806 27,808,854 26,952,892 28,586,651
Floating rates 10,479,558 12,335,208 10,517,523 12,349,719
37,482,364 40,144,062 37,470,415 40,936,370
17 TRADE AND OTHER PAYABLES
30 September 31 December
2018 2017
(Reviewed) (Audited)
(Restated)
QR.’000 QR.’000
Trade payables 2,904,217 3,131,630
Accrued expenses 6,525,277 6,443,633
Interest payable 359,438 371,157
Profit payable on Islamic financing obligation 48,775 14,651
License costs payable 361,606 336,605
Amounts due to international carriers -net 471,012 451,145
Negative fair value of derivatives 93,254 45,338
Finance lease liabilities (note 19) 184,670 154,462
Cash settled share based payments 67,362 133,473
Other payables 1,928,270 2,429,925
12,943,881 13,512,019
OOREDOO Q.P.S.C.
NOTES TO THE CONDENSED CONSOLIDATED INTERIM FINANCIAL STATEMENTS
For the nine-month period ended 30 September 2018
26
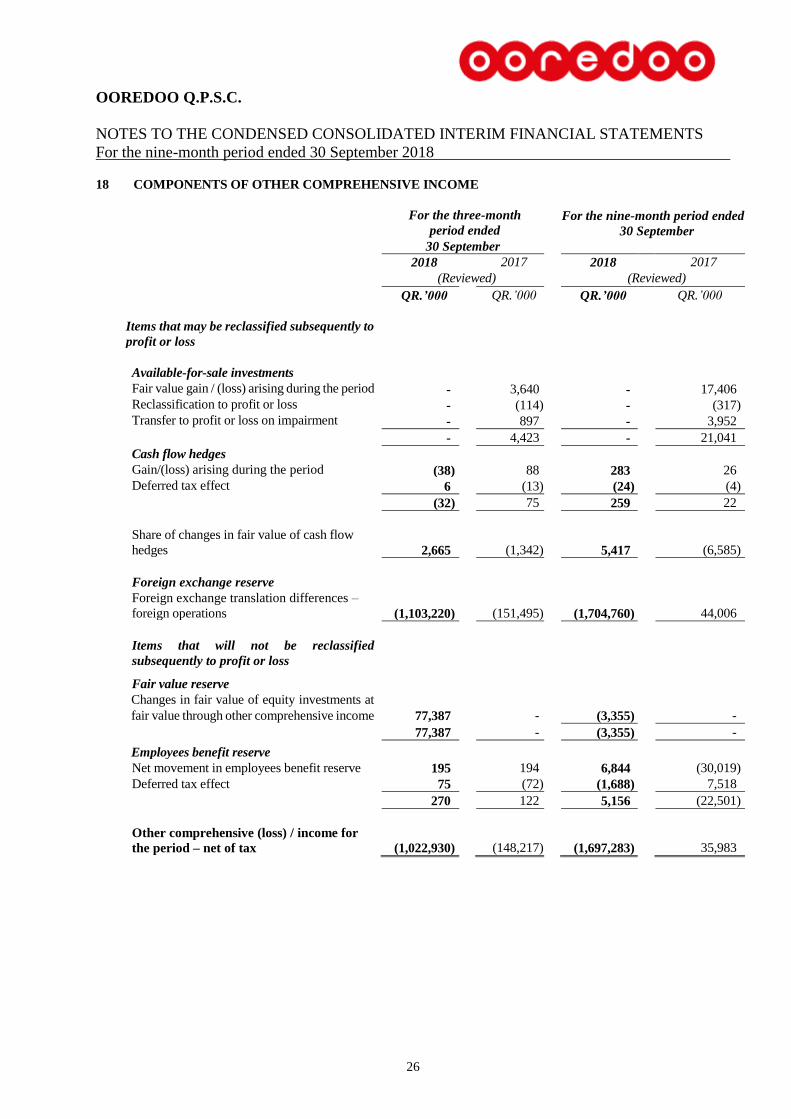
18 COMPONENTS OF OTHER COMPREHENSIVE INCOME
For the three-month
period ended
30 September
For the nine-month period ended
30 September
2018 2017 2018 2017
(Reviewed) (Reviewed)
QR.’000 QR.’000 QR.’000 QR.’000
Items that may be reclassified subsequently to
profit or loss
Available-for-sale investments
Fair value gain / (loss) arising during the period - 3,640 - 17,406
Reclassification to profit or loss - (114) - (317)
Transfer to profit or loss on impairment - 897 - 3,952
- 4,423 - 21,041
Cash flow hedges
Gain/(loss) arising during the period (38) 88 283 26
Deferred tax effect 6 (13) (24) (4)
(32) 75 259 22
Share of changes in fair value of cash flow
hedges 2,665
(1,342)
5,417 (6,585)
Foreign exchange reserve
Foreign exchange translation differences –
foreign operations (1,103,220) (151,495)
(1,704,760) 44,006
Items that will not be reclassified
subsequently to profit or loss
Fair value reserve
Changes in fair value of equity investments at
fair value through other comprehensive income 77,387
-
(3,355) -
77,387 - (3,355) -
Employees benefit reserve
Net movement in employees benefit reserve 195 194 6,844 (30,019)
Deferred tax effect 75 (72) (1,688) 7,518
270 122 5,156 (22,501)
Other comprehensive (loss) / income for
the period – net of tax (1,022,930) (148,217)
(1,697,283) 35,983
OOREDOO Q.P.S.C.
NOTES TO THE CONDENSED CONSOLIDATED INTERIM FINANCIAL STATEMENTS
For the nine-month period ended 30 September 2018
27
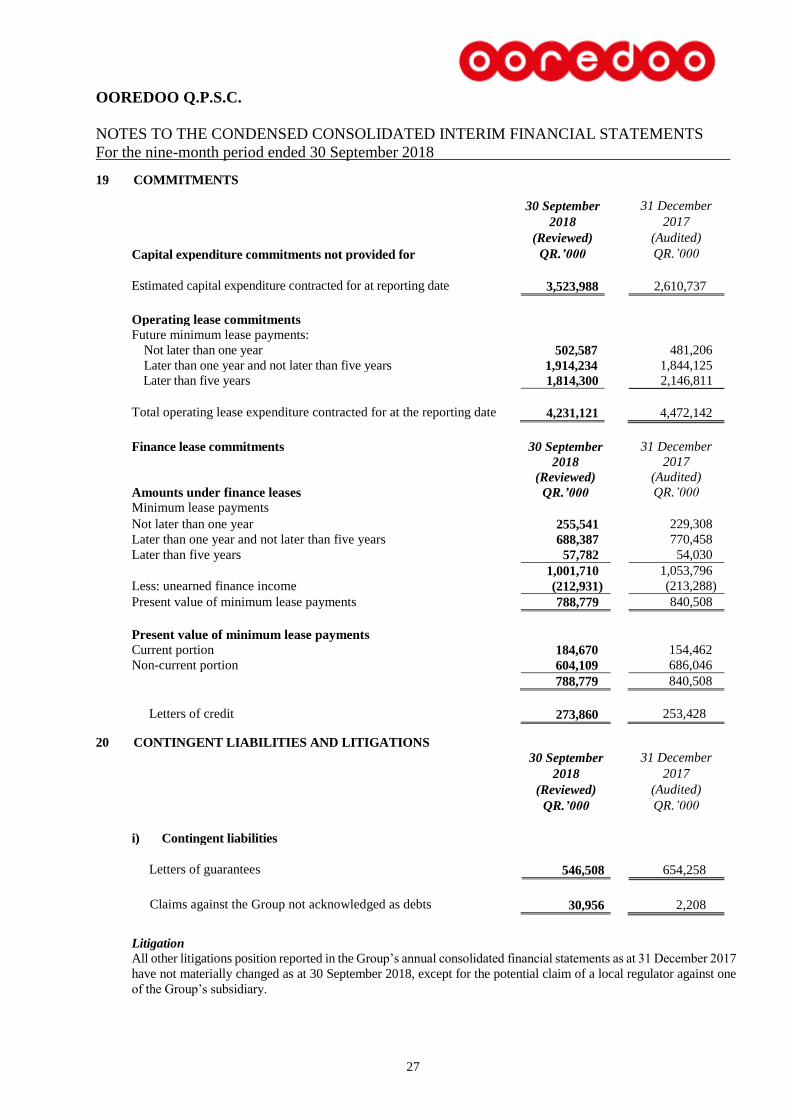
19 COMMITMENTS
30 September 31 December
2018 2017
(Reviewed) (Audited)
Capital expenditure commitments not provided for QR.’000 QR.’000
Estimated capital expenditure contracted for at reporting date 3,523,988 2,610,737
Operating lease commitments
Future minimum lease payments:
Not later than one year 502,587 481,206
Later than one year and not later than five years 1,914,234 1,844,125
Later than five years 1,814,300 2,146,811
Total operating lease expenditure contracted for at the reporting date 4,231,121 4,472,142
Finance lease commitments 30 September 31 December
2018 2017
(Reviewed) (Audited)
Amounts under finance leases QR.’000 QR.’000
Minimum lease payments
Not later than one year 255,541 229,308
Later than one year and not later than five years 688,387 770,458
Later than five years 57,782 54,030
1,001,710 1,053,796
Less: unearned finance income (212,931) (213,288)
Present value of minimum lease payments 788,779 840,508
Present value of minimum lease payments
Current portion 184,670 154,462
Non-current portion 604,109 686,046
788,779 840,508
Letters of credit 273,860 253,428
20 CONTINGENT LIABILITIES AND LITIGATIONS
30 September 31 December
2018 2017
(Reviewed) (Audited)
QR.’000 QR.’000
i) Contingent liabilities
Letters of guarantees 546,508 654,258
Claims against the Group not acknowledged as debts 30,956 2,208
Litigation
All other litigations position reported in the Group’s annual consolidated financial statements as at 31 December 2017
have not materially changed as at 30 September 2018, except for the potential claim of a local regulator against one
of the Group’s subsidiary.
OOREDOO Q.P.S.C.
NOTES TO THE CONDENSED CONSOLIDATED INTERIM FINANCIAL STATEMENTS
For the nine-month period ended 30 September 2018
28
21 RELATED PARTY DISCLOSURES
Related parties represent associated companies including Government and semi Government agencies, associates,
major shareholders, directors and key management personnel of the Group, and companies of which they are principal
owners. In the ordinary course of business, the Group enters into transactions with related parties. Pricing policies
and terms of transactions are approved by the Group’s management. The Group enters into commercial transactions
with Government related entities in the ordinary course of business in terms of providing telecommunication services,
placement of deposits and obtaining credit facilities etc.
a) Transactions with Government and related entities
As stated in Note 1, Qatar Holding L.L.C. is the Parent Company of Ooredoo Q.P.S.C. Group, which is controlled by
Qatar Investment Authority.
The Group enters into commercial transactions with the Government and other Government related entities in the
ordinary course of business, which includes providing telecommunication services, placement of deposits and
obtaining credit facilities. All these transactions are at arm’s length and in the normal course of business. Following
are the significant balances and transactions between the Company and the Government and other Government related
entities.
Trade receivables include an amount of QR. 336,646 thousand (2017: QR. 285,643 thousand) receivable
from Government and Government related entities.
Industry fee (Note 5) pertains to the industry fee payable to CRA, a Government related entity.
In accordance with IAS 24 Related Party Disclosures, the Group has elected not to disclose transactions with the
Qatar Government and other entities over which the Qatar Government exerts control, joint control or significant
influence. The nature of transactions that the Group has with such related parties relates to provision of
telecommunication services.
a) Transactions with Directors and other key management personnel
Key management personnel comprise the Board of Directors and key members of management having authority
and responsibility of planning, directing and controlling the activities of the Group.
The compensation and benefits related to Board of Directors and key management personnel amounted to
QR. 92,299 thousand for the three months ended 30 September 2018 (for the three months ended 30 September
2017: QR. 94,708 thousand) and QR. 276,354 thousand for the nine months ended 30 September 2018 (for the
nine months ended 30 September 2017: QR. 279,183 thousand) and end of service benefits amounted to QR.
2,948 thousand for the three months ended 30 September 2018 (for the three months ended 30 September 2017:
QR. 6,962 thousand) and QR. 10,811 thousand for the nine months ended 30 September 2018 (for the nine
months ended 30 September 2017: QR. 16,813 thousand). The remuneration to the Board of Directors and key
management personnel has been included under the caption “Selling, general and administrative expenses”.
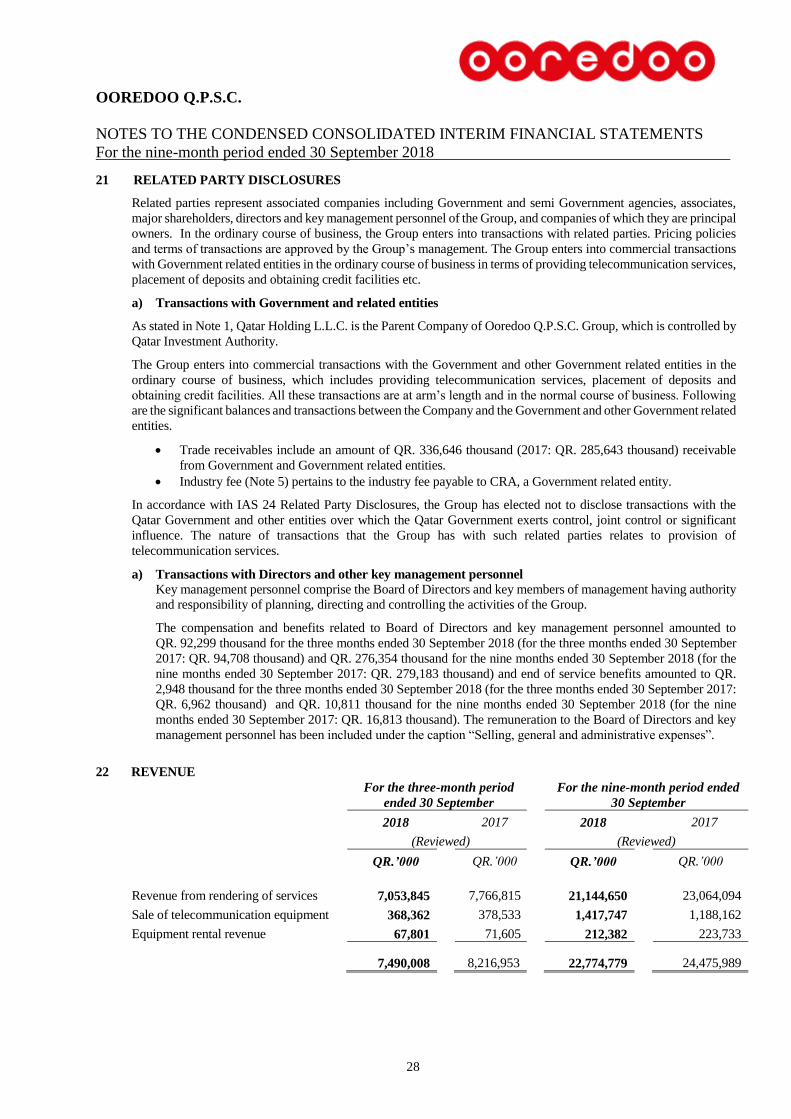
22 REVENUE
For the three-month period
ended 30 September
For the nine-month period ended
30 September
2018 2017 2018 2017
(Reviewed) (Reviewed)
QR.’000 QR.’000 QR.’000 QR.’000
Revenue from rendering of services 7,053,845 7,766,815 21,144,650 23,064,094
Sale of telecommunication equipment 368,362 378,533 1,417,747 1,188,162
Equipment rental revenue 67,801 71,605 212,382 223,733
7,490,008 8,216,953 22,774,779 24,475,989
OOREDOO Q.P.S.C.
NOTES TO THE CONDENSED CONSOLIDATED INTERIM FINANCIAL STATEMENTS
For the nine-month period ended 30 September 2018
29
23 SEGMENT INFORMATION
Information regarding the Group’s reportable segments is set out below in accordance with “IFRS 8 Operating
Segments”. IFRS 8 requires reportable segments to be identified on the basis of internal reports that are regularly
reviewed by the Group’s chief operating decision maker (“CODM”) and used to allocate resources to the segments
and to assess their performance.
The Group is mainly engaged in a single line of business, being the supply of telecommunications services and related
products. The majority of the Group’s revenues, profits and assets relate to its operations in the MENA. Outside of
Qatar, the Group operates through its subsidiaries and associates and major operations that are reported to the Group’s
CODM are considered by the Group to be reportable segment. Revenue is attributed to reportable segments based on
the location of the Group companies. Inter-segment sales are charged at arms’ length prices.
For management reporting purposes, the Group is organized into business units based on their geographical area
covered, and has seven reportable segments as follows:
1. Ooredoo Qatar is a provider of domestic and international telecommunication services within the State of Qatar;
2. Asiacell is a provider of mobile telecommunication services in Iraq;
3. NMTC group is a provider of mobile telecommunication services in Kuwait and elsewhere in the Middle East
and North African (MENA) region. NMTC group includes balances of Ooredoo Kuwait, Ooredoo Tunisia,
Ooredoo Algeria, Wataniya Palestine, Ooredoo Maldives PLC and others. Management believe that presenting
NMTC as one segment will provide the most relevant information to the users of the consolidated financial
statement of the Group, as NMTC is a public listed company in Kuwait and it presents detailed segment note
in its consolidated financial statements, which are publically available;
4. Indosat Ooredoo is a provider of telecommunication services such as cellular services, fixed
telecommunications, multimedia, data communication and internet services in Indonesia. The Group has
recorded a prior year adjustment related to revenue and provision for receivables of PT Indosat in opening
retained earnings amounting to QR. 106 million related to reversal of certain sales to distributors.
5. Ooredoo Oman is a provider of mobile and fixed telecommunication services in Oman;
6. Ooredoo Myanmar is a provider of mobile and fixed telecommunication services in Myanmar; and
7. Others include some of the Group’s subsidiaries which are providers of wireless and telecommunication
services.
Management monitors the operating results of its operating subsidiaries separately for the purpose of making
decisions about resource allocation and performance assessment. Segment performance is evaluated based on
operating profit or loss of these reportable segments. Transfer pricing between reportable segments are on an arm’s
length basis in a manner similar to transactions with third parties.
OOREDOO Q.P.S.C.
NOTES TO THE CONDENSED CONSOLIDATED INTERIM FINANCIAL STATEMENTS
For the nine-month period ended 30 September 2018
30
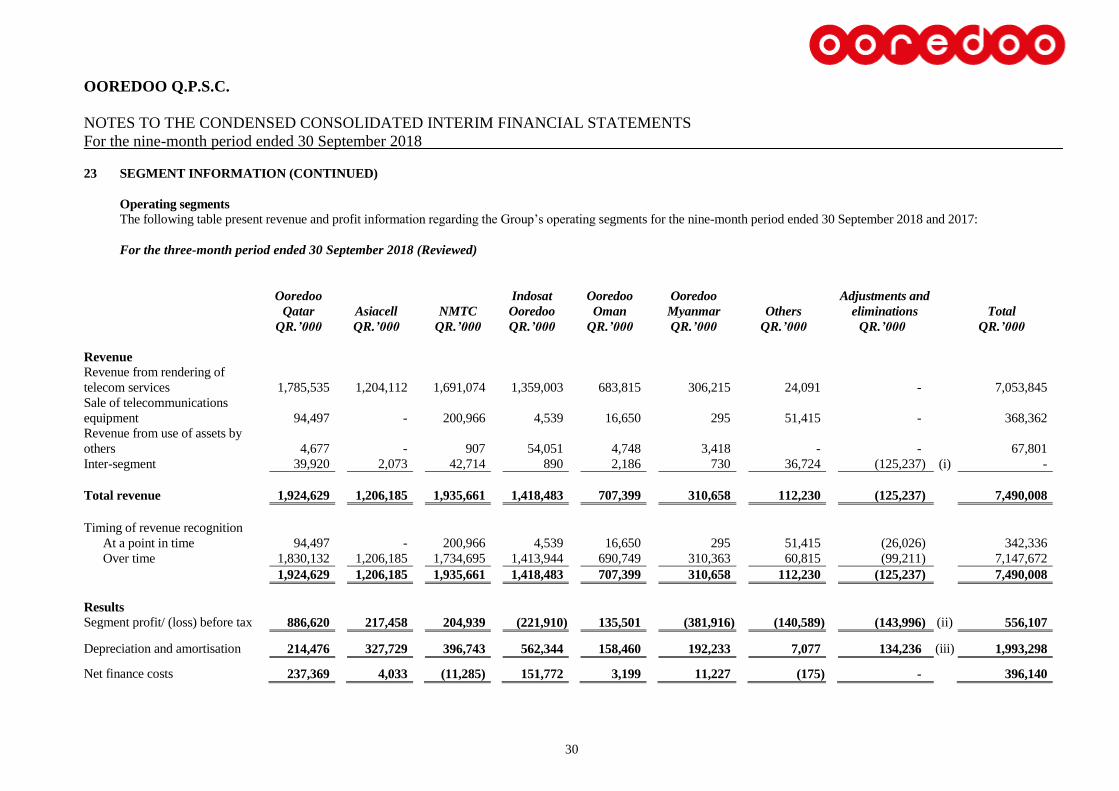
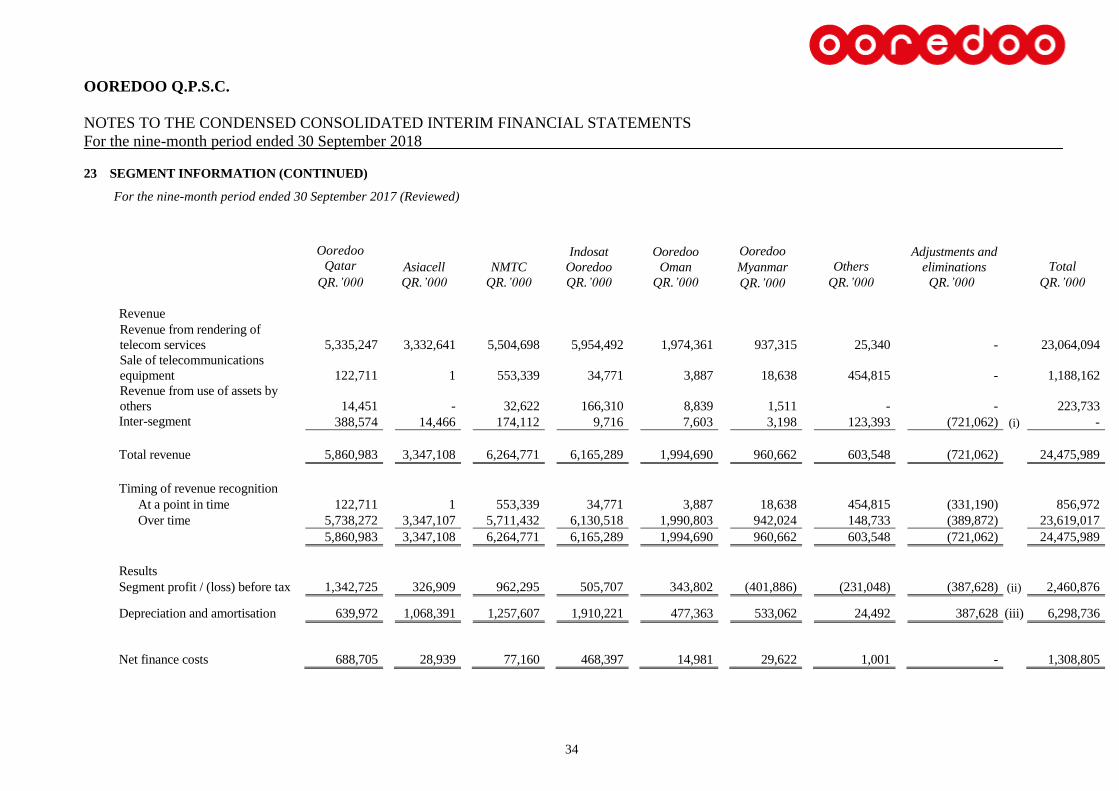
23 SEGMENT INFORMATION (CONTINUED)
Operating segments
The following table present revenue and profit information regarding the Group’s operating segments for the nine-month period ended 30 September 2018 and 2017:
For the three-month period ended 30 September 2018 (Reviewed)
Ooredoo
Qatar
Asiacell NMTC
Indosat
Ooredoo
Ooredoo
Oman
Ooredoo
Myanmar
Others
Adjustments and
eliminations
Total
QR.’000 QR.’000 QR.’000 QR.’000 QR.’000 QR.’000 QR.’000 QR.’000 QR.’000
Revenue
Revenue from rendering of
telecom services 1,785,535 1,204,112 1,691,074 1,359,003 683,815 306,215 24,091 - 7,053,845
Sale of telecommunications
equipment 94,497 - 200,966 4,539 16,650 295 51,415 - 368,362
Revenue from use of assets by
others 4,677 - 907 54,051 4,748 3,418 - - 67,801
Inter-segment 39,920 2,073 42,714 890 2,186 730 36,724 (125,237) (i) -
Total revenue 1,924,629 1,206,185 1,935,661 1,418,483 707,399 310,658 112,230 (125,237) 7,490,008
Timing of revenue recognition
At a point in time 94,497 - 200,966 4,539 16,650 295 51,415 (26,026) 342,336
Over time 1,830,132 1,206,185 1,734,695 1,413,944 690,749 310,363 60,815 (99,211) 7,147,672
1,924,629 1,206,185 1,935,661 1,418,483 707,399 310,658 112,230 (125,237) 7,490,008
Results
Segment profit/ (loss) before tax 886,620 217,458 204,939 (221,910) 135,501 (381,916) (140,589) (143,996) (ii) 556,107
Depreciation and amortisation 214,476 327,729 396,743 562,344 158,460 192,233 7,077 134,236 (iii) 1,993,298
Net finance costs 237,369 4,033 (11,285) 151,772 3,199 11,227 (175) - 396,140
OOREDOO Q.P.S.C.
NOTES TO THE CONDENSED CONSOLIDATED INTERIM FINANCIAL STATEMENTS
For the nine-month period ended 30 September 2018
31
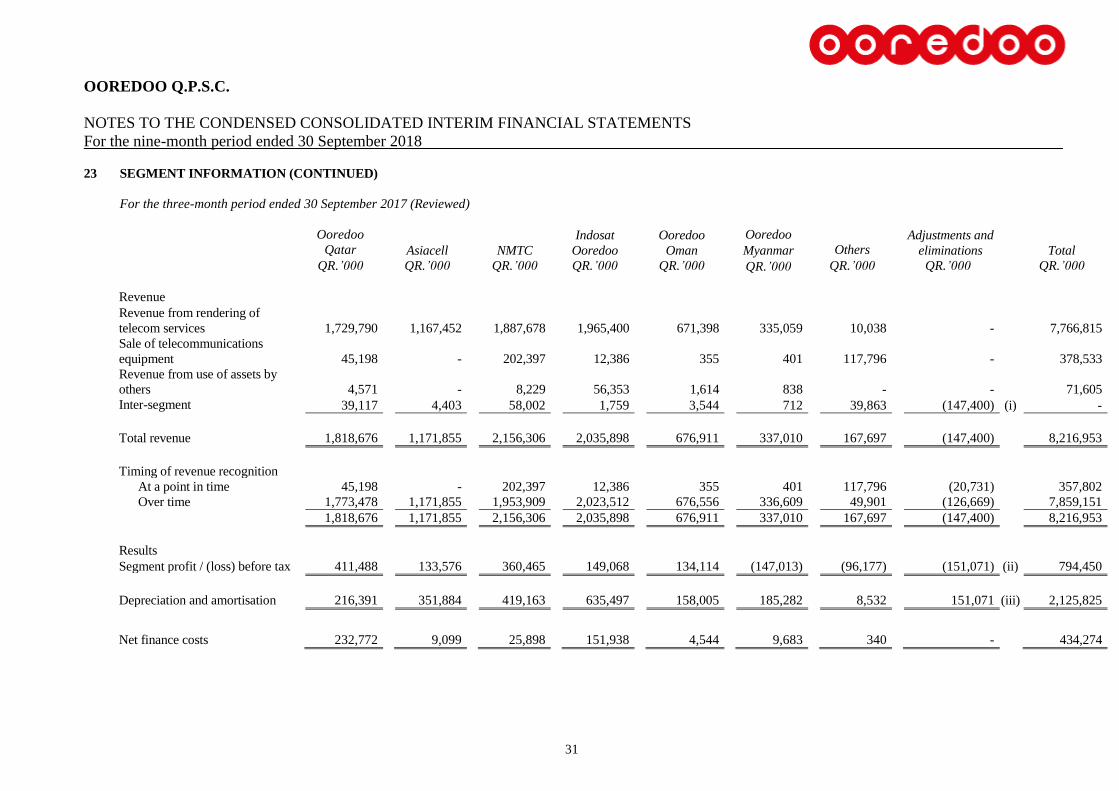
23 SEGMENT INFORMATION (CONTINUED)
For the three-month period ended 30 September 2017 (Reviewed)
Ooredoo
Qatar
Asiacell
NMTC
Indosat
Ooredoo
Ooredoo
Oman
Ooredoo
Myanmar
Others
Adjustments and
eliminations
Total
QR.’000 QR.’000 QR.’000 QR.’000 QR.’000 QR.’000 QR.’000 QR.’000 QR.’000
Revenue
Revenue from rendering of
telecom services 1,729,790 1,167,452 1,887,678 1,965,400 671,398 335,059 10,038 - 7,766,815
Sale of telecommunications
equipment 45,198 - 202,397 12,386 355 401 117,796 - 378,533
Revenue from use of assets by
others 4,571 - 8,229 56,353 1,614 838 - - 71,605
Inter-segment 39,117 4,403 58,002 1,759 3,544 712 39,863 (147,400) (i) -
Total revenue 1,818,676 1,171,855 2,156,306 2,035,898 676,911 337,010 167,697 (147,400) 8,216,953
Timing of revenue recognition
At a point in time 45,198 - 202,397 12,386 355 401 117,796 (20,731) 357,802
Over time 1,773,478 1,171,855 1,953,909 2,023,512 676,556 336,609 49,901 (126,669) 7,859,151
1,818,676 1,171,855 2,156,306 2,035,898 676,911 337,010 167,697 (147,400) 8,216,953
Results
Segment profit / (loss) before tax 411,488 133,576 360,465 149,068 134,114 (147,013) (96,177) (151,071) (ii) 794,450
Depreciation and amortisation 216,391 351,884 419,163 635,497 158,005 185,282 8,532 151,071 (iii) 2,125,825
Net finance costs 232,772 9,099 25,898 151,938 4,544 9,683 340 - 434,274
OOREDOO Q.P.S.C.
NOTES TO THE CONDENSED CONSOLIDATED INTERIM FINANCIAL STATEMENTS
For the nine-month period ended 30 September 2018
32
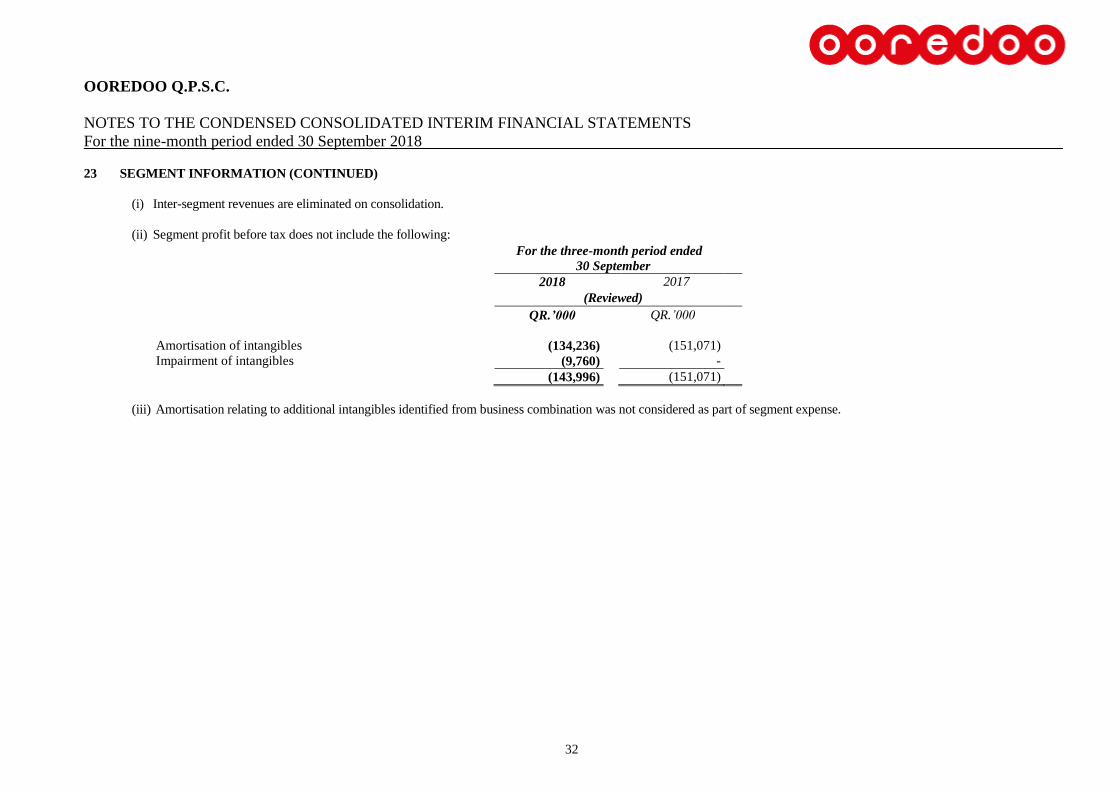
23 SEGMENT INFORMATION (CONTINUED)
(i) Inter-segment revenues are eliminated on consolidation.
(ii) Segment profit before tax does not include the following:
For the three-month period ended
30 September
2018 2017
(Reviewed)
QR.’000 QR.’000
Amortisation of intangibles (134,236) (151,071)
Impairment of intangibles (9,760) -
(143,996) (151,071)
(iii) Amortisation relating to additional intangibles identified from business combination was not considered as part of segment expense.
OOREDOO Q.P.S.C.
NOTES TO THE CONDENSED CONSOLIDATED INTERIM FINANCIAL STATEMENTS
For the nine-month period ended 30 September 2018
33
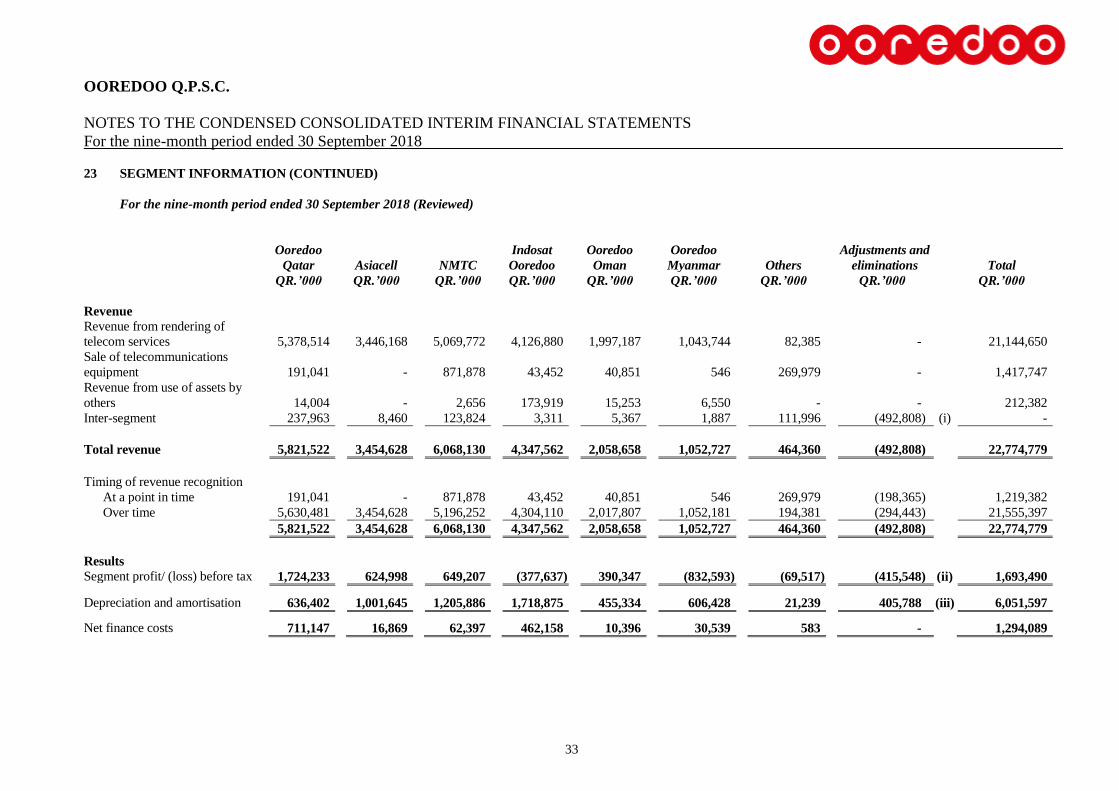
23 SEGMENT INFORMATION (CONTINUED)
For the nine-month period ended 30 September 2018 (Reviewed)
Ooredoo
Qatar
Asiacell NMTC
Indosat
Ooredoo
Ooredoo
Oman
Ooredoo
Myanmar
Others
Adjustments and
eliminations
Total
QR.’000 QR.’000 QR.’000 QR.’000 QR.’000 QR.’000 QR.’000 QR.’000 QR.’000
Revenue
Revenue from rendering of
telecom services 5,378,514 3,446,168 5,069,772 4,126,880 1,997,187 1,043,744 82,385 - 21,144,650
Sale of telecommunications
equipment 191,041 - 871,878 43,452 40,851 546 269,979 - 1,417,747
Revenue from use of assets by
others 14,004 - 2,656 173,919 15,253 6,550 - - 212,382
Inter-segment 237,963 8,460 123,824 3,311 5,367 1,887 111,996 (492,808) (i) -
Total revenue 5,821,522 3,454,628 6,068,130 4,347,562 2,058,658 1,052,727 464,360 (492,808) 22,774,779
Timing of revenue recognition
At a point in time 191,041 - 871,878 43,452 40,851 546 269,979 (198,365) 1,219,382
Over time 5,630,481 3,454,628 5,196,252 4,304,110 2,017,807 1,052,181 194,381 (294,443) 21,555,397
5,821,522 3,454,628 6,068,130 4,347,562 2,058,658 1,052,727 464,360 (492,808) 22,774,779
Results
Segment profit/ (loss) before tax 1,724,233 624,998 649,207 (377,637) 390,347 (832,593) (69,517) (415,548) (ii) 1,693,490
Depreciation and amortisation 636,402 1,001,645 1,205,886 1,718,875 455,334 606,428 21,239 405,788 (iii) 6,051,597
Net finance costs 711,147 16,869 62,397 462,158 10,396 30,539 583 - 1,294,089
OOREDOO Q.P.S.C.
NOTES TO THE CONDENSED CONSOLIDATED INTERIM FINANCIAL STATEMENTS
For the nine-month period ended 30 September 2018
34
23 SEGMENT INFORMATION (CONTINUED)
For the nine-month period ended 30 September 2017 (Reviewed)
Ooredoo
Qatar
Asiacell
NMTC
Indosat
Ooredoo
Ooredoo
Oman
Ooredoo
Myanmar
Others
Adjustments and
eliminations
Total
QR.’000 QR.’000 QR.’000 QR.’000 QR.’000 QR.’000 QR.’000 QR.’000 QR.’000
Revenue
Revenue from rendering of
telecom services 5,335,247 3,332,641 5,504,698 5,954,492 1,974,361 937,315 25,340 - 23,064,094
Sale of telecommunications
equipment 122,711 1 553,339 34,771 3,887 18,638 454,815 - 1,188,162
Revenue from use of assets by
others 14,451 - 32,622 166,310 8,839 1,511 - - 223,733
Inter-segment 388,574 14,466 174,112 9,716 7,603 3,198 123,393 (721,062) (i) -
Total revenue 5,860,983 3,347,108 6,264,771 6,165,289 1,994,690 960,662 603,548 (721,062) 24,475,989
Timing of revenue recognition
At a point in time 122,711 1 553,339 34,771 3,887 18,638 454,815 (331,190) 856,972
Over time 5,738,272 3,347,107 5,711,432 6,130,518 1,990,803 942,024 148,733 (389,872) 23,619,017
5,860,983 3,347,108 6,264,771 6,165,289 1,994,690 960,662 603,548 (721,062) 24,475,989
Results
Segment profit / (loss) before tax 1,342,725 326,909 962,295 505,707 343,802 (401,886) (231,048) (387,628) (ii) 2,460,876
Depreciation and amortisation 639,972 1,068,391 1,257,607 1,910,221 477,363 533,062 24,492 387,628 (iii) 6,298,736
Net finance costs 688,705 28,939 77,160 468,397 14,981 29,622 1,001 - 1,308,805
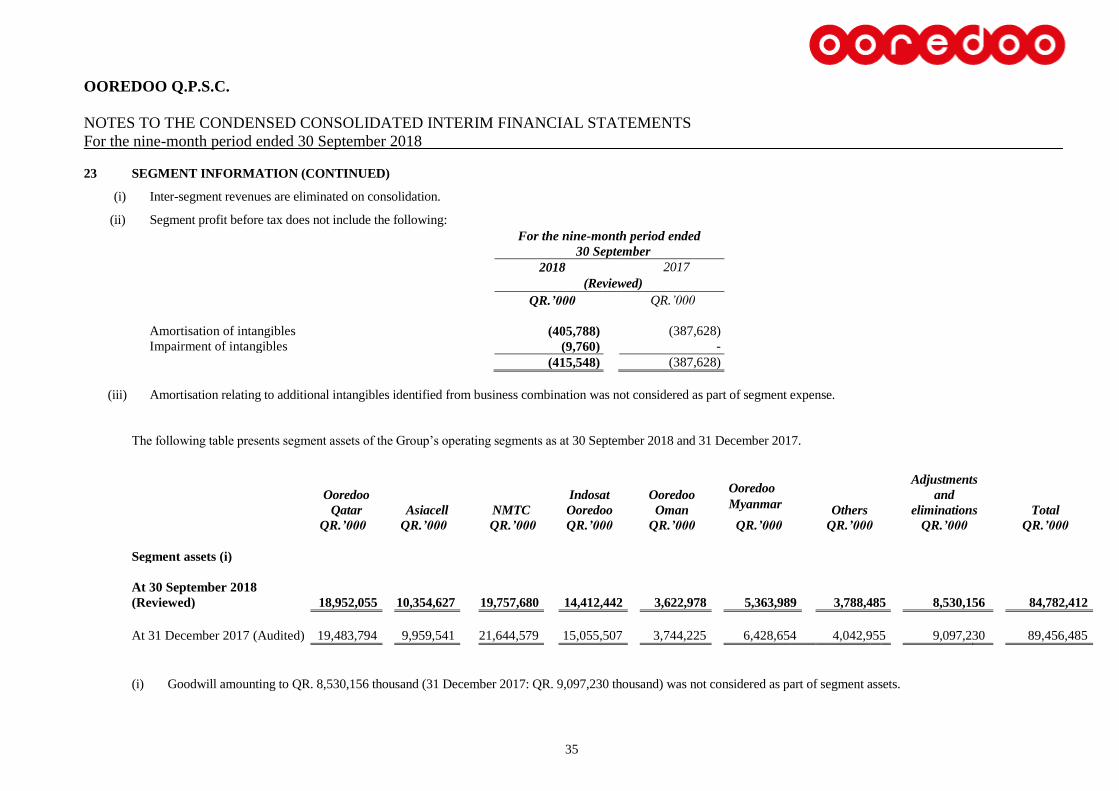
OOREDOO Q.P.S.C.
NOTES TO THE CONDENSED CONSOLIDATED INTERIM FINANCIAL STATEMENTS
For the nine-month period ended 30 September 2018
35
23 SEGMENT INFORMATION (CONTINUED)
(i) Inter-segment revenues are eliminated on consolidation.
(ii) Segment profit before tax does not include the following:
For the nine-month period ended
30 September
2018 2017
(Reviewed)
QR.’000 QR.’000
Amortisation of intangibles (405,788) (387,628)
Impairment of intangibles (9,760) -
(415,548) (387,628)
(iii) Amortisation relating to additional intangibles identified from business combination was not considered as part of segment expense.
The following table presents segment assets of the Group’s operating segments as at 30 September 2018 and 31 December 2017.
Ooredoo
Qatar
Asiacell NMTC
Indosat
Ooredoo
Ooredoo
Oman
Ooredoo
Myanmar
Others
Adjustments
and
eliminations
Total
QR.’000 QR.’000 QR.’000 QR.’000 QR.’000 QR.’000 QR.’000 QR.’000 QR.’000
Segment assets (i)
At 30 September 2018
(Reviewed) 18,952,055 10,354,627 19,757,680 14,412,442 3,622,978 5,363,989
3,788,485 8,530,156 84,782,412
At 31 December 2017 (Audited) 19,483,794 9,959,541 21,644,579 15,055,507 3,744,225 6,428,654 4,042,955 9,097,230 89,456,485
(i) Goodwill amounting to QR. 8,530,156 thousand (31 December 2017: QR. 9,097,230 thousand) was not considered as part of segment assets.
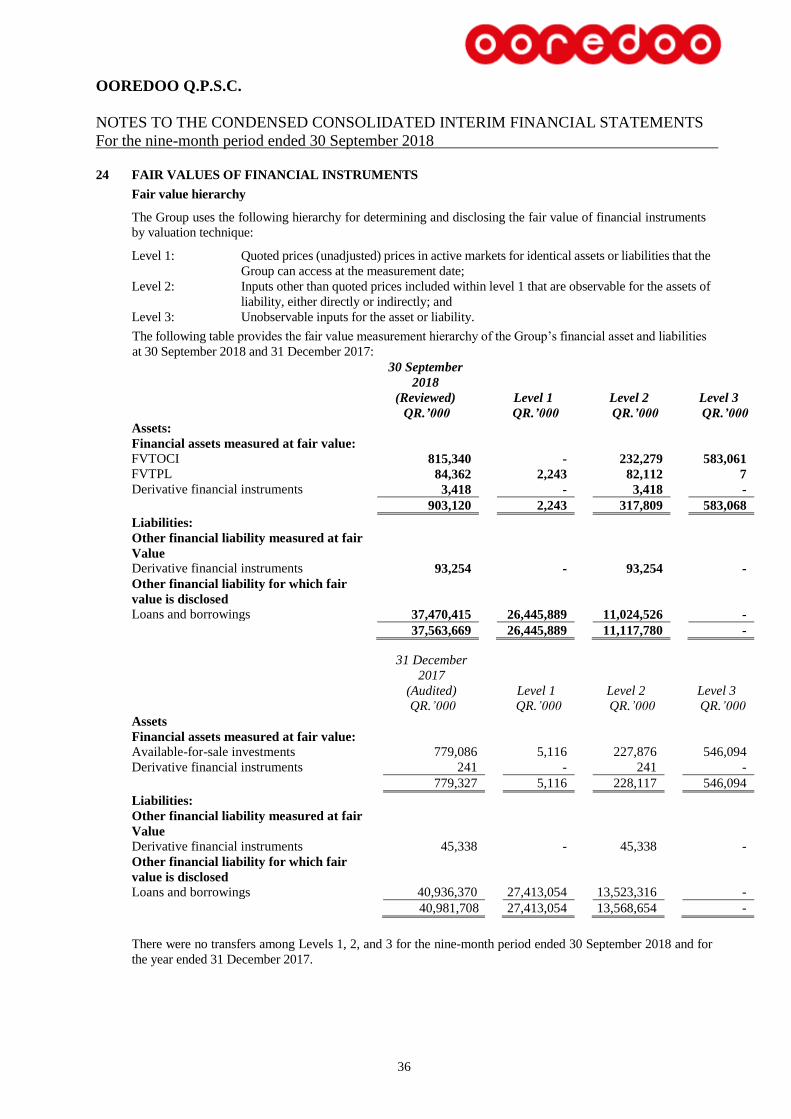
OOREDOO Q.P.S.C.
NOTES TO THE CONDENSED CONSOLIDATED INTERIM FINANCIAL STATEMENTS
For the nine-month period ended 30 September 2018
36
24 FAIR VALUES OF FINANCIAL INSTRUMENTS
Fair value hierarchy
The Group uses the following hierarchy for determining and disclosing the fair value of financial instruments
by valuation technique:
Level 1: Quoted prices (unadjusted) prices in active markets for identical assets or liabilities that the
Group can access at the measurement date;
Level 2: Inputs other than quoted prices included within level 1 that are observable for the assets of
liability, either directly or indirectly; and
Level 3: Unobservable inputs for the asset or liability.
The following table provides the fair value measurement hierarchy of the Group’s financial asset and liabilities
at 30 September 2018 and 31 December 2017:
30 September
2018
(Reviewed) Level 1 Level 2 Level 3
QR.’000 QR.’000 QR.’000 QR.’000
Assets:
Financial assets measured at fair value:
FVTOCI 815,340 - 232,279 583,061
FVTPL 84,362 2,243 82,112 7
Derivative financial instruments 3,418 - 3,418 -
903,120 2,243 317,809 583,068
Liabilities:
Other financial liability measured at fair
Value
Derivative financial instruments 93,254 - 93,254 -
Other financial liability for which fair
value is disclosed
Loans and borrowings 37,470,415 26,445,889 11,024,526 -
37,563,669 26,445,889 11,117,780 -
31 December
2017
(Audited) Level 1 Level 2 Level 3
QR.’000 QR.’000 QR.’000 QR.’000
Assets
Financial assets measured at fair value:
Available-for-sale investments 779,086 5,116 227,876 546,094
Derivative financial instruments 241 - 241 -
779,327 5,116 228,117 546,094
Liabilities:
Other financial liability measured at fair
Value
Derivative financial instruments 45,338 - 45,338 -
Other financial liability for which fair
value is disclosed
Loans and borrowings 40,936,370 27,413,054 13,523,316 -
40,981,708 27,413,054 13,568,654 -
There were no transfers among Levels 1, 2, and 3 for the nine-month period ended 30 September 2018 and for
the year ended 31 December 2017.
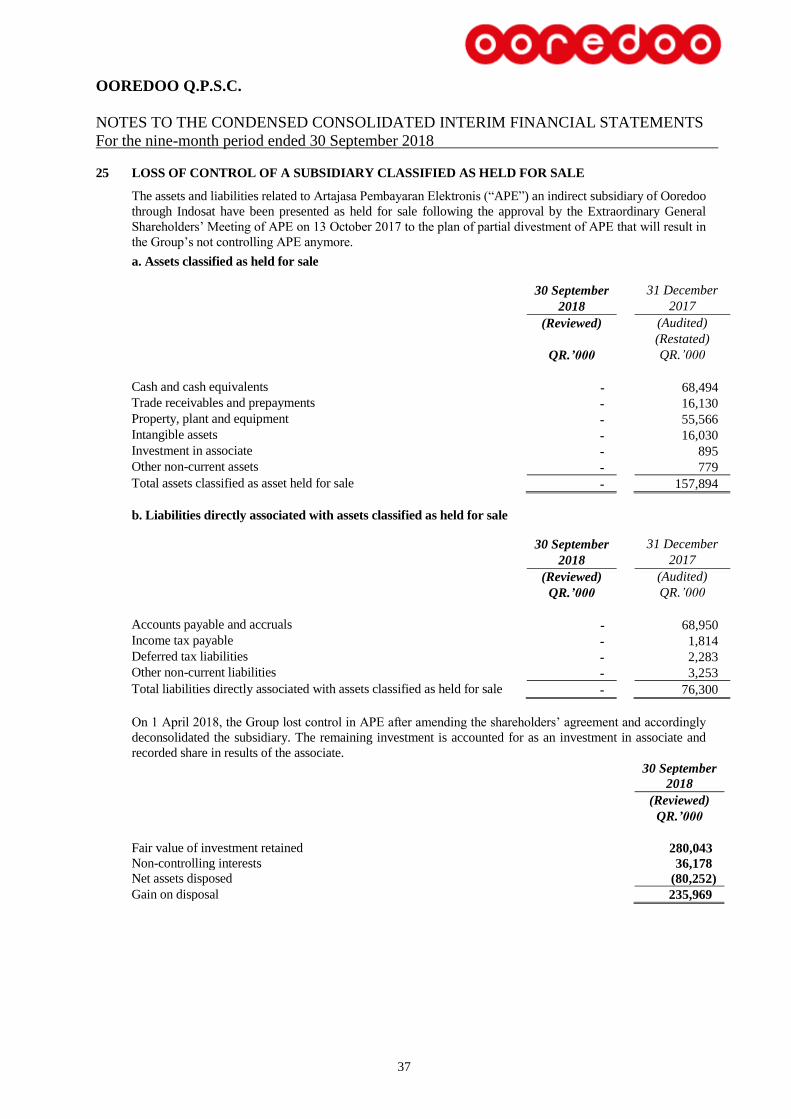
OOREDOO Q.P.S.C.
NOTES TO THE CONDENSED CONSOLIDATED INTERIM FINANCIAL STATEMENTS
For the nine-month period ended 30 September 2018
37
25 LOSS OF CONTROL OF A SUBSIDIARY CLASSIFIED AS HELD FOR SALE
The assets and liabilities related to Artajasa Pembayaran Elektronis (“APE”) an indirect subsidiary of Ooredoo
through Indosat have been presented as held for sale following the approval by the Extraordinary General
Shareholders’ Meeting of APE on 13 October 2017 to the plan of partial divestment of APE that will result in
the Group’s not controlling APE anymore.
a. Assets classified as held for sale
30 September 31 December
2018 2017
(Reviewed) (Audited)
(Restated)
QR.’000 QR.’000
Cash and cash equivalents - 68,494
Trade receivables and prepayments - 16,130
Property, plant and equipment - 55,566
Intangible assets - 16,030
Investment in associate - 895
Other non-current assets - 779
Total assets classified as asset held for sale - 157,894
b. Liabilities directly associated with assets classified as held for sale
30 September 31 December
2018 2017
(Reviewed) (Audited)
QR.’000 QR.’000
Accounts payable and accruals - 68,950
Income tax payable - 1,814
Deferred tax liabilities - 2,283
Other non-current liabilities - 3,253
Total liabilities directly associated with assets classified as held for sale - 76,300
On 1 April 2018, the Group lost control in APE after amending the shareholders’ agreement and accordingly
deconsolidated the subsidiary. The remaining investment is accounted for as an investment in associate and
recorded share in results of the associate.
30 September
2018
(Reviewed)
QR.’000
Fair value of investment retained 280,043
Non-controlling interests 36,178
Net assets disposed (80,252)
Gain on disposal 235,969