Ooredoo Group · Ooredoo (parent company Ooredoo Q.P.S.C.) and the group of companies which it...
29
FY 2018 Results February 2019 Ooredoo Group
Transcript of Ooredoo Group · Ooredoo (parent company Ooredoo Q.P.S.C.) and the group of companies which it...
FY 2018 Results
February 2019
Ooredoo Group
2
• Ooredoo (parent company Ooredoo Q.P.S.C.) and the group of companies which it forms part of (“Ooredoo Group”)cautions investors that certain statements contained in this document state Ooredoo Group management's intentions,hopes, beliefs, expectations, or predictions of the future and, as such, are forward-looking statements
• Ooredoo Group management wishes to further caution the reader that forward-looking statements are not historicalfacts and are only estimates or predictions. Actual results may differ materially from those projected as a result of risksand uncertainties including, but not limited to:
• Our ability to manage domestic and international growth and maintain a high level of customer service• Future sales growth • Market acceptance of our product and service offerings • Our ability to secure adequate financing or equity capital to fund our operations • Network expansion • Performance of our network and equipment • Our ability to enter into strategic alliances or transactions • Cooperation of incumbent local exchange carriers in provisioning lines and interconnecting our equipment • Regulatory approval processes • Changes in technology • Price competition • Other market conditions and associated risks• This presentation does not constitute an offering of securities or otherwise constitute an invitation or inducement to any
person to underwrite, subscribe for or otherwise acquire or dispose of securities in any company within the OoredooGroup
• The Ooredoo Group undertakes no obligation to update publicly or otherwise any forward-looking statements, whetheras a result of future events, new information, or otherwise
Disclaimer
3
1. Results review
2. Operations review
3. Additional information
Contents
4
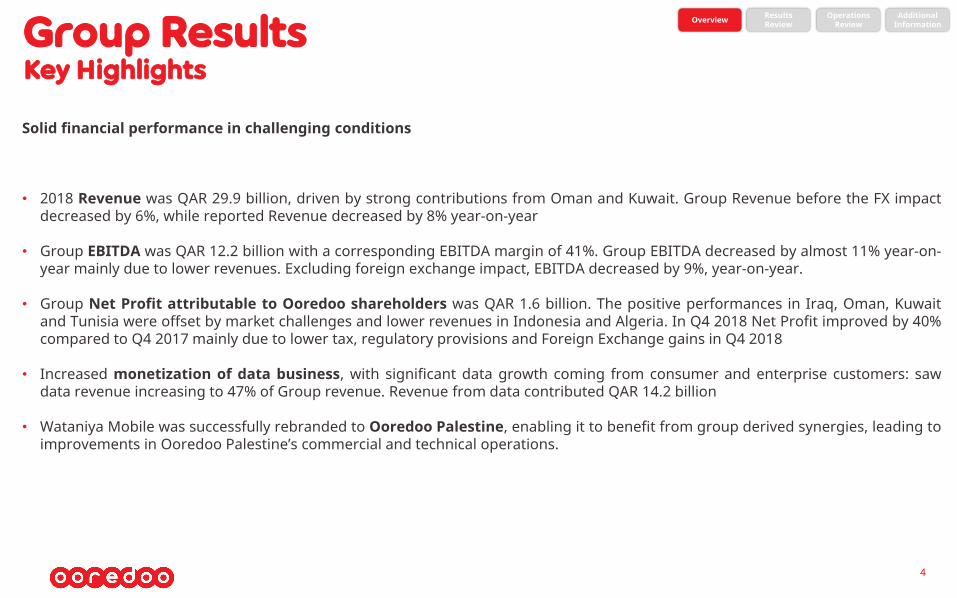
Solid financial performance in challenging conditions
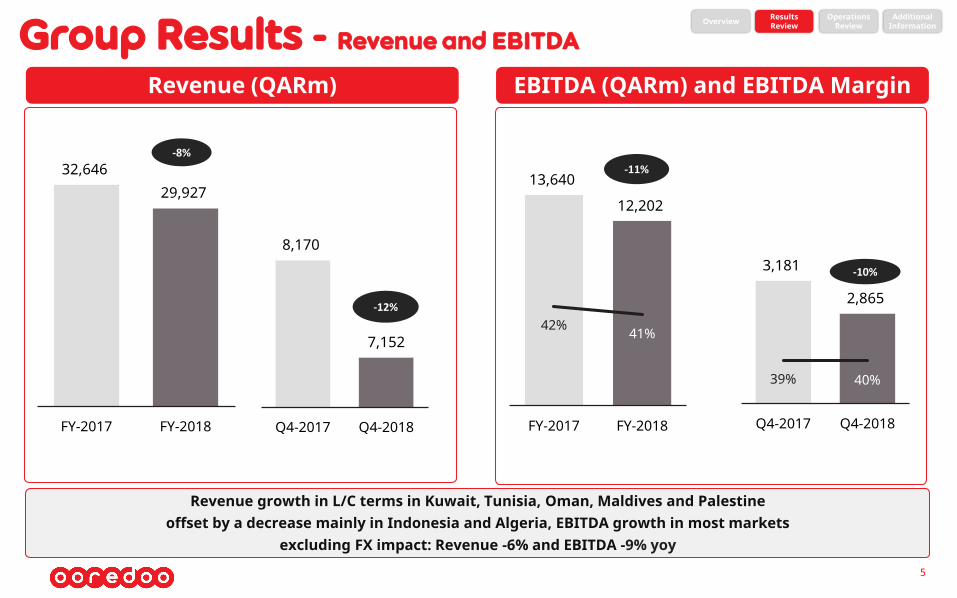
• 2018 Revenue was QAR 29.9 billion, driven by strong contributions from Oman and Kuwait. Group Revenue before the FX impactdecreased by 6%, while reported Revenue decreased by 8% year-on-year
• Group EBITDA was QAR 12.2 billion with a corresponding EBITDA margin of 41%. Group EBITDA decreased by almost 11% year-on-year mainly due to lower revenues. Excluding foreign exchange impact, EBITDA decreased by 9%, year-on-year.
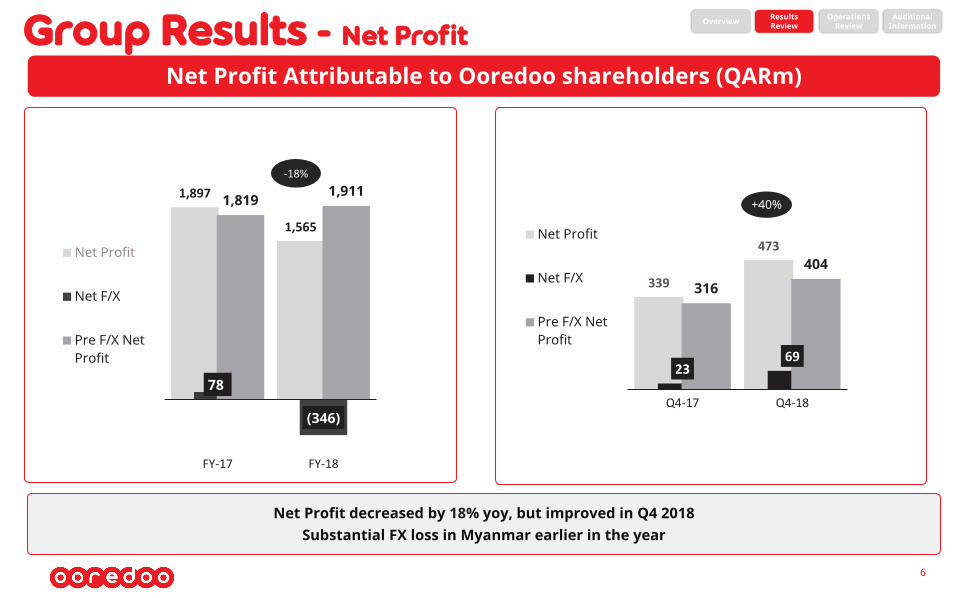
• Group Net Profit attributable to Ooredoo shareholders was QAR 1.6 billion. The positive performances in Iraq, Oman, Kuwaitand Tunisia were offset by market challenges and lower revenues in Indonesia and Algeria. In Q4 2018 Net Profit improved by 40%compared to Q4 2017 mainly due to lower tax, regulatory provisions and Foreign Exchange gains in Q4 2018
• Increased monetization of data business, with significant data growth coming from consumer and enterprise customers: sawdata revenue increasing to 47% of Group revenue. Revenue from data contributed QAR 14.2 billion
• Wataniya Mobile was successfully rebranded to Ooredoo Palestine, enabling it to benefit from group derived synergies, leading toimprovements in Ooredoo Palestine’s commercial and technical operations.
Group ResultsKey Highlights
Results Review
Operations Review
AdditionalInformationOverview
5
Revenue growth in L/C terms in Kuwait, Tunisia, Oman, Maldives and Palestine offset by a decrease mainly in Indonesia and Algeria, EBITDA growth in most markets
excluding FX impact: Revenue -6% and EBITDA -9% yoy
Revenue (QARm) EBITDA (QARm) and EBITDA Margin
Group Results - Revenue and EBITDA
32,646 29,927
FY-2017 FY-2018
-8%
13,640
12,202
42% 41%
FY-2017 FY-2018
-11%
3,181
2,865
39% 40%
Q4-2017 Q4-2018
-10%
Results Review
Operations Review
AdditionalInformationOverview
8,170
7,152
Q4-2017 Q4-2018
-12%
6
Net Profit decreased by 18% yoy, but improved in Q4 2018Substantial FX loss in Myanmar earlier in the year
Net Profit Attributable to Ooredoo shareholders (QARm)
Group Results - Net ProfitResults Review
Operations Review
AdditionalInformationOverview
1,897
1,565
78
(346)
1,819 1,911
FY-17 FY-18
Net Profit
Net F/X
Pre F/X NetProfit
-18%
339
473
23 69
316
404
Q4-17 Q4-18
Net Profit
Net F/X
Pre F/X NetProfit
+40%
7
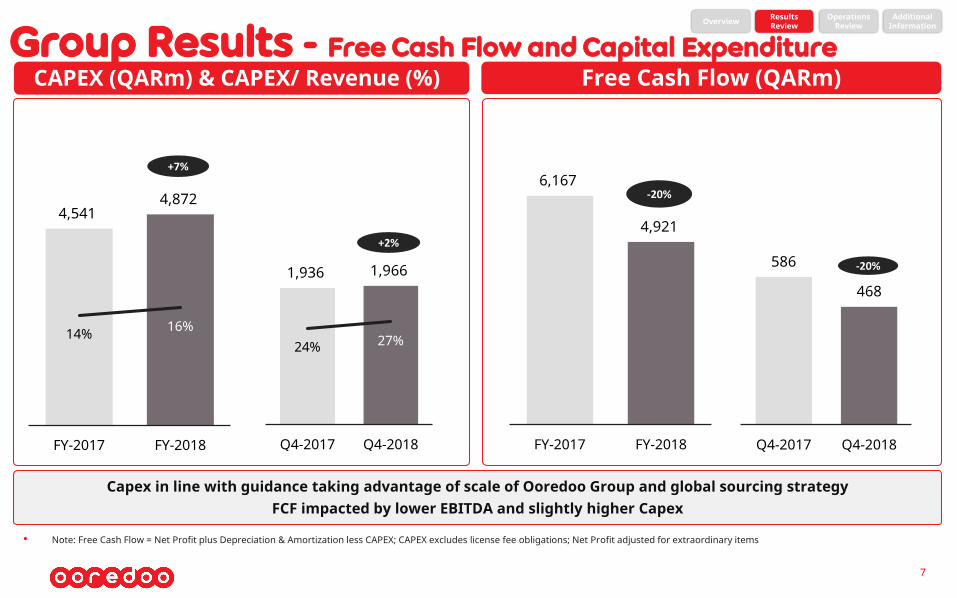
Group Results - Free Cash Flow and Capital ExpenditureFree Cash Flow (QARm)CAPEX (QARm) & CAPEX/ Revenue (%)
Capex in line with guidance taking advantage of scale of Ooredoo Group and global sourcing strategyFCF impacted by lower EBITDA and slightly higher Capex
• Note: Free Cash Flow = Net Profit plus Depreciation & Amortization less CAPEX; CAPEX excludes license fee obligations; Net Profit adjusted for extraordinary items
4,541 4,872
14% 16%
FY-2017 FY-2018
+7%
6,167
4,921
FY-2017 FY-2018
-20%
1,936 1,966
24% 27%
Q4-2017 Q4-2018
+2%
586
468
Q4-2017 Q4-2018
-20%
Results Review
Operations Review
AdditionalInformationOverview
8
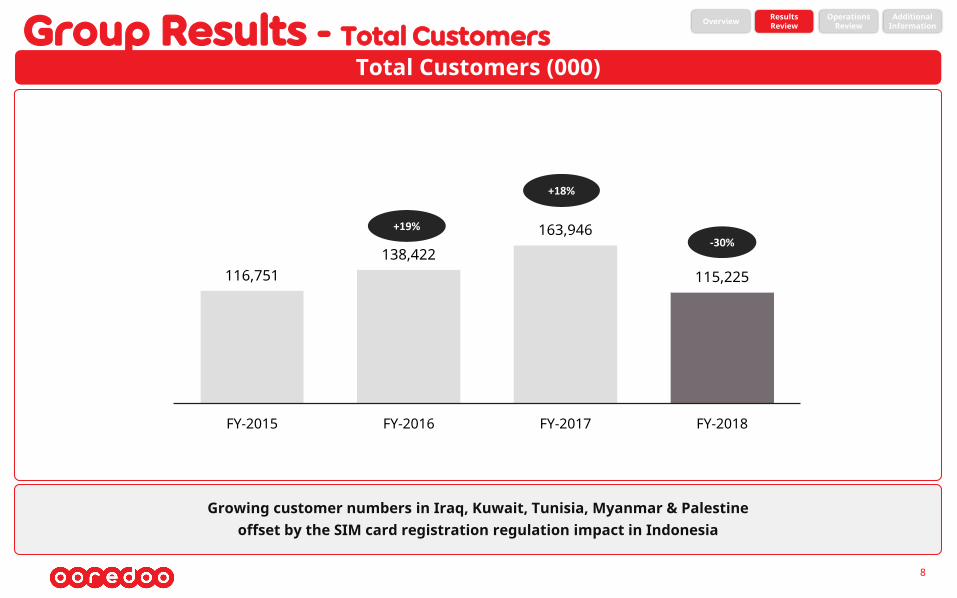
Total Customers (000)Group Results - Total Customers
Growing customer numbers in Iraq, Kuwait, Tunisia, Myanmar & Palestine offset by the SIM card registration regulation impact in Indonesia
116,751 138,422
163,946
115,225
FY-2015 FY-2016 FY-2017 FY-2018
+19%
-30%
+18%
Results Review
Operations Review
AdditionalInformationOverview
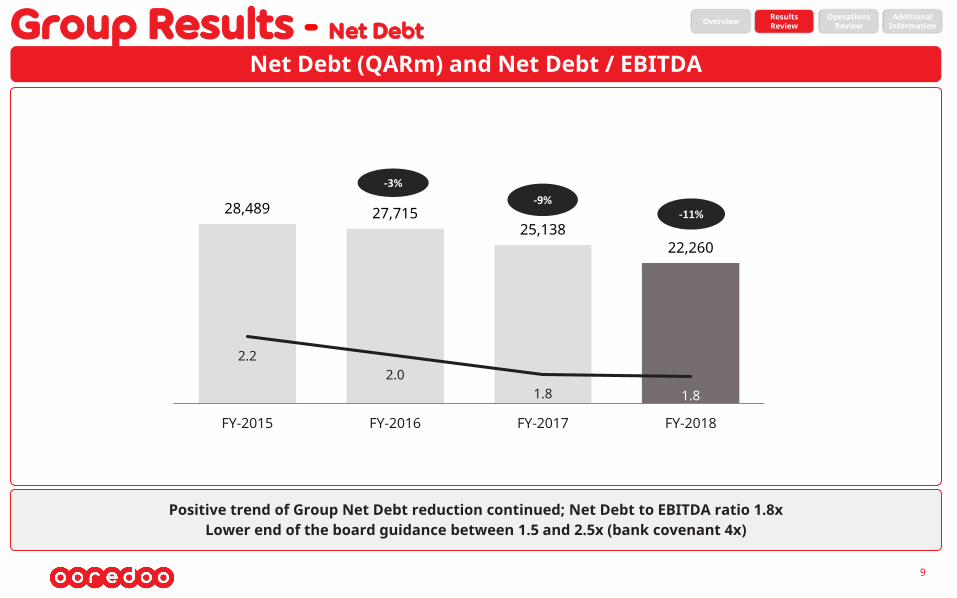
Group Results - Net Debt
9
Net Debt (QARm) and Net Debt / EBITDA
28,489 27,715 25,138
22,260
2.2 2.0
1.8 1.8
FY-2015 FY-2016 FY-2017 FY-2018
-3%
-11%-9%
Positive trend of Group Net Debt reduction continued; Net Debt to EBITDA ratio 1.8xLower end of the board guidance between 1.5 and 2.5x (bank covenant 4x)
Results Review
Operations Review
AdditionalInformationOverview
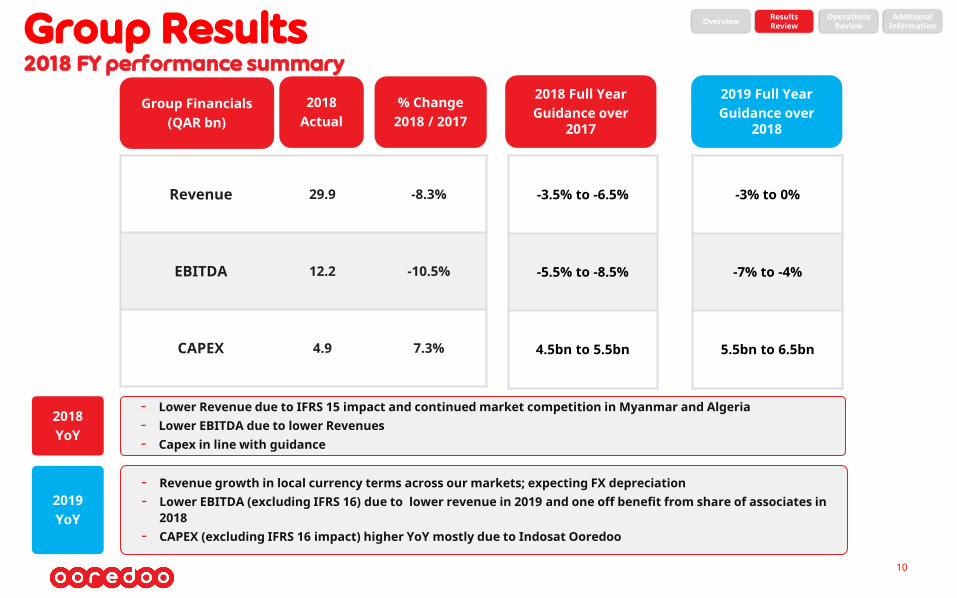
Group Results2018 FY performance summary
Results Review
Operations Review
AdditionalInformationOverview
- Lower Revenue due to IFRS 15 impact and continued market competition in Myanmar and Algeria - Lower EBITDA due to lower Revenues - Capex in line with guidance
10
% Change2018 / 2017
2018Actual
Group Financials (QAR bn)
2018 Full YearGuidance over
2017
2019 Full YearGuidance over
2018
Revenue 29.9 -8.3%
EBITDA 12.2 -10.5%
CAPEX 4.9 7.3%
-3.5% to -6.5%
-5.5% to -8.5%
4.5bn to 5.5bn
-3% to 0%
-7% to -4%
5.5bn to 6.5bn
- Revenue growth in local currency terms across our markets; expecting FX depreciation- Lower EBITDA (excluding IFRS 16) due to lower revenue in 2019 and one off benefit from share of associates in
2018 - CAPEX (excluding IFRS 16 impact) higher YoY mostly due to Indosat Ooredoo
2018YoY
2019YoY
11
Contents
1. Results review
2. Operations review
3. Additional information
12
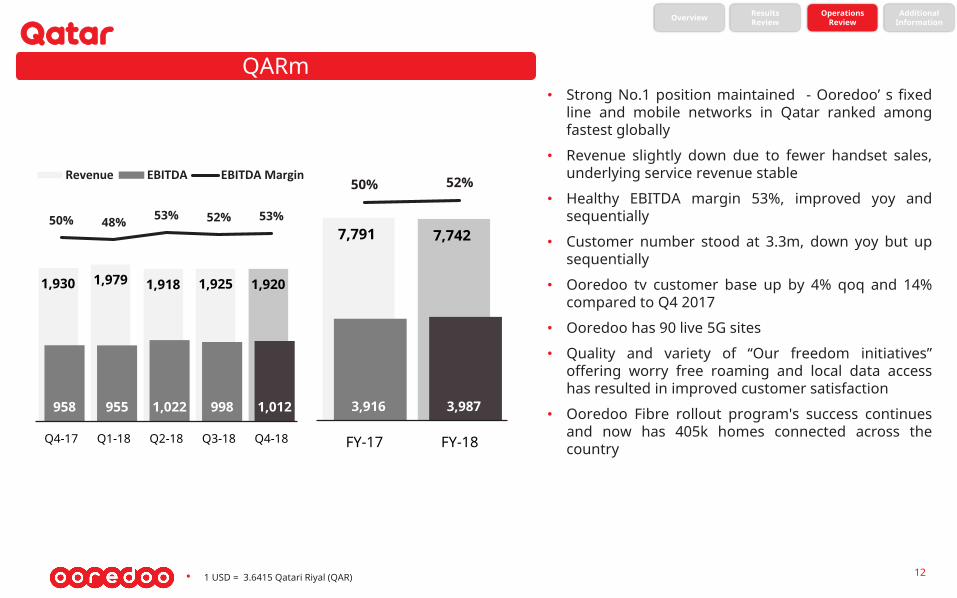
QARm• Strong No.1 position maintained - Ooredoo’ s fixed
line and mobile networks in Qatar ranked amongfastest globally
• Revenue slightly down due to fewer handset sales,underlying service revenue stable
• Healthy EBITDA margin 53%, improved yoy andsequentially
• Customer number stood at 3.3m, down yoy but upsequentially
• Ooredoo tv customer base up by 4% qoq and 14%compared to Q4 2017
• Ooredoo has 90 live 5G sites
• Quality and variety of “Our freedom initiatives”offering worry free roaming and local data accesshas resulted in improved customer satisfaction
• Ooredoo Fibre rollout program's success continuesand now has 405k homes connected across thecountry
• 1 USD = 3.6415 Qatari Riyal (QAR)
QatarResults Review
Operations Review
AdditionalInformationOverview
1,930 1,979 1,918 1,925 1,920
958 955 1,022 998 1,012
50% 48% 53% 52% 53%
Q4-17 Q1-18 Q2-18 Q3-18 Q4-18
Revenue EBITDA EBITDA Margin
7,791 7,742
3,916 3,987
50% 52%
FY-17 FY-18
13
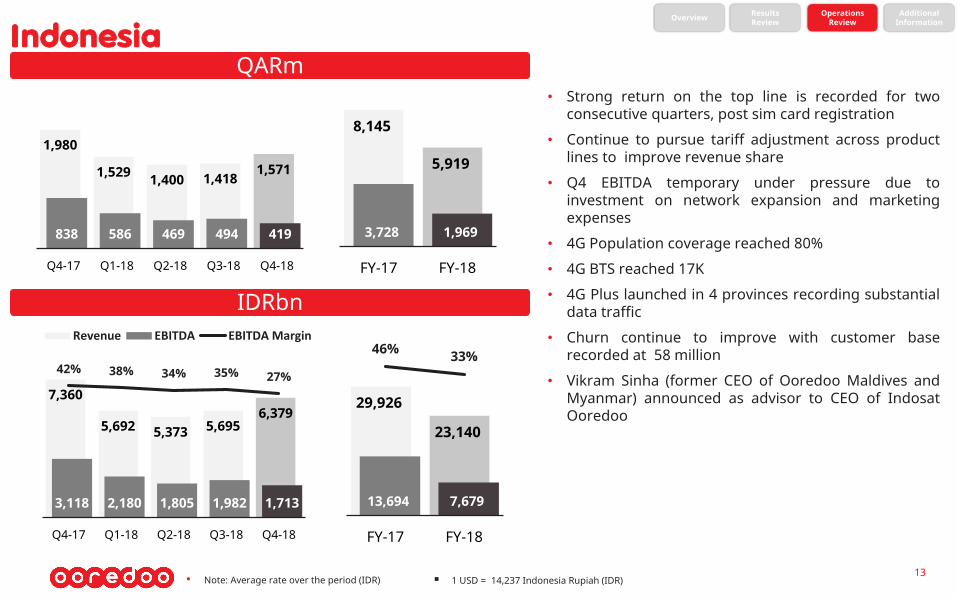
IndonesiaQARm
• Note: Average rate over the period (IDR)
• Strong return on the top line is recorded for twoconsecutive quarters, post sim card registration
• Continue to pursue tariff adjustment across productlines to improve revenue share
• Q4 EBITDA temporary under pressure due toinvestment on network expansion and marketingexpenses
• 4G Population coverage reached 80%
• 4G BTS reached 17K
• 4G Plus launched in 4 provinces recording substantialdata traffic
• Churn continue to improve with customer baserecorded at 58 million
• Vikram Sinha (former CEO of Ooredoo Maldives andMyanmar) announced as advisor to CEO of IndosatOoredoo
IDRbn
1 USD = 14,237 Indonesia Rupiah (IDR)
1,980
1,529 1,400 1,418 1,571
838 586 469 494 419
Q4-17 Q1-18 Q2-18 Q3-18 Q4-18
7,360
5,692 5,373 5,695 6,379
3,118 2,180 1,805 1,982 1,713
42% 38% 34% 35% 27%
Q4-17 Q1-18 Q2-18 Q3-18 Q4-18
Revenue EBITDA EBITDA Margin
8,145
5,919
3,728 1,969
FY-17 FY-18
29,926
23,140
13,694 7,679
46% 33%
FY-17 FY-18
Results Review
Operations Review
AdditionalInformationOverview
14
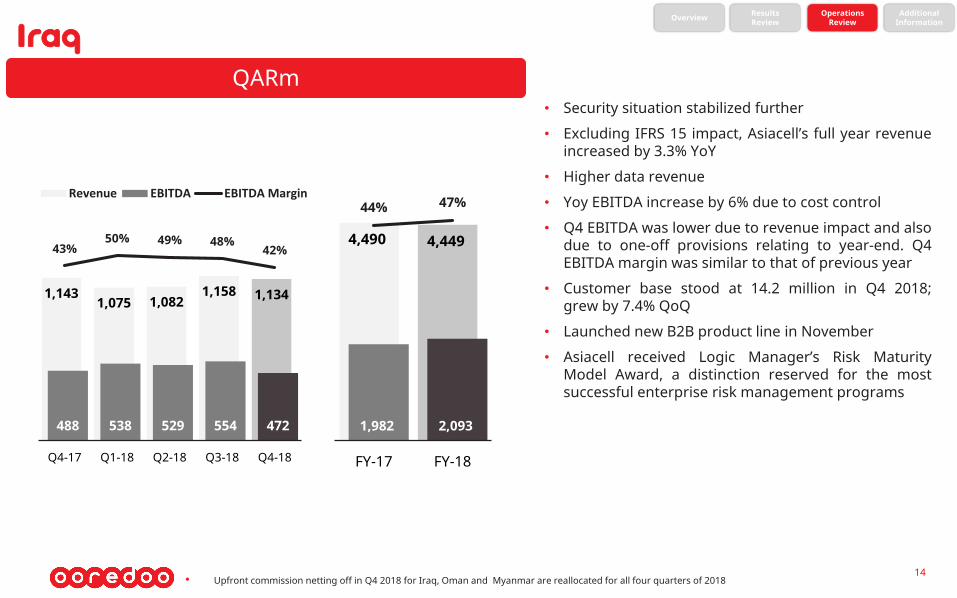
IraqQARm
• Security situation stabilized further
• Excluding IFRS 15 impact, Asiacell’s full year revenueincreased by 3.3% YoY
• Higher data revenue
• Yoy EBITDA increase by 6% due to cost control
• Q4 EBITDA was lower due to revenue impact and alsodue to one-off provisions relating to year-end. Q4EBITDA margin was similar to that of previous year
• Customer base stood at 14.2 million in Q4 2018;grew by 7.4% QoQ
• Launched new B2B product line in November
• Asiacell received Logic Manager’s Risk MaturityModel Award, a distinction reserved for the mostsuccessful enterprise risk management programs
1,143 1,075 1,082
1,158 1,134
488 538 529 554 472
43%50% 49% 48%
42%
Q4-17 Q1-18 Q2-18 Q3-18 Q4-18
Revenue EBITDA EBITDA Margin
4,490 4,449
1,982 2,093
44% 47%
FY-17 FY-18
Results Review
Operations Review
AdditionalInformationOverview
• Upfront commission netting off in Q4 2018 for Iraq, Oman and Myanmar are reallocated for all four quarters of 2018
15
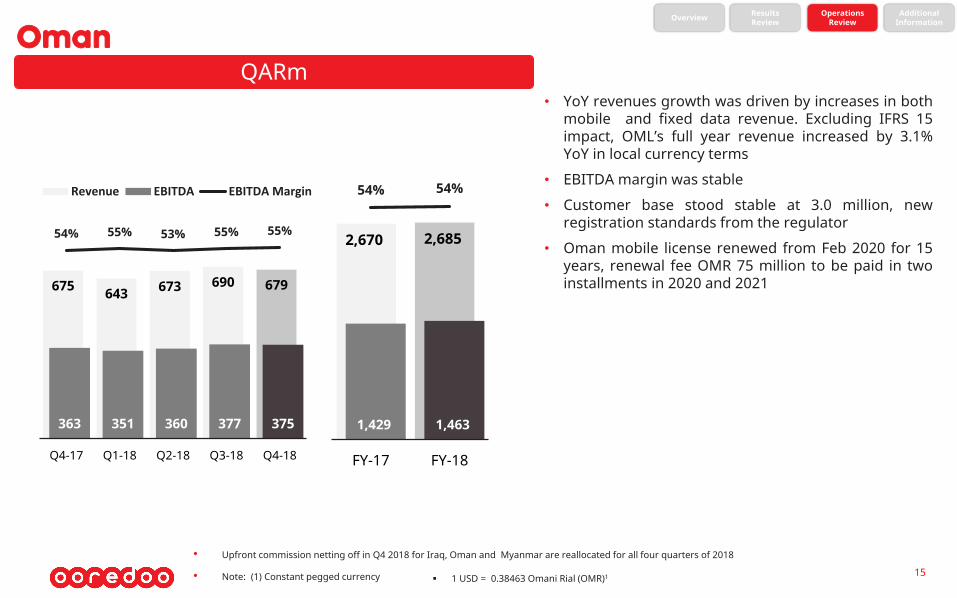
OmanQARm
1 USD = 0.38463 Omani Rial (OMR)1
• YoY revenues growth was driven by increases in bothmobile and fixed data revenue. Excluding IFRS 15impact, OML’s full year revenue increased by 3.1%YoY in local currency terms
• EBITDA margin was stable
• Customer base stood stable at 3.0 million, newregistration standards from the regulator
• Oman mobile license renewed from Feb 2020 for 15years, renewal fee OMR 75 million to be paid in twoinstallments in 2020 and 2021
• Note: (1) Constant pegged currency
675 643 673 690 679
363 351 360 377 375
54% 55% 53% 55% 55%
Q4-17 Q1-18 Q2-18 Q3-18 Q4-18
Revenue EBITDA EBITDA Margin
2,670 2,685
1,429 1,463
54% 54%
FY-17 FY-18
Results Review
Operations Review
AdditionalInformationOverview
• Upfront commission netting off in Q4 2018 for Iraq, Oman and Myanmar are reallocated for all four quarters of 2018
16
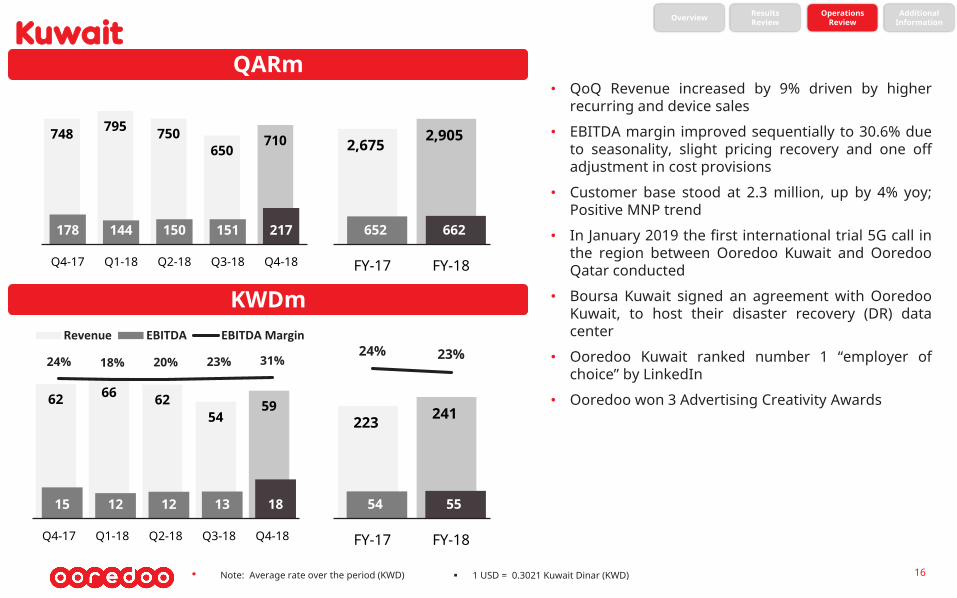
KuwaitQARm
1 USD = 0.3021 Kuwait Dinar (KWD)
• QoQ Revenue increased by 9% driven by higherrecurring and device sales
• EBITDA margin improved sequentially to 30.6% dueto seasonality, slight pricing recovery and one offadjustment in cost provisions
• Customer base stood at 2.3 million, up by 4% yoy;Positive MNP trend
• In January 2019 the first international trial 5G call inthe region between Ooredoo Kuwait and OoredooQatar conducted
• Boursa Kuwait signed an agreement with OoredooKuwait, to host their disaster recovery (DR) datacenter
• Ooredoo Kuwait ranked number 1 “employer ofchoice” by LinkedIn
• Ooredoo won 3 Advertising Creativity Awards
• Note: Average rate over the period (KWD)
KWDm
748 795 750 650
710
178 144 150 151 217
Q4-17 Q1-18 Q2-18 Q3-18 Q4-18
62 66 62 54
59
15 12 12 13 18
24% 18% 20% 23% 31%
Q4-17 Q1-18 Q2-18 Q3-18 Q4-18
Revenue EBITDA EBITDA Margin
2,675 2,905
652 662
FY-17 FY-18
223 241
54 55
24% 23%
FY-17 FY-18
Results Review
Operations Review
AdditionalInformationOverview
17
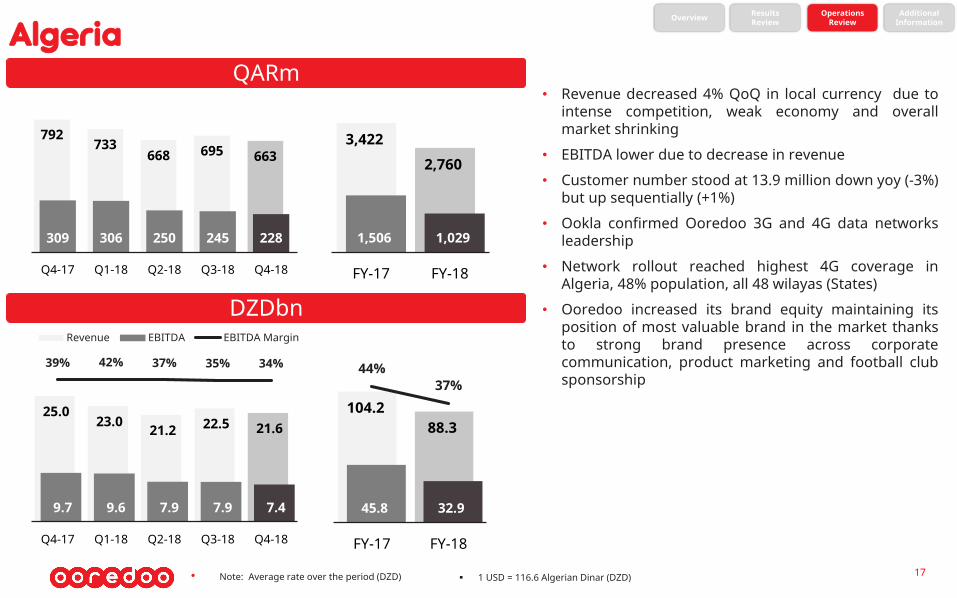
AlgeriaQARm
1 USD = 116.6 Algerian Dinar (DZD)
• Revenue decreased 4% QoQ in local currency due tointense competition, weak economy and overallmarket shrinking
• EBITDA lower due to decrease in revenue
• Customer number stood at 13.9 million down yoy (-3%)but up sequentially (+1%)
• Ookla confirmed Ooredoo 3G and 4G data networksleadership
• Network rollout reached highest 4G coverage inAlgeria, 48% population, all 48 wilayas (States)
• Ooredoo increased its brand equity maintaining itsposition of most valuable brand in the market thanksto strong brand presence across corporatecommunication, product marketing and football clubsponsorship
• Note: Average rate over the period (DZD)
DZDbn
Results Review
Operations Review
AdditionalInformationOverview
792 733
668 695 663
309 306 250 245 228
Q4-17 Q1-18 Q2-18 Q3-18 Q4-18
25.0 23.0 21.2 22.5 21.6
9.7 9.6 7.9 7.9 7.4
39% 42% 37% 35% 34%
Q4-17 Q1-18 Q2-18 Q3-18 Q4-18
Revenue EBITDA EBITDA Margin
3,422
2,760
1,506 1,029
FY-17 FY-18
104.2 88.3
45.8 32.9
44%37%
FY-17 FY-18
18
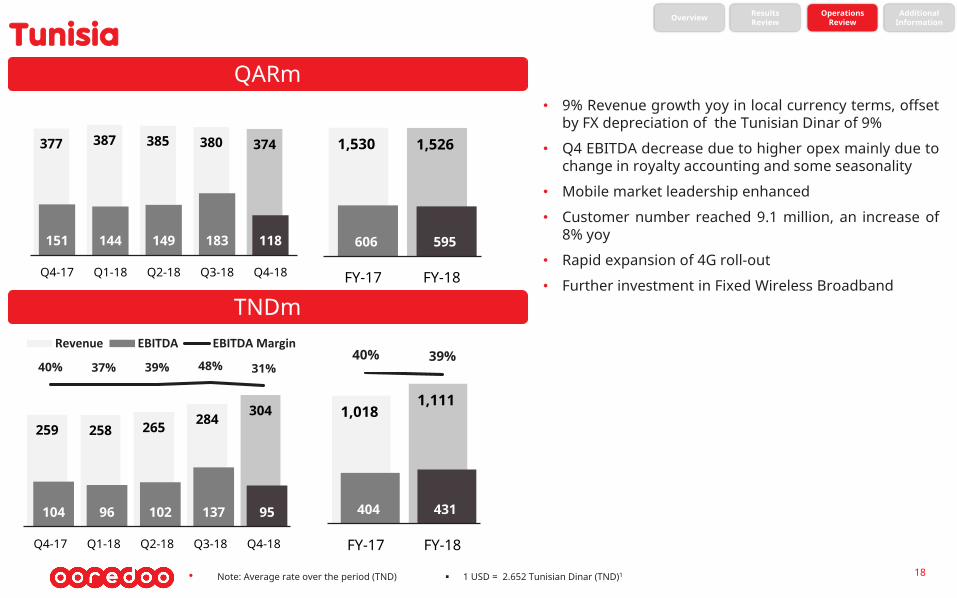
Tunisia
1 USD = 2.652 Tunisian Dinar (TND)1• Note: Average rate over the period (TND)
QARm
TNDm
• 9% Revenue growth yoy in local currency terms, offsetby FX depreciation of the Tunisian Dinar of 9%
• Q4 EBITDA decrease due to higher opex mainly due tochange in royalty accounting and some seasonality
• Mobile market leadership enhanced
• Customer number reached 9.1 million, an increase of8% yoy
• Rapid expansion of 4G roll-out
• Further investment in Fixed Wireless Broadband
377 387 385 380 374
151 144 149 183 118
Q4-17 Q1-18 Q2-18 Q3-18 Q4-18
259 258 265 284 304
104 96 102 137 95
40% 37% 39% 48% 31%
Q4-17 Q1-18 Q2-18 Q3-18 Q4-18
Revenue EBITDA EBITDA Margin
1,530 1,526
606 595
FY-17 FY-18
1,018 1,111
404 431
40% 39%
FY-17 FY-18
Results Review
Operations Review
AdditionalInformationOverview
19
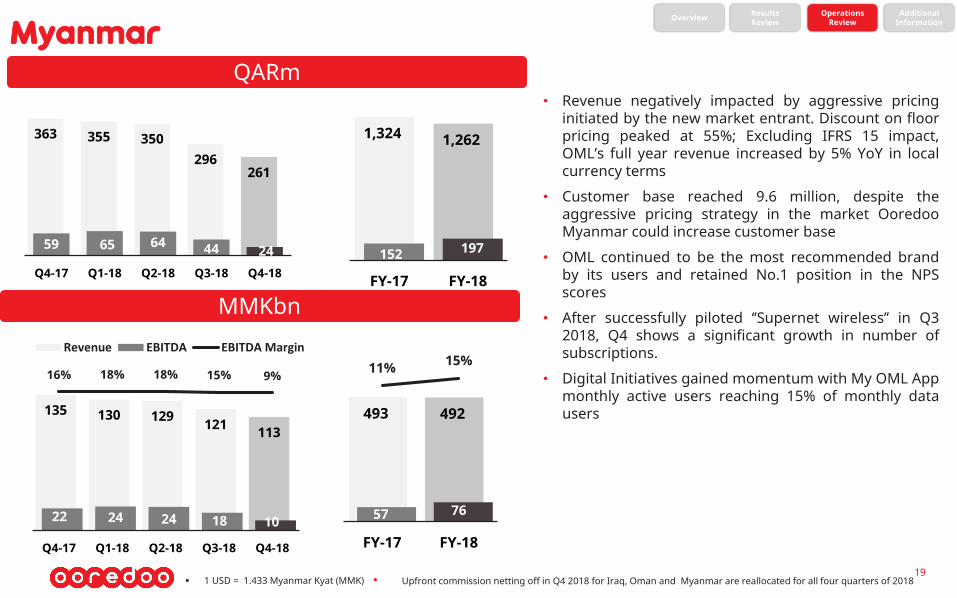
Myanmar
1 USD = 1.433 Myanmar Kyat (MMK)
QARm
MMKbn
• Revenue negatively impacted by aggressive pricinginitiated by the new market entrant. Discount on floorpricing peaked at 55%; Excluding IFRS 15 impact,OML’s full year revenue increased by 5% YoY in localcurrency terms
• Customer base reached 9.6 million, despite theaggressive pricing strategy in the market OoredooMyanmar could increase customer base
• OML continued to be the most recommended brandby its users and retained No.1 position in the NPSscores
• After successfully piloted ‘’Supernet wireless’’ in Q32018, Q4 shows a significant growth in number ofsubscriptions.
• Digital Initiatives gained momentum with My OML Appmonthly active users reaching 15% of monthly datausers
Results Review
Operations Review
AdditionalInformationOverview
363 355 350 296
261
59 65 64 44 24 Q4-17 Q1-18 Q2-18 Q3-18 Q4-18
135 130 129 121 113
22 24 24 18 10
16% 18% 18% 15% 9%
Q4-17 Q1-18 Q2-18 Q3-18 Q4-18
Revenue EBITDA EBITDA Margin
1,324 1,262
152 197
FY-17 FY-18
493 492
57 76
11% 15%
FY-17 FY-18
• Upfront commission netting off in Q4 2018 for Iraq, Oman and Myanmar are reallocated for all four quarters of 2018

20
2019 Qatar Exchange Annual IR Excellence
We would like to thank you for your support for the forth year on winning five awards
2019 Ooredoo Capital Markets Day
21
Save the date: CMD 19th June 2019, probably in Oman
(location and timing to be confirmed)
More details in due course
22
Contents
1. Results review
2. Operations review
3. Additional information
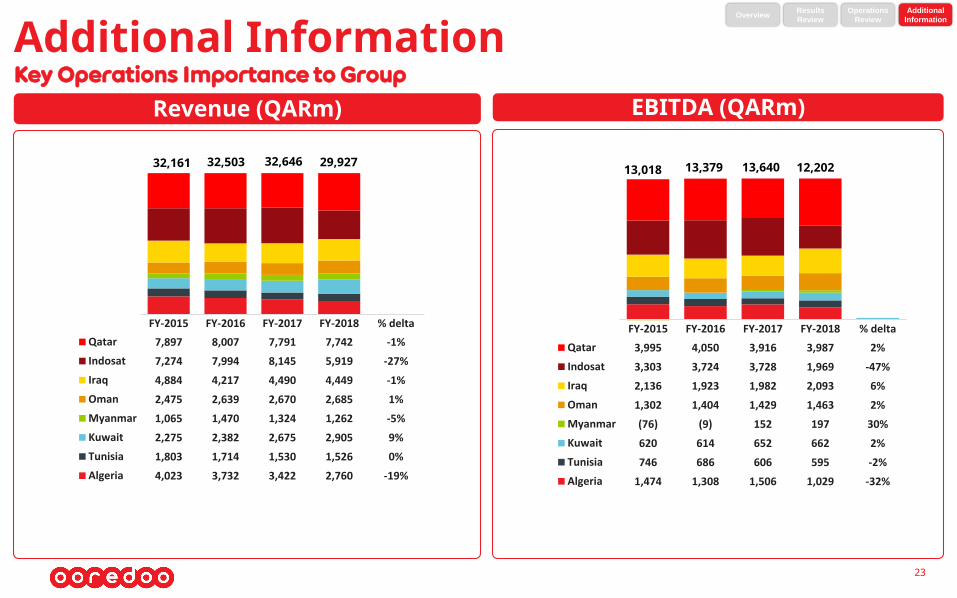
Additional InformationKey Operations Importance to Group
23
EBITDA (QARm)Revenue (QARm)
FY-2015 FY-2016 FY-2017 FY-2018 % delta
Qatar 3,995 4,050 3,916 3,987 2%
Indosat 3,303 3,724 3,728 1,969 -47%
Iraq 2,136 1,923 1,982 2,093 6%
Oman 1,302 1,404 1,429 1,463 2%
Myanmar (76) (9) 152 197 30%
Kuwait 620 614 652 662 2%
Tunisia 746 686 606 595 -2%
Algeria 1,474 1,308 1,506 1,029 -32%
12,202 13,640 13,379 13,018
FY-2015 FY-2016 FY-2017 FY-2018 % delta
Qatar 7,897 8,007 7,791 7,742 -1%
Indosat 7,274 7,994 8,145 5,919 -27%
Iraq 4,884 4,217 4,490 4,449 -1%
Oman 2,475 2,639 2,670 2,685 1%
Myanmar 1,065 1,470 1,324 1,262 -5%
Kuwait 2,275 2,382 2,675 2,905 9%
Tunisia 1,803 1,714 1,530 1,526 0%
Algeria 4,023 3,732 3,422 2,760 -19%
29,927 32,646 32,503 32,161
Results
Review
Operations
Review
Additional
InformationOverview
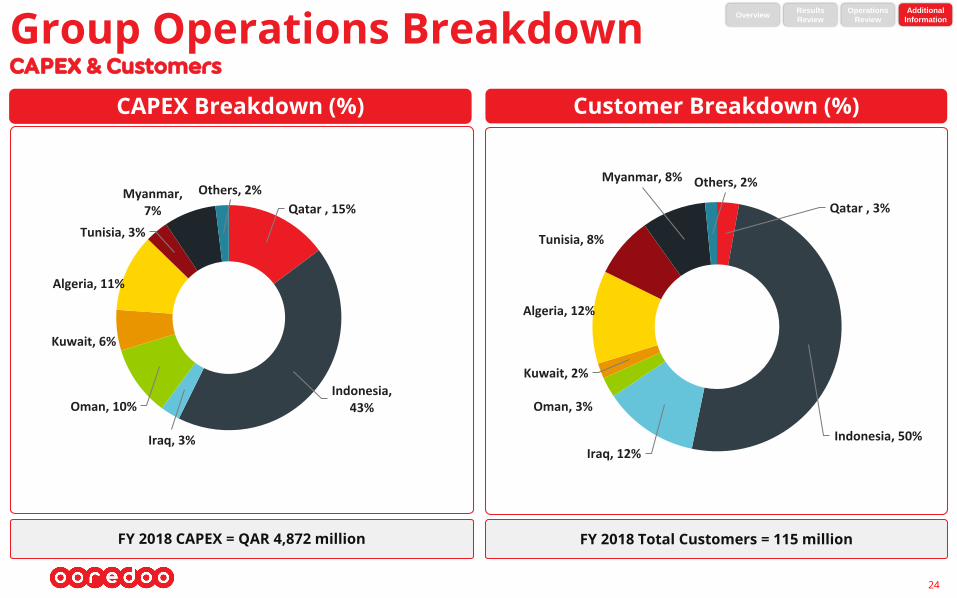
Group Operations BreakdownCAPEX & Customers
CAPEX Breakdown (%) Customer Breakdown (%)
FY 2018 CAPEX = QAR 4,872 million FY 2018 Total Customers = 115 million
24
Qatar , 3%
Indonesia, 50%
Iraq, 12%
Oman, 3%
Kuwait, 2%
Algeria, 12%
Tunisia, 8%
Myanmar, 8% Others, 2%
Qatar , 15%
Indonesia, 43%
Iraq, 3%
Oman, 10%
Kuwait, 6%
Algeria, 11%
Tunisia, 3%
Myanmar, 7%
Others, 2%
Results
Review
Operations
Review
Additional
InformationOverview
25
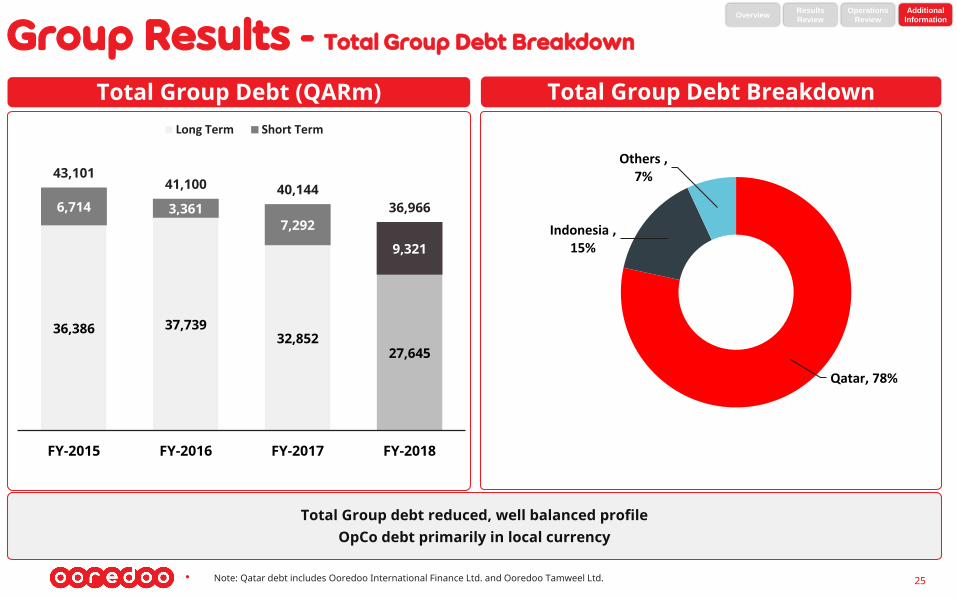
Total Group Debt (QARm) Total Group Debt Breakdown
Group Results - Total Group Debt Breakdown
Total Group debt reduced, well balanced profileOpCo debt primarily in local currency
• Note: Qatar debt includes Ooredoo International Finance Ltd. and Ooredoo Tamweel Ltd.
Qatar, 78%
Indonesia , 15%
Others , 7%
36,386 37,739 32,852
27,645
6,714 3,361 7,292
9,321
43,10141,100 40,144
36,966
FY-2015 FY-2016 FY-2017 FY-2018
Long Term Short Term
Results
Review
Operations
Review
Additional
InformationOverview
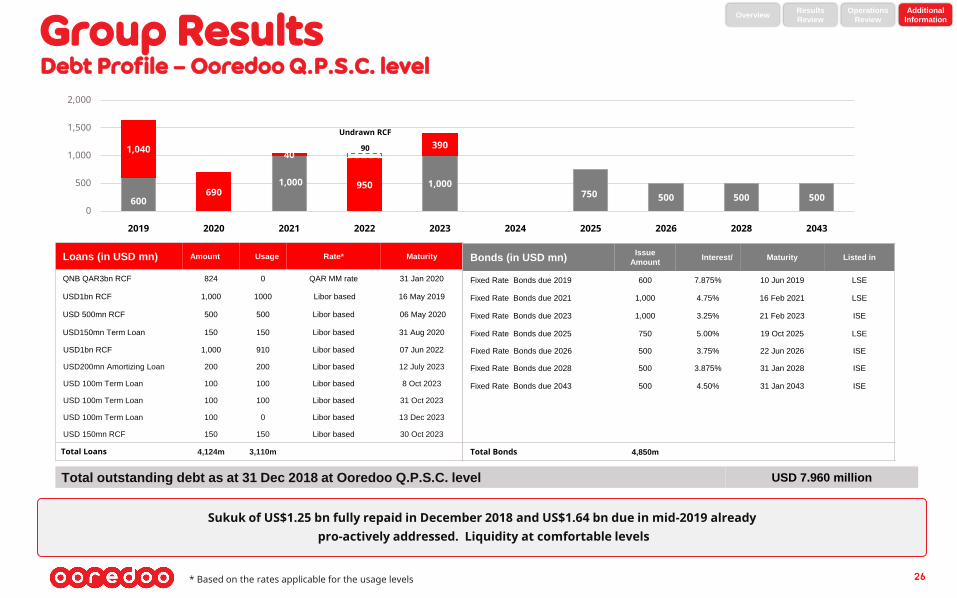
Group ResultsDebt Profile – Ooredoo Q.P.S.C. level
26
Results
Review
Operations
Review
Additional
InformationOverview
Loans (in USD mn) Amount Usage Rate* Maturity
QNB QAR3bn RCF 824 0 QAR MM rate 31 Jan 2020
USD1bn RCF 1,000 1000 Libor based 16 May 2019
USD 500mn RCF 500 500 Libor based 06 May 2020
USD150mn Term Loan 150 150 Libor based 31 Aug 2020
USD1bn RCF 1,000 910 Libor based 07 Jun 2022
USD200mn Amortizing Loan 200 200 Libor based 12 July 2023
USD 100m Term Loan 100 100 Libor based 8 Oct 2023
USD 100m Term Loan 100 100 Libor based 31 Oct 2023
USD 100m Term Loan 100 0 Libor based 13 Dec 2023
USD 150mn RCF 150 150 Libor based 30 Oct 2023
Total Loans 4,124m 3,110m
Bonds (in USD mn)Issue
AmountInterest/ Maturity Listed in
Fixed Rate Bonds due 2019 600 7.875% 10 Jun 2019 LSE
Fixed Rate Bonds due 2021 1,000 4.75% 16 Feb 2021 LSE
Fixed Rate Bonds due 2023 1,000 3.25% 21 Feb 2023 ISE
Fixed Rate Bonds due 2025 750 5.00% 19 Oct 2025 LSE
Fixed Rate Bonds due 2026 500 3.75% 22 Jun 2026 ISE
Fixed Rate Bonds due 2028 500 3.875% 31 Jan 2028 ISE
Fixed Rate Bonds due 2043 500 4.50% 31 Jan 2043 ISE
Total Bonds 4,850m
Total outstanding debt as at 31 Dec 2018 at Ooredoo Q.P.S.C. level USD 7.960 million
600
1,000 1,000750 500 500 500
1,040
690
40
950
390
0
500
1,000
1,500
2,000
2019 2020 2021 2022 2023 2024 2025 2026 2028 2043
Undrawn RCF
90
Sukuk of US$1.25 bn fully repaid in December 2018 and US$1.64 bn due in mid-2019 alreadypro-actively addressed. Liquidity at comfortable levels
* Based on the rates applicable for the usage levels
27
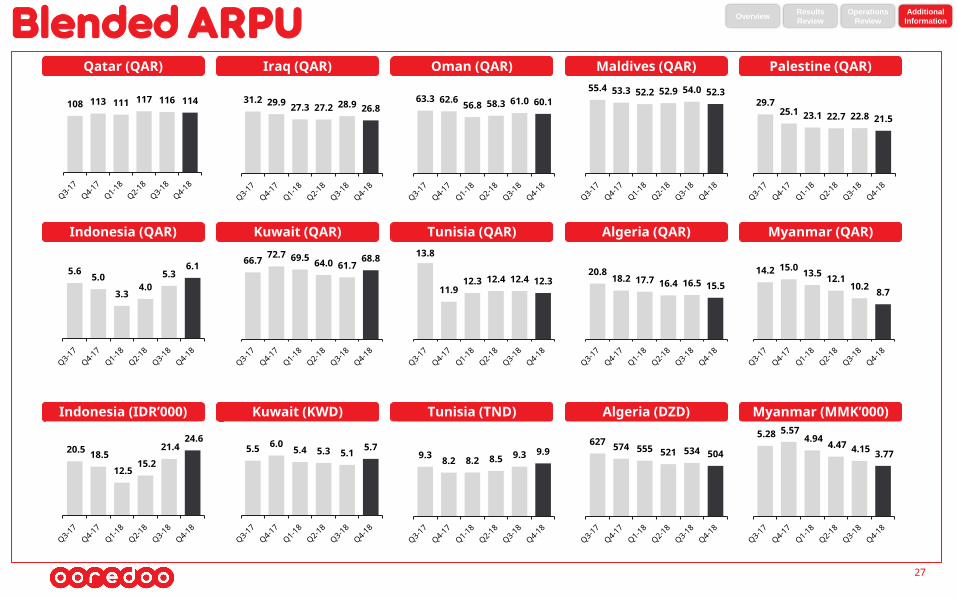
Qatar (QAR) Iraq (QAR) Oman (QAR) Maldives (QAR) Palestine (QAR)
Indonesia (QAR) Kuwait (QAR) Tunisia (QAR) Algeria (QAR) Myanmar (QAR)
Indonesia (IDR’000) Algeria (DZD)Tunisia (TND)Kuwait (KWD) Myanmar (MMK’000)
Blended ARPU
108 113 111 117 116 114 31.2 29.9 27.3 27.2 28.9 26.863.3 62.6 56.8 58.3 61.0 60.1
55.4 53.3 52.2 52.9 54.0 52.329.7
25.1 23.1 22.7 22.8 21.5
5.6 5.0
3.34.0
5.36.1 66.7 72.7 69.5 64.0 61.7
68.8 13.8
11.912.3 12.4 12.4 12.3
20.818.2 17.7 16.4 16.5 15.5
14.2 15.0 13.5 12.110.2 8.7
20.5 18.5
12.5 15.2
21.4 24.6
5.5 6.0 5.4 5.3 5.1 5.79.3 8.2 8.2 8.5 9.3 9.9
627 574 555 521 534 504
5.28 5.57 4.94 4.47 4.15 3.77
Results
Review
Operations
Review
Additional
InformationOverview
28
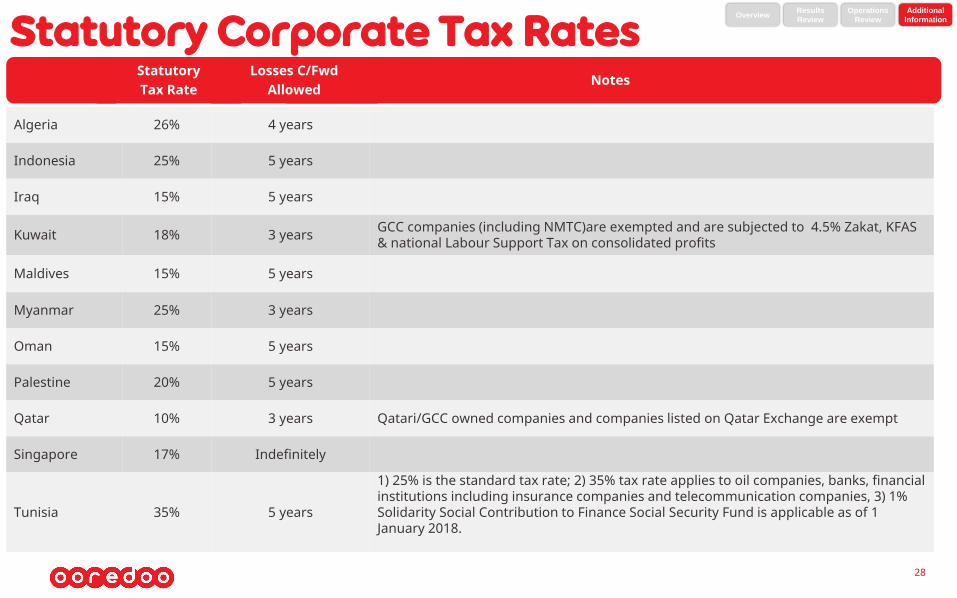
Statutory Corporate Tax Rates
Algeria 26% 4 years
Indonesia 25% 5 years
Iraq 15% 5 years
Kuwait 18% 3 years GCC companies (including NMTC)are exempted and are subjected to 4.5% Zakat, KFAS & national Labour Support Tax on consolidated profits
Maldives 15% 5 years
Myanmar 25% 3 years
Oman 15% 5 years
Palestine 20% 5 years
Qatar 10% 3 years Qatari/GCC owned companies and companies listed on Qatar Exchange are exempt
Singapore 17% Indefinitely
Tunisia 35% 5 years
1) 25% is the standard tax rate; 2) 35% tax rate applies to oil companies, banks, financial institutions including insurance companies and telecommunication companies, 3) 1% Solidarity Social Contribution to Finance Social Security Fund is applicable as of 1 January 2018.
NotesStatutory Tax Rate
Losses C/FwdAllowed
Results
Review
Operations
Review
Additional
InformationOverview
Thank You
Next Quarterly Results (tbc)