Comparative Postembryonic Skeletal Ontogeny in Two Sister ...

Ontogeny of the digestive system inlumpfish (Cyclopterus lumpus L.) larvae inrelation to growth and start feeding dietA histological and stereological approach
Joachim Larsen Marthinsen
Marine Coastal Development
Supervisor: Elin Kjørsvik, IBICo-supervisor: Kjell Inge Reitan, IBI
Department of Biology
Submission date: June 2018
Norwegian University of Science and Technology


I
Abstract
Global aquaculture production of Atlantic salmon (Salmo salar) has stabilized since 2012 due to
high prevalence of the ectoparasitic sea lice (Lepeophtheirus salmonis). Deployment of lice-eating
cleaner fish is considered one of the most effective and sustainable methods to control sea lice
infestations in salmon cages, of which lumpfish (Cyclopterus lumpus) is the most used and
commercially produced species in Norway. The Norwegian aquaculture lumpfish production has
escalated greatly since 2012 but is currently characterized by variable growth and survival during
the larval stage. Little is also known regarding nutritional requirements and development of the
digestive system in lumpfish larvae, the latter of which is determining for larvae’s capacity to
assimilate nutrients required for all metabolic processes.
The present study aimed to describe digestive system ontogeny in lumpfish from hatching to 50
days post hatch (dph) based on histological and stereological methods and to evaluate effects of
different start feeding regimes on growth, survival and development of the liver, stomach and gut.
Ontogeny and dietary effects were investigated by conducting a start feeding experiment in which
three triplicate groups received different diets during the start feeding period (2-22 dph). Larvae
from one group were fed enriched Artemia while two groups were offered Acartia tonsa, either
for the full start feeding period or with an early weaning to formulated diet 6-8 dph. Larvae from
all groups were weaned 20-22 dph and fed the same inert diet until the experiment ended 51 dph.
The alimentary canal of lumpfish was divided into the esophagus, primordial stomach, midgut and
hindgut by hatching, at which time it was coiled and open at both ends. Newly hatched larvae had
a differentiated liver containing large, irregularly shaped glycogen-like vacuoles and an exocrine
pancreas with numerous zymogen granules. The stomach had developed gastric glands 10 dph
(6.6 – 6.8 mm standard length) and was divided into the cardia, pylorus and fundus by 34 dph. At
this time the stomach lumen volume had increased significantly (8.0 – 9.1 mm standard length)
and pyloric caeca formed in the anterior midgut. Feeding with Artemia greatly improved larval
growth rates, survival after yolk resorption 21-34 dph and resulted in more rapid stomach
development compared to both groups initially fed A. tonsa. Larvae showed lower hepatocyte cell
and nucleus area sizes, absence of hepatic vacuoles and reduced midgut epithelium height during
the period they were fed A. tonsa. These effects were pronounced on the liver of larvae from both
groups fed A. tonsa by 10 dph and were reversed after weaning to dry feed, indicating that the
liver accurately reflected larval nutritional status at the time of sampling. On the other hand,
reduced midgut epithelium height was not observed until 21 dph, suggesting that midgut
epithelium height might be a good indicator for starvation over longer periods of time in lumpfish.

II
Sammendrag
Global akvakulturproduksjon av Atlantisk laks (Salmo salar) har stabilisert seg siden 2012
grunnet høy prevalens av den ektoparasittiske lakselusen (Lepeophtheirus salmonis). Utsett av
lusespisende rensefisk er ansett som en av de mest effektive og bærekraftige tiltakene for å
kontrollere utbrudd av lakselus i laksemerder, hvorav rognkjeks (Cyclopterus lumpus) er den mest
anvendte og kommersielt produserte arten i Norge. Den norske akvakulturproduksjonen av
rognkjeks har eksaltert i stor grad siden 2012 men er for tiden karakterisert ved variabel vekst og
overlevelse under yngelstadiet. Man vet også lite om ernæringskrav og fordøyelsessystem-
utvikling hos rognkjekslarver, hvorav sistnevnte er avgjørende for fiskelarvers kapasitet til å
assimilere næringsstoffer som er nødvendige for alle metabolske prosesser.
Dette studiet hadde som formål å beskrive utvikling av rognkjeksens fordøyelsessystem fra
klekking frem til dag 50 etter klekking (dph) basert på histologiske og stereologiske metoder,
samt å evaluere effekter av ulike startfôringsregimer på vekst, overlevelse og utvikling av lever,
magesekk og tarm. Utvikling og dietteffekter ble undersøkt ved å gjennomføre et startfôrings-
forsøk hvor tre parallelle grupper fikk ulike dietter under startfôringsperioden (2-22 dph). Larver
fra en gruppe fikk anriket Artemia mens to grupper ble gitt Acartia tonsa, enten gjennom hele
startfôringsperioden eller med en tidlig overgang til tørrfôr med en tilvenningsperiode fra 6-8
dph. Alle gruppene hadde en tilvenningsperiode til det samme tørrfôret fra 20-22 dph og ble gitt
dette fôret frem til forsøkets slutt 51 dph.
Fordøyelseskanalen til rognkjeks var inndelt i spiserør, primordial magesekk, midttarm og
baktarm ved klekking, ved hvilket tidspunkt kanalen var oppkveilet og åpen i begge ender.
Nyklekte larver hadde en differensiert lever med store, irregulære glykogenlignende vakuoler og
en eksokrin pankreas med tallrike zymogengranuler. Magesekken hadde utviklet gastriske
kjertler 10 dph (6.6 – 6.8 mm standardlengde) og var inndelt i tre regioner (carida, pylorus og
fundus) ved 34 dph. Ved dette tidspunktet var også magens lumenvolum signifikant større (8.0 –
9.1 mm standardlengde) og pylorusblindsekker var utviklet fremst i midttarmen. Fôring med
Artemia hadde positiv effekt på larvenes vekstrater, overlevelse etter plommeresorpsjon 21-34
dph og resulterte i raskere mageutvikling sammenlignet med larver gitt A. tonsa. Larvene hadde
mindre hepatocytter og hepatocyttkjerner, få hepatiske vakuoler og redusert midttarmepitel-
høyde under perioden de ble fôret A. tonsa. Effektene på leveren var tydelige 10 dph men ble
reversert etter overgang til tørrfôr, som indikerte at leveren nøyaktig reflekterte ernæringsstatus
hos larvene ved prøvetaking. Redusert midttarmepitelhøyde ble derimot ikke observert før 21
dph, hvilket tyder på at epitelhøyde i denne tarmregionen muligens er en god indikator for sult
over lengre perioder hos rognkjeks.

III
Acknowledgements
This Master’s thesis was written under guidance of Professor Elin Kjørsvik at the Department of
Biology, Norwegian University of Science and Technology (NTNU) in Trondheim. The experiment
was conducted at NTNU Centre of Fisheries and Aquaculture (SeaLab) and in the laboratories of
SINTEF Ocean from 9th of May until 29th of June 2017. Lumpfish eggs were supplied from MoreFish
AS at Tjeldbergodden in Norway and fish feed from relevant producers (C-Feed AS in Vanvikan,
Norway; Skretting AS in Stavanger, Norway; INVE Aquaculture in Belgium), while Elin Kjørsvik’s
operational budget from NTNU covered remaining expenses.
First, I would like to thank the companies that helped realizing this project by contributing fish
eggs and feed, and my supervisor Elin Kjørsvik for participating in planning of the project and for
exceptional guidance and constructive feedback during my analytical work and writing. Thanks
to Jan Ove Evjemo and Kjersti Rennan Dahl for great supervision in Artemia and microalgae
cultivation. I would like to thank Arne Kjøsnes and Frode Killingberg for providing brilliant
solutions concerning distribution of fish feed and management of the fish tanks. I am very grateful
for the excellent guidance by Tora Bardal during my laboratory and analytical work, and for
advices in statistical analysis by Frank Thomas Mlingi and Tu Anh Vu. And thanks to Jan Ove
Evjemo and Kjell Inge Reitan for reading the last thesis draft together with Elin Kjørsvik and
providing invaluable feedback leading to the final version of my thesis.
Many thanks to NJORD and other students at SeaLab for all “Cake Thursdays”, wine lotteries and
of course the cheerful and memorable moments, ranging from long lunch breaks to parties, beer
pong and bowling. A special thanks to fellow students Julie Terese Hanssen at NTNU and Job van
Mil at Wageningen University in the Netherlands for great cooperation during the experimental
work and constructive talks in retrospect of the experiment.
I would like to thank family and friends for their invaluable encouragement and support during
my whole study time here in Trondheim. Finally, I would like to express my sincere gratitude to
my fiancée Laila for her outstanding care and patience and our dog Prince for countless walks
where I had the chance to unwind from my studies. Laila, thank you for doing the largest share of
cooking and housekeeping when my study days became nights and last but not least for bringing
lots of love into my life.
_____________________________________________________
Joachim Larsen Marthinsen
Trondheim, June 2018

IV
Table of contents
Abbreviations ........................................................................................................................ 1
1 Introduction ....................................................................................................................... 3
1.1 Lumpfish in aquaculture ..................................................................................................................................... 3
1.1.1 Lumpfish as a cleaner fish .......................................................................................................................... 3
1.1.2 Knowledge gaps in lumpfish aquaculture ........................................................................................... 4
1.2 Digestive system development in fish larvae ............................................................................................. 6
1.2.1 Development of the liver and exocrine pancreas ............................................................................. 7
1.2.2 Development of the gastrointestinal tract .......................................................................................... 8
1.2.3 Histological biomarkers and nutritional status ................................................................................ 9
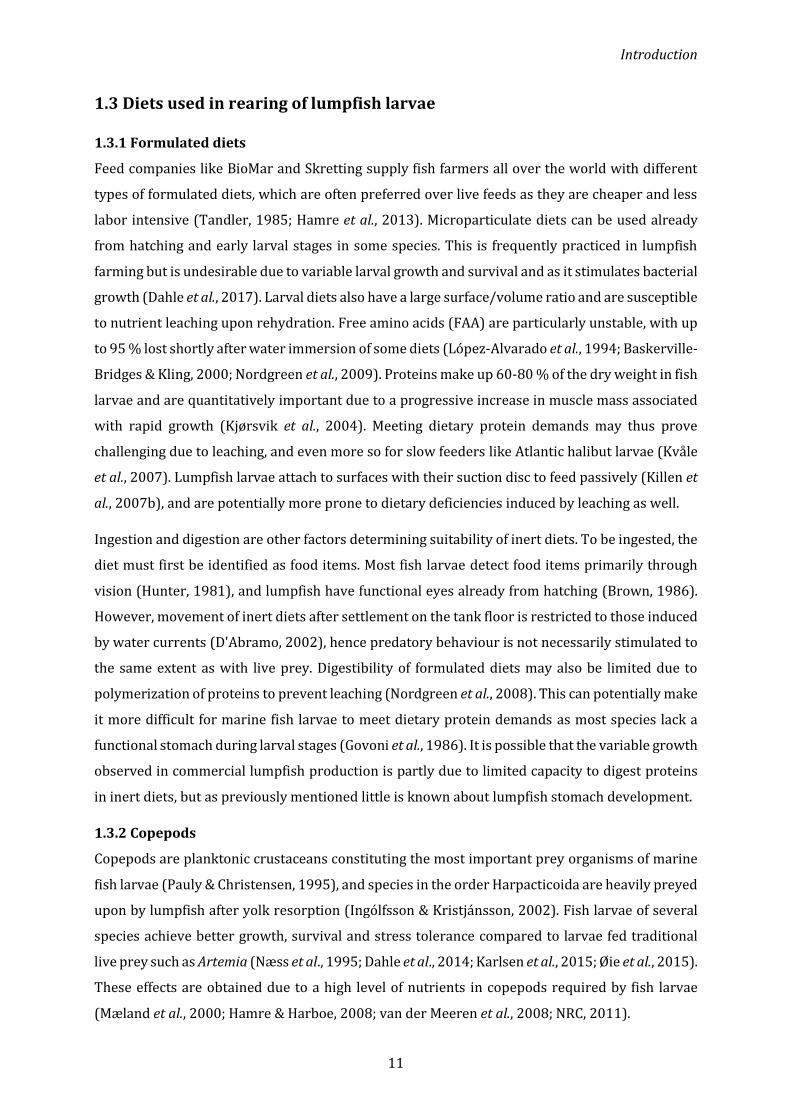
1.3 Diets used in rearing of lumpfish larvae ................................................................................................... 11
1.3.1 Formulated diets ........................................................................................................................................ 11
1.3.2 Copepods ....................................................................................................................................................... 11
1.3.3 Artemia ........................................................................................................................................................... 12
1.4 Aims and hypotheses ........................................................................................................................................ 14
2 Materials and methods ................................................................................................ 15
2.1 Start feeding of lumpfish larvae .................................................................................................................... 15
2.1.1 Larval rearing ............................................................................................................................................... 15
2.1.2 Larval feeding regimes ............................................................................................................................. 16
2.2 Live feed production .......................................................................................................................................... 18
2.2.1 Microalgae ..................................................................................................................................................... 18
2.2.2 Copepods ....................................................................................................................................................... 18
2.2.3 Artemia ........................................................................................................................................................... 19
2.3 Larval sampling and fixation .......................................................................................................................... 19
2.4 Larval growth and survival ............................................................................................................................. 20
2.4.1 Growth ............................................................................................................................................................ 20
2.4.2 Survival ........................................................................................................................................................... 21
2.5 Histological analyses ......................................................................................................................................... 21
2.5.1 Mapping of larval digestive system..................................................................................................... 21
2.5.2 Sample processing for histological analyses ................................................................................... 23
2.5.3 Liver analyses .............................................................................................................................................. 23
2.5.4 Stomach analyses ....................................................................................................................................... 24
2.5.5 Gut analyses .................................................................................................................................................. 25
2.6 Statistical analyses ............................................................................................................................................. 26

V
3 Results ............................................................................................................................... 27
3.1 Larval development and general observations ...................................................................................... 27
3.1.1 Larval development ................................................................................................................................... 27
3.1.2 General observations ................................................................................................................................ 29
3.2 Larval growth and survival ............................................................................................................................. 31
3.2.1 Dry and wet weight ................................................................................................................................... 31
3.2.2 Daily weight increase ................................................................................................................................ 32
3.2.3 Standard length ........................................................................................................................................... 34
3.2.4 Survival ........................................................................................................................................................... 35
3.3 Liver histology...................................................................................................................................................... 37
3.3.1 Liver morphology ....................................................................................................................................... 37
3.3.2 Hepatocyte nucleus area size ................................................................................................................ 39
3.3.3 Hepatocyte area size ................................................................................................................................. 40
3.3.4 Area fractions of liver components ..................................................................................................... 41
3.4 Stomach histology .............................................................................................................................................. 42
3.4.1 Stomach morphology ................................................................................................................................ 42
3.4.2 Stomach developmental stages ............................................................................................................ 45
3.4.3 Number of gastric glands ........................................................................................................................ 46
3.4.4 Stomach epithelium height..................................................................................................................... 47
3.5 Gut histology ......................................................................................................................................................... 48
3.5.1 Gut morphology .......................................................................................................................................... 48
3.5.2 Gut epithelium height ............................................................................................................................... 51
3.5.3 Gut microvillus height .............................................................................................................................. 52
3.5.4 Gut villus height .......................................................................................................................................... 54
3.6 Histology of other digestive organs ............................................................................................................ 55
3.6.1 Esophagus morphology ........................................................................................................................... 55
3.6.2 Pancreas morphology ............................................................................................................................... 57
3.6.3 Pyloric caeca morphology ....................................................................................................................... 58
3.7 Summary of digestive system development ............................................................................................ 59
4 Discussion ........................................................................................................................ 60
4.1 Lumpfish digestive system development ................................................................................................. 60
4.2 Larval performance in relation to start feeding diets .......................................................................... 63
4.2.1 Growth, development and survival ..................................................................................................... 63
4.2.2 Nutritional status – liver and gut histology ..................................................................................... 66
4.3 Methodological limitations ............................................................................................................................. 70
5 Conclusions ..................................................................................................................... 71
VI
6 References ....................................................................................................................... 72
7 Appendices ...................................................................................................................... 82
Appendix 1. Dehydration and embedding (Technovit® 7100) .............................................................. 82
Appendix 2. Staining protocols and tests ......................................................................................................... 83
Appendix 3. Results from the staining methods ............................................................................................ 84
Appendix 4. Functions in RStudio used for statistical analyses .............................................................. 86
Appendix 5. Mean dry weight per tank ............................................................................................................. 87
Appendix 6. Mean wet weight per tank ............................................................................................................ 89
Appendix 7. Daily weight increase per tank .................................................................................................... 91
Appendix 8. Mean standard length per tank ................................................................................................... 92
Appendix 9. Number of larvae per tank ............................................................................................................ 94
Appendix 10. Histological analyses: Liver, stomach and gut ................................................................... 95

Abbreviations
1
Abbreviations
ARA Arachidonic acid (20:4n-6). Polyunsaturated omega-6 fatty acid essential
for marine fish larvae.
Artemia larva Lumpfish larva fed Artemia during the treatment period (2-22 dph) in
the present study.
Copepod larva Lumpfish larva fed Acartia tonsa during the treatment period (2-22 dph)
in the present study.
DHA Docosahexaenoic acid (22:6n-3). Polyunsaturated omega-3 fatty acid
essential for marine fish larvae.
Dph Days post hatch. Number of days since a fish larva emerged from its egg.
DW Dry weight. Body mass of an individual fish larva dried at 60 °C for a
minimum of 24 hours.
DWI Daily weight increase. Percentage daily increase in dry weight over a
time interval.
d° Degree-days. Days post hatch multiplied with temperature (°C).
EPA Eicosapentaenoic acid (20:5n-3). Polyunsaturated omega-3 fatty acid
essential for marine fish larvae.
FA Fatty acid. Carboxylic acid with a carbon chain that is either saturated or
unsaturated (one or more double bonds).
FAA Free amino acid. Amino acid that is not linked to any other amino acid.
FD larva Lumpfish larva fed Acartia tonsa and Gemma micro 150 (Skretting AS,
Norway) during the treatment period (2-22 dph) in the present study.
HCl Hydrochloric acid. An acid produced and secreted by oxyntopeptic cells
in the stomach to denature dietary proteins.
Hg section Hindgut section. Cross section used for histological analysis of the
hindgut in lumpfish larvae from 0-50 dph in the present study.
HUFA Highly unsaturated fatty acid. Fatty acid containing two or more double
bonds and at least 20 carbon atoms in the carbon chain.
L section Liver section. Cross section used for histological analysis of the liver in
lumpfish larvae from 0-50 dph in the present study.
Mg section Midgut section. Cross section used for histological analysis of the midgut
in lumpfish larvae from 0-10 dph in the present study.

Abbreviations
2
NL Neutral lipid. Lipid insoluble in water solutions and containing no
charged groups.
PAS Periodic acid Schiff. Staining method used to detect polysaccharides in
tissues by oxidation of sugars to aldehydes that gives a purple-magenta
color with the Schiff reagent.
PBS Phosphate buffered saline. Buffer solution maintaining constant pH in
cells and tissues. Commonly used in biological research.
PFA Paraformaldehyde. Polymer that can be depolymerized into
formaldehyde in a solution to fixate biological material.
PL Phospholipid. Lipid consisting of two fatty acids and one phosphate
group. Important constituents in cell membranes.
SGR Specific growth rate. Fractional daily increase in dry weight over a time
interval.
SL Standard length. Distance from the tip of the snout to the notochord end
in a fish larva.
Si Stomach developmental stage. Categorical grouping of lumpfish larvae
based on ontogenetic characteristics (stage S1, S2 or S3) in the present
study.
S section Stomach section. Cross section used for histological analysis of the
stomach and midgut in lumpfish larvae from 21-50 dph and the stomach
(not midgut) in lumpfish larvae from 0-10 dph in the present study.
TAG Triacylglycerol. Neutral lipid consisting of three fatty acids. Important
metabolic energy source stored in cells.
TB Toluidine blue. Basic dye with high affinity for acidic components that
gives tissues a deep blue or purple color. Used to stain histological slides.
WW Wet weight. Body mass of an individual fish larva.
Yolk sac larva Lumpfish larva prior to introduction of feed 2 dph in the present study.
Introduction
3
1 Introduction
1.1 Lumpfish in aquaculture
1.1.1 Lumpfish as a cleaner fish
Global production of Atlantic salmon (Salmo salar) has escalated rapidly since the 1970s and
reached 2.1 million tonnes in 2012, of which 1.2 million tonnes were produced in Norway alone
(FAO, 2018). However, the annual production has since stabilized due to high prevalence of the
ectoparasitic sea lice (Lepeophtheirus salmonis) (Costello, 2006; Svåsand et al., 2016). Sea lice
infestations increases production costs and have negative impacts on both farmed and wild
salmon populations (Pike, 1989; Costello, 2009a,b; Iversen et al., 2015). Infected salmon are often
treated with chemical therapeutants (Burridge et al., 2010; Svåsand et al., 2016), but because of
increased resistance in sea lice and detrimental effects on non-targeted species (Egidius & Møster,
1987; Salte et al., 1987; Bjordal et al., 1988; Aaen et al., 2015), alternative delousing methods are
needed. This includes the use of cleaner fish, species of fish that partly feeds on parasites of
another fish species (Feder, 1966), which is more cost-effective than chemical treatment and
improves the welfare of farmed fish (Treasurer, 2002; Liu & vanhauwaer Bjelland, 2014).
Commercial production of cleaner fish is considered one of the most important measures to
control sea lice infestations (Marine Harvest, 2015).
Cleaner fish has been deployed in Norwegian Atlantic salmon and rainbow trout (Oncorhynchus
mykiss) sea cages for more than 20 years, but the use has increased greatly since 2008. A total of
37.4 million wild-caught and farmed individuals were utilized to combat sea lice in 2016 (Figure
1.1A; Norwegian Directorate of Fisheries, 2017a), of which lumpfish (Cyclopterus lumpus) was the
single most important species. Other species used are ballan wrasse (Labrus bergylta), goldsinny
wrasse (Ctenolabrus rupestris) and corkwing wrasse (Symphodus melops). Wrasses have been
used to control sea lice for almost three decades (Bjordal, 1991), but lumpfish as a cleaner fish
holds several advantages over these species. In contrast to wrasses, lumpfish remain active and
feed at low temperatures down to 4 °C (Sayer & Reader, 1996; Kelly et al., 2014; Nytrø et al., 2014),
and results from recent studies suggests that lumpfish is a more suitable cleaner fish in cold-water
environments (Imsland et al., 2014a,b). The production cycle of lumpfish varies from 4-7 months
(Towers, 2013; Nytrø et al., 2014; Powell et al., 2017), which is considerably shorter than the 1.5
years it typically requires to produce ballan wrasse ready for deployment (Helland et al., 2014).
Additionally, lumpfish is easier to culture, it can be stocked at higher densities (10-15 % of salmon
density versus 4 % in ballan wrasse) and it is less susceptible to Vibrio infections (Towers, 2013;
Imsland et al., 2014a). These differences are reflected in recent changes in the Norwegian cleaner
fish industry (Figure 1.1B). The number of farmed ballan wrasse has been low and stable from

Introduction
4
2012-2016 and reached a maximum of 1.3 million individuals in 2015 (Norwegian Directorate of
Fisheries, 2017b). On the other hand, production of lumpfish juveniles increased from 0.4 million
individuals in 2012 to 15.9 million in 2016 and was expected to reach 30 million in 2017 (Nodland,
2017; Norwegian Directorate of Fisheries, 2017b). Regardless of the rapid growth in commercial
lumpfish production, knowledge is still scarce in several areas of the production cycle.
Figure 1.1. Deployed and farmed cleaner fish in Norwegian Atlantic salmon and rainbow trout sea cages. A) Millions
wild-caught and farmed cleaner fish from 1998-2016. The circle chart displays species distribution (% of total number)
in 2016. B) Millions farmed lumpfish and ballan wrasse from 2012-2016. Source: Norwegian Directorate of Fisheries
(2017a,b).
1.1.2 Knowledge gaps in lumpfish aquaculture
A recent review by Powell and colleagues (2017) provides a description of the production cycle
of lumpfish and related challenges, ranging from the reliance on a wild-caught brood stock to
welfare issues and survival after deployment in sea cages. Larviculture, the farming of fish larvae
from hatching to ongrowing, is one of the key areas in the production cycle of lumpfish where
more information must be obtained. Rearing of lumpfish larvae is currently characterized by
variable growth and survival, and little is known about their biology in captivity and nutritional
requirements. As lumpfish is classified as ‘near threatened’ by IUCNs Red List because of reduction
in several natural stocks (Lorance et al., 2015), it must be produced entirely in captivity if the
demanded delousing rates are to be met in a sustainable way. To achieve a sustainable and reliable
production of high-quality lumpfish that can effectively control sea lice infestations in salmon
aquaculture, it is essential to overcome the abovementioned knowledge gaps. Some of these are
described in more detail in the following paragraphs.
0
5
10
15
20
25
30
35
40
1998 2001 2004 2007 2010 2013 2016
Nu
mb
er d
eplo
yed
(m
illi
on
s)
Year
0
2
4
6
8
10
12
14
16
18
2012 2013 2014 2015 2016
Nu
mb
er f
arm
ed (
mil
lio
ns)
Year
Lumpfish
Ballan wrasse
55
8
20
17
Lumpfish
Ballan wrasse
Goldsinnywrasse
Corkwingwrasse
A B

Introduction
5
Larval survival is a major problems in lumpfish larviculture. Powell et al. (2017) published data
from the Centre of Sustainable Aquatic Research (Swansea, UK) showing that high mortality is
observed 25-30 days post hatch (dph) when lumpfish larvae are reared at 10 °C. They pointed out
that this coincided with potential stress during weaning from Artemia to formulated diets.
Average survival after this period is approximately 78 %, although high variability is observed
among families. A significant drop in survival around 300 degree-days (d°) is known to also occur
in at least one Norwegian lumpfish farm (MoreFish AS, Tjeldbergodden, Norway, pers. comm.,
2018). It is thus important to understand potential factors influencing survival during the larval
stages of lumpfish. Survival in fish larvae of several species, including Atlantic cod (Gadus
morhua), Atlantic halibut (Hippoglossus hippoglossus) and ballan wrasse, is influenced by the diet
(Næss et al., 1995; Dahle et al., 2014; Øie et al., 2015).
Aspects related to feeding and nutrition are poorly understood in lumpfish larvae. In nature, they
feed primarily on harpacticoid copepods and amphipods in floating seaweed (Daborn & Gregory,
1983; Ingólfsson & Kristjánsson, 2002), whereas in captivity both live and formulated diets can
be used. Brown (1986) was among the first to conduct a start feeding trial with lumpfish, in which
Artemia salina was offered to one group and formulated diet to another. After given respective
diets for one month, larvae from the group fed A. salina and formulated diet had respective mean
lengths of 12 and 7 mm. More recent studies have also shown increased larval growth when
lumpfish are fed Artemia rather than inert diets (Nytrø et al., 2014; Belova, 2015), and it appears
that the copepod Acartia tonsa has the potential to improve growth and survival of lumpfish larvae
as well (Dahle et al., 2017). Still, many commercial producers of lumpfish feed their larvae
exclusively with formulated diets. Besides influencing growth and survival, nutritional condition
during larval stages can also have future impacts. For example, reduced delousing efficiency and
welfare in deployed lumpfish due to eye cataract can perhaps be explained by dietary deficiencies
during the larval phase (Powell et al., 2017).
Nutritional requirements must also be met to promote proper larval development (Steffens, 1989;
Sargent et al., 1999a,b), but little is currently known about functional development in lumpfish.
The digestive system is an important aspect of larval development, as the developmental, or
ontogenetic, status of digestive organs is decisive for digestive capacity (Govoni et al., 1986). This
will in turn influence a fish larva’s ability to assimilate dietary nutrients required for all metabolic
processes, ranging from cellular respiration to organ growth and development. Knowledge about
digestive system ontogeny in lumpfish in relation to different start feeding regimes will prove
valuable when optimizing larval rearing protocols in this species, which is important to secure an
effective and high-quality production of juveniles.

Introduction
6
1.2 Digestive system development in fish larvae
The digestive system in teleost fish (Teleostei) comprises the gastrointestinal tract, which in
juveniles and adults is divided into the buccopharynx, esophagus, stomach, intestine and anus.
The liver, gallbladder and exocrine pancreas are also part of the digestive system. All these organs
function in coordination to break down ingested feed into smaller units that are absorbed and
distributed to peripheral tissues (Figure 1.2). Digestive system ontogeny in teleosts is commonly
divided into three phases (Buddington, 1985; Bisbal & Bengtson, 1995): (1) the lecithotrophic
phase when larvae fully rely on endogenous yolk nutrients; (2) exogenous feeding phase with
limited proteolytic capacity due to an immature digestive system; (3) exogenous feeding phase
with full capacity to digest dietary protein due a developed and functional stomach. The first and
second phases may overlap in a period of mixed endogenous and exogenous feeding, as most fish
larvae capture and ingest food items before exhaustion of yolk reserves (Kjørsvik et al., 1991;
Bisbal & Bengtson, 1995). Despite the similarity in developmental pattern, the duration of each
stage is interspecific (Luizi et al., 1999; Zaiss et al., 2006), and knowledge about one species can
therefore not be extrapolated to other species. Understand digestive system ontogeny in lumpfish
is important so that commercial feeding regimes can be synchronized according to its
developmental status.
Figure 1.2. Processes in the teleostean digestive system. Ingested feed is exposed to digestive enzymes secreted by
gastric gland cells in the stomach (not shown) and the pancreas. Bile is synthesized in the liver (not shown) and secreted
by the gallbladder to facilitate lipid digestion. Digestion is assisted by motility along the gastrointestinal tract by a
contracting muscular layer. Digested feed is absorbed by enterocytes lining the intestinal mucosa. Undigested feed is
eliminated through the anus. Obtained and modified from Rønnestad et al. (2013).

Introduction
7
1.2.1 Development of the liver and exocrine pancreas
The liver develops embryologically as a glandular outgrowth of the primitive gut (Young et al.,
2006) and is differentiated before or after hatching depending on life history traits of the species
(Hoehne-Reitan & Kjørsvik, 2004). Atlantic cod and Atlantic wolffish (Anarhichas lupus) are
examples of species with a fully differentiated liver at hatching (Morrison, 1993; Hoehne-Reitan
& Kjørsvik, 2004), whereas in gilthead seabream (Sparus aurata) and Atlantic halibut the liver
develops during the endogenous feeding phase (Sarasquete et al., 1995; Hoehne-Reitan &
Kjørsvik, 2004). A functional liver consists of numerous parenchymal hepatocyte cells separated
by vascular channels called sinusoids. The sinusoids have both an arterial and venous blood
supply that transport oxygen and nutrients, respectively (Young et al., 2006). Nutrients entering
the liver originates from digested feed absorbed in the gastrointestinal tract and are stored
primarily as glycogen granules and lipids vacuoles residing in the hepatocyte cytoplasm (Lazo et
al., 2011). The timing and amount of hepatic nutrient accumulation is interspecific (Hoehne-
Reitan & Kjørsvik, 2004). As an example, lipid vacuoles are present in the liver of rainbow trout
from hatching (Vernier & Sire, 1977) but are not stored in Atlantic cod until after metamorphosis
(Lie et al., 1986). Apart from maintaining nutritional homeostasis by storing and mobilizing
nutrients, the liver synthesizes bile to emulsify dietary lipids in the midgut and facilitate digestion
by lipolytic enzymes such as bile-dependent lipase (Hoehne‐Reitan et al., 2001). Lipases and other
digestive enzymes are produced in the exocrine pancreas before or shortly after hatching to
condition intake of exogenous feed (Segner et al., 1993; Hoehne-Reitan & Kjørsvik, 2004).
The exocrine pancreas is a glandular organ of secretory cells grouped into acinar structures with
excretory ducts transporting digestive zymogens, inactive enzyme precursors, into the intestinal
lumen (Slack, 1995). In fish larvae, the exocrine pancreas generally appears as a differentiated
organ during the lecithotrophic phase, as seen for instance in European sea bass (Dicentrarchus
labrax) (Beccaria et al., 1991). This species follows a typical developmental pattern of the
pancreas found in teleostean larvae. At hatching, the organ is distinct and situated dorsally to the
alimentary canal before it develops fully differentiated exocrine cells, excretory ducts and blood
vessels before mouth opening (Beccaria et al., 1991). After fully differentiated, the exocrine
pancreas increases in size and constitutes a gradually more diffuse organ towards the end of the
larval stage (Kurokawa & Suzuki, 1996). Various digestive enzymes are secreted from the exocrine
pancreas in fish larvae, including trypsin and chymotrypsin for protein digestion and lipase and
phospholipase A2 for lipid digestion (see review by Hoehne-Reitan & Kjørsvik, 2004). Secretion of
digestive enzymes from the exocrine pancreas and bile salts from the gallbladder is regulated by
cholecystokinin-like peptide hormones produced by enteroendocrine cells in the gastrointestinal
tract of teleosts (Honkanen et al., 1988; Smith, 1989; Einarsson & Davies, 1997).

Introduction
8
1.2.2 Development of the gastrointestinal tract
Teleosts are categorized as either precocial or altricial based on degree of differentiation and
functionality of the alimentary canal at onset of first feeding (Kjørsvik et al., 2004). A few species
such as Atlantic salmon and Atlantic wolffish are precocial with a fully differentiated and
functional digestive system when exogenous feeding commences (Gorodilov, 1996; Falk‐Petersen
& Hansen, 2001). But in general, pelagic fish larvae are altricial with their digestive canal being an
undifferentiated tube closed at both ends at hatching (Kjørsvik et al., 1991; Ortiz-Delgado et al.,
2003). The mouth and anus open towards the end of lecithotrophic phase, and the digestive tract
form the foregut, midgut and hindgut (Govoni et al., 1986). The fore- and midgut is most active in
digestion and absorption of lipids, while the hindgut absorb proteins through pinocytosis. This
has been found for instance in Dover sole (Solea solea) and white seabream (Diplodus sargus)
(Boulhic & Gabaudan, 1992; Ortiz-Delgado et al., 2003). Absorptive capacity is greatly increased
during the exogenous feeding phase through longitudinal folding of the intestinal mucosa,
elongation and coiling of the gut and increased microvilli surface area (Boulhic & Gabaudan, 1992;
Bisbal & Bengtson, 1995; Wold et al., 2008). Towards the end of the larval stage, the foregut
differentiates further into the esophagus and stomach, whereas the midgut and hindgut form the
anterior and posterior intestine, respectively (Govoni et al., 1986).
The esophagus is the most anterior part of the alimentary canal and connects the posterior
pharynx to the anterior region of the primordial stomach in gastric fish species (see review by
Lazo et al., 2011). A differentiated stomach can be divided into a cardiac, fundic and pyloric region,
of which the cardia and pylorus are separated from the esophagus and intestine by muscular
sphincters that form during ontogeny (Chen et al., 2006). Compartmentalization of the stomach
allows it store ingested feed, a function that can be obtained before the proteolytic stomach
activity is established (Rønnestad et al., 2000b). This proteolytic function is mediated through
secretion of hydrochloric acid (HCl) and pepsinogen from oxyntopeptic cells (Garrido et al., 1993)
that denature and depolymerize dietary proteins into smaller peptide chains. As in higher
vertebrates, these cells are grouped into tubular gastric glands in lamina propria and open into
the lumen via gastric pits (Luizi et al., 1999; Zaiss et al., 2006). Appearance of the first gastric
glands indicate metamorphosis from the larval to juvenile stage accompanied with increased
digestive capacity (Tanaka, 1971). However, the glands are not necessarily functional directly
after they develop (Mähr et al.,1983; Huang et al., 1998; Darias et al., 2005). Age at formation of
gastric glands occurs already by 9 dph in shi drum (Umbrina cirrosa) but not until 60 dph in
Atlantic halibut (Luizi et al., 1999; Zaiss et al., 2006). As the duration from hatching to
development of optimal proteolytic capacity is species specific, it is crucial to study stomach
ontogeny in novel aquaculture species such as the lumpfish.

Introduction
9
Until the gastric function is developed, proteolysis is restricted to pancreatic proteases as well as
intestinal pinocytosis and intracellular digestion (Hoehne-Reitan & Kjørsvik, 2004; Kjørsvik et al.,
2004). The intestinal mucosa is composed of different cell types, of which columnar enterocytes
responsible for nutrient absorption are most abundant (Lazo et al., 2011). During maturation,
enterocytes increase in height and form a brush border of microvilli with enzymes such as
aminopeptidase, maltase and alkaline phosphatase that hydrolyze nutrients into absorbable
monomers (Zambonino-Infante & Cahu, 2001). Goblet and enteroendocrine cells develop in the
intestinal mucosa before or during the exogenous feeding phase (Sarasquete et al., 1995; Ortiz-
Delgado et al., 2003). Goblet cells secrete acidic and neutral mucosubstances to create a protective
barrier between the mucosa and gut lumen which may also facilitate pinocytosis (Kapoor et al.,
1975; Domeneghini et al., 1998). Enteroendocrine cells receive signals from ingested feed and
secrete peptide hormones to control peristaltic movement of the intestinal muscularis (Kamisaka
et al., 2001), as well as secretory activities of the exocrine pancreas and gallbladder (Honkanen et
al., 1988; Smith, 1989; Einarsson & Davies, 1997). Pancreatic zymogens are activated in the gut
lumen by the pancreatic protease trypsin, which itself is activated by the enterocytic brush border
enzyme enterokinase and active trypsin (Brannon, 1990). Pancreatic enzymes have maximum
catalytic activity in alkaline pH, which is obtained from bicarbonate (HCO3-) secreted from the
exocrine pancreas and bile salts from the gallbladder (Hoehne-Reitan & Kjørsvik, 2004). In
summary, digestion in teleosts depends on several processes and require that all involved organs
are fully developed to reach optimum capacity (Govoni et al., 1986).
1.2.3 Histological biomarkers and nutritional status
Some digestive organs exhibit different cellular mechanisms in response to diet quantity and
quality, and the nutritional condition of fish larvae can thus be assessed by histological biomarkers
(Table 1.1). Two such biomarkers are nutrient content and hepatocyte structure in the liver.
Lipids and glycogen are rapidly mobilized during starvation to maintain nutritional homeostasis,
hence the quantity of hepatic energy stores can be used to assess nutritional status (Weis, 1972;
Leatherland, 1984; Segner & Möller, 1984). Fish larvae with a high energy content usually have
large hepatocytes with their nucleus displaced in a peripheral position by lipid vacuoles, whereas
food-deprived larvae have smaller hepatocytes with a central nucleus (Gisbert et al., 2008).
Nutritional status is also reflected in hepatocyte nucleus size, as a large nucleus with increased
surface area allows for more rapid transfer of molecules between the nucleus and cytoplasm,
indicating high metabolic activity (Ghadially, 1997). In contrast, reduced hepatonuclear size is
associated with malnourishment and low growth rates (Segner et al., 1988; Wold et al., 2009).
There are several other biomarkers in the liver indicative of nutritional status as well. In the case
starvation, histopathological changes include swelling and deformation of mitochondria, dilation
of sinusoids, large intercellular spaces and hypertrophy of bile canaliculi (Gisbert et al., 2008).

Introduction
10
Histological organization of the intestine is also sensitive to malnutrition (Table 1.1). Fish larvae
of several species have shown weakened absorptive capacity during periods of starvation and
suboptimal feeding, for example by reduced enterocyte height, degeneration of microvilli and
fewer and smaller intestinal folds. For example, a reduction in gut epithelium height have been
observed in starved larvae of both Atlantic herring (Clupea harengus) and European plaice
(Pleuronectes platessa) (Ehrlich et al., 1976). Kjørsvik et al. (1991) studied early ontogeny of the
digestive tract in Atlantic cod under controlled conditions. They found that larvae starved beyond
9 dph had highly restricted absorptive capacity due to degeneration of microvilli. A pilot study
with lumpfish larvae showed that the number and size of intestinal villi might be a sensitive
biomarker in this species, as the villi seemed smaller and less abundant in larvae fed formulated
diet rather than copepods (Dahle et al., 2017). Lipid and protein inclusions in enterocytes are also
useful parameters when assessing nutritional condition. Diets characterized by a high dietary
lipid content can result in intestinal steatosis, which may reduce digestion and absorption through
cellular abrasion, necrosis and inflammatory reactions (Deplano et al., 1989; Deplano et al., 1991;
Segner et al., 1993). Accumulation of acidophilic protein inclusions in the hindgut following
pinocytosis usually decline after the gastric proteolytic function is attained (Ortiz-Delgado et al.,
2003). Variations in the presence of these inclusions may therefore reflect nutritional physiology
in fish larvae such as proteolytic capacity.
Table 1.1. Histological biomarkers reflecting nutritional status in teleost larvae. Cellular criteria in the liver hepatocytes
and gut epithelium used to categorize nutritional condition: degraded (grade 1), average (grade 2) and healthy (grade
3). Obtained and modified from Lazo et al. (2011) and sources therein.
Tissue Condition (grade)
Degraded (1) Average (2) Healthy (3)
Liver
hepatocytes
Nearly all nuclei pyknotic
(shrunk) and with dark
clumped chromatin. The
cytoplasm lacks texture
and intracellular vacuoles
are absent. The cells are
small and indistinct.
At least 50 % of all nuclei
with dark granules and a
central position. Nearly 50
% of cytoplasm is granular
and vacuoles are reduced
or absent. Boundaries of
most hepatocytes are
visible.
Nuclei distinct and often
displaced laterally. The
cytoplasm is lightly stained
with abundant intracellular
vacuoles containing lipids
and glycogen. Hepatocyte
boundaries are prominent.
Gut
epithelium
Mucosal cell height
reduced by >50 %, with
some loss of striations in
the bordering microvilli.
Supranuclear vacuoles are
reduced or absent.
Mucosal cell height
reduced by 25-50 %, with
some loss of striations in
the bordering microvilli.
Supranuclear vacuoles are
reduced or absent.
Mucosa is deeply convoluted
and mosaic. Mucosal cells
are compact, pronounced in
height and with distinct
nuclei. Prominent supra-
nuclear acidophilic
inclusions and vacuoles.
Introduction
11
1.3 Diets used in rearing of lumpfish larvae
1.3.1 Formulated diets
Feed companies like BioMar and Skretting supply fish farmers all over the world with different
types of formulated diets, which are often preferred over live feeds as they are cheaper and less
labor intensive (Tandler, 1985; Hamre et al., 2013). Microparticulate diets can be used already
from hatching and early larval stages in some species. This is frequently practiced in lumpfish
farming but is undesirable due to variable larval growth and survival and as it stimulates bacterial
growth (Dahle et al., 2017). Larval diets also have a large surface/volume ratio and are susceptible
to nutrient leaching upon rehydration. Free amino acids (FAA) are particularly unstable, with up
to 95 % lost shortly after water immersion of some diets (López-Alvarado et al., 1994; Baskerville-
Bridges & Kling, 2000; Nordgreen et al., 2009). Proteins make up 60-80 % of the dry weight in fish
larvae and are quantitatively important due to a progressive increase in muscle mass associated
with rapid growth (Kjørsvik et al., 2004). Meeting dietary protein demands may thus prove
challenging due to leaching, and even more so for slow feeders like Atlantic halibut larvae (Kvåle
et al., 2007). Lumpfish larvae attach to surfaces with their suction disc to feed passively (Killen et
al., 2007b), and are potentially more prone to dietary deficiencies induced by leaching as well.
Ingestion and digestion are other factors determining suitability of inert diets. To be ingested, the
diet must first be identified as food items. Most fish larvae detect food items primarily through
vision (Hunter, 1981), and lumpfish have functional eyes already from hatching (Brown, 1986).
However, movement of inert diets after settlement on the tank floor is restricted to those induced
by water currents (D'Abramo, 2002), hence predatory behaviour is not necessarily stimulated to
the same extent as with live prey. Digestibility of formulated diets may also be limited due to
polymerization of proteins to prevent leaching (Nordgreen et al., 2008). This can potentially make
it more difficult for marine fish larvae to meet dietary protein demands as most species lack a
functional stomach during larval stages (Govoni et al., 1986). It is possible that the variable growth
observed in commercial lumpfish production is partly due to limited capacity to digest proteins
in inert diets, but as previously mentioned little is known about lumpfish stomach development.
1.3.2 Copepods
Copepods are planktonic crustaceans constituting the most important prey organisms of marine
fish larvae (Pauly & Christensen, 1995), and species in the order Harpacticoida are heavily preyed
upon by lumpfish after yolk resorption (Ingólfsson & Kristjánsson, 2002). Fish larvae of several
species achieve better growth, survival and stress tolerance compared to larvae fed traditional
live prey such as Artemia (Næss et al., 1995; Dahle et al., 2014; Karlsen et al., 2015; Øie et al., 2015).
These effects are obtained due to a high level of nutrients in copepods required by fish larvae
(Mæland et al., 2000; Hamre & Harboe, 2008; van der Meeren et al., 2008; NRC, 2011).

Introduction
12
Proteins make up more than half of the total dry mass in copepods (Olsen, 2004), of which free
amino acids (FAA) constitutes a significant fraction of total amino acid content (van der Meeren
et al., 2008). In contrast to amino acids bound in peptide chains, FAAs are easily absorbed by
enterocytes in the gut of marine fish larvae (Rønnestad et al., 2000a; Rønnestad et al., 2003). An
exogenous supply of FAAs is vital after yolk resorption as it is important in cellular energy
generation and synthesis of muscle proteins to facilitate larval growth (Fyhn, 1989; Rønnestad et
al., 1999; Kjørsvik et al., 2004). Some amino acids cannot be synthesized by fish de novo and are
required for normal growth (Jobling, 2004), all of which are present in copepods (Helland et al.,
2003). However, the quantity of dietary protein is more important as amino acid composition
varies little between organism groups. Apart from dietary protein content, composition of dietary
lipids is another crucial aspect of larval nutrition (Rainuzzo et al., 1997).
Lipids are composed of fatty acids (FA), some of which fish larvae are unable to synthesize de novo
and must be supplied through the diet. This includes the n-3 highly unsaturated fatty acids (HUFA)
docosahexaenoic acid (22:6n-3; DHA) and eicosapentaenoic acid (20:5n-3; EPA) and the n-6 HUFA
arachidonic acid (20:4n-6; ARA), which are important cell membrane constituents and considered
the most essential FAs in fish larvae (Izquierdo, 1996; Sargent et al., 1999a). Copepods have a high
n-3 HUFA content (Shields et al., 1999; van der Meeren et al., 2008), with a typical DHA/EPA ratio
of 2:1 and EPA/ARA ratio > 16:1 (Conceição et al., 2010). The n-3 HUFAs in copepods are primarily
located in their phospholipids (PL) (Albers et al., 1996) and are more effectively utilized for larval
growth and development compared to n-3 HUFAs in neutral lipids (NL) (Gisbert et al., 2005; Wold
et al., 2007; Kjørsvik et al., 2009; Wold et al., 2009). PLs are also required due to insufficient larval
synthesis (Sargent et al., 1993) and are important components in cell membranes and nervous
tissue (Sargent et al., 1999a). Additionally, PLs are emulsifying compounds and may thus improve
absorption of dietary NLs and lipoprotein synthesis for export of NLs assimilated in enterocytes
(Coutteau et al., 1997; Tocher et al., 2008).
1.3.3 Artemia
Encysted Artemia eggs are found in salt lakes worldwide and have been harvested since the 1960s
as a source of live prey to marine fish larvae (Sorgeloos, 1980; Bengtson et al., 1991; Dhont & van
Stappen, 2003). As these cysts are cheap and hatch into easily mass cultured nauplii when
incubated in seawater (Sorgeloos, 1980), Artemia has traditionally been used in larval production
of several marine species (Skiftesvik & Bjelland, 2003; Olsen et al., 2004). Artemia is currently also
used to feed lumpfish larvae at the Centre of Sustainable Aquatic Research (Swansea, UK) for two
to three weeks after hatching before they are weaned to inert diets (Powell et al., 2017). Despite
its popular use, the nutritional demands of marine fish larvae are often not met when fed Artemia
(Næss et al., 1995; Shields et al., 1999; Payne & Rippingale, 2000; Hamre et al., 2002).

Introduction
13
Artemia may contain sufficient levels of protein required by fish larvae (NRC, 2011), of which
around 50 % of the total protein is water-soluble (Hamre et al., 2002). Water-soluble proteins are
believed to be more easily digested by fish larvae than insoluble proteins often found in inert diets
(Carvalho et al., 2003). However, FAA content is much lower in Artemia than in copepods (van der
Meeren et al., 2008) and may limit growth since this is the dietary protein source most readily
assimilated by fish larvae (Rønnestad et al., 2000a; Rønnestad et al., 2003). For instance, it has
been found that larval growth rates in turbot (Scophthalmus maximus) fed Artemia is lower
compared to those fed copepods due to insufficient levels of free methionine (Conceição et al.,
1997). In the same study, the researchers also showed that uptake of dietary FAAs exceeded the
total larval FAA pool by a factor of ten on a daily basis, thus highlighting the necessity for FAAs
during larval stages. Artemia also have a low content of lipids and FAs crucial for marine fish
larvae, as seen for instance in Atlantic halibut (Hamre et al. 2002; Evjemo et al., 2003).
The relative content of PLs in Artemia rarely exceeds 30 % of their total lipids, whereas NLs such
as triacylglycerols (TAG) makes up approximately 70 % of their total lipid content (Hamre et al.,
2002; van der Meeren et al., 2008). A low level of dietary PLs might have a negative impact on
larval growth (Cahu et al., 2003). Neither do Artemia fulfil the larval requirements for n-3 HUFAs
as they contain no DHA and low amounts of EPA (Hamre et al., 2013). It is therefore necessary to
enrich Artemia with lipid emulsions to increase dietary DHA and EPA content. However, n-3
HUFAs in enriched Artemia are primarily located in the NL rather than PL fraction (Conceição et
al., 2010). This makes n-3 HUFAs less available for larval growth and development, as shown in
studies with Atlantic cod and European sea bass (Gisbert et al., 2005; Wold et al., 2007; Kjørsvik
et al., 2009; Wold et al., 2009). As for lumpfish, little is known regarding larval utilization
capability of n-3 HUFAs incorporated in NLs. Obtaining a desirable DHA/EPA ratio during
enrichment is also difficult as Artemia selectively metabolize DHA (Navarro et al., 1999). Low DHA
content in Artemia have shown negative effects on pigmentation and eye migration success in
Atlantic halibut larvae (Hamre et al., 2002; Evjemo et al., 2003). Moreover, increased dietary
NL/PL ratio in enriched Artemia may reduce lipid and FA utilization in fish larvae due to deficiency
in PLs to promote lipoprotein formation (Liu et al., 2002).

Introduction
14
1.4 Aims and hypotheses
As commercial lumpfish production is escalating, the present study was primarily motivated by
the fact that little is known about functional development of lumpfish larvae. The study aims were:
The aims were approached based on data from a start feeding experiment with lumpfish lasting
from hatching to 50 dph, in which three larval diets were compared during the start feeding period
from 2-22 dph: (1) Artemia, a traditional live feed in larviculture shown to benefit growth in
lumpfish larvae (Brown, 1986). (2) Acartia tonsa, the natural live prey for most fish larvae that is
advantageous for growth and development in several species (Næss et al., 1995; Evjemo et al.,
2003; Dahle et al., 2014; Karlsen et al., 2015; Øie et al., 2015). (3) Formulated diet, frequently used
in lumpfish production, after a short term feeding with A. tonsa (2-8 dph). The diets were chosen
in hope of attaining best possible growth so that ontogeny would be representable for larvae
reared under an optimized production protocol. The following was hypothesized:
Parameters used to investigate growth effects of different diets were dry weight (DW), daily
weight increase (DWI), wet weight (WW) and standard length (SL). The following morphometric
parameters were considered to evaluate development and dietary effects of digestive organs: (a)
Nucleus and cell area sizes of liver hepatocytes; (b) Area fractions of hepatocyte nuclei and hepatic
vacuoles; (c) Epithelium height of the stomach, midgut and hindgut mucosa; (d) Number of gastric
glands in the stomach mucosa; (e) Microvillus and villus height in the midgut and hindgut.
Application of stereological methods provided the tools necessary to quantify the morphometric
parameters of interest (a – e). Measurements were performed on digitalized transverse sections:
one through the liver (L section), one or two comprising the stomach and midgut (S/Mg section)
and one through the hindgut (Hg section). In addition to the transverse sections, longitudinal
sections were observed histologically to study development of digestive organs.
Aim 1: Provide a description of digestive system development in lumpfish from hatching to
50 dph based on histological and stereological methods.
Aim 2: Evaluate dietary effects on growth, survival and development of the liver, stomach and
gut in lumpfish larvae fed different diets during the start feeding period (2-22 dph).
Hypothesis 1: Feeding lumpfish larvae with either Artemia or A. tonsa during the entire start
feeding period (2-22 dph) will improve larval growth and survival compared to larvae weaned
earlier (6-8 dph) from A. tonsa to formulated diet.
Hypothesis 2: All three start feeding diets will promote proper digestive system development
in lumpfish larvae.

Materials and methods
15
2 Materials and methods
2.1 Start feeding of lumpfish larvae
2.1.1 Larval rearing
A total of 1.3 kg lumpfish eggs was provided from MoreFish AS at Tjeldbergodden, Norway. The
eggs had been kept at 7 °C for approximately 200 d° and was disinfected with Buffodine before
shipped to the larval rearing lab at NTNU Centre of Fisheries and Aquaculture (SeaLab) in
Trondheim, Norway. After arrival, the eggs were incubated in two demersal egg incubators (FT
family hatcher, Fish Tech AS, Norway) with continuous water flow (34 ppt salinity) and complete
darkness (0:24 light/dark). Temperature during incubation was steadily increased from 7 °C up
to 10 °C over the course of ten days.
After hatching occurred at approximately 300 d°, the fish were transferred from the hatching tank
and distributed to nine cylindroconical tanks at an obtained density of 55-77 larvae L-1. Each tank
contained 100 L of seawater (34 ppt salinity) that had previously been pumped from 70 m depth
in Trondheimsfjorden, filtered through a sand filter and a 1 μm filter, before microbially matured
based on Skjermo et al. (1997). During maturation, the water was continuously degassed to
prevent supersaturation of dissolved gasses before entering the larval rearing tanks with a
temperature of 10 °C. Water exchange rate was increased stepwise from 5 tank volumes day-1 to
25 tank volumes day-1 35 dph (Table 2.1). The tank water was ventilated by aeration tubes
positioned near the water outlet in each tank. Oxygen saturation was measured every third to
fourth day (ProODO Optical Dissolved Oxygen Instrument, YSI, USA) and was never below 80 %,
while temperature was measured daily (2000T Digital Thermometer, Digitron, England). Each
tank was illuminated with two fluorescent tubes (Sylvania Luxline Plus, 36W/830) from 03.00
AM-11.00 PM, maintaining a 20:4 light/dark regime during the whole experimental period. Two
or three grey silicon mats (ca. 15 x 20 cm) were installed in each tank to provide additional surface
area for the larvae to attach to.
Dead fish, debris and excess feed was removed from the tank bottom and walls once per day
during the live feed period. After weaning to formulated diet, the tanks were supplied with protein
skimmers to prevent accumulation of organic compounds in the water surface and cleaning was
conducted twice a day. The sieves covering the water outlet, situated in the middle of the tanks,
were exchanged and cleaned once every second or third day. These had a mesh size of 700 µm to
allow live prey to be flushed out over time.

Materials and methods
16
2.1.2 Larval feeding regimes
Three different feeding regimes were used during the start feeding experiment, each differing in
type of feed given from 2-22 dph (Table 2.1). The first group received Artemia during this time
interval (from now on referred to as the Artemia group). Newly hatched nauplii (instar I) were
used for feeding the first three days (2-4 dph), equal fractions of newly hatched and enriched
Artemia the following two days (5-6 dph), and only enriched Artemia from 7-22 dph (Table 2.2).
Acartia tonsa copepodites (stages CI-CIII) were used as live feed for the two remaining groups.
One group received copepods for the full period (from now on referred to as the Copepod group),
whereas the other was weaned to a formulated diet (Gemma micro 150, Skretting AS, Norway)
from 6-8 dph (from now on referred to as the FD group). Larvae from all groups were weaned
from respective diets to the same formulated diet (Gemma micro 300, Skretting AS, Norway) from
20-22 dph, which they were fed until the experiment was terminated 51 dph. Three replicate start
feeding tanks were used for each treatment, with a total of nine tanks.
The Artemia strain used in this experiment (EG ® INVE Aquaculture, Belgium) are approximately
900 µm in length when hatched (instar I) and grows to 1.2-1.3 mm (instar II-III) when enriched
over 24 hours, obtaining an individual dry weight of 2.2-2.5 µg (Jan Ove Evjemo, SINTEF Ocean
AS, pers. comm., 2018). Copepodites (CI-CIII) of A. tonsa have a cephalothorax length of 410-580
µm and a dry weight of 0.56-1.40 µg individual-1 (‘On growing of copepods’, user’s manual from
C-Feed AS). Live prey was transferred from their reservoirs to respective start feeding tanks
through silicon hoses (diameter: 12 mm external, 6 mm internal) by peristaltic pumps (Watson-
Marlow 520U with 313X 3 Roller Extension Pumphead, Watson-Marlow, USA) six times a day
during the light period (feeding cycle: 02.00 PM, 06.00 PM, 10.00 PM, 03.00 AM, 06.30 AM and
10.00 AM) (Figure 2.1A). Prey organisms were distributed to obtain the following densities in each
tank per feeding: 1000 L-1 2 and 3 dph, 1500 L-1 4 and 5 dph, 2000 L-1 6 dph, and finally 3000 L-1
for the remaining live feed period. Prey density was identical regardless of feeding regime.
When starting the weaning period 6 dph for the FD group and 20 dph for the Artemia and Copepod
groups, a feeding automat (Sterner 905, Fish Tech AS, Norway) was installed above each
individual rearing tank (Figure 2.1B). These were programmed with an online management
system (Normatic WebServer, Normatic AS, Norway) to deliver the following doses of formulated
feed based on feeding tables from Skretting AS (Martin Davidsen, Skretting AS, pers. comm.,
2018): 12 g day-1 from 6-8 dph, 24.4 g day-1 from 8-35 dph, 37.8 g day-1 from 36-40 dph, 44.1 g
day-1 from 41-44 dph, and finally 50.4 g day-1 from 45-51 dph. The dry feed was distributed to the
tanks 30-40 times every day during the light period. Before entering the tanks, the feed was mixed
with intake water in a funnel located beneath each feeding automat.

Materials and methods
17
Table 2.1. Experimental setup for start feeding of C. lumpus. Three different feeding regimes were used, each treatment having a triplicate number of tanks (n = 3). Days with overlapping feed
types indicates weaning periods. The experiment was conducted in 100 L cylindroconical tanks at a constant temperature of 10 °C and 20:4 light/dark cycle.
Figure 2.1. Feed distribution to larval rearing tanks. A) Larval rearing tank (left) and live feed tank
(right) used during the live feed period. A peristaltic pump was used to transfer water with live feed to
the larval rearing tanks. B) A feed automat located above each larval rearing tank was used to distribute
formulated diet. The feed was mixed with in-take water in a funnel before entering the tanks.
Illustration: Jon van Mil (Wageningen University, Netherlands).
Table 2.2. Percentage of Artemia stages fed per day to the Artemia group.
Newly hatched Artemia (instar I) were harvested 24 hours after the cysts
had been put up for hatching. Enriched Artemia were fed Multigain twice
in 24 hours before harvested.
Dph Artemia quality
Newly hatched (%) Enriched (%)
2-4 100 0
5-6 50 50
7-22 0 100
9 10 11 12 13 14 15 16 17 18 19 20 21 22 23 24 25 26 27 28 29 30 31 1 2 3 4 5 6 7 8 9-12 13 14 15 16 17 18 19 20 21-29
Dph 0 1 2 3 4 5 6 7 8 9 10 11 12 13 14 15 16 17 18 19 20 21 22 23 24 25 26 27 28 29 30 31-34 35 36 37 38 39 40 41 42 43-51
d° 300 310 320 330 340 350 360 370 380 390 400 410 420 430 440 450 460 470 480 490 500 510 520 530 540 550 560 570 580 590 600 610-640 650 660 670 680 690 700 710 720 730-810
Water exchange
Artemia
(n = 3)
Copepod
(n = 3)
Formulated diet
(n = 3)
Date
5 tank volumes day¯¹ 10 tank volumes day¯¹
June 2017
25 tank volumes day¯¹
May 2017
Artemia (Multigain)
Acartia tonsa (Rhodomonas baltica )
A. tonsa (R. baltica )
Formulated feed (Gemma micro 150)
Formulated feed (Gemma micro 300)
Formulated feed (Gemma micro 300)
Formulated feed (Gemma micro 300)
15 tank volumes day¯¹
A B

Materials and methods
18
2.2 Live feed production
2.2.1 Microalgae
The microalgae Rhodomonas baltica, derived from stock cultures at NTNU (clone NIVA 5/91,
Cryptophycea: Pyrenomonadales), was cultured semi-continuously and used as feed for the A.
tonsa copepodites. Production was conducted in two cylindrical 200 L polycarbonate plastic
cylinders with a diameter of 40 cm. Prior to inoculation, 1 mL Conwy medium L-1 seawater was
added as a source for inorganic nutrients (Walne, 1979). Each culture was continuously
illuminated by six fluorescent tubes (GE Polylux XLR™, 58W/830) pointing towards the cylinder
center from three different sides and aerated with 1-2% CO2. Every day, 40-50 L of each culture
was removed and replaced with new seawater and culture medium. The added seawater had
previously been filtered through a sand filter and a 1 µm mesh, before disinfected by chlorination.
Sodium hypochlorite (NaClO, 10-15 %) at a concentration of 0.25 mL L-1 was used to chlorinate
the water for at least five hours before it was dechlorinated with 0.03 g L-1 sodium thiosulphate
(Na2SO3) (Hoff & Snell, 1987). Dechlorination lasted for a minimum of five hours before the water
was ready for use with a temperature of 20 °C.
2.2.2 Copepods
Cultures of A. tonsa (clone DFH.AT1) copepodites (stages CI-CIII) were supplied in 25 L plastic
containers from C-Feed AS at Vanvikan, Norway. A total of three deliveries were received: the first
for feeding 2-6 dph, the second for feeding 7-14 dph and the third for feeding 15-22 dph. After
arrival at the start feeding facility (SeaLab), the density of each culture was estimated by adding
2-3 drops of Lugol’s iodine solution (recipe: 20 mL acetic acid (99-100 %), 200 g potassium iodide
and 10 g iodine in 200 mL distilled water) to a 20 mL sample and counting the number of
individuals. The cultures were then transferred to tanks identical to those used for the fish larvae,
and each tank contained enough copepods for one day of feeding (Table 2.3). Total volume in each
feed reservoir was 100 L for feeding 2-8 dph since both the Copepod and FD groups received A.
tonsa during this interval (n = 6 tanks). As only the Copepod group was fed A. tonsa from 9-22 dph
(n = 3 tanks), each feed reservoir used for feeding on these days contained only 50 L. Half the
volume of each tank was drained daily before starting a new feeding cycle at 02.00 PM. This was
replaced with fresh 10 °C seawater and 5-6 L of R. baltica culture that had been harvested during
its stationary phase when the culture had a dark red or brown color. The exact quantity of added
microalgae was not estimated because of low feed intake and slow growth of A. tonsa at low
temperatures (Miller et al., 1977; White & Roman, 1992). Aeration tubes were situated near the
water outlet in each tank, covered by bottom sieves with a 100 µm mesh to prevent copepods
from escaping. The copepods were exposed to a light/dark cycle and illumination source identical
to that of the fish larvae.

Materials and methods
19
Table 2.3. Number of A. tonsa used per day to feed the copepod and FD groups. The number per fish tank (N tank-1)
was obtained by multiplying feed concentration (N L-1 feeding-1) with fish tank volume (100 L) and number of feedings
per day (6). As only the Copepod group got A. tonsa from 9-22 dph, copepod tank volume was halved during this period.
Dph Concentration
(N L-1 feeding-1)
Number per fish
tank (N tank-1)
Fish
tanks
Total number
(N)
Copepod tank
volume (L)
2-3 1000 600 000 6 3 600 000 100
4-5 1500 900 000 6 5 400 000 100
6 2000 1 200 000 6 7 200 000 100
7-8 3000 1 800 000 6 10 800 000 100
9-22 3000 1 800 000 3 5 400 000 50
2.2.3 Artemia
Artemia cysts (EG ® INVE Aquaculture, Belgium) were weighed (w1) and hydrated in 20-25 °C
fresh water for one hour. These were decapsulated according to FAO’s manual for Artemia
production (Sorgeloos et al., 1986), originally described by Sorgeloos and colleagues (1977). The
decapsulated cysts were weighed again (w2) before stored at 4 °C for up to one week. Every day
the needed quantity of cysts was put up for hatching in a 60 L cylindroconical tank. The amount
was calculated from an assumed hatching efficiency of 200 000 nauplii g-1 dry weight of cysts
(determined from previous hatchings) and the obtained weight factor w2/w1 (gram wet weight
per gram dry weight). Heavily aerated seawater with a temperature of 25-28 °C was used to
optimize hatching conditions (Sorgeloos et al., 1986). After 24 hours, newly hatched Artemia were
separated from unhatched cysts and hatching debris before transferred to an enrichment tank at
a maximum density of 300 nauplii mL-1. The culture was enriched with 10 g Multigain (BioMar AS,
Norway) per 60 L of seawater twice during the next 24 hours, before being washed and
transferred to the feed reservoir. The reservoir contained 50 L stagnant seawater with a
temperature of 10 °C and was aerated from the bottom center in the tank. Illumination source and
light regime was the same as for the fish larvae. Culture density was determined prior to each new
feeding cycle.
2.3 Larval sampling and fixation
Before any further treatment, all sampled larvae were sedated using tricaine methanesulfonate
(MS-222 Finquel®, Argent Chemical Laboratories Inc., USA) with a concentration of 2 g L-1, diluted
approximately 1:1 with seawater from the fish rearing tanks. Number of larvae sampled on given
days post hatch are given in Table 2.4. It was not distinguished between treatments 0 and 2 dph
as feed had not yet been introduced at the time of sampling, hence these larvae were sampled
from the hatching tank. Larvae sampled for histological analyses were fixated in 4 %
paraformaldehyde (PFA) in phosphate buffered saline (PBS) with pH 7.4 (Apotekproduksjon AS,
Norway). Fixated larvae were stored in vials at 4 °C until processed further.

Materials and methods
20
Table 2.4. Number of larvae sampled and analyzed for histology and growth. Larvae on day 0 and 2 post hatch were
sampled from the hatching tank, and the numbers display total sample size (black). From 6-51 dph, sample sizes are
shown per tank for growth (light grey) and per treatment for histology (dark grey).
2.4 Larval growth and survival
2.4.1 Growth
Standard length (SL), dry weight (DW) and wet weight (WW) were measured on larvae at 13
different times during the experiment: 2 dph (n = 16), 6, 10, 13, 17, 21, 24, 29, 34 and 38 dph
(n = 5 per tank), and 42, 45 and 50 dph (n = 10 per tank). Additionally, samples were collected for
DW only at the day of hatching (n = 16) and before terminating the experiment 51 dph (n = 16 per
tank). SL was measured from the tip of the snout to the end of the notochord. When the notochord
was no longer visible, the caudal peduncle was used as the posterior measuring point. The
measurements were performed using the image processing software ImageJ (Schneider et al.,
2012) on pictures taken in a stereo microscope (Leica MZ75, Leica Microsystems, Germany; Zeiss
Axiocam ERc 5s, Zeiss Inc., Germany) at magnifications 0.63, 0.80 or 1.00. An accuracy of ± 0.1 mm
was used for all measurements. The images were also used to study external morphology of the
larvae. After rinsing the larvae in distilled water, they were placed individually in pre-weighed tin
capsules and their WW was determined using a micro balance (UMX2 Ultra-microbalance,
Mettler-Toledo, USA). The samples were then dried at 60 °C for a minimum of 24 hours before
weighed again to obtain the DW. Specific growth rates (SGR) were calculated for specific sampling
intervals according to the following equation (Houde & Schekter, 1981):
𝑆𝐺𝑅 = 𝑙𝑛𝑊2 − 𝑙𝑛𝑊1
𝑡2 − 𝑡1
where W2 and W1 is the individual larval dry weight at time t2 and t1, respectively. The obtained
SGR values were used to determine percentage daily weight increase (DWI) (Houde & Schekter,
1981):
𝐷𝑊𝐼 = (𝑒𝑆𝐺𝑅 − 1) ∙ 100%
Dph 0 2 6 10 13 17 21 24 29 34 38 42 45 50 51
Growth
Sampled
Analyzed
16
16
16
16
5
5
5
5
5
5
5
5
5
5
5
5
5
5
5
5
5
5
10
10
10
10
10
10
16
16
Histology
Sampled
Analyzed
15
5
15
0
10
0
10
5
10
0
10
0
10
5
10
0
10
0
10
5
10
0
10
5
10
0
10
5
0
0

Materials and methods
21
2.4.2 Survival
When the experiment was terminated 51 dph, all remaining larvae were euthanized with 2 g L-1
MS-222 and preserved in 70 % ethanol (VWR ®, USA). These were counted, and together with
registered samplings and mortalities, the total number of larvae in each tank was estimated.
Survival (St) throughout the experiment was calculated for each tank using the following equation:
𝑆𝑡 =𝑁𝑡
𝑁0∙ 100%
where Nt is the number of larvae alive at time t (dph) and N0 is the total number of larvae at the
start of the experiment. When performing the calculations, it was assumed that all sampled larvae
(ca. 10 % of the total larvae in each tank) would be alive 51 dph. Survival across treatments was
compared after the two weaning periods, 8 and 23 dph, as well as on day 34, 42 and 51 post hatch.
2.5 Histological analyses
2.5.1 Mapping of larval digestive system
The larval digestive system was first mapped using one larva from the Artemia group aged 50 dph
as a reference. This larva was dehydrated (Leica TP1020, Leica Biosystems, Germany) and
embedded in paraffin (Tissue-Tek® III Embedding wax, Sakura, UK), before cut into 4 µm thick
longitudinal sections parallel to the sagittal plane (Leica RM2255, Leica Biosystems, Germany).
One section every 100-200 µm was stained with Hematoxylin (Mayer’s hemalum solution, Merck,
Germany) and Eosin (Eosin Y-solution 0.5 % aqueous, Merck, Germany). Based on visual
examination of these slides (Zeiss Axioskop 2 plus, Zeiss Inc., Germany), transverse sectioning of
the digestive system was outlined (Figure 2.2): one section for the liver (L section), one or two
sections for the stomach and midgut (S/Mg section) depending on larval age, and one section for
the hindgut (Hg section). Reference points used during sectioning are listed in Table 2.5.

Materials and methods
22
Figure 2.2. Overview of transverse sectioning. Schematic drawing of C. lumpus larva 50 dph showing approximate
location for the liver (L section), stomach/midgut (S/Mg section) and hindgut (Hg section) transverse sections (vertical
lines). Body axes are displayed in the upper right corner and an example is shown for each section category. All pictures
are transverse sections from an Artemia larva (50 dph) stained with TB 0.05 %. Scale bars: 2.5 mm. Abbreviations: E =
esophagus, Hg = hindgut, Hg = hindgut section, L = liver, L section = liver section, Mg = midgut, S = stomach, S section =
stomach and midgut section.
Table 2.5. Reference points for transverse sectioning. The reference points were used during sectioning to decide when
to cut the liver (L section), stomach/midgut (S/Mg section) and hindgut (Hg section) transverse sections.
Transverse section Reference points
Liver (L section)
1. The liver constitutes a major proportion of the abdominal cavity’s total
area fraction.
2. The esophagus is still present and no transition to the stomach (or
developing stomach tissue) can be seen.
Stomach and midgut
(S/Mg section)
1. The first section that includes pancreatic tissue and comprises both the
stomach and the midgut (S section).
2. The liver is still present but covers a significantly reduced area.
3. For the youngest larvae (0 and 10 dph), one separate section is made for
the midgut alone (Mg section), taken directly after transitioning from the
stomach (or developing stomach tissue) to the gut.
Hindgut (Hg section)
1. The abdominal cavity and total muscle tissue covers an approximately
equivalent sized area.
2. The serosa surrounding the hindgut is ventrally connected to the
abdominal wall, in proximity of the anus (or the anus can be seen).
L section S section Hg section
L
S
Mg
Hg
Anus
E
L S
Mg
Hg
L section S section Hg section
Dorsal
Ventral
Anterior Posterior
Left
Right

Materials and methods
23
2.5.2 Sample processing for histological analyses
Histological analyses of the digestive system were performed on transverse sections of the larvae
0 dph (n = 5), 10, 21, 34, 42 and 50 dph (n = 5 per treatment). Additionally, longitudinal sectioning
was performed on one larva from the Artemia group for each of the selected age groups. SL was
measured on each larva (Section 2.4.1), before being dehydrated and embedded in plastic
(Technovit® 7100, Kulzer, Germany; Appendix 1). This was chosen as embedding material rather
than paraffin due to improved morphological resolution (Nusbickel & Swartz, 1979; Sasso-Cerri
et al., 2001). The embedded larvae were then cut into 2 µm sections by using a microtome (Jung
Autocut 2055, Leica Biosystems, Germany) with carbide metal blades (Leica TC65 Microtome
Blade, Leica Biosystems, Germany). The sections were stained with 0.05 % toluidine blue (TB)
(Honeywell Riedel-de-Haën™, Germany), a basic dye with high affinity for acidic components that
gives tissues a deep blue or purple color (Sridharan & Shankar, 2012). This staining method was
selected after performing small scale tests on liver and gut tissue (Appendix 2) as it was simple,
fast and resulted in high-resolution sections (Appendix 3). Each stained section was then mounted
(Neo-Mount®, Merck, Germany) and scanned in three 0.5 µm layers at 40x magnification using a
digital slide scanner (NanoZoomer SQ, Hamamatsu Photonics, Japan). An image acquisition
software (NDP.view2, Hamamatsu Photonics, Japan) was used to study development of digestive
system organs, focusing primarily on the liver, stomach and gut.
2.5.3 Liver analyses
Hepatocyte nucleus area size, hepatocyte cell area size and liver area fractions (hepatocyte nuclei,
lipid vacuoles and ‘other’), were estimated on images exported from NDP.view2 to ImageJ. One
image with an area size of 175 266.3 µm2 was exported per liver section (L section) and larva,
encompassing the whole liver (0 and 10 dph) or a randomly selected area consisting exclusively
of liver tissue (21-50 dph). The freehand selection tool in ImageJ was used to measure the area
size of individual hepatocyte nuclei (see also Pantic et al., 2016), on average 257 per image. Nuclei
touching the edges of the image or missing a distinct nucleolus were not measured. This data was
used to estimate two parameters: Hepatocyte cell size, calculated as analyzed liver area divided
by the number of nuclei within the frame (Aliver/Nnuclei), and nuclear area fraction, calculated as the
total nuclear area divided by analyzed liver area (Anuclei/Aliver). A point grid was applied to each
image to estimate the area fraction constituted by vacuoles in the hepatocytes (Avacuoles/Aliver;
Gundersen et al., 1988), using ImageJ’s Cell Counter plugin as a counting tool. The point grid had
a density ensuring 200 points or more to hit the liver tissue (after Wold et al., 2009). Finally, the
sum of nuclear and vesicular area fractions was used to derive the total area fraction of ‘other’
liver components (Aother/Aliver), such as bile canaliculi, hepatocyte organelles, sinusoids and more.

Materials and methods
24
2.5.4 Stomach analyses
Stomach epithelium height was measured, development categorized, and total number of gastric
glands in the stomach mucosa counted on each stomach section (S section) and larva using
NDP.view2. Epithelium height was defined as the distance from the basal lamina to the apical
membrane and was measured at five random points in each section with an accuracy of ± 0.1 µm
(Figure 2.3A). Development was categorized into three different ontogenetic stages (Si) using the
following criteria: the primordial stomach appears as a slight enlargement of the esophagus (S1);
tubular gastric glands are present in the stomach mucosa (S2); formation of the fundic stomach
and greatly increased lumen volume (S3, Figure 2.3B-D). Based on these categories, intervals
(a – b) were determined to obtain a size range at transition to S2 and S3 from S1 and S2, respectively.
The smallest number in the interval (a) represents the SL of the smallest larva in the respective
developmental stage (S2/3), whereas the largest number (b) denotes the SL of largest larva that
had not yet reached this stage (S1/2).
Figure 2.3. Measurements and stomach developmental stages in C. lumpus. A) Epithelium height (Eh) was measured
from the basal lamina to the apical membrane (50 dph). Scale bar: 50 µm. B) S1: The stomach is an enlargement of the
esophagus (10 dph). Scale bar: 100 µm. C) S2: Gastric glands (*) can be seen in the stomach mucosa (21 dph). Scale bar:
250 µm. D) S3: Greatly increased lumen volume and formation of the fundic stomach region (50 dph). Scale bar: 250 µm.
All pictures are transverse sections of larvae from Artemia treatment stained with TB 0.05 %.
A B
C D
Eh
*
*
*
*
* *

Materials and methods
25
2.5.5 Gut analyses
Epithelium, microvillus and villus height were measured on the midgut (S/Mg) and hindgut (Hg)
sections of each larva using NDP.view2. Epithelium height was defined as the distance from the
basal lamina to the borderline between the microvilli and gut lumen, whereas microvillus height
was measured from the apical membrane of the enterocytes to the borderline between the
microvilli and gut lumen (Figure 2.4A). The epithelium and microvillus height variables were
measured both dorsally and ventrally at five random points in the gut of each section with
accuracies of ± 0.1 µm. Paired sample t-tests and Wilcoxon’s signed-rank tests were used on
normally and non-normally distributed data, respectively, to test whether the position factor
(dorsal versus ventral) had a statistically significant effect within each treatment 10 and 50 dph.
One test was run per variable and section category (S/Mg and Hg section). As only two out of 24
tests returned a significant result (p < 0.05), the position factor was neglected to obtain ten
measurements per variable and section of all larvae. Villus height was also defined as the distance
between the basal lamina and the borderline between the microvilli and lumen but was only
measured at places where the mucosa was folded to form distinct villi (Figure 2.4B). Up to five
villi were measured per section with an accuracy of ± 1 µm.
Figure 2.4. Measurements in the gut of C. lumpus. A) Epithelium height (Eh) was measured from the basal lamina to the
borderline between the microvilli and gut lumen, whereas microvillus height (Mh) was measured from the apical
membrane to the borderline between the microvilli and gut lumen. Scale bar: 25 µm. B) Villus height (Vh) was measured
from the basal lamina to the borderline between the microvilli and gut lumen in areas where the mucosa was folded to
form villi. Scale bar: 100 µm. All pictures are transversal sections of larvae from the Artemia treatment 50 dph stained
with TB 0.05 %.
A B
Eh Mh
Vh

Materials and methods
26
2.6 Statistical analyses
All statistical analyses were performed in R 3.4.3 (R Core Team, 2017) with RStudio (RStudio
Team, 2016). In addition to default R packages, the following packages were installed to conduct
statistical testing: ‘car’ (Fox et al., 2017), ‘FSA’ (Ogle, 2017), ‘mutoss’ (Team MC et al., 2012) and
‘PMCMRplus’ (Pohlert, 2018). All applied R functions and in which package they were found are
listed in Appendix 4. A significance level of α = 0.05 was used for all statistical tests except for
correlations and regressions, where α = 0.01 was used. Differences were thus considered
statistically significant when p < 0.05 and p < 0.01, respectively. In the result section (Section 3),
an asterisk (*) following a p-value denotes tests that were evaluated with α = 0.01 to distinguish
the two significance levels. Data consisting of percentages and area fractions were transformed to
arcsine values before applying statistical tests. Graphs and tables were made in Microsoft Office
Excel 2016, and all mean values are presented with corresponding standard errors (± SE).
Normality was tested using a Shapiro-Wilk test. Additionally, due to small sample sizes, quantile-
quantile (Q-Q) plots were investigates visually to evaluate normality. Levene’s test was then
applied to test homogeneity of variance between treatments. Differences in group means of
normally distributed data were compared using one-way analysis of variance (ANOVA), followed
by Student-Newman-Keuls’ post hoc test. When the data was normally distributed but variance
between treatments heteroscedastic, Welch’s ANOVA was used to compare group means, and
pairwise comparisons were conducted using Dunnett’s T3 test post hoc test. The non-parametric
Kruskal-Wallis was applied to non-normal data, followed by Dunn’s post hoc test with Holm’s
correction for adjustment of p-values (Holm, 1979). Paired sample t-tests and Wilcoxon’s signed-
rank tests were used on normally and non-normally distributed data, respectively, to compare
mean values for different age groups within the same treatment. Linear correlation between
continuous variables was tested with a two-tailed Pearson’s correlation test. When significant
correlations were found, linear regression was conducted to define the relationship between the
two variables of interest and to obtain the coefficient of determination (r2). Analysis of covariance
(ANCOVA) was used to investigate if the linear equations differed significantly between the
treatments.

Results
27
3 Results
3.1 Larval development and general observations
3.1.1 Larval development
External and internal characteristics of lumpfish larvae and their development from hatching to
34 dph are provided in Table 3.1, which should be read while reviewing Figure 3.1 and 3.2. The
descriptions are based on specimens from the Artemia group, as larvae from this treatment
exhibited best growth (Section 3.2). Few apparent morphological changes were observed after 34
dph, and more detailed descriptions the digestive organs and how each of them developed
throughout the experiment are covered in the following sections (Section 3.3-3.6).
Table 3.1. Larval development of C. lumpus 0-34 dph. Morphology of live and sectioned larvae from the Artemia group
0, 10, 21 and 34 dph. The descriptions are based on Figure 3.1 and 3.2.
Dph Description
0
Live larvae. The body shape resembled that of a tadpole (Figure 3.1A), with a large
head and trunk (region between the head and anus) and laterally flattened tail (region
behind the anus). The eyes, head and trunk were well pigmented by yellow (head and
trunk) and black (eyes, head and trunk) pigment cells. The tail region was transparent
and surrounded by a continuous fin fold. Fin rays were visible in the pectoral and
caudal fins. The suction disc was differentiated and functional, situated on the ventral
side of the larval trunk. Red blood cells were observed circulating in the heart, gills
and some major blood vessels. Each gill was hidden by a gill cover.
Sectioned larvae. The yolk sac occupied most of the abdominal cavity and all
digestive organs had a dorsal position (Figure 3.2A). The liver was small and situated
to the left in the anterior abdomen. The alimentary canal had coiled to form a loop, was
separated into an anterior and posterior half by an intestinal valve (not shown) and
was open at both ends. The exocrine pancreas was attached dorsally to the gut. The
stomach anlage appeared as a dilatation posterior to the esophagus (not shown).
10
Live larvae. A pair of transparent external nostrils were observed above the mouth
and light reflecting pigment cells had appeared on each side of the head region,
reaching from the mouth to the end of the gill cover (Figure 3.1B). The tail region was
more muscular compared to that of newly hatched larvae and was covered with yellow
and black epidermal pigment cells. All fins had well developed fin rays, and the first
dorsal fin was partly overgrown by epidermal tissue. The fin fold was almost fully
resorbed, with only some remnants surrounding the individual fins along the tail. The
notochord end was flexing upwards above the caudal fin (flexion stage).

Results
28
Table 3.1. Larval development of C. lumpus 0-34 dph (continued). Morphology of live and sectioned larvae from the
Artemia group 0, 10, 21 and 34 dph. The descriptions are based on Figure 3.1 and 3.2.
Dph Description
10
Sectioned larvae. The yolk sac was reduced in size and restricted to the right half of
the abdominal cavity, surrounded by digestive organs that had increased in volume
since hatching (Figure 3.2B). The liver had grown to cover most of the anterior
abdomen’s left half, whereas the gut had elongated and coiled further. The pancreas
had increased in size, with the exocrine part enveloping the endocrine tissue. Gastric
glands had appeared in the stomach region (not shown).
21
Live larvae. The whole larval body was fully pigmented with primarily yellow and
black epidermal pigment cells (Figure 3.1C). The fin rays of the first dorsal fin were no
longer visible as this fin was entirely overgrown by the epidermis. The second dorsal,
caudal and anal fins appeared to be fully developed, and the fin fold was completely
resorbed.
Sectioned larvae. Further reduced yolk sac volume was accompanied by an increased
volume of liver and gut tissue (Figure 3.2C). The liver constituted the major organ in
the left half of the anterior abdomen, whereas the gut occupied most of the remaining
abdominal space. The pancreas was no longer a compact organ but had branches
reaching out to different areas along the gut (not shown).
34
Live larvae. The body shape was less slender compared to younger larvae due to
seemingly larger body height (vertical distance from ventral to dorsal side at a given
point along the body) relative to standard length (Figure 3.1D). Body pigmentation
appeared more variable among individuals regardless of treatment, ranging from
yellow to red and brown. Several fins (e.g. second dorsal and caudal fins) had attained
some but very faint pigmentation.
Sectioned larvae. The yolk sac was completely resorbed, and the space previously
occupied by the yolk sac had been replaced by digestive organs. Morphogenesis of the
stomach was complete as it was differentiated into the cardia, fundus and pylorus
(Figure 3.2D). The stomach had greatly increased lumen volume and occupied a
significant share of the dorsal and central parts of the abdomen. A distinct cardiac and
pyloric sphincter separated the stomach from the esophagus and intestine,
respectively. Pyloric caeca were present at the gastrointestinal junction in the anterior
end of the midgut.

Results
29
3.1.2 General observations
Most larvae were constantly swimming around after transfer to their respective tanks on the day
of hatching. After introducing feed 2 dph, most individuals were instead attached to either tank
surfaces or the installed silicon mats. This behavior was most common in the Artemia tanks,
whereas a comparably larger fraction of the Copepod and FD larvae kept moving around in the
water column during the start feeding period (2-22 dph). Larvae from the Artemia group were
more difficult to catch during sampling than larvae from the two other groups.
Figure 3.1. External morphology of C. lumpus 0-34 dph. Each picture represents a larva from the Artemia treatment on
different days: A) newly hatched (0 dph), B) 10 dph, C) 21 dph and D) 34 dph. Photos taken by Job van Mil (Wageningen
University, Netherlands). Scale bar: 1 mm.
A
B
C
D
1 mm
1 mm
1 mm
1 mm

Results
30
Figure 3.2. Development of the digestive system in C. lumpus 0-34 dph. Each picture represents a larva from the Artemia
treatment on different days: A) newly hatched (0 dph), B) 10 dph, C) 21 dph and D) 34 dph. All pictures are longitudinal
sections stained with TB 0.05 %. Scale bar: 1 mm (A and B) and 2.5 mm (C and E). Abbreviations: Cs = cardiac stomach,
E = esophagus, Fs = fundic stomach, G = gut, L = liver, P = pancreas, Ps = pyloric stomach, St = stomach, Ys = yolk sac.
A
B
C
D
L G
G Ys
L
Ys
P G
G
G
G
G L
St
G G
Cs
G
L
E
E
Ps
Fs

Results
31
3.2 Larval growth and survival
3.2.1 Dry and wet weight
Larval dry weight (DW) was on average 1.07 ± 0.01 mg before introducing feed 2 dph (Figure 3.3,
Appendix 5). Larvae initially fed Artemia grew exponentially during the whole experiment and
were significantly larger than Copepod and FD larvae already by 6 dph. On the other hand, limited
larval growth was observed in the Copepod and FD groups until 34 and 29 dph, respectively.
Copepod larvae were larger than FD larvae 13-21 dph, coinciding with the period when A. tonsa
was supplied exclusively to the Copepod group. These differences were statistically significant 13
and 17 dph. After weaning to Gemma micro 300, the highest mean DW amongst Copepod and FD
larvae was mostly observed in the FD treatment, with the largest difference 29 dph (p = 0.08).
However, no significant differences were found between these two groups for the remainder of
the experiment. When terminating the experiment 51 dph, Artemia larvae had attained a DW that
was approximately the double of that of Copepod and FD larvae.
Figure 3.3. Mean dry weight in C. lumpus 0-51 dph. The averages (mg larva-1) are based on an increasing sample size:
n = 16 (0 and 2 dph), n = 15 per treatment (6-38 dph), n = 30 per treatment (42-50 dph) and n = 39-48 per treatment
(51 dph). The grey dashed lines denote weaning from A. tonsa to Gemma micro 150 in the FD group, whereas the black
dashed lines denote weaning from respective feeds to Gemma micro 300 in all groups. Significant differences (p < 0.05)
between treatments at a given age are denoted by different letters. Errors bars indicate ± standard error (SE). The
vertical axis is in logarithmic scale.
0.5
5.0
0 5 10 15 20 25 30 35 40 45 50
Dry
wei
ght
(mg
larv
a¯¹)
Dph
Artemia
Copepod
FD
a a
a
a
a a
a
a a
a a
a
a
b b
b b b
b
b
b b
b
b
b b
c c
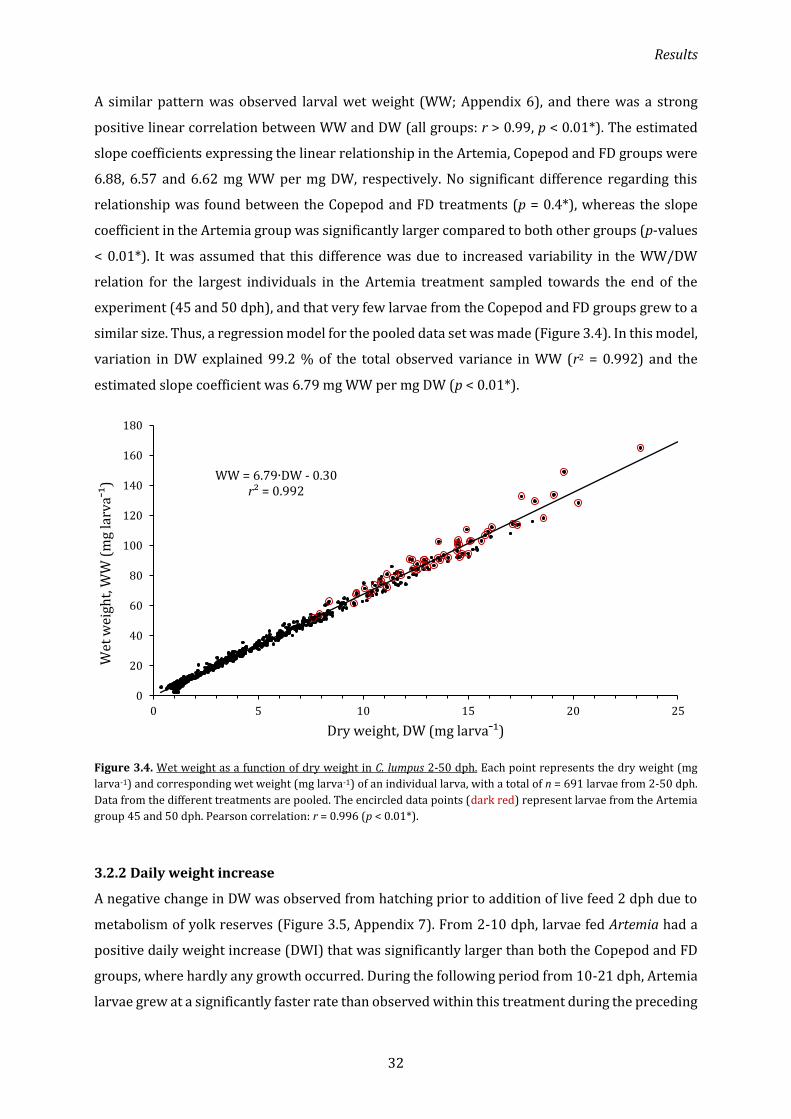
Results
32
A similar pattern was observed larval wet weight (WW; Appendix 6), and there was a strong
positive linear correlation between WW and DW (all groups: r > 0.99, p < 0.01*). The estimated
slope coefficients expressing the linear relationship in the Artemia, Copepod and FD groups were
6.88, 6.57 and 6.62 mg WW per mg DW, respectively. No significant difference regarding this
relationship was found between the Copepod and FD treatments (p = 0.4*), whereas the slope
coefficient in the Artemia group was significantly larger compared to both other groups (p-values
< 0.01*). It was assumed that this difference was due to increased variability in the WW/DW
relation for the largest individuals in the Artemia treatment sampled towards the end of the
experiment (45 and 50 dph), and that very few larvae from the Copepod and FD groups grew to a
similar size. Thus, a regression model for the pooled data set was made (Figure 3.4). In this model,
variation in DW explained 99.2 % of the total observed variance in WW (r2 = 0.992) and the
estimated slope coefficient was 6.79 mg WW per mg DW (p < 0.01*).
Figure 3.4. Wet weight as a function of dry weight in C. lumpus 2-50 dph. Each point represents the dry weight (mg
larva-1) and corresponding wet weight (mg larva-1) of an individual larva, with a total of n = 691 larvae from 2-50 dph.
Data from the different treatments are pooled. The encircled data points (dark red) represent larvae from the Artemia
group 45 and 50 dph. Pearson correlation: r = 0.996 (p < 0.01*).
3.2.2 Daily weight increase
A negative change in DW was observed from hatching prior to addition of live feed 2 dph due to
metabolism of yolk reserves (Figure 3.5, Appendix 7). From 2-10 dph, larvae fed Artemia had a
positive daily weight increase (DWI) that was significantly larger than both the Copepod and FD
groups, where hardly any growth occurred. During the following period from 10-21 dph, Artemia
larvae grew at a significantly faster rate than observed within this treatment during the preceding
WW = 6.79∙DW - 0.30r² = 0.992
0
20
40
60
80
100
120
140
160
180
0 5 10 15 20 25
Wet
wei
ght,
WW
(m
g la
rva¯
¹)
Dry weight, DW (mg larva¯¹)

Results
33
time interval (2-10 dph). DWI had also increased in the Copepod and FD groups from 10-21 dph,
but this was not of statistical significance. No significant difference in DWI was detected between
Artemia and FD larvae from 10-21 dph due to large variation between FD tanks. Over the course
of the whole treatment period (2-22 dph), DW increased by an average of 5.53 ± 0.13 % day-1 in
the Artemia treatment. This was significantly larger compared to DWI in the Copepod and FD
groups, with respective means of 1.15 ± 0.39 % and 0.57 ± 0.62 % day-1.
A significant increase in DWI was observed within the FD treatment in the 21-34 dph interval
compared to preceding periods, whereas no significant changes were found within the Artemia
and Copepod treatments. Although not statistically significant, the FD group also exhibited a larger
DWI from 21-34 dph compared to the two other groups. During this period, Artemia and Copepod
larvae were adjusting to the formulated diet after weaning from their respective live feeds,
whereas FD larvae were simply given larger particles of the same diet (Gemma micro 300 instead
of 150). No significant differences were observed between treatments during any of the three
periods following weaning (21-34, 34-42 and 42-50 dph), and DWI was also highly variable within
each treatment. The Artemia, Copepod and FD groups had respective growth rates of 6.35 ± 0.24,
4.88 ± 0.19 and 5.04 ± 0.09 % day-1 over the course of the experiment (2-51 dph), none of them
which differed significantly from each other (p > 0.05).
Figure 3.5. Mean daily weight increase in C. lumpus 0-51 dph. Average daily weight increase (% day-1) in dry weight
(mg larva-1) in each of the three treatments (n = 3) during specific time intervals. The interval 0-2 dph represents
endogenous feeding prior to addition of live feed. The dashed line distinguishes successive intervals from the treatment
period (2-21 dph) and the whole experimental period (2-51 dph). Significant differences (p < 0.05) between treatments
at a given interval are denoted by different letters. Errors bars indicate ± standard error (SE).
-2.0
0.0
2.0
4.0
6.0
8.0
10.0
0-2 2-10 10-21 21-34 34-42 42-51 2-21 2-51
Dai
ly w
eigh
t in
crre
ase
(% d
ay¯¹
)
Dph interval
Artemia
Copepod
FD
Yolk sac
a
b b
a
b ab
a
b b

Results
34
3.2.3 Standard length
Standard length (SL) of yolk sac larvae aged 2 dph was 6.4 ± 0.1 mm (Figure 3.6, Appendix 8).
Larvae from the Artemia group grew linearly throughout the experiment and were significantly
larger than Copepod and FD larvae on all days except for 10 dph, when no difference was found
when compared to the Copepod group. As for Copepod and FD larvae, no significant growth was
observed between 17-34 dph and 10-24 dph, respectively. Copepod larvae had a significantly
larger SL than FD larvae from 13-21 dph, corresponding to the period when A. tonsa was fed
exclusively to the Copepod group. On day 21 post hatch, during weaning to Gemma micro 300,
Artemia larvae had a mean SL of 8.4 ± 0.1 mm. Similar sizes were not observed in the Copepod
and FD groups until 34 dph, when respective means of 8.2 ± 0.2 and 8.6 ± 0.1 mm had been
attained. From 29 dph, larvae from all groups exhibited a linear growth pattern for the remainder
of the experiment. No differences were observed between Copepod and FD larvae after weaning
until 50 dph, at which time the size of larvae from all treatments differed significantly from each
other. Artemia larvae had the largest size, whereas Copepod larvae were smallest.
Figure 3.6. Mean standard length in C. lumpus 2-50 dph. The averages (mm) are based on an increasing sample size:
n = 16 (2 dph), n = 15 per treatment (6-38 dph) and n = 30 per treatment (42-50 dph). The grey dashed lines denote
weaning from A. tonsa to Gemma micro 150 in the FD group, whereas the black dashed lines denote weaning from
respective feeds to Gemma micro 300 in all groups. Significant differences (p < 0.05) between treatments at a given age
are denoted by different letters. Error bars indicate ± standard error (SE).
6.0
7.0
8.0
9.0
10.0
11.0
12.0
13.0
14.0
0 5 10 15 20 25 30 35 40 45 50
Stan
dar
d le
ngt
h (
mm
)
Dph
Artemia
Copepod
FDa
b b
a
ab
a
b
c
a a
a
a
a
a
a
a
a
b
c
b
c
b b
b
b
b
b c
b
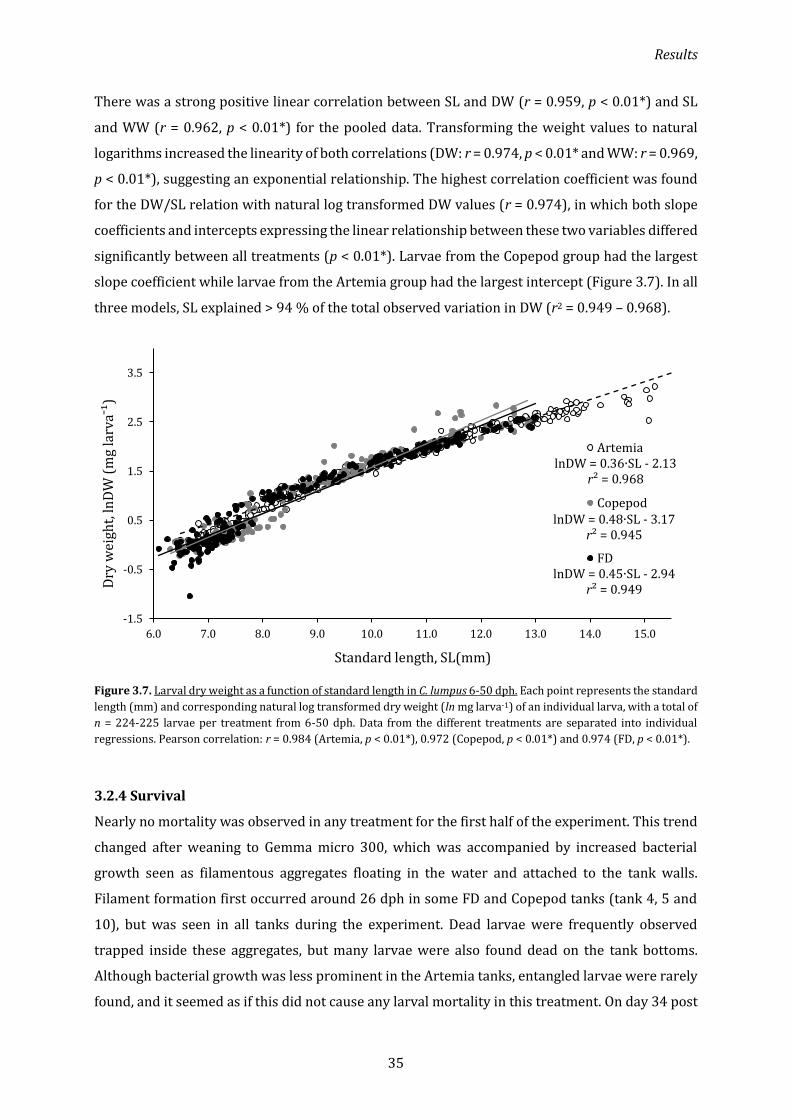
Results
35
There was a strong positive linear correlation between SL and DW (r = 0.959, p < 0.01*) and SL
and WW (r = 0.962, p < 0.01*) for the pooled data. Transforming the weight values to natural
logarithms increased the linearity of both correlations (DW: r = 0.974, p < 0.01* and WW: r = 0.969,
p < 0.01*), suggesting an exponential relationship. The highest correlation coefficient was found
for the DW/SL relation with natural log transformed DW values (r = 0.974), in which both slope
coefficients and intercepts expressing the linear relationship between these two variables differed
significantly between all treatments (p < 0.01*). Larvae from the Copepod group had the largest
slope coefficient while larvae from the Artemia group had the largest intercept (Figure 3.7). In all
three models, SL explained > 94 % of the total observed variation in DW (r2 = 0.949 – 0.968).
Figure 3.7. Larval dry weight as a function of standard length in C. lumpus 6-50 dph. Each point represents the standard
length (mm) and corresponding natural log transformed dry weight (ln mg larva-1) of an individual larva, with a total of
n = 224-225 larvae per treatment from 6-50 dph. Data from the different treatments are separated into individual
regressions. Pearson correlation: r = 0.984 (Artemia, p < 0.01*), 0.972 (Copepod, p < 0.01*) and 0.974 (FD, p < 0.01*).
3.2.4 Survival
Nearly no mortality was observed in any treatment for the first half of the experiment. This trend
changed after weaning to Gemma micro 300, which was accompanied by increased bacterial
growth seen as filamentous aggregates floating in the water and attached to the tank walls.
Filament formation first occurred around 26 dph in some FD and Copepod tanks (tank 4, 5 and
10), but was seen in all tanks during the experiment. Dead larvae were frequently observed
trapped inside these aggregates, but many larvae were also found dead on the tank bottoms.
Although bacterial growth was less prominent in the Artemia tanks, entangled larvae were rarely
found, and it seemed as if this did not cause any larval mortality in this treatment. On day 34 post
lnDW = 0.36∙SL - 2.13r² = 0.968
lnDW = 0.48∙SL - 3.17r² = 0.945
lnDW = 0.45∙SL - 2.94r² = 0.949
-1.5
-0.5
0.5
1.5
2.5
3.5
6.0 7.0 8.0 9.0 10.0 11.0 12.0 13.0 14.0 15.0
Dry
wei
ght,
lnD
W (
mg
larv
a¯¹)
Standard length, SL(mm)
Artemia
Copepod
FD

Results
36
hatch, survival was significantly higher in the Artemia group compared to the Copepod and FD
groups (Table 3.2). This was after a period of massive mortality, where particularly tank 10 had
large numbers of dead larvae laying on the tank floor (Figure 3.8). Survival stabilized in most tanks
after this period, except for an incidence in one FD replicate (tank 4) 48 dph. By the end of the
experiment, average survival in the Artemia, Copepod and FD treatments were 97 ± 0, 79 ± 6 and
83 ± 4 %, respectively. Despite Welch’s ANOVA test returning a significant result (p < 0.05), no
difference of statistical significance was found between any group 51 dph when using Dunnett’s
T3 post hoc test for pairwise comparisons (p-values > 0.09). Number of larvae alive on each day
of the experiment is shown for individual tanks in Appendix 9.
Table 3.2. Mean survival of C. lumpus 8-51 dph. The averages (% ± SE) are presented for each treatment (n = 3) on
selected days. 9 and 23 dph represents the first day after the two weaning periods. Significant differences (p < 0.05)
between treatments at a given age are denoted by different letters.
Dph Mean survival (%)
Artemia Copepod FD
9 100 ± 0 100 ± 0 100 ± 0
23 100 ± 0 100 ± 0 100 ± 0
34 99 ± 0a 83 ± 7b 89 ± 2b
42 99 ± 0a 80 ± 7b 87 ± 2b
51 97 ± 0 79 ± 6 83 ± 4
Figure 3.8. Survival of C. lumpus 0-51 dph. Survival (%) is shown for each treatment replicate (n = 3) to accentuate
differences between individual tanks. The values at a given day are calculated as the number of larvae alive at that day
divided by the total number of larvae, estimated as the sum of dead, sampled and living larvae per tank 51 dph. The
black dashed lines denote weaning from respective feeds to Gemma micro 300 in all groups. Note that the vertical axis
starts at 60 %.
60.0
65.0
70.0
75.0
80.0
85.0
90.0
95.0
100.0
0 10 20 30 40 50
Surv
ival
(%
)
Dph
Tank 1 (Artemia)
Tank 2 (Artemia)
Tank 9 (Artemia)
Tank 3 (Copepod)
Tank 6 (Copepod)
Tank 10 (Copepod)
Tank 4 (FD)
Tank 5 (FD)
Tank 7 (FD)
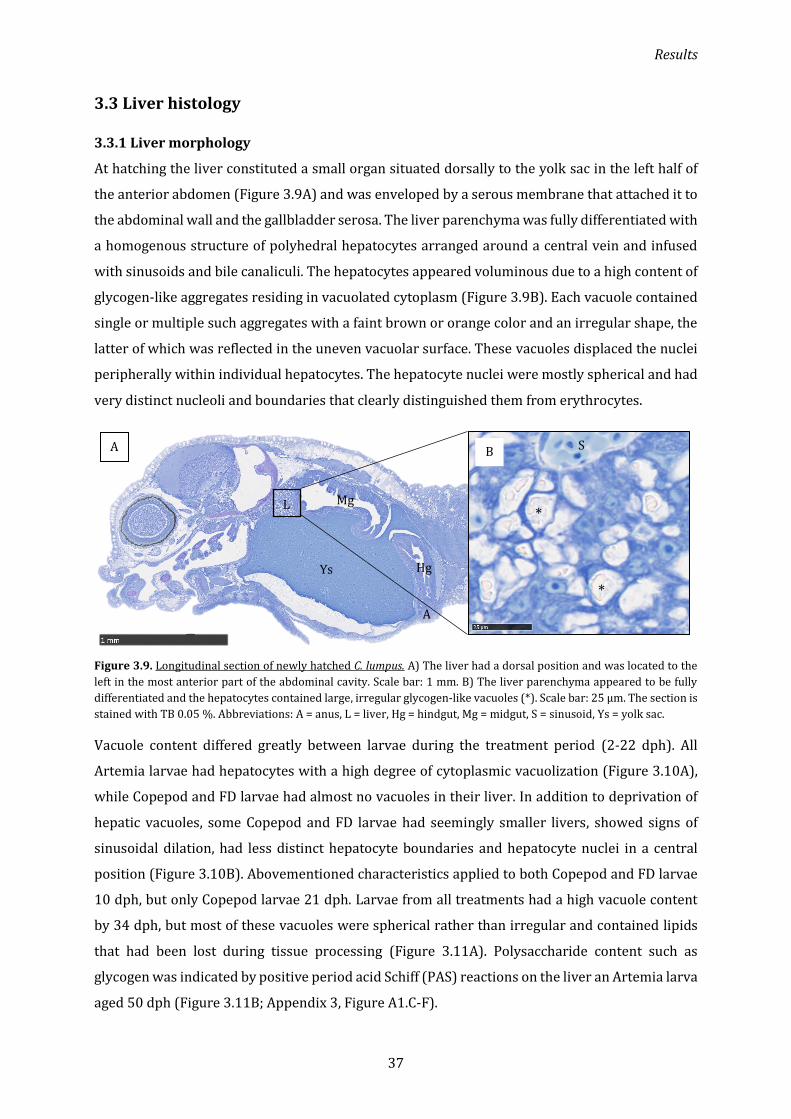
Results
37
3.3 Liver histology
3.3.1 Liver morphology
At hatching the liver constituted a small organ situated dorsally to the yolk sac in the left half of
the anterior abdomen (Figure 3.9A) and was enveloped by a serous membrane that attached it to
the abdominal wall and the gallbladder serosa. The liver parenchyma was fully differentiated with
a homogenous structure of polyhedral hepatocytes arranged around a central vein and infused
with sinusoids and bile canaliculi. The hepatocytes appeared voluminous due to a high content of
glycogen-like aggregates residing in vacuolated cytoplasm (Figure 3.9B). Each vacuole contained
single or multiple such aggregates with a faint brown or orange color and an irregular shape, the
latter of which was reflected in the uneven vacuolar surface. These vacuoles displaced the nuclei
peripherally within individual hepatocytes. The hepatocyte nuclei were mostly spherical and had
very distinct nucleoli and boundaries that clearly distinguished them from erythrocytes.
Figure 3.9. Longitudinal section of newly hatched C. lumpus. A) The liver had a dorsal position and was located to the
left in the most anterior part of the abdominal cavity. Scale bar: 1 mm. B) The liver parenchyma appeared to be fully
differentiated and the hepatocytes contained large, irregular glycogen-like vacuoles (*). Scale bar: 25 µm. The section is
stained with TB 0.05 %. Abbreviations: A = anus, L = liver, Hg = hindgut, Mg = midgut, S = sinusoid, Ys = yolk sac.
Vacuole content differed greatly between larvae during the treatment period (2-22 dph). All
Artemia larvae had hepatocytes with a high degree of cytoplasmic vacuolization (Figure 3.10A),
while Copepod and FD larvae had almost no vacuoles in their liver. In addition to deprivation of
hepatic vacuoles, some Copepod and FD larvae had seemingly smaller livers, showed signs of
sinusoidal dilation, had less distinct hepatocyte boundaries and hepatocyte nuclei in a central
position (Figure 3.10B). Abovementioned characteristics applied to both Copepod and FD larvae
10 dph, but only Copepod larvae 21 dph. Larvae from all treatments had a high vacuole content
by 34 dph, but most of these vacuoles were spherical rather than irregular and contained lipids
that had been lost during tissue processing (Figure 3.11A). Polysaccharide content such as
glycogen was indicated by positive period acid Schiff (PAS) reactions on the liver an Artemia larva
aged 50 dph (Figure 3.11B; Appendix 3, Figure A1.C-F).
L
Ys
Mg
Hg
A
A B S
*
*

Results
38
Figure 3.10. Liver structure in C. lumpus 10 dph. A) High content of glycogen-like vacuoles (*) in the liver of an Artemia
larva with hepatocyte nuclei displaced peripherally. B) Absence of vacuoles in the liver of a FD larva showing signs of
sinusoidal dilation (black arrows) and central hepatocyte nuclei. Scale bar: 50 µm. Both pictures are L sections stained
with TB 0.05 %. Abbreviations: Bc = bile canaliculus, Nu = nucleus, S = sinusoid.
Figure 3.11. Hepatic nutrients in C. lumpus 50 dph. A) Vacuoles (*) located in the hepatocytes had a spherical shape
and had been deprived of their lipid content during tissue processing. B) Polysaccharide content (e.g. glycogen)
indicated by positive periodic acid Schiff (PAS) reactions (black arrows). Scale bar: 100 µm. Both pictures are L sections
from an Artemia larva stained with (A) TB 0.05 % and (B) Alcian blue with periodic acid Schiff (AB-PAS). Abbreviations:
Nu = nucleus, S = sinusoid.
A B
*
* *
Nu
Nu
S
S
Bc
Nu
*
* *
S
*
A B
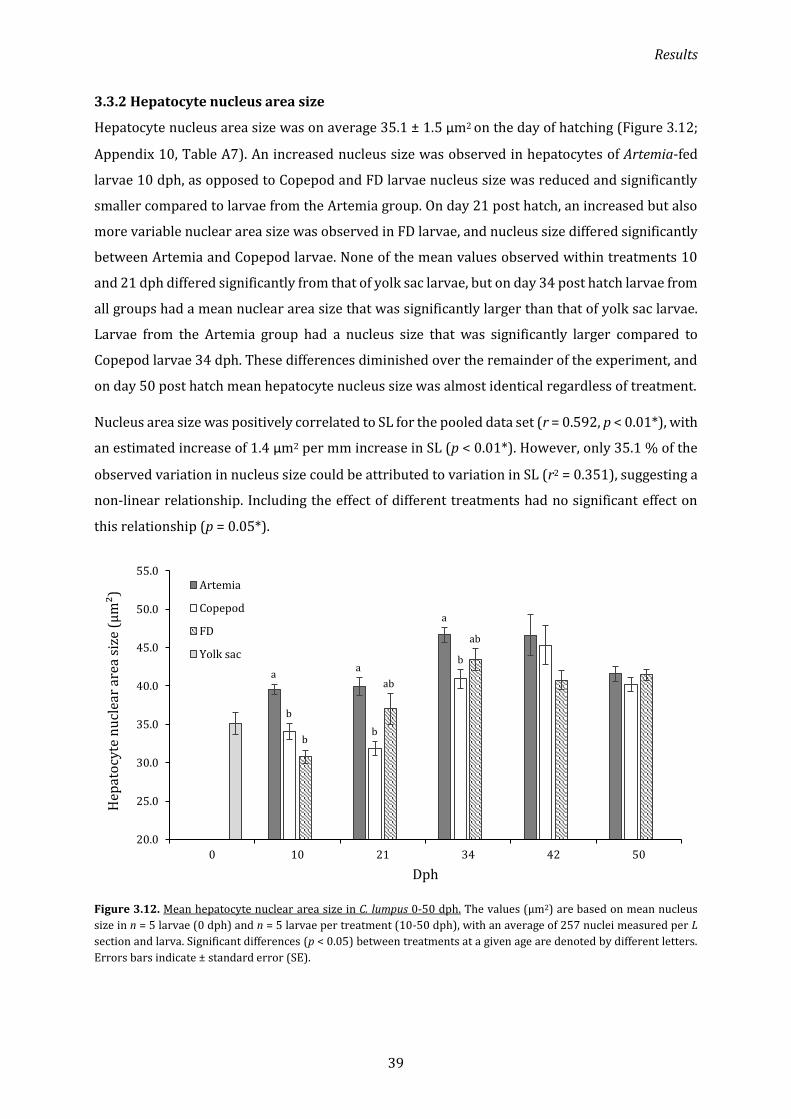
Results
39
3.3.2 Hepatocyte nucleus area size
Hepatocyte nucleus area size was on average 35.1 ± 1.5 µm2 on the day of hatching (Figure 3.12;
Appendix 10, Table A7). An increased nucleus size was observed in hepatocytes of Artemia-fed
larvae 10 dph, as opposed to Copepod and FD larvae nucleus size was reduced and significantly
smaller compared to larvae from the Artemia group. On day 21 post hatch, an increased but also
more variable nuclear area size was observed in FD larvae, and nucleus size differed significantly
between Artemia and Copepod larvae. None of the mean values observed within treatments 10
and 21 dph differed significantly from that of yolk sac larvae, but on day 34 post hatch larvae from
all groups had a mean nuclear area size that was significantly larger than that of yolk sac larvae.
Larvae from the Artemia group had a nucleus size that was significantly larger compared to
Copepod larvae 34 dph. These differences diminished over the remainder of the experiment, and
on day 50 post hatch mean hepatocyte nucleus size was almost identical regardless of treatment.
Nucleus area size was positively correlated to SL for the pooled data set (r = 0.592, p < 0.01*), with
an estimated increase of 1.4 µm2 per mm increase in SL (p < 0.01*). However, only 35.1 % of the
observed variation in nucleus size could be attributed to variation in SL (r2 = 0.351), suggesting a
non-linear relationship. Including the effect of different treatments had no significant effect on
this relationship (p = 0.05*).
Figure 3.12. Mean hepatocyte nuclear area size in C. lumpus 0-50 dph. The values (µm2) are based on mean nucleus
size in n = 5 larvae (0 dph) and n = 5 larvae per treatment (10-50 dph), with an average of 257 nuclei measured per L
section and larva. Significant differences (p < 0.05) between treatments at a given age are denoted by different letters.
Errors bars indicate ± standard error (SE).
20.0
25.0
30.0
35.0
40.0
45.0
50.0
55.0
0 10 21 34 42 50
Hep
ato
cyte
nu
clea
r ar
ea s
ize
(µm
²)
Dph
Artemia
Copepod
FD
Yolk sac
a
b
b b
a
ab
a
b
ab

Results
40
3.3.3 Hepatocyte area size
Yolk sac larvae had an estimated hepatocyte area size of 558.0 ± 8.0 µm2 (Figure 3.13; Appendix
10, Table A7). Hepatocytes of Artemia larvae showed significant hypertrophy from 0-10 dph and
were significantly larger compared to hepatocytes of FD larvae 10 dph, which were significantly
reduced from hatching. No significant differences were found between Artemia and FD larvae 21
dph. However, larvae from both these groups had an estimated cell size significantly larger than
Copepod larvae, where cell size had not changed since hatching. On day 34 post hatch, larvae from
all treatments exhibited a mean cell area size that was significantly larger compared to that of yolk
sac larvae, but no differences were observed between groups. Further hepatocyte hypertrophy
was observed in Artemia and Copepod larvae from 34-42 dph, and mean cell area size was
significantly larger in Artemia larvae compared to FD larvae 42 dph. From 34-50 dph, hepatocyte
cell area size had increased significantly in larvae from the FD treatment as well, and no
differences of statistical significance were found between the groups 50 dph.
Hepatocyte area size was positively correlated to SL (r = 0.755, p < 0.01*) and nuclear area size
(r = 0.778, p < 0.01*) for the pooled data, the latter indicating that hepatocyte hypertrophy was
accompanied by an increase in nucleus size. With a slope coefficient of 31.15 (p < 0.01*), 60.5 %
of the variation in cell area size could be explained by variation in nuclear area size (r2 = 0.605).
Treatment effects were not of statistical significance regarding this linear relationship (p = 0.3*).
Figure 3.13. Mean hepatocyte area size in C. lumpus 0-50 dph. The values (µm2) are based on mean cell size in n = 5
larvae (0 dph) and n = 5 larvae per treatment (10-50 dph), estimated as analyzed liver area in the L section divided by
number of nuclei. Significant differences (p < 0.05) between treatments at a given age are denoted by different letters.
Errors bars indicate ± standard error (SE).
0.0
200.0
400.0
600.0
800.0
1000.0
1200.0
1400.0
0 10 21 34 42 50
Hep
ato
cyte
are
a si
ze (
µm
²)
Dph
Artemia
Copepod
FD
Yolk sac
a
b
ab
a a
b
a
ab
b

Results
41
3.3.4 Area fractions of liver components
Hepatocyte nuclei constituted between 3.3 and 7.3 % of the total liver tissue over the course of
the experiment, and generally decreased from hatching (Table 3.3). Artemia larvae exhibited a
significant reduction in nuclear area fraction from hatching to 10 dph, when the mean value of
this group was significantly lower compared to the FD group. Both Copepod and FD larvae aged
10 dph had a nuclear area fraction similar to that of yolk sac larvae, but this fraction was
significantly reduced in FD larvae from 10-21 dph. Hepatocyte nuclei constituted a significantly
lower fraction of the total liver area in Artemia larvae compared to Copepod larvae 21 dph, both
of which had mean values that did not differ significantly from those observed in respective
groups 10 dph. An overall increase was observed across groups from 21-34 dph, although only
Artemia larvae exhibited a significant change. On day 42 post hatch, Artemia larvae had a mean
nuclear area fraction that was significantly lower compared to both Copepod and FD larvae.
Larvae from all groups showed a significant reduction in nuclear area fraction from 34-50 dph,
and no significant differences could be detected between larvae from the different groups 50 dph.
Hepatic vacuoles accounted for an average of 18.4 ± 2.3 % of the total liver tissue in yolk sac larvae
(Table 3.3), and the only differences of statistical significance were observed 10 and 21 dph.
Artemia larvae showed a mean vacuolar area fraction similar to that of yolk sac larvae 10 dph,
whereas vacuole content was significantly lower and almost absent in both Copepod and FD
larvae on day 10 post hatch. Larvae from the FD group had accumulated a significant quantity of
hepatic vacuoles from 10-21 dph, while Copepod larvae still showed a very low vacuole content
that was significantly lower compared to both Artemia and FD larvae 21 dph. Differences between
the groups disappeared after weaning 20-22 dph, and from 34-50 dph all examined larvae had a
vacuole content that did not differ significantly from each other or from that of yolk sac larvae.
A negative correlation was found between nuclear area fraction and SL (r = –0.680, p < 0.01*) for
the pooled data, implying that liver components other than nuclei constituted a relatively larger
fraction of the total liver area in larger compared to smaller larvae. It was estimated that nuclear
area fraction was reduced by 0.3 % per mm increase in SL and that variation in SL attributed to
46.3 % of observed variation in nuclear area fraction (r2 = 0.463). This linear relationship was not
significantly influenced by the treatments (p = 0.2*). As for hepatic vacuole content, no significant
relationship was found when correlating this variable to SL (p = 0.07*). However, the area fraction
of hepatic vacuoles was positively correlated to nucleus area size (r = 0.397, p < 0.01*). It was
estimated that the vacuole area fraction increased by 0.6 % per µm2 increase in nucleus area size
for the pooled data, but this relationship was clearly non-linear (r2 = 0.158). Extending the linear
model to account for differences between treatments had a significant effect on the relationship
between vacuole content and nucleus size (p < 0.01*). In this extended model, the slope coefficient

Results
42
for the Artemia group was not significantly different from zero (p = 0.06*), indicating no
relationship between vacuole content and nucleus size in Artemia larvae. As for larvae from the
Copepod and FD groups, it was estimated that the area fraction of vacuoles increased by 0.8 %
and 1.0 % per µm2 increase in nucleus area size, respectively. Still, the slope coefficients for
Copepod and FD larvae did not differ significantly from each other (p = 0.7*).
Table 3.3. Mean hepatocyte nuclear and vacuole area fractions in C. lumpus liver 0-50 dph. The averages (% ± SE) are
based on estimates in the L section from n = 5 larvae (0 dph) and n = 5 larvae per treatment (10-50 dph). Nuclear area
fractions are estimated as the sum of hepatocyte nuclear sizes divided by analyzed liver area and vacuole content from
a point grid. The remaining area fractions are categorized as other (e.g. hepatocyte organelles). Significant differences
(p < 0.05) between groups are denoted by different letters.
Dph Treatment Mean surface area fraction (%)
Nuclei Vacuoles Other
0 Yolk sac 6.3 ± 0.1 18.4 ± 2.3 75.3 ± 2.1
10
Artemia
Copepod
FD
5.3 ± 0.1a
6.1 ± 0.1ab
6.5 ± 0.1b
22.2 ± 1.4a
2.1 ± 1.4b
0.5 ± 0.2b
72.5 ± 1.3a
91.9 ± 1.2b
92.9 ± 0.3b
21
Artemia
Copepod
FD
4.6 ± 0.1a
6.1 ± 0.0b
4.7 ± 0.2ab
25.2 ± 2.2a
2.5 ± 0.7b
20.8 ± 2.5a
70.2 ± 2.3a
91.4 ± 0.7b
74.5 ± 2.1a
34
Artemia
Copepod
FD
5.9 ± 0.1
6.0 ± 0.1
5.8 ± 0.2
14.4 ± 2.1
16.3 ± 2.5
16.5 ± 3.4
79.7 ± 2.0
77.8 ± 2.3
77.8 ± 3.3
42
Artemia
Copepod
FD
4.0 ± 0.0a
4.8 ± 0.1b
5.0 ± 0.1b
16.8 ± 0.6
15.3 ± 1.5
16.9 ± 1.8
79.2 ± 0.6
79.9 ± 1.6
78.1 ± 1.8
50
Artemia
Copepod
FD
3.9 ± 0.1
4.8 ± 0.1
4.2 ± 0.0
15.3 ± 1.5
14.0 ± 2.0
17.7 ± 1.4
80.8 ± 1.4
81.1 ± 1.7
78.1 ± 1.5
3.4 Stomach histology
3.4.1 Stomach morphology
The stomach anlage of newly hatched larvae appeared as a slight dilated elongation posterior to
the esophagus, with an anterior cardiac and posterior pyloric region (Figure 3.14A). The pyloric
stomach was separated from the midgut by a preliminary pyloric sphincter, a constriction of the
surrounding muscularis with an inner circular and outer longitudinal layer of striated muscle
fibers. Cubical cells deficient of microvilli and with central nuclei lined the cardiac and pyloric
mucosa. Gastric glands were observed in the lamina propria by 10 dph (Figure 3.14B). These

Results
43
tubular glands consisted of cuboidal secretory cells and were connected to the stomach lumen via
gastric pits that had formed through invagination of the mucosa. Relatively few gastric glands
were observed 10 dph and these were mostly situated dorsally in the cardiac stomach. Additional
gastric glands were observed with increasing age, were continuously distributed in the cardiac
mucosa by 34 dph (Figure 3.14C). By 34 dph, the stomach of most larvae also had significantly
increased lumen volume and comprised a distinct fundic region in addition to the cardiac and
pyloric regions. At this point, the stomach was curved rather than elongated, with the fundus
defined by the posterior end of the dorsal curvature and the pyloric sphincter situated on the
ventral side of the stomach (Figure 3.15). Feed particles were usually more abundant in the lumen
of larvae with a fundic stomach (≥ 34 dph) compared to larvae without a fundus (≤ 34 dph).
Figure 3.14. Stomach development in C. lumpus 0-34 dph. A) The stomach anlage at hatching appeared as a slight
enlargement of the esophagus, with an anterior cardiac and posterior pyloric region separated from the midgut by a
muscular sphincter (black arrow). Longitudinal section. Scale bar: 100 µm. B) Transverse section of the stomach 10 dph
displaying the first gastric glands (*) in lamina propria. Scale bar: 100 µm. C) Transverse section of the stomach 34 dph
with greatly increased lumen volume and a continuous distribution of gastric glands in the mucosa. Scale bar: 500 µm.
All pictures are sections from Artemia larvae stained with TB 0.05 %. Abbreviations: E = esophagus, Gb = gallbladder, L
= liver, M = muscularis, Mf = muscle fibers, Mg = midgut, S = serosa, St = stomach.
A
B C
Mg
L
*
*
* *
St
St
M
M
M
S
Gb
Mf *
*
Cardia Pylorus E
M

Results
44
Gastric glands and pits were numerous in both the cardiac and fundic regions of larvae with a
histologically differentiated stomach but were, as in larvae from 10-21 dph, absent in the more
muscular pyloric region. Thickened and constricted muscularis was also observed at the cardiac
sphincter that separated the posterior end of the esophagus from the anterior cardiac stomach.
Epithelial cells lining the stomach mucosa in larvae from 34-50 dph were columnar rather than
cubical (Figure 3.16). The oval nucleus of these cells was situated towards the basal lamina, while
secretory vesicles and other cellular components were located in the apical end.
Figure 3.15. Stomach regions in C. lumpus 50 dph. The stomach was curved and consisted of the cardiac, fundic and
pyloric regions. The cardiac sphincter (black arrow) separated the esophagus from the cardiac stomach, whereas the
pyloric sphincter (red arrow) separated the pyloric stomach from the midgut. The picture is a longitudinal section from
an Artemia larva stained with TB 0.05 %. Scale bar: 1 mm. Abbreviations: E = esophagus, L = liver, M = muscularis, Pc =
pyloric caeca, S = serosa, Sm = stomach mucosa, St = stomach.
M
Se
S
*
*
*
Lp
Sm
Figure 3.16. Fundic stomach in C. lumpus 50 dph. The
mucosal layer was invaginated and lined with columnar
epithelial cells covered with mucus (not shown). Gastric
glands (*) were situated in the lamina propria and
surrounded by connective tissue and blood capillaries.
The picture is a longitudinal section from an Artemia
larva stained with TB 0.05 %. Scale bar: 50 µm.
Abbreviations: Bc = blood capillary, Bl = basal lamina,
Lp = lamina propria, M = muscularis, S = serosa, Se =
stomach epithelium, Sm = submucosa, St = stomach.
Bc
Cardia
Pc L
M
St
Fundus
Pylorus
Sm
S
E
Bl
St

Results
45
3.4.2 Stomach developmental stages
All examined yolk sac larvae were assigned to the S1 stage, with the stomach anlage appearing as
a dilatation between the esophagus and gut (Table 3.4). One out of five (1/5) and 2/5 larvae in the
Copepod and FD treatments were still in S1 10 dph, respectively. Rest of the larvae in these two
groups, including all specimens in the Artemia group, had gastric glands formed in their cardiac
stomach mucosa and were assigned to the S2 stage. No morphological changes were observed 21
dph, and all larvae were categorized as S2. All Artemia larvae, 3/5 Copepod larvae and 3/5 FD
larvae had reached the S3 stage by 34 dph, with greatly increased lumen volume and formation of
the fundic stomach. All larvae had stomachs characteristic for the S3 stage 42 and 50 dph.
Table 3.4. Stomach developmental stages in C. lumpus 0-50 dph. Number of larvae assigned to each stomach
developmental stage, Si (S1: enlargement of esophagus, S2: presence of gastric glands and S3: enlargement of lumen
volume and formation of the fundic stomach), and mean standard length (mm ± SE) for each treatment on the following
days post hatch: 0 dph (n = 5), 10, 21, 34, 42 and 50 dph (n = 5 per treatment). Significant differences (p < 0.05) in
standard length between treatments at a given day are denoted by different letters.
Dph Treatment Mean SL
(mm)
Stomach developmental stage, Si
S1 S2 S3
0 Yolk sac 5.9 ± 0.0 5 - -
10
Artemia
Copepod
FD
7.2 ± 0.1a
6.8 ± 0.1ab
6.7 ± 0.1b
0
1
2
5
4
3
-
-
-
21
Artemia
Copepod
FD
8.4 ± 0.2a
7.7 ± 0.2ab
7.2 ± 0.1b
-
-
-
5
5
5
-
-
-
34
Artemia
Copepod
FD
10.2 ± 0.3a
8.3 ± 0.1b
8.6 ± 0.3b
-
-
-
0
2
2
5
3
3
42
Artemia
Copepod
FD
12.1 ± 0.5a
10.3 ± 0.2b
10.6 ± 0.2b
-
-
-
-
-
-
5
5
5
50
Artemia
Copepod
FD
14.1 ± 0.5a
11.3 ± 0.6b
11.9 ± 0.2b
-
-
-
-
-
-
5
5
5
Standard length (SL) of the smallest larva that had reached S2 was 6.6 mm, while the largest larva
that had not yet reached S2 was 6.8 mm long, both of which were aged 10 dph and belonged to the
FD group. The transition window from S1 to S2 was thus 6.6 – 6.8 mm (Figure 3.17). Transition
from S2 to S3 was more variable, with an observed size range of 8.0 – 9.1 mm. The smallest larva
in S3 was from the Copepod group and aged 34 dph, while the largest larva still in S2 was from the
Artemia group and aged 21 dph.

Results
46
Figure 3.17. Stomach developmental stage and standard length in C. lumpus. Each point represents developmental
stage, Si (S1: enlargement of esophagus, S2: presence of gastric glands or S3: enlargement of lumen volume and formation
of the fundic stomach), and corresponding standard length (mm) of individual larvae, with a total of n = 5 larvae on 0
dph and n = 25 larvae per treatment from 10-50 dph. The black dashed lines denote size range at transition from S1 to
S2 and the grey dashed lines denote size range at transition from S2 to S3.
3.4.3 Number of gastric glands
Average total number of gastric glands observed in the stomach section from 10-50 dph is given
in Table 3.5 below. Artemia larvae had most gastric glands in all examined age groups, but the
only difference of statistical significance was found 34 dph. The number of gastric glands
increased significantly between successive age groups in the Artemia treatment from 10-42 dph,
and from 10-34 dph within the Copepod and FD treatments. No significant changes were observed
from 42-50 dph. A positive correlation was found between the number of gastric glands and SL
for the pooled data (r = 0.854, p < 0.01*), with an estimated increase of 24 glands per mm increase
in SL (r2 = 0.730, p < 0.01*). This relationship was not affected by the treatments (p = 0.6*).
Table 3.5. Total number of gastric glands in the S section of C. lumpus 10-50 dph. The averages (Nglands ± SE) are based
on n = 5 larvae per treatment for each age group 10-50 dph. Significant differences (p < 0.05) between treatments at a
given age are denoted by different letters.
Dph Total number of gastric glands (Nglands)
Artemia Copepod FD
10 9 ± 2 4 ± 1 3 ± 1
21 31 ± 5 19 ± 3 18 ± 2
34 83 ± 10a 57 ± 7b 48 ± 5b
42 194 ± 13 121 ± 30 99 ± 22
50 169 ± 17 116 ± 24 116 ± 18
0
1
2
3
5.0 6.0 7.0 8.0 9.0 10.0 11.0 12.0 13.0 14.0 15.0 16.0
Sto
mac
h d
evel
op
men
tal s
tage
, Si
Standard length (mm)
Artemia
Copepod
FD
Yolk sac

Results
47
3.4.4 Stomach epithelium height
Mean stomach epithelium height from 10-50 dph is shown for each group in Figure 3.18 below
(Appendix 10, Table A8). From 10-34 dph, no significant differences were observed within or
between treatments. Both Artemia and Copepod larvae exhibited significantly increased stomach
epithelium height from 34-42 dph, and Artemia larvae had a mean epithelium height that was
significantly larger compared to FD larvae 42 dph. No significant changes were observed within
the Copepod or FD groups from 42-50 dph, whereas Artemia larvae showed further significant
growth of the stomach epithelium. The only significant increase observed within the FD treatment
was from 34-50 dph. On day 50 post hatch, average epithelium height in larvae from the Artemia
group was significantly larger than that of Copepod and FD larvae.
Stomach epithelium height was positively correlated to SL for the pooled data (r = 0.873, p <
0.01*). With an estimated slope coefficient of 1.8 (p < 0.01*), 76.2 % of the total observed variation
in epithelium height could be attributed to variation in SL (r2 = 0.762). Accounting for differences
between treatments was not of statistical significance regarding this linear relationship (p = 0.8*).
A positive correlation was also found between epithelium height and number of gastric glands for
the combined data (r = 0.820, p < 0.01*), and it was estimated that epithelium height increased by
0.1 µm2 for each additional gland (p < 0.01*). Variation gastric gland abundance accounted for
67.2 % of the total observed variation in epithelium height (r2 = 0.672). No significant treatment
effects were found regarding this linear relationship (p = 0.5*).
Figure 3.18. Mean stomach epithelium height in C. lumpus 10-50 dph. The values (µm) are based on mean stomach
epithelium height in n = 5 larvae per treatment, with five measurements per S section and larva. Epithelium height was
measured from the basal lamina to the apical membrane. Significant differences (p < 0.05) between treatments at a
given age are denoted by different letters. Errors bars indicate ± standard error (SE).
0.0
5.0
10.0
15.0
20.0
25.0
30.0
35.0
10 21 34 42 50
Sto
mac
h e
pit
hel
ium
hei
ght
(µm
)
Dph
Artemia
Copepod
FD
a
a
ab
b
b
b

Results
48
3.5 Gut histology
3.5.1 Gut morphology
The gut of newly hatched larvae was coiled and separated into an anterior and posterior part by
an intestinal valve (Figure 3.19), observed as a constriction of the mucosa and thickening of the
surrounding muscular layers. Villi were present throughout the length of the gut, observed as
mucosal folds protruding into the lumen. At hatching, these folds were mostly situated dorsally in
the anterior part of the gut, whereas the posterior part had villi equally distributed in both dorsal
and ventral positions. The mucosa was lined with a single layer of columnar enterocytes with
microvilli extending from the apical membrane. Two layers of smooth muscle fibers composed the
muscularis, whereas the surrounding serosa consisted of simple flat epithelium.
Figure 3.19. Intestinal valve in newly hatched C. lumpus. The mid- and hindgut were separated by an intestinal valve
(black arrow), characterized by constricted intestinal mucosa and thickened muscularis. Scale bar: 50 µm. The picture
is a longitudinal section stained with TB 0.05 %. Abbreviations: Gc = goblet cell, Ge = gut epithelium, Hg = hindgut, M =
muscularis, Mg = midgut, V = villus, Ys = yolk sac.
The number of midgut and hindgut villi greatly increased both dorsally and ventrally as the larvae
aged, accompanied by a thickening of the gut wall through elongation of the enterocytes. The
midgut was particularly involved in lipid absorption, and numerous lipid droplets with a diameter
> 5 µm were located in midgut enterocytes of Artemia-fed larvae 10 and 21 dph (Figure 3.20A).
These lipid droplets were absent in enterocytes of both Copepod and FD larvae, and were not
observed in larvae from any group beyond 21 dph. Ingested feed seemed less abundant in the
midgut lumen of larvae from the Copepod and FD groups from 10-21 dph and 10 dph, respectively,
whereas it was comparably more abundant in Artemia larvae during the same period. Larvae from
the Artemia group also seemed to have thicker midgut mucosa with more villi relative to larvae
from the Copepod and FD groups with same age. One of five examined FD larvae 21 dph had
conspicuously thin midgut epithelium with very few villi (Figure 3.20B).
Ge
Mg Hg
M
V M
Ys Gc

Results
49
Figure 3.20. Midgut epithelium in C. lumpus 21 dph. A) Larva from the Artemia group displaying numerous longitudinal
folds and villi (black arrow) in the mucosal layer. Lipid droplets (*) were accumulated in the enterocytes. Scale bar: 250
µm. B) Larva from the FD group with thin epithelium and very few villi. Scale bar: 500 µm. Both pictures are S sections
stained with TB 0.05 %. Abbreviations: E = epidermis, Ep = exocrine pancreas, Ge = gut epithelium, K = kidney, L = liver,
Mf = muscle fibers, Mg = midgut, Ys = yolk sac.
Hindgut enterocytes were characterized by the presence of supranuclear vesicles from 10-50 dph
(Figure 3.21A). Numerous acidophilic compounds were integrated in these vesicles of FD larvae
by 21 dph and were present in larvae from all groups from 34-50 dph (Figure 3.21B). Unlike the
midgut, the hindgut did not seem to participate in lipid absorption and was also distinguishable
from the midgut by an overall inferior abundance of villi.
Three different cell types were observed in the intestinal mucosa, of which enterocytes were most
abundant. These cells had a basophilic cytoplasm with oval nuclei in a central or basal position
within each cell. The enterocytic microvilli were short at hatching but increased in length with
larval age and established a prominent basophilic brush border. Non-identifiable cellular content,
such as vesicles and organelles, also increased with age in the apical end of both midgut and
hindgut enterocytes. Goblet and enteroendocrine-like cells were the two other intestinal cell types
found in lumpfish larvae (Figure 3.22), observed from hatching and 10 dph, respectively. These
cells were interposed between enterocytes and constituted a minor fraction of the total mucosal
cell population. Goblet cells contained acidophilic substances and they had a columnar shape with
slightly increased diameter towards the lumen. Spherical and highly basophilic enteroendocrine-
like cells were overall least numerous, most of which were situated in proximity of the basal
lamina. Goblet cells were dispersed throughout the length of the gut, whereas enteroendocrine-
like cells were exclusive to the midgut.
A B
Mg
Mg
*
*
*
Ep
K K
Ys
L
E
Ge
Ge

Results
50
Figure 3.21. Hindgut epithelium in C. lumpus 21 and 42 dph. Supranuclear vesicles (*) in hindgut enterocytes 21 (A)
and 42 dph (B). Erythrocytes (black arrow) were observed in submucosal blood vessels located at the base of each
villus. Scale bar: 50 µm. Both pictures are Hg sections from an Artemia larva stained with TB 0.05 %. Abbreviations: Bb
= brush border, Gc = goblet cell, Hg = hindgut, M = muscularis, S = serosa, Sm = submucosa.
Figure 3.22. Intestinal cell types in the midgut mucosa of C. lumpus. Enterocytes developed a prominent brush border
(black arrow) of microvilli protruding from their apical surface. Goblet cells and enteroendocrine-like cells (*) were
interposed between the enterocytes but constituted a minor fraction of the total mucosal cell population in the midgut.
Scale bar: 50 µm. The picture is a S section from an Artemia larva 50 dph stained with TB 0.05 %. Abbreviations: Gc =
goblet cell, M = muscularis, Mg = midgut, S = serosa, SM = submucosa, V = villus.
Gc
Sm
*
*
*
*
* *
S S
Hg A B
M M
Hg
Bb
Bb
Gc Gc
Sm
M
S
Mg
V Gc

Results
51
3.5.2 Gut epithelium height
Yolk sac larvae had a mean midgut epithelium height of 29.9 ± 1.3 µm (Figure 3.23A; Appendix 10,
Table A9). Midgut epithelium height differed significantly between larvae from all treatments 10
dph, of which only Artemia and Copepod larvae displayed a significant increase from hatching.
From 10-21 dph, Copepod larvae showed a significant reduction, while no changes were observed
within the Artemia and FD treatments. Artemia larvae had a mean midgut epithelium height that
was significantly larger than both Copepod and FD larvae 21 dph. No significant differences were
found between treatments or within the Artemia group from 34-50 dph. Copepod larvae showed
a significant increase in midgut epithelium height between successive age groups from 21-42 dph,
whereas the midgut epithelium in FD larvae grew significantly from 21-34 dph.
Hindgut epithelium height was generally lower than in the midgut section of the same larva, with
a mean of 25.7 ± 0.7 µm at hatching (Figure 3.23B; Appendix 10, Table A9). Larvae from all groups
showed significantly increased hindgut epithelium height from 0-10 dph, but no differences were
found between the groups 10 dph. From 10-21 dph, the hindgut epithelium of Artemia larvae had
increased significantly, while no change was observed within the Copepod and FD groups. Mean
hindgut epithelium of Artemia larvae was significantly larger than both Copepod and FD larvae
21 dph. No significant differences were observed within the Artemia treatment beyond 21 dph,
whereas larvae from the Copepod and FD treatments exhibited a significant increase from 21-42
and 21-34 dph, respectively. On day 50 post hatch, Artemia larvae had a mean hindgut epithelium
height that was significantly larger compared to that of Copepod larvae.
Epithelium height was positively correlated to SL in both the midgut and hindgut sections, with
correlation coefficients of 0.717 and 0.686 for the pooled data, respectively (p-values < 0.01*).
Midgut epithelium height was significantly affected by the treatments (p < 0.01*), and was
estimated to grow by 0.6, 1.7 and 2.8 µm per mm SL increase in Artemia, Copepod and FD larvae,
respectively. The slope coefficients differed significantly between the Artemia and FD groups (p <
0.01*). Variation in SL attributed to 32.7 – 63.6 % of total observed variation in midgut epithelium
height within the different groups (r2 = 0.327 – 0.636). As for the hindgut section, no significant
treatment effects were found regarding the linear relationship between epithelium height and SL
(p = 0.3*). However, it was estimated that epithelium height in the hindgut increased by an
average of 1.7 µm per mm increase in SL for the pooled data (p < 0.01*). Variation in SL explained
47.0 % of total observed variation in hindgut epithelium height (r2 = 0.470).

Results
52
Figure 3.23. Mean gut epithelium height in C. lumpus 0-50 dph. The values (µm) are based on mean midgut (A) and
hindgut (B) epithelium height in n = 5 larvae (0 dph) and n = 5 larvae per treatment (10-50 dph), with ten measurements
per S/Mg and Hg section. Epithelium height was measured from the basal lamina to the borderline between the
microvilli and gut lumen. Significant differences (p < 0.05) between treatments at a given age are denoted by different
letters. Errors bars indicate ± standard error (SE).
3.5.3 Gut microvillus height
Microvillus height in the midgut section of newly hatched larvae was on average 1.5 ± 0.1 µm
(Figure 3.24A; Appendix 10, Table A9). Larvae from all groups exhibited significantly increased
midgut microvillus height from hatching to 10 dph, with Artemia larvae having a mean value that
was significantly larger than FD larvae. The height of midgut microvilli continued to increase
significantly between successive age groups within all treatments from 10-34 dph, while Copepod
larvae also showed a significant increase from 34-42 dph. No changes of statistical significance
were observed within any group from 42-50 dph, but midgut microvillus height had increased
significantly in larvae from the Artemia treatment from 34-50 dph.
20.0
25.0
30.0
35.0
40.0
45.0
50.0
0 10 21 34 42 50
Mid
gut
epit
hel
ium
hei
ght
(µm
)
Dph
Artemia
Copepod
FD
Yolk sac
20.0
25.0
30.0
35.0
40.0
45.0
50.0
0 10 21 34 42 50
Hin
dgu
t ep
ith
eliu
m h
eigh
t (µ
m)
Dph
Artemia
Copepod
FD
Yolk sac
A
B
’
a
b
c
a
b b
a
b
b
a
b ab

Results
53
Yolk sac larvae had a mean hindgut microvillus height of 1.8 ± 0.1 µm (Figure 3.24B; Appendix 10,
Table A9). On day 10 post hatch, larvae from all groups showed a mean hindgut microvillus height
that was significantly larger compared to that of yolk sac larvae. Further significant growth was
observed from 10-21 dph in larvae from both the Artemia and Copepod groups, whereas mean
hindgut microvillus height in FD larvae 10 and 21 dph were statistically similar. From 21-34 dph,
hindgut microvillus height had increased significantly only in Artemia larvae, while Copepod and
FD larvae showed a significant increase from 21-42 dph. Apart from these changes, no significant
differences were observed within or between treatments.
Figure 3.24. Mean gut microvillus height in C. lumpus 0-50 dph. The values (µm) are based on mean midgut (A) and
hindgut (B) microvillus height in n = 5 larvae (0 dph) and n = 5 larvae per treatment (10-50 dph), with ten
measurements per S/Mg and Hg section. Microvillus height was measured from the apical membrane of the enterocytes
to the borderline between the microvilli and gut lumen. Significant differences (p < 0.05) between treatments at a given
age are denoted by different letters. Errors bars indicate ± standard error (SE).
0.0
1.0
2.0
3.0
4.0
5.0
6.0
0 10 21 34 42 50
Mid
gut
mic
rov
illu
s h
eigh
t (µ
m)
Dph
Artemia
Copepod
FD
Yolk sac
0.0
1.0
2.0
3.0
4.0
5.0
6.0
0 10 21 34 42 50
Hin
dgu
t m
icro
vil
lus
hei
ght
(µm
)
Dph
Artemia
Copepod
FD
Yolk sac
A
B
a ab
b

Results
54
Both midgut and hindgut microvillus height were positively correlated to SL, with correlation
coefficients of 0.866 and 0.767, respectively (p-values < 0.01*). It was estimated that midgut and
hindgut microvillus height increased by an average of 0.4 and 0.2 µm per mm increase in SL,
respectively (p-values < 0.01*). Of the total observed variation in midgut and hindgut microvillus
height, 74.9 and 58.8 % could be attributed to variation in SL, respectively (r2 = 0.749 and 0.588).
No treatment effects were found for either of the linear relationships (p = 0.2* for the midgut and
p = 0.9* for the hindgut).
3.5.4 Gut villus height
Midgut villus height was on average 81 ± 5 µm in larvae on the day of hatching (Figure 3.25A;
Appendix 10, Table A9). Larvae from the Artemia group showed a progressive and significant
increase from hatching until 21 dph, whereas the mean values observed within the Copepod and
FD groups 10 and 21 dph did not differ significantly from that of yolk sac larvae. No significant
growth in villus height was observed in larvae from any group from 21-34 dph, but all groups
exhibited a significantly increased midgut villus height from 34-50 dph. Additionally, Copepod
and FD larvae showed a significant increase from 34-42 dph and 42-50 dph, respectively.
At hatching, hindgut villus height was on average 71 ± 1 µm (Figure 3.25B; Appendix 10, Table
A9). Larvae from all groups aged 10 dph had a mean hindgut villus height that was significantly
larger than that of yolk sac larvae. Additionally, hindgut villus height was significantly larger in
Copepod larvae compared to both Artemia and FD larvae. Hindgut villus height had increased
significantly in both Artemia and FD larvae from 10-21 dph, whereas mean hindgut villus height
of Copepod larvae 21 dph did not differ significantly from that of yolk sac larvae. Relative to
respective group means 21 dph, hindgut villi of FD larvae had grown significantly by 34 dph and
in Artemia and Copepod larvae by 42 dph. No changes were observed within any group 42-50 dph,
but Artemia larvae had a hindgut villus height that was significantly larger than FD larvae 50 dph.
Both midgut and hindgut villus height were positively correlated to SL for the pooled data, with
corresponding correlation coefficients of 0.911 and 0.840 (p-values < 0.01*). Midgut villus height
was estimated to increase by 15, 24 and 19 µm per mm SL increase in the Artemia, Copepod and
FD groups, respectively. Variation in SL accounted for 75.1 to 89.2 % of the observed variation in
midgut villus height (r2 = 0.751 - 0.892). The slope coefficients and intercepts differed significantly
between the Artemia and Copepod groups (p-values < 0.01*), whereas the slope coefficient and
intercept for the FD group did not differ significantly from any other group (p-values > 0.09). No
treatment effects were found regarding the relationship between hindgut villus height and SL
(p = 0.3*), but hindgut villus height was estimated to increase by an average of 12 µm per mm SL
increase (p < 0.01*). Variation in SL attributed to 70.6 % of the observed variation in hindgut villus
height (r2 = 0.706).

Results
55
Figure 3.25. Mean gut villus height in C. lumpus 0-50 dph. The values (µm) are based on mean midgut (A) and hindgut
(B) villus height in n = 4-5 larvae (0 dph) and n = 3-5 larvae per treatment (10-50 dph), with up to five measurements
per S/Mg and Hg section. Villus height was measured from the basal lamina to the borderline between the microvilli
and gut lumen in areas where the mucosa was folded to form villi. Significant differences (p < 0.05) between treatments
at a given age are denoted by different letters. Errors bars indicate ± standard error (SE).
3.6 Histology of other digestive organs
3.6.1 Esophagus morphology
The esophagus connected the posterior pharynx to the stomach region and had a muscularis
composed of striated muscle fibers arranged in an inner longitudinal and outer circular layer. The
circular layer was observed from hatching and increased progressively in thickness as the larvae
aged, whereas the much less defined longitudinal layer was observed by 21 dph. Longitudinal
folding of the mucosa was observed from hatching, but the folds became more distinct and
developed a comprehensive network of submucosal blood vessels as the larvae increased in size
(Figure 3.26). The esophageal mucosa was initially lined with a single layer of squamous epithelial
40
60
80
100
120
140
160
180
200
220
0 10 21 34 42 50
Mid
gut
vill
us
hei
ght
(µm
)
Dph
Artemia
Copepod
FD
Yolk sac
40
60
80
100
120
140
160
180
200
220
0 10 21 34 42 50
Hin
dgu
t vi
llu
s h
eigh
t (µ
m)
Dph
Artemia
Copepod
FD
Yolk sac
A
B
b a
a
a
b
ab

Results
56
cells but were columnar by 21 dph. Spherical or columnar shaped mucosal goblet cells were also
present from hatching, and had short microvilli protruding into the lumen from their apical
surface and a strongly basophilic base. There seemed to be a longitudinal gradient in the chemical
nature of these cells. Most goblet cells in the anterior part of the esophagus contained acidic
substances (Figure 3.27A), while goblet cells located in the middle and posterior parts had basic
or neutral substances (Figure 3.27B). This gradient was observed from hatching but became more
apparent as additional goblet cells formed with increasing larval age. The latter goblet cell type
closely resembled those observed in the intestinal mucosa.
Figure 3.26. Esophagus in C. lumpus 50 dph. The mucosa was lined with columnar epithelium and interposed with
numerous goblet cells with a basophilic base (black arrows). The submucosa contained a comprehensive network of
blood vessels, particularly in the apex of the folds. Scale bar: 500 µm (left) and 100 µm (right). The picture is a transverse
section from a Copepod larva stained with TB 0.05 %. Abbreviations: Bv = blood vessel, Gc = goblet cell, M = muscularis,
Mu = mucosa, Sm = submucosa.
Figure 3.27. Esophageal goblet cells in C. lumpus 21 dph. Mucosal goblet cells (*) with short microvilli (black arrow)
contained acidic substances in the anterior part of the esophagus (A) and neutral or basic substances in the middle and
posterior parts (B). Scale bar: 50 µm. The pictures are transverse sections from an Artemia larva stained with TB 0.05
%. Abbreviations: Bv = blood vessel, Mu = mucosa, Sm = submucosa.
M
Sm
Bv
Gc
Mu
A B * *
Sm
Bv *
*
Mu
Mu

Results
57
3.6.2 Pancreas morphology
The pancreas initially appeared as a distinct organ attached dorsally to the digestive tract in the
anterior abdomen and consisted of exocrine cells, each with a basal nucleus and prominent
nucleolus (Figure 3.28A). The cytoplasm of the exocrine cells was strongly basophilic and
contained numerous acidophilic zymogen granules already from hatching. Islets of Langerhans
constituted the endocrine pancreas and were enveloped by exocrine pancreatic tissue (Figure
3.28B). These islets were observed by 10 dph. The pancreas seemed to increase in size with larval
age and composed a gradually less distinct organ, with branches of exocrine tissue reaching out
to different parts of the intestine by 21 dph. The pancreas also developed additional associated
blood vessels and excretory intralobular ducts, the latter of which were lined with simple cuboidal
epithelium (Figure 3.28C).
Figure 3.28. Pancreas development in C. lumpus 0-34 dph. A) The pancreas of newly hatched larvae appeared as a
dorsal bud on the anterior part of the digestive canal. Numerous zymogen granules (*) were observed in the basophilic
cytoplasm of the exocrine cells. B) Endocrine pancreatic cells constituted islets of Langerhans and were enveloped by
exocrine tissue (10 dph). C) The pancreas developed clusters of exocrine cells and had branches of exocrine tissue that
reached out to different parts of the digestive canal (34 dph). Scale bar: 100 µm. All pictures are longitudinal sections
from an Artemia larva stained with TB 0.05 %. Abbreviations: Bv = blood vessel, Ep = exocrine pancreas, Id =
Intralobular duct, IL = Islet of Langerhans, Mg = midgut, Ys = yolk sac.
Id
*
*
*
*
*
*
IL
Mg Ys Bv
A B
C
*
Ep
Ep
Ep

Results
58
3.6.3 Pyloric caeca morphology
Pyloric caeca were observed by 34 dph and formed intestinal appendages in the most anterior
part of the intestine, at the intersection between the stomach and midgut (Figure 3.29). These
projections comprised all the four layers characterizing the gastrointestinal tract (i.e. mucosa,
submucosa, muscularis and serosa), with the mucosal and muscular layers closely resembling that
of the intestine. The mucosa was lined with a single layer of columnar enterocytes that had
developed a prominent brush border of microvilli protruding from their apical surface. Goblet
cells and enteroendocrine-like cells resembling those observed in the intestinal mucosa were also
integrated in the mucosa of pyloric caeca. The muscularis was composed of a longitudinal layer of
smooth muscle fibers. Number of villi and caecum diameter seemed to increase accordingly, with
up to nine villi observed in the largest caeca. All caeca were surrounded by branches of exocrine
pancreatic tissue. As this organ was difficult to distinguish histologically from the intestine, the
only evident pyloric caeca were observed in some longitudinal sections of Artemia larvae 34 and
50 dph. A maximum of seven caeca were observed per larva.
Figure 3.29. Pyloric caeca in C. lumpus 50 dph. Several pyloric caeca formed intestinal appendages at the intersection
between the stomach and intestine (black arrow). Scale bar: 500 µm. The picture is a longitudinal section from an
Artemia larva stained with TB 0.05 %. Abbreviations: Ep = exocrine pancreas, L = liver, M = muscularis, Pc = pyloric
caeca, S = serosa, Se = stomach epithelium, Sm = submucosa, St = stomach.
L
Pc
M
Sm
Se
S
Ep
Pc
Ep
Ep
St

Results
59
3.7 Summary of digestive system development
Development of the digestive system in lumpfish larvae from hatching up to day 50 post hatch in
relation to some external and internal markers as well as standard length (SL) is summarized in
Figure 3.30 below. The illustration is based on morphological descriptions and mean SL values in
Artemia larvae, as larvae from this treatment exhibited best growth throughout the start feeding
experiment.
Figure 3.30. Summary of digestive system ontogeny in C. lumpus 0-50 dph. Major ontogenetic events in digestive organs
(esophagus, stomach, midgut, hindgut, pyloric caeca, liver and exocrine pancreas) in relation to some external and
internal features and mean standard length (dark red) 10, 21 and 34 dph (n = 5 per day). The descriptions and mean
standard length values (± SE) are based on larvae from the Artemia group. Abbreviations: EP = exocrine pancreas, Si =
stomach developmental stage (1, 2 or 3).
0 5 10 15 20 25 30 35 40 45 50
Dph
Digestive
system
ontogeny
Gut coiled, separated by intestinal valve and open at both ends 0 dph
Primordial stomach with cardia, pylorus and preliminary pyloric sphincter (S1) 0 dph
Liver and pancreas differentiated with vacuoles (liver) and zymogen granules (EP) 0 dph
Goblet cells present in esophageal and intestinal mucosa 0 dph
Enteroendocrine-like cells in midgut mucosa 10 dph
Supranuclear vesicles in mid- and hindgut enterocytes 10 dph
Gastric glands in cardiac stomach mucosa (S2) 10 dph
Exocrine pancreas branched (more diffuse) 21 dph
Enlarged stomach volume and fundus (S3) 34 dph
Pyloric caeca 34 dph
1. External nostrils
2. Fin rays in all fins
3. Flexion stage
4. Light reflecting
pigments on head
(SL: 7.2 ± 0.1 mm)
1. Complete fin fold
resorption
2. Complete body
pigmentation
3. Second dorsal fin
covered by epidermis
(SL: 8.4 ± 0.2 mm)
1. Faint fin pigmentation
2. Complete yolk sac
resorption
(SL: 10.2 ± 0.3 mm)

Discussion
60
4 Discussion
4.1 Lumpfish digestive system development
The present study demonstrated that all three larval diets promoted proper development of the
digestive system in lumpfish, which followed the general pattern found in teleostean larvae (Luizi
et al., 1999; Ortiz-Delgado et al., 2003; Chen et al., 2006; Zaiss et al., 2006; Faulk et al., 2007).
Already by hatching, the alimentary canal was open at both ends and distinctly divided into the
esophagus, stomach anlage, midgut and hindgut. This indicated a high developmental status at
first feeding compared to altricial species like Atlantic cod, Atlantic halibut, white seabream and
yellowtail kingfish (Seriola lalandi) larvae (Luizi et al., 1999; Ortiz-Delgado et al., 2003; Chen et
al., 2006; Wold et al., 2008). But unlike precocial species such as Atlantic salmon and Atlantic
wolffish (Gorodilov, 1996; Falk-Petersen & Hansen, 2001), the lumpfish stomach was still under
development at onset of exogenous feeding and did not seem to fully differentiate until 34 dph.
The lumpfish digestive system thus exhibited an intermediate developmental status at hatching
compared to characteristic altricial and precocial species. This correlates well with the fact that
lumpfish have considerably longer time to develop between fertilization and hatching compared
to the altricial Atlantic cod (300 versus 90 d°) but shorter time than the precocial Atlantic salmon
(300 versus 500 d°) (see review by Kjørsvik et al., 2004). Although first feeding commenced
shortly after the lumpfish larvae hatched, this species also had a longer lecithotrophic phase (> 21
dph) compared to several altricial fish larvae (Kjørsvik et al., 1991; Ortiz-Delgado et al., 2003;
Chen et al., 2006). A prolonged period with mixed endogenous and exogenous feeding combined
with the well-developed digestive apparatus at first feeding can possibly explain why larval
survival rates in lumpfish larviculture are much higher compared to what is observed in rearing
of for instance in Atlantic cod and ballan wrasse (Øie et al., 2015).
Stomach ontogeny is of high relevance when establishing commercial feeding regimes in lumpfish
as it influences when the larvae are physiologically able to digest formulated diets (Govoni et al.,
1986; Kolkovski, 2001). Some authors have proposed that weaning should be synchronized with
gastric gland formation (Zaiss et al., 2006), as these glands secrete pepsin and HCl to optimize
proteolytic capacity (Tanaka, 1971). The first gastric glands in lumpfish were observed by 10 dph
(S2: 6.6 – 6.8 mm SL) and coincided with notochord flexion, which can serve as a potential weaning
indicator since it is easily examined and does not require any histological investigation. However,
as shown for red porgy (Pagrus pagrus), gastric glands are not necessarily functional at the time
they develop. In this species, gastric glands are differentiated by 25 dph, while pepsinogen
expression and acidic stomach pH is not evident until 30-35 dph (Darias et al., 2005). In contrast,
larval winter flounder (Pseudopleuronectes americanus) develop gastric glands 20 dph, by which

Discussion
61
time expression of both pepsinogen and proton pump subunits responsible for HCl secretion can
be detected (Douglas et al., 1999). It is thus not possible from the present study alone to conclude
at which time the lumpfish gastric glands became functional. The fundic region of the stomach
formed by 34 dph (S3: 8.0 – 9.1 mm SL) and was accompanied by an expanded stomach lumen
volume. This allows ingested feed to be stored and exposed to the acidic and proteolytic gastric
environment for an extended time period, thereby increasing larval protein digestion capacity.
Accordingly, it can be claimed that lumpfish larvae should be weaned after the fundic stomach is
developed to ensure optimized growth and utilization of feed resources. This practice is also
recommended when rearing yellowtail kingfish larvae (Chen et al., 2006).
Epithelial cells lining the lumpfish stomach mucosa were initially cubical but gradually developed
a columnar shape, as also seen in white seabream larvae (Ortiz-Delgado et al., 2003). In lumpfish,
this elongation was observed after larvae reached the final ontogenetic stage (S3) around 34 dph,
as reflected in the increased stomach epithelium height from 34-50 dph. Columnar epithelium
generally performs absorptive or secretory functions (Young et al., 2006), and various studies
indicate that stomach epithelial cells of teleosts are involved in both of these processes. Stomach
epithelial cells of several species contain neutral glycoconjugates that are secreted to form a
mucinous layer on their apical surface, thereby protecting the stomach from autodigestion by HCl
and pepsin (Ferraris et al., 1987; Ortiz-Delgado et al., 2003). Potentially increased secretion of
gastric juices with formation of additional gastric glands must therefore be accompanied by
increased capacity to synthesize and secrete neutral glycoconjugates. This can possibly explain
why stomach epithelium height was positively correlated to gastric gland abundance in the
current study, since elongation of cubical into more voluminous columnar cells imply more space
to both synthesize and store neutralizing substances. It has also been proposed that neutral
glycoconjugates mediate uptake of some easily digestible nutrients such as disaccharides and
short-chained fatty acids by stomach epithelial cells (Grau et al., 1992). Despite which functions
are performed by the cells lining the stomach mucosa in lumpfish, it can be hypothesized that the
change from a cubical to columnar shape is part of the functional maturation of these cells.
Absorptive capacity in lumpfish most certainly increased gradually during ontogeny of the gut as
microvillus and villus height correlated well with larval size, both parameters of which contribute
to increased absorptive surface area (Caspary, 1992; Pirarat et al., 2011). Microvilli elongation
might also have increased digestive capacity by embedding additional brush border enzymes such
as alkaline phosphatase (Zambonino-Infante & Cahu, 2001), whose activity increase accordingly
with microvilli surface area in larval Senegal sole (Solea senegalensis) (Ribeiro et al., 1999). Since
lumpfish microvilli were considerably longer in the midgut compared to the hindgut, as also found
in channel catfish (Ictalurus punctatus) (Krementz & Chapman, 1975), it is possible that brush

Discussion
62
border digestion along the lumpfish intestine is primarily occurring in the anterior half. Seeing as
the enteroendocrine-like cells were restricted to the midgut and pyloric caeca, it is likely that also
luminal digestion is predominant in the anterior parts of the lumpfish gut. Identical findings have
also been made for other species with a coiled gut (Kamisaka et al., 2001; Kamisaka et al., 2002).
As stated by these studies’ authors, it is logical that these cells are located where the chyme is
retained to allow control of the secretory activities of the exocrine pancreas and gallbladder. The
hindgut did, however, exhibit pinocytotic activity that gave rise to acidophilic supranuclear
vesicles. Pinocytosis of dietary proteins diminishes after the gastric function is attained in several
species (Iwai, 1969; Noaillac-Depeyre & Gas, 1976; Ortiz-Delgado et al., 2003; Chen et al., 2006),
whereas the present study found no indication of reduced pinocytotic activity in lumpfish during
or after stomach development. These findings suggest that the intracellular mode of protein
digestion remains significant even in metamorphosed lumpfish individuals, which has also been
found for African catfish (Clarias lazera) (Stroband & Kroon, 1981).
Goblet cells occurred in the intestine and esophagus from hatching and proliferated as larvae aged,
spreading to the pyloric caeca with its formation by 34 dph. These cells contained neutral mucins
in the posterior esophagus and intestine, which could be attributed to a neutralizing function to
prevent proteolysis by gastric juices from the stomach (Smith, 1989). As the most anterior part of
the gastrointestinal tract, the esophagus is also lubricated by secretory products from goblet cells
to prevent physical damage by ingested feed particles (Kapoor et al., 1975). The seemingly large
abundance of esophageal goblet cells at hatching thus indicate that the alimentary canal already
by this time was ready for passage of exogenous food, relating well with the fact that lumpfish
larvae start feeding shortly after hatching. The acidic goblets cells observed in the anterior half of
the esophagus has previously also been found in larval gilthead seabream and Siberian sturgeon
(Acipenser baeri) (Domeneghini et al., 1998; Gisbert et al., 1999). Secretion of acidic residues
might be a response to shifting abiotic factors or maintaining osmotic balance (Domeneghini et
al., 1998), but their function in lumpfish is not possible to clarify from this study alone.
The lumpfish liver was fully differentiated at hatching, as also shown in Atlantic salmon, Atlantic
wolffish and white seabream (Morrison, 1993; Ortiz-Delgado et al., 2003; Hoehne-Reitan &
Kjørsvik, 2004). Additionally, numerous vacuoles were observed in the liver from hatching and
throughout the experimental period in seemingly well-fed larvae. These findings suggest that
lumpfish are ontogenetically programmed to synthesize and store nutrients in the liver during the
entire larval stage, which is also true for rainbow trout (Vernier & Sire, 1977). Selective accretion
of hepatic nutrients indicates that fed lumpfish larvae are able to maintain nutritional homeostasis
and sustain short episodes of food scarcity by mobilizing these nutrients, a potential factor
contributing to the overall high survival rates in lumpfish larviculture.

Discussion
63
Teleostean metamorphosis is the size dependent transformation of larvae into juveniles that has
important implications for all organ systems (Youson, 1988; Kjørsvik et al., 2004). Juveniles have
optimized digestive capacity (Govoni et al., 1986), hence the question of when metamorphosis
occurs in lumpfish is of high relevance regarding digestive system development in this species.
Metamorphosis is initiated with formation of stomach gastric glands (Tanaka, 1971), which in
lumpfish occurred simultaneously with notochord flexion around 10 dph at 6.6 – 6.8 mm SL. This
was followed by fin fold resorption and development of a diffuse pancreas by 21 dph, the latter of
which has been used to characterize metamorphosis in Japanese flounder (Paralichthys olivaceus)
(Kurokawa & Suzuki, 1996). Pyloric caeca formation is the final morphological change in the
digestive system of fish larvae (Bisbal & Bengtson, 1995), and coincided with expansion of the
stomach volume and differentiation of the fundic stomach region around 34 dph at a size of 8.0 –
9.1 mm SL. This overlaps well the 7.7 – 9.7 mm SL size range where external morphometric
characters in lumpfish from the present study changed from an allometric to isometric growth
pattern (van Mil, 2018). As isometric growth is characteristic for metamorphosed fish (Osse & van
den Boogaart, 1995), it can be hypothesized that the lumpfish digestive system is fully developed
and functional before reaching 10 mm SL.
4.2 Larval performance in relation to start feeding diets
4.2.1 Growth, development and survival
The present study found that use of enriched Artemia during the start feeding period (2-22 dph)
improved larval somatic growth and survival compared to the use of A. tonsa and formulated diet.
The differences between larvae fed Artemia and inert diet are in accordance with the hypothesis
and results from previous studies (Brown, 1986; Belova, 2015). On the other hand, a prolonged
feeding with A. tonsa only had a minor benefit on growth observed for the period A. tonsa was
supplied exclusively to Copepod larvae (9-22 dph). The slightly increased growth of Copepod
larvae compared to FD larvae might have been due to differences in feed intake. FD larvae had
been weaned 6-8 dph, hence it is possible that ingestion rates in this group were lower following
weaning as predation is often hampered after fish are introduced to new food sources (Dutton,
1992). Additionally, ingestion might be reduced when feeding fish larvae inert diets over live prey
due to limited movement to trigger predatory behaviour (D'Abramo, 2002). Still, no difference in
larval size or survival was observed between Copepod and FD larvae after weaning to Gemma
micro 300 (20-22 dph). The current findings are thus not enough to confirm the hypothesis that
A. tonsa is advantageous for larval growth and survival of lumpfish compared to formulated diet.
Similarly, Dahle et al. (2017) only found slightly improved growth and survival of lumpfish larvae
fed A. tonsa rather than inert diet and were unable to detect consistent significant differences.

Discussion
64
The better growth obtained by Artemia larvae compared to Copepod and FD larvae was due to
large differences in daily weight increase (DWI) for the period the groups received different larval
diets (2-22 dph). Artemia instar I and A. tonsa copepodites CI-CIII are about similar in linear
dimensions (Miller et al., 1977; Dhont & Van Stappen, 2003). However, the Artemia strain used in
this experiment achieve an individual size of 2.2-2.5 µg/1.2-1.3 mm when enriched over 24 hours
(Jan Ove Evjemo, SINTEF Ocean AS, pers. comm., 2018). This is considerably larger than the
individual size of the used A. tonsa stages, ranging from 0.56-1.40 µg/410-580 µm (‘On growing
of copepods’, user’s manual from C-Feed AS). Differences in larval growth might thus have been
due to a larger biomass of Artemia being available to Artemia larvae. The larger prey size
administrated to Artemia larvae were also more energetically favorable due to a higher nutrient
content (Pastorok, 1981; Olsen, 2004), indicating that less energy had to be invested in foraging
to reach food satiation. A behavioural study reported that lumpfish larvae attach to surfaces and
adopt a passive foraging mode when prey is abundant, while more active foraging is observed
when feed is scarce (Killen et al., 2007a). As Copepod and FD larvae were comparably more active
during the treatment period (2-22 dph), it can be suggested that Artemia larvae grew faster
because they had more energy available for growth (Killen et al., 2007a). Moreover, the active
foraging mode observed in the Copepod and FD groups indicate that these larvae were not fed to
satiation. Several factors could have contributed to this, such as differences in biomass, particle
sizes, capture success or acceptance.
Stomach ontogeny was strongly correlated to larval size, hence the larger DWI of Artemia larvae
induced more rapid stomach morphogenesis (transition from S1 to S2 and S2 to S3) and growth of
the stomach epithelium after complete stomach differentiation (S3) compared to Copepod and FD
larvae. This is important to consider when establishing feeding protocols in lumpfish, as a diet
that can promote rapid growth and stomach development will potentially allow for faster weaning
to formulated diet. Studies have shown that proper development of several species require that
DHA and EPA are located in phospholipids (PL) rather than neutral lipids (NL) (Evjemo et al.,
2003; Gisbert et al., 2005; Kjørsvik et al., 2009; Wold et al., 2009). As DHA and EPA are mainly
incorporated into the NL fraction during Artemia enrichment (Conceição et al., 2010), the rapid
growth and stomach development of Artemia larvae suggest that lipid class is not limiting the
availability of DHA and EPA that are efficiently incorporated into lumpfish larval tissues. This is
also supported by the rapid hepatocyte hypertrophy of Artemia larvae, as increased cell sizes
imply a proportional increase in cell membrane surface area and integration of DHA and EPA
required for proper membrane functioning (Sargent et al., 1999a). These findings correlate well
with the fact that lumpfish had a well-developed digestive system at hatching, which separates
them from some altricial species that require DHA and EPA in the PL fraction for proper growth
and development (Hamre et al., 2002; Evjemo et al., 2003; Kjørsvik et al., 2009; Wold et al., 2009).
Discussion
65
The overall exponential increase in DW and linear increase in SL resulted in an exponential DW/SL
relationship, which can probably be attributed to the allometric growth of many organs during
the larval stage (Osse & van den Boogaart, 1995; Gagnat et al., 2016). The DW/SL slope coefficient
differed significantly between all groups and was considerably lower in Artemia larvae, indicating
reduced organ growth in Artemia-fed larvae compared to similar sized larvae from the other
groups. However, as shown for instance by Gagnat et al. (2016), increase in organ tissue volumes
typically changes from an allometric to isometric growth pattern when fish larvae metamorphose
into juveniles. This implies that growth of the whole fish changes from allometric to isometric as
well, thereby changing the DW/SL ratio from exponential to linear. In a parallel study it was found
that the inflection point where growth in DW in relation to SL changed from allometric to
isometric occurred around 9.5 mm SL (van Mil, 2018). A probable explanation for the lower
DW/SL in the exponential model for Artemia larvae is thus that a comparably larger fraction of all
sampled larvae from this group had a SL > 9.5 mm and were thus growing isometrically (linearly).
The apparent drop in survival of Copepod and FD larvae around 30 dph is consistent with common
experience in commercial lumpfish production (Powell et al., 2017; MoreFish AS, Tjeldbergodden,
Norway, pers. comm., 2018). Powell et al. (2017) claimed that this mortality is caused by weaning
from live to formulated diet, which is also a problem in other species (Bengtson et al., 1999;
Hamlin & Kling, 2001). As Copepod and FD larvae were not weaned to inert diet at the same time
(20-22 versus 6-8 dph) but the survival drop occurred around 30 dph in both groups, mortality
induced by weaning itself seems unlikely. Progressively starved Atlantic cod and European
flounder (Platichthys flesus) larvae grow slowly and encounter a point of no return shortly after
yolk resorption where they are too weak to continue feeding and die (Yin & Blaxter, 1986).
Likewise, Copepod and FD larvae exhibited limited growth and lower nutritional status prior to
yolk resorption between 21 and 34 dph, which overlaps well with the observed mortality after 30
dph in these groups. Lower nutritional status was reflected in both liver and gut histology of these
larvae, such as smaller hepatonuclear sizes and epithelium height in the midgut (Ehrlich et al.,
1976; Segner et al., 1988). On the other hand, Artemia-fed larvae showed much larger DWI prior
to yolk resorption, high nutritional status in the liver and gut, and hardly any mortality during the
experiment. These results indicate that the observed mortality in the Copepod and FD group was
due to malnourishment. Consequently, it can also be hypothesized that the survival bottleneck in
lumpfish larviculture around 30 dph is caused by inadequate ingestion of exogenous food prior to
yolk resorption. Still, it cannot be disregarded that mortality was also caused by the bacteria that
proliferated from 26 dph and entangled larvae. As Artemia larvae were much larger and probably
also stronger than Copepod and FD larvae by the time bacteria flourished, it is possible that it was
easier for these larvae to avoid being entangled. This is supported by the fact that Artemia larvae
were rarely found within bacterial filaments.

Discussion
66
4.2.2 Nutritional status – liver and gut histology
The lumpfish liver and gut exhibited different histological characteristics in response to the start
feeding regimes. Copepod and FD larvae showed significantly smaller hepatocytes and hepatocyte
nuclei compared to Artemia for the period they were fed or shortly after fed A. tonsa (Copepod
larvae: 10 and 21 dph, FD larvae: 10 dph), at which time the livers of these larvae also were
deprived of hepatic vacuoles. Differences in larval gut histology between dietary treatments were
most pronounced in terms of epithelium height, which was significantly lower in both the midgut
and hindgut of Copepod and FD larvae compared to Artemia larvae during the start feeding period
(2-22 dph). These effects on the liver and gut tissue coincided with the low larval growth rates
observed in the Copepod and FD groups. The present findings thus suggest that histological
organization of the liver and gut in lumpfish are sensitive towards dietary factors and indicative
of larval nutritional status. This is in accordance with studies on Atlantic cod, Atlantic herring,
European flounder, European plaice and pejerrey (Odontesthes bonariensis) (Ehrlich et al., 1976;
Segner & Möller, 1984; Strüssmann & Takashima, 1990; Kjørsvik et al., 1991).
The teleostean liver grows allometrically during the larval stage (Gagnat et al., 2016), and a study
with Atlantic cod found that larger sized larvae displayed the largest livers and hepatocytes (Wold
et al., 2009). Present findings indicate that a similar relation might be true for lumpfish larvae, as
limited hepatocyte hypertrophy was observed in Copepod and FD larvae during the period larval
growth rates were low in these two groups. At this time, these larvae also had seemingly smaller
livers than Artemia larvae. It has been shown that hepatocyte size in larval turbot is determined
by the amount of nutrients stored within hepatocytes (Segner et al., 1994). Similarly, Fontagné et
al. (1998) attributed larger hepatocytes in common carp (Cyprinus carpio) larvae to an increased
flux of lipoproteins from the intestine to the liver. The observed hepatocyte hypertrophy in larvae
from the Copepod and FD treatments might thus have been due to the significant accretion of
vacuolated nutrients after weaning from A. tonsa to inert diet. This can explain why hepatocytes
of FD larvae but not Copepod larvae had increased in size by 21 dph, at which time FD larvae had
been fed formulated diet for roughly two weeks while Copepod larvae were still receiving A. tonsa.
Interestingly, larvae from all groups also showed significant hypertrophy towards the end of the
experiment. In contrast to vacuoles observed 0-21 dph, the vacuoles residing in hepatocytes by
34 dph seemed larger and were clearly of lipid origin (Caballero et al., 2004; Gisbert et al., 2005).
It is thus possible that the continued hypertrophy after 34 dph can be attributed to a change in
the type of nutrients stored in the liver. This could either be due to weaning, an ontogenetic change
in liver metabolism, or a combination of dietary and ontogenetic factors (Segner & Witt, 1990).
Larger hepatocytes are also related to essential FA deficiency (Watanabe et al., 1989). But as
hepatocyte size related positively with growth rates and hepatic vacuole content, it seems more
likely that hypertrophy of these cells is associated with a high nutritional status in lumpfish.

Discussion
67
Hepatocyte area sizes were positively correlated with hepatonuclear sizes. This was reflected in
the significantly smaller nuclei of Copepod and FD larvae compared to Artemia larvae at the same
time as hepatocyte sizes differed between these groups during the treatment period (2-22 dph).
A start feeding experiment with Atlantic cod by Wold et al. (2009) found smaller hepatocyte nuclei
in larvae from the treatment group that showed lowest growth. This is consistent with present
findings, as small hepatonuclear area sizes coincided with low growth rates in Copepod and FD
larvae. In contrast, large nuclei are associated with high metabolic activity as the increased
membrane surface area allows for more rapid transfer of molecules between the nucleus and
cytoplasm (Ghadially, 1997). The positive linear correlation between hepatonuclear area size and
hepatic vacuole content in the present study thus indicate that larvae with large nuclei and a high
nutrient content in their liver were more metabolically active. No such relationship was found in
the Artemia group, probably only because these larvae exhibited high nutritional status in terms
of large nuclei and a high vacuole content at all times during the experiment. Hepatonuclear sizes
correlated negatively with lipid content in the livers of Atlantic cod and common carp larvae
(Fontagné et al., 1998; Wold et al., 2009). On the other hand, area sizes of hepatocyte nuclei in the
present study were largest in larvae from all groups during the period the vacuoles contained
lipids. It can thus be hypothesized that a high lipid content in the liver of lumpfish is a sign of high
nutritional status.
Previous studies with fish have shown that hepatic glycogen and lipids are depleted during fasting
(Weis, 1972; Leatherland, 1984; Segner & Möller, 1984; Watanabe, 1985), an indication of average
or degraded hepatocytes in fish larvae (Grade 1/2, Table 1.1). The evident reduction of hepatic
vacuoles in Copepod and FD larvae during the treatment period (2-22 dph) thus suggest that these
larvae were malnourished. This can explain why some larvae from these groups showed signs of
histopathological effects associated with starvation, such as sinusoidal dilatation, less prominent
hepatocyte boundaries and central hepatocyte nuclei (Gisbert et al., 2008). Strüssmann and
Takashima (1990) found that the hepatocyte nuclei of starved pejerrey larvae gradually shrank
and reached a minimum size just before death. Although the small hepatonuclear sizes displayed
by Copepod and FD larvae during the treatment period (2-22 dph) were not significantly reduced
from hatching, it is likely that malnourishing conditions can explain why the nuclei of these larvae
were significantly smaller than that of Artemia larvae. Differences in supplied live prey biomass,
prey sizes or larval capture success of the prey can possibly explain why larvae fed A. tonsa
showed signs of starvation. Absence of histopathological liver effects and replenishment of
hepatic vacuoles after the Copepod and FD larvae had been weaned to inert diet suggest reversal
of starving conditions (Segner & Möller, 1984). Moreover, it indicates that dietary effects on the
liver accurately reflected larval nutritional status at the time these larvae were sampled.
Discussion
68
Lipid absorption in the midgut was most noticeable in Artemia larvae 10 and 21 dph, matching
the period when these larvae were fed enriched Artemia. Most lipid inclusions constituted large
droplets with a diameter > 5 µm, which could be attributed to a high dietary NL content in
enriched Artemia (Deplano et al., 1989; Gisbert et al., 2005). Some researchers relate intestinal
steatosis with reduced absorption capacity due to cellular abrasion, necrosis or inflammatory
reactions (Deplano et al., 1991; Segner et al., 1993). As no such effects were observed along the
intestinal mucosa in any larvae, it seems unlikely that the extensive lipid assimilation in the gut of
Artemia larvae was a pathological condition. The intestinal lipid droplets could have formed
because the absorption rate exceeded the rate of export from midgut enterocytes (Gisbert et al.,
2005; Wold et al., 2008). Still, the rapid growth rates and high nutritional liver status of Artemia-
fed larvae suggest that the absorbed lipids only constituted a temporary storage in midgut
enterocytes and were successfully exported to peripheral tissues. Comparably fewer lipid
inclusions in Copepod larvae 10-21 dph and FD larvae 10 dph coincided with a seemingly low
content of exogenous food sources in the midgut lumen of these larvae. This provides a probable
explanation for the low larval growth rates in these groups. As FD larvae still had seemingly low
gut contents and nutritional liver status by 10 dph but not 21 dph, it is likely that larval ingestion
rates were still low in this group after weaning 6-8 dph. As previously discussed, this could be due
to introduction of a new type feed type (Dutton, 1992).
Of the measured parameters in the gut, epithelium height in the midgut exhibited largest variation
in response to supplied larval diet. Midgut enterocytes grew rapidly in Artemia larvae and reached
a maximum height already 10 dph, thus establishing fully hypertrophied enterocytes at an early
ontogenetic stage as described for Atlantic cod (Wold et al., 2008). On the other hand, two larvae
from the FD group exhibited 22 and 43 % reduction in midgut epithelium height from 10-21 dph,
during which time mean midgut epithelium height also reduced significantly in Copepod larvae.
Several authors have found reduced intestinal mucosa in fish larvae during starvation (Ehrlich et
al., 1976; Oozeki et al., 1989; Kjørsvik et al., 1991; Segner et al., 1993), which seems like a probable
explanation for the reduced epithelium height of these larvae. This also correlates well with the
low larval growth rates and nutritional status of Copepod and FD larvae during the start feeding
period (2-22 dph). The reduced epithelium height observed 21 dph did however not correspond
to degraded enterocytes but rather an average condition (Grade 2, Table 1.1). As previously
stated, histopathological effects on the liver tissue were pronounced already by 10 dph. Present
findings thus indicate that the liver reflected larval nutritional status more accurately than the
gut, which is in accordance with previous studies with larvae of Atlantic cod and European sea
bass (Catalán & Olivar, 2002; Wold et al., 2009; Norheim, 2011). This might be attributed to lower
energy investment in renewal of enterocytes during starvation followed by a gradual rather than
immediate degeneration of intestinal tissue (Rios et al., 2004).

Discussion
69
The greatly enlarged midgut epithelium height in Copepod and FD larvae from 21-34 dph indicate
that these larvae had not been yet been starved to such an extent that regrowth of the intestinal
mucosa was irreversible (Watanabe, 1985; Kjørsvik et al., 1991). This is supported by the fact that
no distortion of microvilli or villi was observed in seemingly starved Copepod and FD larvae,
which are common histopathological features of malnourished fish (Gas & Noailliac-Depeyre,
1976; Kjørsvik et al., 1991; McFadzen et al., 1994; Rios et al., 2004; Krogdahl & Bakke-McKellep,
2005). It is however probable that the observed increase in midgut epithelium height 21-34 dph
was due to the significant mortality in some Copepod and FD tanks around 30 dph, in which case
starved (and dead) larvae were omitted from the sampling 34 dph. Studies with Atlantic cod and
gilthead seabream larvae have shown that larvae reach a point of irreversible starvation where
the intestine is degenerated to such an extent that death is inevitable (Kjørsvik et al., 1991; Yúfera
et al., 1993). The same can be expected to be true for lumpfish. Hypothetically, the observed
reduction in midgut epithelium height continued from 21 dph and terminated with functional
shutdown of the intestine prior to the apparent drop in survival around 30 dph. Nevertheless, the
present findings suggest that midgut epithelium height might be a sensitive parameter indicative
of long term starvation in lumpfish.
Hindgut enterocyte height showed overall slower growth than midgut enterocytes, and even more
so in Copepod and FD larvae although no sign for degeneration was observed. Accordingly, the
hindgut was not as useful to distinguish treatments as the midgut and liver. Similarly, hepatocyte
diameter and muscle fiber separation were more sensitive to dietary treatments than hindgut
epithelium height in European sea bass larvae (Catalán & Olivar, 2002). It has previously been
found that lumpfish larvae fed formulated diet had seemingly smaller and fewer intestinal villi
than larvae fed A. tonsa (Dahle et al., 2017). In the present study, one FD larva aged 21 dph had
very few villi in the midgut. This larva also had thin midgut epithelium (42 % reduction from
average value 10 dph) and a much smaller size than other larvae from the same treatment,
suggesting that villi abundance is related to nutritional status in lumpfish. Few consistent
differences were found in villus height, but the slope coefficient between midgut villus height and
SL was significantly larger Copepod larvae than Artemia larvae. It is likely that this difference was
due to the fast growth rates of Artemia larvae and that relative villus growth was slower in larger
larvae. Likewise, a study with Atlantic cod larvae demonstrated that intestinal length and volume
increased rapidly during early larval stages but then deaccelerated with increasing larval size
(Wold et al., 2009).

Discussion
70
4.3 Methodological limitations
Due to unequal A. tonsa and Artemia biomass it is difficult to conclude if differences in larval
growth, survival, as well as developmental and conditional status of the digestive organs were due
to qualitative or quantitative aspects of the larval diets. It was also difficult to obtain equal larval
densities between individual rearing tanks, which could have affected larval growth and survival
besides the dietary treatments (Holm et al., 1990). Each treatment consisted of a triplicate number
of tanks (n = 3). This limited the number of independent values for DWI and survival estimates as
these variables are estimated on basis of per tank and not larva. Relatively small sample sizes were
also used for histological analyses (n = 5) due to the time-consuming procedure of tissue
processing, sectioning and analysis. Small sample sizes have lower statistical power as it increases
the probability of incorrectly accepting the null hypothesis (H0: no significant difference) in favor
of the alternative hypothesis (H1: significant difference) (Keppel & Wickens, 2004). Moreover,
small sample sizes provide less reliable and precise results (Sandelowski, 1995; Hackshaw, 2008).
The present findings should thus be interpreted with caution but can prove useful if designing
larger and more comprehensive studies.
Measurements of the morphometric parameters may have been over- or underestimated as the
angle of the section is not always perfectly transverse. Another problem with histological and
stereological methods is the low objectivity and reliance on the experience of the histologist
(Catalán, 2003). As an example, complete morphogenesis of the lumpfish stomach with formation
of the fundic region (S3) was not observed until 34 dph. This is much later than 16 dph in cobia
(Rachycentron canadum) and 18 dph in yellowtail kingfish (Chen et al., 2006; Faulk at al., 2007),
both species of which develop gastric glands around the same time as lumpfish. Accordingly, it is
possible that stomach development in lumpfish completed somewhat earlier than identified in
this study. Investigation of some additional age groups < 34 dph would thus be advantageous to
get more accurate information regarding stomach development and potentially other digestive
organs as well.

Conclusions
71
5 Conclusions
The present study demonstrated that the digestive system of lumpfish follows an ontogenetic
pattern similar to that of other teleosts. The gastrointestinal tract of newly hatched larvae was
divided into the esophagus, stomach anlage, midgut and hindgut, at which time the liver exhibited
high nutritional status with abundant nutrient inclusions. Both the mouth and anus were open at
hatching, indicating that the alimentary canal was ready to process exogenous food long before
yolk resorption 21-34 dph. These findings indicated a well-developed digestive system at hatching
compared to many altricial species but lower developmental status than precocial species. Gastric
glands had formed in the stomach by 10 dph (6.6 – 6.8 mm standard length). Digestive system
morphogenesis was completed by 34 dph when the stomach volume had expanded (8.0 – 9.1 mm
standard length) and the fundic stomach and pyloric caeca were differentiated.
Using enriched Artemia as live prey for lumpfish enhanced growth rates during the start feeding
period (2-22 dph) compared to using Acartia tonsa, regardless of whether A. tonsa was fed for the
full start feeding period or with an early weaning to formulated diet. This resulted in larger larval
sizes throughout the experiment and was proposed to be decisive for the high larval survival rates
in this group. Stomach development correlated strongly to larval size, and the improved growth
rates associated with the use of Artemia as a start feed induced more rapid stomach differentiation
and stomach epithelium growth. Histological organization of the liver and gut exhibited different
characteristics in response to supplied diet and indicated lower nutritional status in larvae fed A.
tonsa. The liver accurately reflected larval nutritional status at the time of sampling in terms of
hepatocyte area sizes, hepatonuclear area sizes and vacuole content. Of the measured parameters
in the gut, midgut epithelium height exhibited largest variation in response to the diet. Feeding
with A. tonsa was associated with a gradual rather than immediate reduction in midgut epithelium
height, which was suggested to be a useful biomarker for long term starvation in lumpfish.
Present findings provide useful information applicable when optimizing rearing protocols for
lumpfish, as a successful production requires that feeding regimes are adapted to developmental
status of the fish and not vice versa. Inert diets should ideally be fed to lumpfish after complete
stomach development when protein digestion capacity is maximized and not immediately after
hatching, a common practice in commercial lumpfish production today. It is however important
to stress that a morphologically differentiated organ is not necessarily functional in a fish that is
still under development. Findings from the present study should thus be combined with other
methodological approaches to get a holistic view of digestive system development in lumpfish.
Further research should also aim to find the start feed most suited for lumpfish, which require
that start feeding experiments with equal biomasses of supplied live feed are conducted.

References
72
6 References
Aaen SM, Helgesen KO, Bakke MJ, Kaur K, Horsberg TE (2015). Drug resistance in sea lice: a threat to salmonid aquaculture. Trends in parasitology 31: 72-81. Albers CS, Kattner G, Hagen W (1996). The compositions of wax esters, triacylglycerols and phospholipids in Arctic and Antarctic copepods: evidence of energetic adaptations. Marine Chemistry 55: 347-358. Baskerville-Bridges B, Kling LJ (2000). Development and evaluation of microparticulate diets for early weaning of Atlantic cod Gadus morhua larvae. Aquaculture Nutrition 6: 171-182. Beccaria C, Diaz JP, Connes R, Chatain B (1991). Organogenesis of the exocrine pancreas in the sea bass, Dicentrarchus labrax L., reared extensively and intensively. Aquaculture 99: 339-354. Belova I (2015). Nutritional programming in lumpsucker, Cyclopterus lumpus- a transcriptomic approach. Master's Thesis. Universitetet i Nordland, Norway. Bengtson DA, Léger P, Sorgeloos P (1991). Use of Artemia as a food source for aquaculture. Artemia biology 11: 255-285. Bengtson DA, Lydon L, Ainley JD (1999). Green‐Water Rearing and Delayed Weaning Improve Growth and Survival of Summer Flounder. North American Journal of Aquaculture 61: 239-242. Bisbal GA, Bengtson DA (1995). Development of the digestive tract in larval summer flounder. Journal of Fish Biology 47: 277-291. Bjordal Å (1991). Wrasse as cleaner-fish for farmed salmon. Progress in Underwater Science 16: 17–28. Bjordal Å, Fernö A, Furevik DM, Huse I (1988). Effects on salmon (Salmo salar) from different operational procedures in fish farming. International Council for the Exploration of the Sea C.M. 1988, F:16. Boulhic M, Gabaudan J (1992). Histological study of the organogenesis of the digestive system and swim bladder of the Dover sole, Solea solea (Linnaeus 1758). Aquaculture 102: 373- 396. Brannon PM (1990). Adaptation of the exocrine pancreas to diet. Annual review of nutrition 10: 85-105. Brown JA (1986). The development of feeding behaviour in the lumpfish, Cyclopterus lumpus. Journal of fish biology 29: 171-178. Buddington RK (1985). Digestive secretions of lake sturgeon, Acipenser fulvescens, during early development. Journal of Fish Biology 26: 715-723. Burridge L, Weis JS, Cabello F, Pizarro J, Bostick K (2010). Chemical use in salmon aquaculture: a review of current practices and possible environmental effects. Aquaculture 306: 7-23. Caballero MJ, Izquierdo MS, Kjørsvik E, Fernandez AJ, Rosenlund G (2004). Histological
alterations in the liver of sea bream, Sparus aurata L., caused by short‐or long‐term
feeding with vegetable oils. Recovery of normal morphology after feeding fish oil as the
sole lipid source. Journal of Fish Diseases 27: 531-541.
Cahu CL, Zambonino-Infante JL, Barbosa V (2003). Effect of dietary phospholipid level and phospholipid: neutral lipid value on the development of sea bass (Dicentrarchus labrax) larvae fed a compound diet. British Journal of Nutrition 90: 21-28. Carvalho AP, Oliva-Teles A, Bergot P (2003). A preliminary study on the molecular weight profile of soluble protein nitrogen in live food organisms for fish larvae. Aquaculture 225: 445-449. Caspary WF (1992). Physiology and pathophysiology of intestinal absorption. American Journal of Clinical Nutrition 55: 299-308. Catalán IA (2003). Condition indices and their relationship with environmental factors in fish larvae. Doctoral Thesis. Universitat de Barcelona, Barcelona.

References
73
Catalán IA, Olivar MP (2002). Quantification of muscle condition using digital image analysis in
Dicentrarchus labrax larvae, and relationship with survival. Journal of the Marine
Biological Association of the United Kingdom 82: 649-654.
Chen BN, Qin JG, Kumar MS, Hutchinson W, Clarke S (2006). Ontogenetic development of the digestive system in yellowtail kingfish Seriola lalandi larvae. Aquaculture 256: 489-501. Conceição LEC, van der Meeren T, Verreth JAJ, Evjen MS, Houlihan DF, Fyhn HJ (1997). Amino acid metabolism and protein turnover in larval turbot (Scophthalmus maximus) fed natural zooplankton or Artemia. Marine Biology 129: 255-265. Conceição LEC, Yúfera M, Makridis P, Morais S, Dinis MT (2010). Live feeds for early stages of fish rearing. Aquaculture research 41: 613-640. Costello MJ (2006). Ecology of sea lice parasitic on farmed and wild fish. Trends in parasitology 22: 475-483. Costello MJ (2009a). The global economic cost of sea lice to the salmonid farming industry. Journal of fish diseases 32: 115-118. Costello MJ (2009b). How sea lice from salmon farms may cause wild salmonid declines in Europe and North America and be a threat to fishes elsewhere. Proceedings of the Royal Society of London B: Biological Sciences 276: 3385-3394. Coutteau P, Geurden I, Camara MR, Bergot P, Sorgeloos P (1997). Review on the dietary effects of phospholipids in fish and crustacean larviculture. Aquaculture 155: 149-164. Daborn GR, Gregory RS (1983). Occurrence, distribution, and feeding habits of juvenile lumpfish, Cyclopterus lumpus L. in the Bay of Fundy. Canadian Journal of Zoology 61: 797-801. D'Abramo LR (2002). Challenges in developing successful formulated feed for culture of larval fish and crustaceans. Avances en Nutrición Acuícola VI. Memorias del VI Simposium Internacional de Nutrición Acuícola 3: 143-151. Dahle SVW, Hagemann A, Attramadal K, Kjørsvik E, Bardal T (2017). Vannkvalitet og startfôring av rognkjeks - Effekt av fôring med levende copepoder i tidlige faser. (FHF prosjekt nr. 901174). SINTEF Ocean. Available from: https://brage.bibsys.no/xmlui/handle/11250/2443644 (Obtained: 8 Apr 2018). Dahle SVW, Hagemann A, Attramadal Y, Stavrakaki M, Evjemo JO, Kjørsvik E (2014). Long term feeding with copepods. In: Helland S, Dahle SVW, Hough C, Borthen, J (ed.) Production of ballan wrasse – science and practice, pp. 46-47. The Norwegian Seafood Research Fund, Oslo. Darias MJ, Murray HM, Martínez-Rodríguez G, Cárdenas S, Yúfera, M (2005). Gene expression of pepsinogen during the larval development of red porgy (Pagrus pagrus). Aquaculture 248: 245-252. Deplano M, Connes R, Diaz JP, Barnabé G. (1991). Variation in the absorption of macromolecular proteins in larvae of the sea bass Dicentrarchus labrax during transition to the exotrophic phase. Marine Biology 110: 29-36. Deplano M, Connes R, Diaz JP, Paris J (1989). Intestinal steatosis in the farm - reared sea bass Dicentrarchus labrax. Diseases of Aquatic Organisms 6: 121-130. Dhont J, & van Stappen, G (2003). Biology, tank production and nutritional value of Artemia. In: Støttrup JG, McEvoy LA (ed.) Live feeds in marine aquaculture, pp. 65-121. Blackwell Publishing, Oxford. Domeneghini C, Straini RP, Veggetti A (1998). Gut glycoconjugates in Sparus aurata L. (Pisces, Teleostei). A comparative histochemical study in larval and adult ages. Histology and Histopathology 13: 359-372. Douglas SE, Gawlicka A, Mandla S, Gallant JW (1999). Ontogeny of the stomach in winter flounder: characterization and expression of the pepsinogen and proton pump genes and determination of pepsin activity. Journal of Fish Biology 55: 897-915. Dutton P (1992). Effects of experience on feeding success by larval white seabass, Atractoscion nobilis. Journal of fish biology 41: 765-773.

References
74
Egidius E, Møster B (1987). Effect of Neguvon® and Niven® treatment on crabs (Cancer pagurus, C. maenas), lobster (Homarus gammarus) and blue mussel (Mytilus edulis). Aquaculture 60: 165-168. Ehrlich KF, Blaxter JHS, Pemberton R (1976). Morphological and histological changes during the growth and starvation of herring and plaice larvae. Marine Biology 35: 105-118. Einarsson S, Davies PS (1997). A multiductal system conveys digestive enzymes from the pancreas into the intestine in the Atlantic salmon. Journal of fish biology 50: 1120-1123. Evjemo JO, Reitan KI, Olsen Y (2003). Copepods as live food organisms in the larval rearing of halibut larvae (Hippoglossus hippoglossus L.) with special emphasis on the nutritional value. Aquaculture 227: 191-210. Falk‐Petersen IB, Hansen TK (2001). Organ differentiation in newly hatched common wolffish. Journal of fish biology 59: 1465-1482. FAO (2018). Global aquaculture production (online query). Available from: http://www.fao.org/fishery/statistics/global-aquaculture-production/en (Obtained: 26 Mar 2018). Faulk CK, Benninghoff AD, Holt GJ (2007). Ontogeny of the gastrointestinal tract and selected digestive enzymes in cobia Rachycentron canadum (L.). Journal of Fish Biology 70: 567- 583. Feder HM (1966). Cleaning symbiosis in the marine environment. In: Henry SD (ed.) Symbiosis, Volume 1, pp. 327-380. Academic Press, New York. Ferraris RP, Tan JD, De La Cruz MC (1987). Development of the digestive tract of milkfish, Chanos chanos (Forsskal): histology and histochemistry. Aquaculture 61: 241-257. Fontagné S, Geurden I, Escaffre AM, Bergot P (1998). Histological changes induced by dietary
phospholipids in intestine and liver of common carp (Cyprinus carpio L.) larvae.
Aquaculture 161: 213-223.
Fox J, Weisberg S, Adler D, Bates D, Baud-Bovy G, Ellison S, et al. (2017). car: Companion to applied regression. R package version 2.1-6. Available from: https://CRAN.R- project.org/package=car (Obtained: 23 Feb 2018). Fyhn HJ (1989). First feeding of marine fish larvae: are free amino acids the source of energy? Aquaculture 80: 111-120. Gagnat MR, Wold PA, Bardal T, Øie G, & Kjørsvik E. (2016). Allometric growth and development of organs in ballan wrasse (Labrus bergylta Ascanius, 1767) larvae in relation to different live prey diets and growth rates. Biology open 5: 1241-1251. Garrido MO, Torres MN, Equisoain MA (1993). Histological, histochemical and ultrastructural analysis of the gastric mucosa in Oncorhynchus mykiss. Aquaculture 115: 121-132. Gas N, Noailliac-Depeyre J (1976). Studies on intestinal epithelium involution during prolonged fasting. Journal of ultrastructure research 56: 137-151. Ghadially FN (1997). Ultrastructural pathology of the cell and matrix. Volume 1, 4th edn. Butterworth-Heinemann, MA, USA. Gisbert E, Ortiz-Delgado JB, Sarasquete MC (2008). Nutritional cellular biomarkers in early life
stages of fish. Histology and histopathology 23: 1525-1539.
Gisbert E, Sarasquete MC, Williot P, Castelló‐Orvay F (1999). Histochemistry of the development of the digestive system of Siberian sturgeon during early ontogeny. Journal of Fish Biology 55: 596-616. Gisbert E, Villeneuve L, Zambonino-Infante JL, Quazuguel P, Cahu CL (2005). Dietary phospholipids are more efficient than neutral lipids for long-chain polyunsaturated fatty acid supply in European sea bass Dicentrarchus labrax larval development. Lipids 40: 609-618. Gorodilov YN (1996). Description of the early ontogeny of the Atlantic salmon, Salmo salar, with a novel system of interval (state) identification. Environmental biology of fishes 47: 109- 127. Govoni JJ, Boehlert GW, Watanabe Y (1986). The physiology of digestion in fish larvae. Environmental Biology of Fishes 16: 59-77.

References
75
Grau A, Crespo S, Sarasquete MC, Canales ML (1992). The digestive tract of the amberjack Seriola dumerili, Risso: a light and scanning electron microscope study. Journal of Fish Biology, 41: 287-303. Gundersen HJG, Bendtsen TF, Korbo L, Marcussen N, Møller A, Nielsen K, et al. (1988). Some new, simple and efficient stereological methods and their use in pathological research and diagnosis. Apmis 96: 379-394. Hackshaw A (2008). Small studies: strengths and limitations. European Respiratory Journal 32: 1141-1143. Hamlin HJ, Kling LJ (2001). The culture and early weaning of larval haddock (Melanogrammus aeglefinus) using a microparticulate diet. Aquaculture 201: 61-72. Hamre K, Harboe T (2008). Critical levels of essential fatty acids for normal pigmentation in Atlantic halibut (Hippoglossus hippoglossus L.) larvae. Aquaculture 277: 101-108. Hamre K, Opstad I, Espe M, Solbakken J, Hemre GI, Pittman K (2002). Nutrient composition and
metamorphosis success of Atlantic halibut (Hippoglossus hippoglossus, L.) larvae fed
natural zooplankton or Artemia. Aquaculture Nutrition 8: 139-148.
Hamre K, Yúfera M, Rønnestad I, Boglione C, Conceição LE, Izquierdo M (2013). Fish larval nutrition and feed formulation: knowledge gaps and bottlenecks for advances in larval rearing. Reviews in Aquaculture 5: 26-58. Helland S, Dahle SVW, Hough C, Borthen J (2014). Production of ballan wrasse - science and Practice. The Norwegian Seafood Research Fund, Oslo. Helland S, Terjesen BF, Berg L (2003). Free amino acid and protein content in the planktonic copepod Temora longicornis compared to Artemia franciscana. Aquaculture 215: 213- 228. Hoehne-Reitan K, Kjørsvik E (2004). Functional development of the liver and exocrine pancreas in teleost fish. American Fisheries Society 40: 9-36. Hoehne‐Reitan K, Kjørsvik E, Gjellesvik DR (2001). Development of bile salt‐dependent lipase in larval turbot. Journal of Fish Biology 58: 737-745. Hoff FH, Snell TW (1987). Plankton Culture Manual, Florida Aqua Farms, Inc., Florida. Holm JC, Refstie T, Bø S (1990). The effect of fish density and feeding regimes on individual growth rate and mortality in rainbow trout (Oncorhynchus mykiss). Aquaculture 89: 225-232. Holm S (1979). A simple sequentially rejective multiple test procedure. Scandinavian journal of statistics 6: 65-70. Honkanen RE, Crim JW, Patton JS (1988). Effects of cholecystokinin peptides on digestive enzymes in killifish in vivo. Comparative biochemistry and physiology. A 89: 655-660. Houde ED, Schekter RC (1981). Growth rates, rations and cohort consumption of marine fish larvae in relation to prey concentrations. Rapp. P.-V. Reun. Cons. Int. Explor. Mer 178: 441-453. Huang L, Schreiber AM, Soffientino B, Bengtson DA, Specker JL (1998). Metamorphosis of summer flounder (Paralichthys dentatus): thyroid status and the timing of gastric gland formation. The Journal of experimental zoology 280: 413-420. Hunter JR (1981). Feeding ecology and predation of marine fish larvae. In: Lasker R (ed.) Marine Fish larvae: Morphology, Ecology and Relation to Fisheries, pp. 33-77. Washington Sea Grant Program, Seattle. Imsland AK, Reynolds P, Eliassen G, Hangstad TA, Foss A, Vikingstad E, et al. (2014a). The use of lumpfish (Cyclopterus lumpus L.) to control sea lice (Lepeophtheirus salmonis Krøyer) infestations in intensively farmed Atlantic salmon (Salmo salar L.). Aquaculture 424: 18- 23. Imsland AK, Reynolds P, Eliassen G, Hangstad TA, Nytrø AV, Foss A, et al. (2014b). Assessment of growth and sea lice infection levels in Atlantic salmon stocked in small-scale cages with lumpfish. Aquaculture 433: 137-142. Ingólfsson A, Kristjánsson BK (2002). Diet of juvenile lumpsucker Cyclopterus lumpus (Cyclopteridae) in floating seaweed: effects of ontogeny and prey availability. Copeia 2002: 472-476.

References
76
Iversen A, Hermansen Ø, Andreassen O, Brandvik RK, Marthinussen A, Nystøyl R (2015). Kostnadsdrivere i lakseoppdrett. (Nofima report 41/2015). Nofima. Available from: https://brage.bibsys.no/xmlui/handle/11250/2357896 (Obtained: 27 Mar 2018). Iwai T (1969). Fine structure of gut epithelial cells of larval and juvenile carp during absorption of fat and protein. Archivum histologicum japonicum 30: 183-199. Izquierdo MS (1996). Essential fatty acid requirements of cultured marine fish larvae. Aquaculture Nutrition 2: 183-191. Jobling M (2004). On‐Growing to Market Size. In: Moksness E, Kjørsvik E, Olsen Y (ed.) Culture of cold-water marine fish, pp. 363-432. Blackwell Publishing Ltd., Oxford. Kamisaka Y, Kaji T, Masuma S, Tezuka N, Kurokawa T, Suzuki T, et al. (2002). Ontogeny of cholecystokinin-immunoreactive cells in the digestive tract of bluefin tuna, Thunnus thynnus, larvae. Sarsia: North Atlantic Marine Science 87: 258-262. Kamisaka Y, Totland GK, Tagawa M, Kurokawa T, Suzuki T, Tanaka M, et al. (2001). Ontogeny of cholecystokinin-immunoreactive cells in the digestive tract of Atlantic halibut, Hippoglossus hippoglossus, larvae. General and Comparative Endocrinology, 123: 31-37. Kapoor BG, Smit H, Verighina IA (1975). The alimentary canal and digestion in teleosts. Advances in Marine Biology 13: 109-239. Karlsen Ø, van der Meeren T, Rønnestad I, Mangor-Jensen A, Galloway TF, Kjørsvik E, et al.. (2015). Copepods enhance nutritional status, growth and development in Atlantic cod (Gadus morhua L.) larvae—can we identify the underlying factors? PeerJ 3: e902. Kelly NI, Alzaid A, Nash GW, Gamperl AK (2014). Metabolic depression in cunner (Tautogolabrus adspersus) is influenced by ontogeny, and enhances thermal tolerance. PloS one 9: e114765. Keppel G, Wickens TD (2004). Design and analysis: A researcher’s handbook. 4th edn. Upper Saddle River, NJ: Pearson Prentice Hall. Killen SS, Brown JA, Gamperl AK (2007a). The effect of prey density on foraging mode selection in juvenile lumpfish: balancing food intake with the metabolic cost of foraging. Journal of Animal Ecology 76: 814-825. Killen SS, Costa I, Brown JA, Gamperl AK (2007b). Little left in the tank: metabolic scaling in marine teleosts and its implications for aerobic scope. Proceedings of the Royal Society of London B: Biological Sciences 274: 431-438. Kjørsvik E, Olsen C, Wold PA, Hoehne-Reitan K, Cahu CL, Rainuzzo J, et al. (2009). Comparison of dietary phospholipids and neutral lipids on skeletal development and fatty acid composition in Atlantic cod (Gadus morhua). Aquaculture 294: 246-255. Kjørsvik E, Pittman K, Pavlov D (2004). From fertilisation to the end of metamorphosis— functional development. In: Moksness E, Kjørsvik E, Olsen Y. (ed.) Culture of cold- water marine fish, pp. 204-278. Blackwell Publishing Ltd., Oxford. Kjørsvik E, van der Meeren T, Kryvi H, Arnfinnson J, Kvenseth PG (1991). Early development of the digestive tract of cod larvae, Gadus morhua L., during start‐feeding and starvation. Journal of fish Biology 38: 1-15. Kolkovski S (2001). Digestive enzymes in fish larvae and juveniles—implications and applications to formulated diets. Aquaculture 200: 181-201. Krementz AB, Chapman GB (1975). Ultrastructure of the posterior half of the intestine of the channel catfish, Ictalurus punctatus. Journal of Morphology 145: 441-481. Krogdahl Å, Bakke-McKellep AM (2005). Fasting and refeeding cause rapid changes in intestinal tissue mass and digestive enzyme capacities of Atlantic salmon (Salmo salar L.). Comparative Biochemistry and Physiology Part A: Molecular & Integrative Physiology 141: 450-460. Kurokawa T, Suzuki T (1996). Formation of the diffuse pancreas and the development of digestive enzyme synthesis in larvae of the Japanese flounder Paralichthys olivaceus. Aquaculture 141: 267-276. Kvåle A, Nordgreen A, Tonheim SK, Hamre K (2007). The problem of meeting dietary protein requirements in intensive aquaculture of marine fish larvae, with emphasis on Atlantic halibut (Hippoglossus hippoglossus L.). Aquaculture Nutrition 13: 170-185.

References
77
Lazo JP, Darias MJ, Gisbert E (2011). Ontogeny of the digestive tract. In: Holt, G. J (ed.) Larval fish nutrition, 3-46. Wiley-Blackwell, West Sussex. Leatherland JF (1982). Effect of a commercial trout diet on liver ultrastructure of fed and fasted yearling coho salmon, Oncorhynchus kisutch Walbaum. Journal of Fish Biology 21: 311- 319. Lie Ø, Lied E, Lambertsen G (1986). Liver retention of fat and of fatty acids in cod (Gadus morhua) fed different oils. Aquaculture 59: 187-196. Liu J, Caballero MJ, Izquierdo M, Ali TES, Hernández-Cruz CM, Valencia A, et al. (2002). Necessity of dietary lecithin and eicosapentaenoic acid for growth, survival, stress resistance and lipoprotein formation in gilthead sea bream Sparus aurata. Fisheries science 68: 1165- 1172. Liu Y, vanhauwaer Bjelland H (2014). Estimating costs of sea lice control strategy in Norway. Preventive veterinary medicine 117: 469-477. López-Alvarado J, Langdon CJ, Teshima SI, Kanazawa A (1994). Effects of coating and encapsulation of crystalline amino acids on leaching in larval feeds. Aquaculture 122: 335-346. Lorance P, Cook R, Herrera J, de Sola L, Florin A, Papaconstantinou C (2015). Cyclopterus lumpus, The IUCN Red List of Threatened Species 2015: e.T18237406A45078284. Available from: http://www.iucnredlist.org/details/18237406/1 (Obtained: 16 Apr 2018). Luizi FS, Gara B, Shields RJ, Bromage NR (1999). Further description of the development of the digestive organs in Atlantic halibut (Hippoglossus hippoglossus) larvae, with notes on differential absorption of copepod and Artemia prey. Aquaculture 176: 101-116. Marine Harvest (2015). Salmon Farming Industry Handbook 2015. Available from: http://hugin.info/209/R/1934071/696335.pdf. (Obtained: 29 Mar 2018). McFadzen IRB, Lowe DM, Coombs SH (1994). Histological changes in starved turbot larvae (Scophthalmus maximus) quantified by digital image analysis. Journal of Fish Biology 44: 255-262. Miller CB, Johnson JK, Heinle DR (1977). Growth rules in the marine copepod genus Acartia. Limnology and Oceanography 22: 326-335. Morrison CM (1993). Histology of the Atlantic cod, Gadus morhua: An Atlas. Part Four. Eleutheroembryo and Larva. Canadian Special Publication of Fisheries and Aquatic Sciences 119. National Research Council of Canada, Ottawa. Mähr K, Grabner M, Hofer R, Moser H (1983). Histological and physiological development of the stomach in Coregonus sp. Archiv für hydrobiology 98: 344-353. Mæland A, Rønnestad I, Fyhn HJ, Berg L, Waagbø R (2000). Water-soluble vitamins in natural plankton (copepods) during two consecutive spring blooms compared to vitamins in Artemia franciscana nauplii and metanauplii. Marine Biology 136: 765-772. Navarro JC, Henderson RJ, McEvoy LA, Bell MV, Amat F (1999). Lipid conversions during enrichment of Artemia. Aquaculture 174: 155-166. Noaillac-Depeyre J, Gas N (1976). Electron microscopic study on gut epithelium of the tench (Tinca tinca L.) with respect to its absorptive functions. Tissue and cell 8: 511-530. Nodland E (2017). Forventer en produksjon på 30 millioner rognkjeks i 2017, iLaks. Available from: https://ilaks.no/forventer-en-produksjon-pa-30-millioner-rognkjeks-i-2017/ (Obtained: 29 Mar 2018). Nordgreen A, Tonheim S, Hamre K (2009). Protein quality of larval feed with increased concentration of hydrolysed protein: effects of heat treatment and leaching. Aquaculture nutrition 15: 525-536. Nordgreen A, Yúfera M, Hamre K (2008). Evaluation of changes in nutrient composition during production of cross-linked protein microencapsulated diets for marine fish larvae and suspension feeders. Aquaculture 285: 159-166. Norheim IA (2011). Effects of live feed quality on cod (Gadus morhua L.) larval hepatocyte and enterocyte development. Master's Thesis. Norwegian University of Science and Technology, Norway.
References
78
Norwegian Directorate of Fisheries (2017a). Use of cleanerfish 1998-2016. Available from: https://www.fiskeridir.no/English/Aquaculture/Statistics/Cleanerfish-Lumpfish-and Wrasse (Obtained: 28 Mar 2018). Norwegian Directorate of Fisheries (2017b). Sale of farmed cleanerfish 2012-2016. Available from: https://www.fiskeridir.no/English/Aquaculture/Statistics/Cleanerfish-Lumpfish- and-Wrasse (Obtained: 28 Mar 2018). NRC (2011). Nutrient Requirements of Fish and Shrimp. National Academic Press, Washington D.C. Nusbickel FR, Swartz WJ (1979). Enzyme histochemical investigation of glycol methacrylate embedded chick embryonic tissue. The Histochemical Journal 11: 197-203. Nytrø AV, Vikingstad E, Foss A, Hangstad TA, Reynolds P, Eliassen G, et al. (2014). The effect of temperature and fish size on growth of juvenile lumpfish (Cyclopterus lumpus L.). Aquaculture 434: 296-302. Næss T, Germain-Henry M, Naas KE (1995). First feeding of Atlantic halibut (Hippoglossus hippoglossus) using different combinations of Artemia and wild zooplankton. Aquaculture 130: 235-250. Ogle DH (2017). FSA: Fisheries Stock Analysis. R package version 0.8-17. Available from: https://github.com/droglenc/FSA (Obtained: 23 Feb 2018). Olsen Y (2004). Live Food Technology of Cold‐Water Marine Fish Larvae. In: Moksness E, Kjørsvik E, Olsen Y (ed.) Culture of cold-water marine fish, pp. 73-128. Blackwell Publishing Ltd., Oxford. Olsen Y, van der Meeren T, Reitan KI (2004). First feeding technology. In: Moksness E, Kjørsvik E, Olsen Y (ed.) Culture of cold-water marine fish, pp. 279-336. Blackwell Publishing Ltd., Oxford. Oozeki Y, Ishii T, Hirano R (1989). Histological study of the effects of starvation on reared and wild-caught larval stone flounder, Kareius bicoloratus. Marine Biology 100: 269-275. Ortiz-Delgado JB, Darias MJ, Cañavate JP, Yúfera M, Sarasquete C (2003). Organogenesis of the digestive tract in the white seabream, Diplodus sargus. Histological and histochemical approaches. Histology and histopathology 18: 1141-1154. Osse JWM, van den Boogaart JGM (1995). Fish larvae, development, allometric growth, and the aquatic environment. ICES Marine Science Symposia 201: 21–34. Pantic I, Petrovic D, Paunovic J, Vucevic D, Radosavljevic T, Pantic S (2016). Age-related reduction of chromatin fractal dimension in toluidine blue–Stained hepatocytes. Mechanisms of ageing and development 157: 30-34. Pastorok RA (1981). Prey vulnerability and size selection by Chaoborus larvae. Ecology 62: 1311-1324. Pauly D, Christensen V (1995). Primary production required to sustain global fisheries. Nature 374: 255-257. Payne MF, Rippingale RJ (2000). Rearing West Australian seahorse, Hippocampus subelongatus, juveniles on copepod nauplii and enriched Artemia. Aquaculture 188: 353-361. Pike AW (1989). Sea lice—major pathogens of farmed Atlantic salmon. Parasitology today 5: 291-297. Pirarat N, Pinpimai K, Endo M, Katagiri T, Ponpornpisit A, Chansue N, et al. (2011). Modulation of intestinal morphology and immunity in nile tilapia (Oreochromis niloticus) by Lactobacillus rhamnosus GG. Research in veterinary science 91: 92-97. Pohlert, T (2018). PMCMRplus: Calculate Pairwise Multiple Comparisons of Mean Rank Sums Extended. R package version 1.0-0. Available from: https://CRAN.R-project.org/package=PMCMRplus (Obtained: 23 Feb 2018). Powell A, Treasurer JW, Pooley CL, Keay AJ, Lloyd R, Imsland AK, et al. (2017). Use of lumpfish for sea‐lice control in salmon farming: challenges and opportunities. Reviews in Aquaculture doi:10.1111/raq.12194 Rainuzzo JR, Reitan KI, Olsen Y (1997). The significance of lipids at early stages of marine fish: a review. Aquaculture 155: 103-115.

References
79
R Core Team (2017). R: A language and environment for statistical computing. R Foundation for Statistical Computing, Vienna, Austria. Available from: https://www.R-project.org/ (Obtained: 23 Feb 2018). Ribeiro L, Zambonino-Infante JL, Cahu C, Dinis MT (1999). Development of digestive enzymes in larvae of Solea senegalensis, Kaup 1858. Aquaculture 179: 465-473. Rios FS, Kalinin AL, Fernandes MN, Rantin FT (2004). Changes in gut gross morphology of traíra, Hoplias malabaricus (Teleostei, Erythrinidae) during long-term starvation and after refeeding. Brazilian Journal of Biology 64: 683-689. RStudio Team (2016). RStudio: Integrated Development for R. RStudio, Inc., Boston, MA. Available from: http://www.rstudio.com/ (Obtained: 23 Feb 2018). Rønnestad I, Conceição LE, Aragão C, Dinis MT (2000a). Free amino acids are absorbed faster and assimilated more efficiently than protein in postlarval Senegal sole (Solea senegalensis). The Journal of nutrition 130: 2809-2812. Rønnestad I, Dominguez RP, Tanaka M (2000b). Ontogeny of digestive tract functionality in Japanese flounder, Paralichthys olivaceus studied by in vivo microinjection: pH and assimilation of free amino acids. Fish Physiology and Biochemistry 22: 225-235. Rønnestad I, Thorsen A, Finn RN (1999). Fish larval nutrition: a review of recent advances in the roles of amino acids. Aquaculture 177: 201-216. Rønnestad I, Tonheim SK, Fyhn HJ, Rojas-Garcıa CR, Kamisaka Y, Koven W, et al. (2003). The supply of amino acids during early feeding stages of marine fish larvae: a review of recent findings. Aquaculture 227: 147-164. Rønnestad I, Yúfera M, Ueberschär B, Ribeiro L, Sæle Ø, Boglione C (2013). Feeding behaviour and digestive physiology in larval fish: current knowledge, and gaps and bottlenecks in research. Reviews in Aquaculture 5: 59-98. Salte R, Syvertsen C, Kjønnøy M, Fonnum F (1987). Fatal acetylcholinesterase inhibition in salmonids subjected to a routine organophosphate treatment. Aquaculture 61: 173-179. Sandelowski M (1995). Sample size in qualitative research. Research in nursing & health 18: 179- 183. Sarasquete MC, Polo A, Yúfera M (1995). Histology and histochemistry of the development of the digestive system of larval gilthead seabream, Sparus aurata L. Aquaculture 130: 79-92. Sargent JR, Bell JG, Bell MV, Henderson RJ, Tocher DR (1993). The metabolism of phospholipids and polyunsaturated fatty acids in fish. In: Lahlou B, Vitiello PV (ed.) Aquaculture: Fundamental and applied research, pp. 103-124. American Geophysical Union, Washington, D.C. Sargent JR, Bell JG, McEvoy L, Tocher D, Estevez A (1999a). Recent developments in the essential fatty acid nutrition of fish. Aquaculture 177: 191-199. Sargent JR, McEvoy LA, Estevez A, Bell G, Bell M, Henderson J, Tocher D (1999b). Lipid nutrition of marine fish during early development: current status and future directions. Aquaculture 179: 217-229. Sasso-Cerri E, Giovanoni M, Hayashi H, Miraglia SM (2001). Morphological alterations and intratubular lipid inclusions as indicative of spermatogenic damage in cimetidine-treated rats. Archives of andrology 46: 5-13. Sayer MDJ, Reader JP (1996). Exposure of goldsinny, rock cook and corkwing wrasse to low temperature and low salinity: survival, blood physiology and seasonal variation. Journal of fish biology 49: 41-63. Schneider CA, Rasband WS, Eliceiri KW (2012). NIH Image to ImageJ: 25 years of image analysis. Nature methods 9: 671-675. Segner H, Möller H (1984). Electron microscopical investigations on starvation-induced liver pathology in flounders Platichthys flesus. Marine Ecology Progress Series 19: 193-196. Segner H, Rösch R, Schmidt H, von Poeppinghausen KJ (1988). Studies on the suitability of commercial dry diets for rearing of larval Coregonus lavaretus from Lake Constance. Aquatic living resources 1: 231-238.
References
80
Segner H, Rösch R, Verreth J, Witt U. (1993). Larval nutritional physiology: studies with Clarias gariepinus, Coregonus lavaretus and Scophthalmus maximus. Journal of the World Aquaculture Society 24: 121-134. Segner H, Storch V, Reinecke M, Kloas W, Hanke W (1994). The development of functional digestive and metabolic organs in turbot, Scophthalmus maximus. Marine Biology 119: 471-486. Segner H, Witt U (1990). Weaning experiments with turbot (Scophthalmus maximus): electron
microscopic study of liver. Marine Biology 105: 353-361.
Shields RJ, Bell JG, Luizi FS, Gara B, Bromage NR, Sargent JR (1999). Natural copepods are superior to enriched Artemia nauplii as feed for halibut larvae (Hippoglossus hippoglossus) in terms of survival, pigmentation and retinal morphology: relation to dietary essential fatty acids. The Journal of nutrition 129: 1186-1194. Skiftesvik AB, Bjelland RM (2003). Oppdrett av berggylt (Labrus bergylta). Norsk fiskeoppdrett, 28: 5. Skjermo J, Salvesen I, Øie G, Olsen Y, Vadstein O (1997). Microbially matured water: a technique for selection of a non-opportunistic bacterial flora in water that may improve performance of marine larvae. Aquaculture International 5: 13-28. Slack JM (1995). Developmental biology of the pancreas. Development 121: 1569-1580. Smith LS (1989). Digestive functions in teleost fishes. In: Halver JE (ed.) Fish nutrition, 2nd edn., pp. 332-421. Academic press, San Diego. Sorgeloos P (1980). The use of the brine shrimp Artemia in aquaculture. The brine shrimp Artemia 3: 25-46. Sorgeloos P, Bossuyt E, Laviña E, Baeza-Mesa M, Persoone G (1977). Decapsulation of Artemia cysts: a simple technique for the improvement of the use of brine shrimp in aquaculture. Aquaculture 12: 311-315. Sorgeloos P, Lavens P, Leger P, Tackaert W, Versichele D (1986). Manual for the culture and use of Brine Shrimp Artemia in aquaculture. State University of Gent, Belgium. Sridharan G, Shankar AA (2012). Toluidine blue: A review of its chemistry and clinical utility. Journal of oral and maxillofacial pathology 16: 251-255. Steffens, W (1989). Principles of fish nutrition. Ellis Horwood, Chichester. Stroband HWJ, Kroon AG (1981). The development of the stomach in Clarias lazera and the intestinal absorption of protein macromolecules. Cell and Tissue Research 215: 397-415. Strüssmann CA, Takashima F (1990). Hepatocyte nuclear size and nutritional condition of larval pejerrey, Odontesthes bonariensis (Cuvier et Valenciennes). Journal of Fish Biology 36: 59-65. Svåsand T, Karlsen Ø, Kvamme BO, Stien LH, Taranger GL, Boxaspen KK (2016). Risikovurdering norsk fiskeoppdrett 2016. Fisken og havet, særnr. 2-2016. Tanaka M (1971). Studies on the structure and function of the digestive system in teleost larvae III. Development of the digestive system during postlarval stage. Japanese Journal of Ichthyology 18: 164-174. Tandler A (1985). Overview: food for the larval stages of marine fish. Live or inert? Israel Journal of Zoology 33: 161-166. Team MC, Blanchard G, Dickhaus T, Hack N, Konietschke F, Rohmeyer K, et al. (2017). mutoss: Unified multiple testing procedures. R package version 0.1-12. Available from: https://github.com/kornl/mutoss/ (Obtained: 23 Feb 2018). Treasurer JW (2002). A review of potential pathogens of sea lice and the application of cleaner fish in biological control. Pest management science 58: 546-558. Walne PR (1979). Culture of bivalve molluscs: 50 years’ experience at Conwy. Fishing News Books, Oxford. White JR, Roman MR (1992). Egg production by the calanoid copepod Acartia tonsa in the mesohaline Chesapeake Bay: the importance of food resources and temperature. Marine Ecology Progress Series 86: 239-249.

References
81
Tocher DR, Bendiksen EÅ, Campbell PJ, Bell JG (2008). The role of phospholipids in nutrition and metabolism of teleost fish. Aquaculture 280: 21-34. Towers L (2013). Lumpfish: The Latest Weapon in the Battle Against Sea Lice?, The Fish Site. Available from: https://thefishsite.com/articles/lumpfish-the-latest-weapon-in-the- battle-against-sea-lice (Obtained: 30 Mar 2018). van der Meeren T, Olsen RE, Hamre K, Fyhn HJ (2008). Biochemical composition of copepods for evaluation of feed quality in production of juvenile marine fish. Aquaculture 274: 375- 397. van Mil, J (2018). Growth patterns in lumpfish (Cyclopterus lumpus) fed formulated diet, Artemia nauplii, and Acartia tonsa as start-feeds. Minor Thesis. University of Wageningen, Netherlands. Vernier JM, Sire MF (1977). Lipoprotéines de très basse densité et glycogène dans le syncytium vitellin, l'épithélium intestinal et le foie, aux stades précoces du développement embryonnaire chez la truite arc-en-ciel. Biol. cell 29: 45-53. Watanabe T, Thongrod S, Takeuchi T, Satoh S, Kubota SS, Fujimaki Y, et al. (1989). Effect of dietary n-6 and n-3 fatty acids on growth, fatty acid composition and histological changes of white fish Coregonus lavaretus maraena. Nippon Suisan Gakkaishi 55: 1977- 1982. Watanabe Y (1985). Histological changes in the liver and intestine of freshwater goby larvae during short-term starvation. Bull. Jap. Soc. scient. Fish. 51: 707-709. Weis P (1972). Hepatic ultrastructure in two species of normal, fasted and gravid teleost fishes. Developmental Dynamics 133: 317-331. Wold PA, Hoehne-Reitan K, Cahu CL, Zambonino-Infante JL, Rainuzzo J, Kjørsvik E (2007). Phospholipids vs. neutral lipids: effects on digestive enzymes in Atlantic cod (Gadus morhua) larvae. Aquaculture 272: 502-513. Wold PA, Hoehne‐Reitan K, Cahu CL, Zambonino-Infante JL, Rainuzzo J, Kjørsvik E (2009). Comparison of dietary phospholipids and neutral lipids: effects on gut, liver and pancreas histology in Atlantic cod (Gadus morhua L.) larvae. Aquaculture Nutrition 15: 73-84. Wold PA, Hoehne‐Reitan K, Rainuzzo J, Kjørsvik E (2008). Allometric growth and functional development of the gut in developing cod Gadus morhua L. larvae. Journal of Fish Biology 72: 1637-1658. Yin MC, Blaxter JHS (1986). Morphological changes during growth and starvation of larval cod (Gadus morhua L.) and flounder (Platichthys flesus L.). Journal of Experimental Marine Biology and Ecology 104: 215-228. Young B, Lowe JS, Stevens A, Heath JW (2006). Wheather’s Functional Histology - a text and colour atlas, 4th edn. Hartcourt Publishers Limited, London. Youson JH (1988). First metamorphosis. In: Hoar WS, Randall JR (ed.) Fish Physiology, Volume 11, Part B, pp. 135-196. Academic Press, San Diego. Yúfera M, Pascual E, Polo A, Sarasquete MC (1993). Effect of starvation on the feeding ability of gilthead seabream (Spams aurata L.) larvae at first feeding. Journal of Experimental Marine Biology and Ecology 169: 259-272. Zaiss MM, Papadakis IE, Maingot E, Divanach P, Mylonas CC (2006). Ontogeny of the digestive tract in shi drum (Umbrina cirrosa L.) reared using the mesocosm larval rearing system. Aquaculture 260: 357-368. Zambonino-Infante JL, Cahu CL (2001). Ontogeny of the gastrointestinal tract of marine fish larvae. Comparative Biochemistry and Physiology Part C: Toxicology & Pharmacology 130: 477-487. Øie G, Galloway T, Sørøy M, Holmvaag Hansen M, Norheim IA, Halseth CK, et al. (2015). Effect of cultivated copepods (Acartia tonsa) in first‐feeding of Atlantic cod (Gadus morhua) and ballan wrasse (Labrus bergylta) larvae. Aquaculture Nutrition 23: 3-17.

Appendices
82
7 Appendices
Appendix 1. Dehydration and embedding (Technovit® 7100)
Component 1: Basic resin (monomer), 500 mL 2-hydroxyethylmethacrylate (HEMA)
Component 2: Activator (powder), 5 pkg. a 1 g dibenzoyl peroxide
Component 3: Hardener II (herder), 40 mL dimethyl sulfoxide
Dehydration fluids: ……… _____
Samples were immersed in the first dehydration fluid (A) at 4 °C for 3 hours, before transferred
to the second dehydration fluid (B) at room temperature for 2 hours.
Infiltration fluid:
A magnetic stirrer was used until the powder was completely dissolved. The dehydrated samples
were immersed in the infiltration fluid and placed on a digital shaker (ROCKER 3D digital, IKA®,
USA) overnight (12 hours or more). The infiltration fluid was stored at 4 °C for a maximum of four
weeks.
Polymerization fluid:
The two components were mixed for 3-5 minutes and used immediately, as the polymerization
process was very rapid. The samples were placed and oriented in individual embedment molds,
which were partly filled with the polymerization fluid. An adapter (holding the block steady when
attached to the microtome) was then placed over the mold containing the sample, and the mold
was filled with polymer through a hole in the adapter. The embedment was completed after 40-
120 minutes at room temperature.
50 ml Basic Resin + 0,5 g Activator (10 mg/mL)
30 mL infiltration fluid + 2 mL Hardener II (15 mL/mL)
A: 15 mL distilled water + 5 mL Basic Resin (3 mL/mL)
B: 10 mL distilled water + 10 mL Basic Resin (1 mL/mL)

Appendices
83
Appendix 2. Staining protocols and tests
Four different staining methods (A-D) were tested on the larvae embedded in Technovit® 7100
(Kulzer, Germany), with some modifications:
A. Toluidine blue (TB)
1. Stain with toluidine blue in saturated borate buffer for 30 seconds.
2. Rinse with distilled water to remove excess stain.
3. Rinse with 70 % ethanol and distilled water.
4. Dry on hot plate (75 °C) for 20 minutes or more.
Note: A concentration of 0.05 % TB was compared to 0.1 % TB to examine if it affected resolution
of the tissue. The desired concentration was obtained by diluting the stain with saturated borate
buffer.
B. Periodic acid Schiff (PAS)
1. Immerse in periodic acid at 56 °C for 15 or 30 minutes.
2. Stain with Schiff’s reagent for 15 minutes.
3. Rinse with running tap water for 2-3 minutes.
4. Stain with Hematoxylin for 5 minutes.
5. Quick immersion in acid alcohol (1% HCl in 70 % ethanol). Repeat 5 times.
6. Rinse with running tap water for 2-3 minutes and dip in distilled water.
7. Dry on hot plate (75 °C) for 20 minutes or more.
Note: Immersion of the sections in periodic acid for a 15-minute duration was compared to a 30-
minute duration. This was done to examine if the duration affected the extent of glucose oxidation.
C. Alcian Blue-Periodic acid Schiff (AB-PAS)
1. Stain with Alcian blue for 5 minutes.
2. Rinse with running tap water.
3. Follow steps 1-7 for PAS staining (B).
D. Hematoxylin and Eosin (H&E)
1. Stain with Hematoxylin for 5 minutes.
2. Rinse with running tap water for 3 minutes to allow stain to develop.
3. Quick immersion in acid alcohol (1% HCl in 70 % ethanol). Repeat 5 times.
4. Rinse with running tap water for 3 minutes.
5. Stain with Eosin (0.5 % aqueous) for 2 minutes.
6. Quick immersion in 70 % ethanol.
7. Quick immersion in distilled water.
8. Dry on hot plate (75 °C) for 20 minutes or more.

Appendices
84
Appendix 3. Results from the staining methods
Figure A1. Cross-section of C. lumpus liver 50 dph. The sections are stained according to the protocols in Appendix 2:
A) TB 0.05 %, B) TB 0.1 %, C) PAS 15 min, D) PAS 30 min, E) AB-PAS 15 min, F) AB-PAS 30 min, G) H&E. All sections are
embedded in Technovit® 7100 and scanned with 40x magnification. Scale bars: 50 µm.
A B
C D
E F
G

Appendices
85
Figure A2. Cross-section of C. lumpus gut epithelium 50 dph. The sections are stained according to the protocols in
Appendix 2: A) TB 0.05 %, B) TB 0.1 %, C) PAS 15 min, D) PAS 30 min, E) AB-PAS 15 min, F) AB-PAS 30 min, G) H&E.
All samples are embedded in Technovit® 7100 and scanned with 40x magnification. Scale bars: 50 µm.
A B
C D
E F
G

Appendices
86
Appendix 4. Functions in RStudio used for statistical analyses
Table A1. R functions used for statistical analyses. Functions used when comparing treatments and different age groups within each treatment are listed, including the R package where the functions can be found.
Statistical test R function R package Comments
Shapiro-Wilk shapiro.test() Default
Q-Q plot qqnorm()
qqline()
Default The function qqnorm() was used to plot
theoretical versus sample quantiles, while qqline() was used to plot the
line used to evaluate normality. Levene leveneTest() car1 The argument center was set equal to
mean to compare the means for the
different treatments: center=mean
One-way ANOVA lm()
anova()
Default The function lm() was used to fit a
linear model with the dependent and independent variable as arguments, while anova() was used to conduct the
actual test. Welch’s ANOVA oneway.test() Default The argument var.equal was set equal
to FALSE to assume heteroscedasticity: var.equal=FALSE
Kruskal-Wallis kruskal.test() Default
Student-Newman-Keuls’ post hoc
snk() mutoss2 The argument alpha was set equal to
0.05 to control the significance level: alpha=0.05
Dunnett’s T3 post hoc
DunnettT3Test() PMCMRplus3
Dunn’s post hoc dunnTest() FSA4 The argument method was set equal to
“holm” to use Holm’s correction for
adjustment of p-values: method=”holm”
Paired sample t-test
t.test() Default The argument paired was set equal to
TRUE: paired=TRUE
Wilcoxon’s signed-rank tests
wilcox.test() Default The argument paired was set equal to
TRUE: paired=TRUE
Pearson correlation
cor.test() Default The argument method was set equal to
“pearson” to acquire Pearson’s
correlation coefficient (r): method=”pearson”
ANCOVA lm()
summary()
Default The function lm() was used to fit the
linear function with the dependent and independent variable as arguments, including the interaction effect of the different treatments: lm(y∼x*group).
The function summary() was used to
conduct the actual test. 1. Fox J, Weisberg S, Adler D, Bates D, Baud-Bovy G, Ellison S, et al. (2017). car: Companion to applied
regression. R package version 2.1-6. Available from: https://CRAN.R-project.org/package=car 2. Team MC, Blanchard G, Dickhaus T, Hack N, Konietschke F, Rohmeyer K, et al. (2017). mutoss: Unified
multiple testing procedures. R package version 0.1-12. Available from: https://github.com/kornl/mutoss/
3. Pohlert T (2018). PMCMRplus: Calculate Pairwise Multiple Comparisons of Mean Rank Sums Extended. R package version 1.0-0. Available from: https://CRAN.R-project.org/package=PMCMRplus
4. Ogle DH (2017). FSA: Fisheries Stock Analysis. R package version 0.8-17. Available from: https://github.com/droglenc/FSA

Appendices
87
Appendix 5. Mean dry weight per tank
Table A2. Mean dry weight in C. lumpus 0-51 dph. The averages (mg larva-1) are shown for individual tanks on each
sampling day, together with respective standard errors (SE) and total number of sampled larvae (Total N).
Dph Group Tank Mean DW ± SE
(mg larva-1) Total
N Dph Group Tank
Mean DW ± SE (mg larva-1)
Total N
0 Yolk sac Hatching
tank 1.10 ± 0.01 16
2 Yolk sac Hatching
tank 1.07 ± 0.01 16
6
Artemia 1 2 9
1.17 ± 0.02 1.23 ± 0.04 1.23 ± 0.03
5 5 5
21
Artemia 1 2 9
2.80 ± 0.13 3.05 ±0.14 3.08 ± 0.06
5 5 5
Copepod 3 6
10
1.06 ± 0.01 1.04 ± 0.03 1.02 ± 0.04
5 5 5
Copepod 3 6
10
1.20 ± 0.07 1.23 ± 0.04 1.59 ± 0.15
5 5 5
FD 4 5 7
1.07 ± 0.01 1.03 ± 0.03 1.04 ± 0.01
5 5 5
FD 4 5 7
1.30 ± 0.13 0.90 ± 0.10 1.44 ± 0.14
5 5 5
10
Artemia 1 2 9
1.43 ± 0.03 1.37 ± 0.05 1.40 ± 0.05
5 5 5
24
Artemia 1 2 9
3.34 ± 0.39 2.88 ± 0.15 3.60 ± 0.29
5 5 5
Copepod 3 6
10
1.07 ± 0.05 1.12 ± 0.03 1.08 ± 0.04
5 5 5
Copepod 3 6
10
1.43 ± 0.19 1.13 ± 0.05 1.42 ± 0.06
5 5 5
FD 4 5 7
1.06 ± 0.05 1.08 ± 0.04 1.07 ± 0.04
5 5 5
FD 4 5 7
1.44 ± 0.14 0.88 ± 0.13 1.36 ± 0.10
5 5 5
13
Artemia 1 2 9
1.57 ± 0.07 1.71 ± 0.09 1.91 ± 0.07
5 5 5
29
Artemia 1 2 9
4.37 ± 0.39 4.35 ± 0.64 3.88 ± 0.32
5 5 5
Copepod 3 6
10
1.18 ± 0.03 1.16 ± 0.04 1.16 ± 0.04
5 5 5
Copepod 3 6
10
1.40 ± 0.38 1.01 ± 0.03 1.84 ± 0.31
5 5 5
FD 4 5 7
1.06 ± 0.03 0.80 ± 0.10 1.08 ± 0.04
5 5 5
FD 4 5 7
2.35 ± 0.13 2.08 ± 0.29 2.35 ± 0.19
5 5 5
17
Artemia 1 2 9
2.12 ± 0.14 2.25 ± 0.13 2.33 ± 0.12
5 5 5
34
Artemia 1 2 9
5.96 ± 0.57 4.87 ± 0.34 5.79 ± 0.19
5 5 5
Copepod 3 6
10
1.27 ± 0.11 1.30 ± 0.04 1.53 ± 0.03
5 5 5
Copepod 3 6
10
1.97 ± 0.15 2.40 ± 0.32 4.03 ± 0.14
5 5 5
FD 4 5 7
1.08 ± 0.07 1.15 ± 0.07 1.09 ± 0.08
5 5 5
FD 4 5 7
3.03 ± 0.18 3.17 ± 0.27 3.13 ± 0.17
5 5 5

Appendices
88
Table A2. Mean dry weight in C. lumpus 0-51 dph (continued). The averages (mg larva-1) are shown for individual tanks
on each sampling day, together with respective standard errors (SE) and total number of sampled larvae (Total N).
Dph Group Tank Mean DW ± SE
(mg larva-1) Total
N Dph Group Tank
Mean DW ± SE (mg larva-1)
Total N
38
Artemia 1 2 9
7.24 ± 0.43 5.61 ± 0.81 6.18 ± 0.69
5 5 5
50
Artemia 1 2 9
13.16 ± 0.90 14.88 ± 0.56 18.49 ± 1.42
10 10 10
Copepod 3 6
10
3.50 ± 0.40 3.75 ± 0.12 4.62 ± 0.75
5 5 5
Copepod 3 6
10
7.29 ± 0.55 8.45 ± 0.80
12.83 ± 1.09
10 10 10
FD 4 5 7
3.74 ± 0.37 4.46 ± 0.63 4.23 ± 0.18
5 5 5
FD 4 5 7
10.30 ± 0.70 10.05 ± 0.62 8.51 ± 0.73
10 10 10
42
Artemia 1 2 9
10.52 ± 0.99 11.06 ± 0.80 12.14 ± 0.93
10 10 10
51
Artemia 1 2 9
18.70 ± 0.92 19.49 ± 1.92 28.67 ± 1.14
14 10 15
Copepod 3 6
10
4.98 ± 0.55 4.93 ± 0.51 5.54 ± 0.50
10 10 10
Copepod 3 6
10
9.79 ± 0.77 9.99 ± 0.80
13.78 ± 0.65
14 16 16
FD 4 5 7
5.29 ± 0.53 6.69 ± 0.49 6.04 ± 0.43
10 10 10
FD 4 5 7
11.01 ± 0.86 13.15 ± 0.78 11.60 ± 0.99
16 16 16
45
Artemia 1 2 9
12.42 ± 0.76 11.40 ± 0.77 13.73 ± 0.86
10 10 10
Copepod 3 6
10
5.62 ± 0.57 6.98 ± 0.66 8.35 ± 0.83
10 10 10
FD 4 5 7
6.57 ± 0.20 6.64 ± 0.61 5.76 ± 0.61
10 10 10

Appendices
89
Appendix 6. Mean wet weight per tank
Table A3. Mean wet weight in C. lumpus 0-51 dph. The averages (mg larva-1) are shown for individual tanks on each
sampling day, together with respective standard errors (SE) and total number of sampled larvae (Total N).
Dph Group Tank Mean WW ± SE
(mg larva-1) Total
N Dph Group Tank
Mean WW ± SE (mg larva-1)
Total N
2 Yolk sac Hatching
tank 3.24 ± 0.16 16
6
Artemia 1 2 9
5.55 ± 0.54 5.82 ± 0.28 6.30 ± 0.33
5 5 5
21
Artemia 1 2 9
18.78 ± 0.93 20.04 ± 0.85 19.63 ± 0.31
5 5 5
Copepod 3 6
10
5.35 ± 0.26 5.33 ± 0.17 5.38 ± 0.22
5 5 5
Copepod 3 6
10
9.65 ± 0.66 9.35 ± 0.23
12.11 ± 1.23
5 5 5
FD 4 5 7
5.87 ± 0.08 5.75 ± 0.18 5.45 ± 0.18
5 5 5
FD 4 5 7
8.84 ± 0.62 7.17 ± 0.43 9.60 ± 0.70
5 5 5
10
Artemia 1 2 9
8.65 ± 0.17 8.04 ± 0.44 8.37 ± 0.32
5 5 5
24
Artemia 1 2 9
21.86 ± 2.79 19.73 ± 1.27 24.88 ± 1.98
5 5 5
Copepod 3 6
10
7.21 ± 0.36 6.92 ± 0.21 6.35 ± 0.41
5 5 5
Copepod 3 6
10
10.94 ± 1.36 9.17 ± 0.46
11.04 ± 0.51
5 5 5
FD 4 5 7
6.70 ± 0.33 6.89 ± 0.43 6.69 ± 0.37
5 5 5
FD 4 5 7
9.72 ± 0.92 6.77 ± 0.76 9.47 ± 0.64
5 5 5
13
Artemia 1 2 9
9.65 ± 0.46 10.45 ± 0.55 11.61 ± 0.47
5 5 5
29
Artemia 1 2 9
29.26 ± 2.59 30.25 ± 3.97 29.07 ± 2.34
5 5 5
Copepod 3 6
10
7.78 ± 0.18 7.39 ± 0.41 7.30 ± 0.28
5 5 5
Copepod 3 6
10
10.46 ± 2.30 8.54 ± 0.32
13.22 ± 1.84
5 5 5
FD 4 5 7
7.25 ± 0.32 5.93 ± 0.12 7.27 ± 0.35
5 5 5
FD 4 5 7
15.98 ± 0.95 14.42 ± 2.16 15.49 ±1.17
5 5 5
17
Artemia 1 2 9
13.33 ± 0.78 14.64 ± 0.83 14.98 ± 0.90
5 5 5
34
Artemia 1 2 9
44.00 ± 3.86 35.52 ± 2.72 41.47 ±2.01
5 5 5
Copepod 3 6
10
8.87 ± 0.97 9.11 ± 0.31
10.91 ± 0.25
5 5 5
Copepod 3 6
10
14.47 ± 1.39 16.74 ± 2.12 26.91 ± 1.10
5 5 5
FD 4 5 7
7.30 ± 0.42 7.96 ± 0.45 7.39 ± 0.53
5 5 5
FD 4 5 7
21.35 ± 1.51 21.44 ± 1.72 22.00 ± 1.35
5 5 5

Appendices
90
Table A3. Mean wet weight in C. lumpus 0-51 dph (continued). The averages (mg larva-1) are shown for individual tanks
on each sampling day, together with respective standard errors (SE) and total number of sampled larvae (Total N).
Dph Group Tank Mean WW ± SE
(mg larva-1) Total
N Dph Group Tank
Mean WW ± SE (mg larva-1)
Total N
38
Artemia 1 2 9
50.46 ± 2.94 41.07 ± 4.65 43.21 ± 4.54
5 5 5
45
Artemia 1 2 9
84.50 ± 5.17 79.51 ± 5.55 91.08 ± 5.39
10 10 10
Copepod 3 6
10
25.12 ± 2.85 26.70 ± 0.47 31.20 ± 4.59
5 5 5
Copepod 3 6
10
38.20 ± 3.99 46.87 ± 5.06 54.83 ± 5.51
10 10 10
FD 4 5 7
26.83 ± 2.36 31.74 ± 3.98 29.47 ± 1.08
5 5 5
FD 4 5 7
43.53 ± 1.51 42.83 ± 3.80 38.75 ± 4.38
10 10 10
42
Artemia 1 2 9
69.22 ± 6.22 74.04 ± 5.15 78.97 ± 5.87
10 10 10
50
Artemia 1 2 9
90.84 ± 5.85 102.70 ± 3.90
130.62 ± 10.60
10 10 10
Copepod 3 6
10
33.58 ± 3.68 31.22 ± 3.34 38.27 ± 3.55
10 10 10
Copepod 3 6
10
50.97 ± 4.05 56.83 ± 5.60 82.45 ± 6.77
10 10 10
FD 4 5 7
35.22 ± 3.39 43.84 ± 3.09 38.68 ± 2.80
10 10 10
FD 4 5 7
68.38 ± 4.88 66.05 ± 4.16 58.28 ± 5.14
10 10 10

Appendices
91
Appendix 7. Daily weight increase per tank
Table A4. Daily weight increase in C. lumpus 0-51 dph. The values (% day-1) represent daily percentage increase in dry
weight (mg larva-1) for individual tanks during specific time intervals.
Dph interval
Group Tank DWI
(% day-1) Dph
interval Group Tank
DWI (% day-1)
0-2 Yolk sac Hatching
tank -1.44
2-10
Artemia 1 2 9
3.64 3.13 3.43
42-51
Artemia 1 2 9
6.60 6.49
10.02
Copepod 3 6
10
0.03 0.51 0.14
Copepod 3 6
10
7.81 8.17
10.67
FD 4 5 7
-0.07 0.15 0.00
FD 4 5 7
8.48 7.80 7.51
10-21
Artemia 1 2 9
6.34 7.55 7.41
0-21
Artemia 1 2 9
4.55 4.97 5.01
Copepod 3 6
10
1.04 0.89 3.56
Copepod 3 6
10
0.42 0.52 1.76
FD 4 5 7
1.85 -1.67 2.76
FD 4 5 7
0.80 -0.95 1.30
21-34
Artemia 1 2 9
5.97 3.65 4.98
0-51
Artemia 1 2 9
5.71 5.79 6.60
Copepod 3 6
10
3.86 5.27 7.43
Copepod 3 6
10
4.38 4.42 5.08
FD 4 5 7
6.72 10.17 6.14
FD 4 5 7
4.62 4.98 4.72
34-42
Artemia 1 2 9
7.36 10.81 9.69
Copepod 3 6
10
12.30 9.41 4.04
FD 4 5 7
7.20 9.76 8.56

Appendices
92
Appendix 8. Mean standard length per tank
Table A5. Mean standard length in C. lumpus 0-51 dph. The averages (mm) are shown for individual tanks on each
sampling day, together with respective standard errors (SE) and total number of sampled larvae (Total N).
Dph Group Tank Mean SL ± SE
(mm) Total
N Dph Group Tank
Mean SL ± SE (mm)
Total N
2 Yolk sac Hatching
tank 6.4 ± 0.1 16
6
Artemia 1 2 9
7.0 ± 0.1 7.0 ± 0.1 6.9 ± 0.1
5 5 5
21
Artemia 1 2 9
8.3 ± 0.2 8.5 ± 0.1 8.4 ± 0.0
5 5 5
Copepod 3 6
10
6.8 ± 0.1 6.6 ± 0.1 3.4 ± 0.0
5 5 4
Copepod 3 6
10
7.5 ± 0.1 7.5 ± 0.1 7.9 ± 0.2
5 5 5
FD 4 5 7
6.7 ± 0.1 6.7 ± 0.1 6.7 ± 0.1
5 5 5
FD 4 5 7
7.3 ± 0.1 7.0 ± 0.1 7.3 ± 0.1
5 5 5
10
Artemia 1 2 9
7.3 ± 0.0 7.2 ± 0.1 7.2 ± 0.1
5 5 5
24
Artemia 1 2 9
8.8 ± 0.3 8.6 ± 0.2 9.1 ± 0.2
5 5 5
Copepod 3 6
10
7.2 ± 0.1 7.0 ± 0.1 7.0 ± 0.1
5 5 5
Copepod 3 6
10
7.6 ± 0.3 7.2 ± 0.1 7.7 ± 0.1
5 5 5
FD 4 5 7
6.9 ± 0.1 7.0 ± 0.1 6.8 ± 0.1
5 5 5
FD 4 5 7
7.4 ± 0.1 6.7 ± 0.1 7.4 ± 0.1
5 5 5
13
Artemia 1 2 9
7.5 ± 0.1 7.6 ± 0.1 7.8 ± 0.1
5 5 5
29
Artemia 1 2 9
9.5 ± 0.3 9.6 ± 0.4 9.4 ± 0.2
5 5 5
Copepod 3 6
10
7.3 ± 0.1 7.3 ± 0.1 7.3 ± 0.1
5 5 5
Copepod 3 6
10
7.2 ± 0.4 6.9 ± 0.2 7.6 ± 0.2
5 5 5
FD 4 5 7
7.0 ± 0.1 6.7 ± 0.0 7.2 ± 0.1
5 5 5
FD 4 5 7
7.8 ± 0.2 7.6 ± 0.4 7.8 ± 0.2
5 5 5
17
Artemia 1 2 9
8.1 ± 0.1 8.2 ± 0.1 8.3 ± 0.1
5 5 5
34
Artemia 1 2 9
10.6 ± 0.3 9.8 ± 0.3
10.4 ± 0.1
5 5 5
Copepod 3 6
10
7.5 ± 0.2 7.4 ± 0.1 7.6 ± 0.1
5 5 5
Copepod 3 6
10
7.6 ± 0.2 7.9 ± 0.3 9.2 ± 0.1
5 5 5
FD 4 5 7
7.0 ± 0.2 7.3 ± 0.1 7.0 ± 0.1
5 5 5
FD 4 5 7
8.6 ± 0.2 8.5 ± 0.2 8.7 ± 0.2
5 5 5

Appendices
93
Table A5. Mean standard length in C. lumpus 0-51 dph (continued). The averages (mm) are shown for individual tanks
on each sampling day, together with respective standard errors (SE) and total number of sampled larvae (Total N).
Dph Group Tank Mean SL ± SE
(mm) Total
N Dph Group Tank
Mean SL ± SE (mm)
Total N
38
Artemia 1 2 9
11.0 ± 0.2 10.2 ± 0.5 10.5 ± 0.3
5 5 5
45
Artemia 1 2 9
12.7 ± 0.3 12.4 ± 0.3 13.0 ± 0.3
10 10 10
Copepod 3 6
10
9.0 ± 0.4 9.3 ± 0.1 9.6 ± 0.4
5 5 5
Copepod 3 6
10
10.1 ± 0.3 10.6 ± 0.3 11.0 ± 0.3
10 10 10
FD 4 5 7
9.1 ± 0.3 9.7 ± 0.4 9.6 ± 0.1
5 5 5
FD 4 5 7
10.7 ± 0.1 10.6 ± 0.3 10.1 ± 0.4
10 10 10
42
Artemia 1 2 9
12.0 ± 0.3 12.2 ± 0.2 12.4 ± 0.3
10 10 10
50
Artemia 1 2 9
13.0 ± 0.3 13.5 ± 0.2 14.5 ± 0.3
10 10 10
Copepod 3 6
10
9.7 ± 0.4 9.4 ± 0.3
10.2 ± 0.3
10 10 10
Copepod 3 6
10
10.9 ± 0.3 11.3 ± 0.4 11.3 ± 0.3
10 10 10
FD 4 5 7
9.9 ± 0.4 10.7 ± 0.2 10.3 ± 0.3
10 10 10
FD 4 5 7
11.9 ± 0.2 12.1 ± 0.2 11.4 ± 0.3
10 10 10

Appendices
94
Appendix 9. Number of larvae per tank
Table A6. Number of C. lumpus larvae 0-51 dph. Estimated number of larvae alive per tank on each day of the start feeding experiment. The estimates are based on number of sampled larvae, registered mortality and remaining larvae 51 dph.
Dph Artemia Copepod FD
Tank 1 Tank 2 Tank 9 Tank 3 Tank 6 Tank 10 Tank 4 Tank 5 Tank 7
0 1 2 3 4 5 6 7 8 9
10 11 12 13 14 15 16 17 18 19 20 21 22 23 24 25 26 27 28 29 30 31 32 33 34 35 36 37 38 39 40 41 42 43 44 45 46 47 48 49 50 51
7531 7531 7531 7531 7508 7506 7504 7502 7502 7502 7502 7502 7502 7502 7502 7502 7501 7500 7499 7499 7498 7497 7495 7495 7495 7495 7491 7490 7486 7482 7479 7474 7469 7466 7464 7462 7461 7460 7457 7451 7448 7445 7433 7421 7417 7417 7415 7415 7414 7376 7373 7373
6491 6491 6491 6491 6480 6480 6477 6476 6476 6476 6476 6476 6476 6476 6476 6475 6474 6473 6471 6471 6471 6470 6467 6465 6463 6462 6460 6459 6455 6452 6450 6447 6446 6442 6441 6438 6437 6435 6434 6431 6428 6422 6421 6407 6404 6394 6384 6384 6383 6279 6279 6279
5625 5625 5625 5625 5621 5609 5605 5604 5604 5604 5603 5603 5603 5603 5602 5602 5602 5602 5600 5600 5600 5597 5597 5597 5597 5594 5594 5592 5590 5589 5588 5567 5565 5556 5554 5552 5547 5545 5537 5528 5523 5519 5509 5491 5484 5483 5472 5472 5470 5449 5449 5449
6956 6956 6956 6956 6944 6943 6937 6937 6937 6937 6937 6936 6936 6936 6936 6936 6936 6936 6936 6936 6936 6934 6932 6932 6931 6928 6926 6922 6919 6910 6885 6816 6737 6468 6433 6317 6223 6186 6170 6149 6134 6114 6090 6064 6052 6033 6018 5991 5963 5869 5865 5865
7725 7725 7725 7725 7722 7717 7717 7717 7717 7717 7717 7717 7717 7717 7717 7716 7716 7716 7715 7715 7715 7715 7713 7713 7709 7709 7707 7696 7683 7664 7634 7532 7474 7059 7034 6970 6948 6931 6905 6891 6871 6866 6853 6847 6841 6831 6824 6822 6813 6796 6784 6784
5431 5431 5431 5431 5430 5430 5426 5425 5425 5425 5425 5425 5425 5425 5423 5422 5422 5422 5421 5421 5421 5421 5419 5382 5367 5349 5317 5298 5256 5186 5139 4923 4581 3742 3627 3553 3526 3509 3496 3488 3481 3478 3477 3474 3470 3467 3463 3460 3458 3453 3453 3453
6459 6459 6459 6459 6450 6450 6438 6435 6435 6435 6435 6435 6435 6435 6435 6435 6435 6435 6435 6431 6428 6424 6423 6422 6417 6412 6399 6334 6257 6190 6117 5917 5884 5848 5821 5795 5786 5776 5763 5749 5745 5725 5709 5699 5691 5678 5673 5552 5004 4924 4907 4907
6602 6602 6602 6602 6580 6579 6576 6574 6574 6574 6574 6574 6574 6574 6574 6573 6573 6573 6566 6562 6558 6555 6539 6533 6516 6512 6479 6382 6150 6027 5953 5874 5802 5707 5648 5604 5583 5567 5542 5523 5513 5498 5484 5467 5460 5452 5445 5442 5433 5421 5407 5407
6439 6439 6439 6439 6431 6407 6404 6402 6402 6400 6400 6400 6400 6400 6400 6400 6399 6399 6396 6393 6392 6390 6375 6375 6371 6371 6363 6337 6307 6225 6179 6065 6026 5920 5909 5886 5878 5876 5871 5867 5862 5859 5852 5844 5835 5834 5828 5827 5818 5813 5808 5808

Appendices
95
Appendix 10. Histological analyses: Liver, stomach and gut
Table A7. Mean hepatocyte nucleus and cell area size in C. lumpus 0-50 dph. Average hepatocyte nucleus area size (µm2)
and estimated hepatocyte cell area size (µm2) is shown per treatment on each sampling day, together with respective
standard errors (SE) and total number of sampled larvae (Total N).
Table A8. Mean stomach epithelium height in C. lumpus 0-50 dph. Average stomach epithelium height (µm) is shown
per treatment on each sampling day, together with respective standard errors (SE) and total number of sampled larvae
(Total N). Abbreviations: SEH = stomach epithelium height.
Dph Treatment Mean area size ± SE (µm²)
Total N
Nucleus Cell
0 Yolk sac 35.1 ± 1.5 558.0 ± 8.0 5
10
Artemia
Copepod
FD
39.5 ± 0.7
34.1 ± 1.1
30.8 ± 0.8
759.3 ± 22.0
569.4 ± 16.7
473.0 ± 8.5
5
5
5
21
Artemia
Copepod
FD
39.9 ± 1.2
31.9 ± 0.9
37.0 ± 2.0
868.8 ± 23.8
527.2 ± 6.3
837.5 ± 49.5
5
5
5
34
Artemia
Copepod
FD
46.7 ± 1.0
41.0 ± 1.2
43.4 ± 1.4
799.7 ± 13.4
693.1 ± 12.4
765.2 ± 20.0
5
5
5
42
Artemia
Copepod
FD
46.6 ± 2.7
45.3 ± 2.5
40.8 ± 1.2
1167.3 ± 233.5
951.5 ± 32.7
822.2 ± 24.8
5
5
5
50
Artemia
Copepod
FD
41.6 ± 1.0
40.2 ± 1.0
41.5 ± 0.7
1090.4 ± 31.3
846.5 ± 26.2
999.9 ± 8.3
5
5
5
Dph Treatment Mean SEH ± SE
(µm) Total N Dph Treatment
Mean SEH ± SE
(µm) Total N
0 Yolk sac - 5 34
Artemia
Copepod
FD
21.3 ± 1.0
19.0 ± 0.6
19.2 ± 0.2
5
5
5
10
Artemia
Copepod
FD
19.1 ± 0.2
18.8 ± 0.2
19.5 ± 0.3
5
5
5
42
Artemia
Copepod
FD
28.5 ± 0.8
25.8 ± 0.5
22.3 ± 1.0
5
5
5
21
Artemia
Copepod
FD
20.5 ± 0.7
17.2 ± 0.8
19.0 ± 1.2
5
5
5
50
Artemia
Copepod
FD
32.1 ± 0.4
25.2 ± 1.5
27.9 ± 0.6
5
5
5

Appendices
96
Table A9. Mean gut epithelium, microvillus and villus height in C. lumpus 0-50 dph. Average gut epithelium height (µm),
microvillus height (µm) and villus height (µm) is shown for the midgut (S/Mg) and hindgut (Hg) sections per treatment
on each sampling day, together with respective standard errors (SE) and total number of sampled larvae (Total N).
Abbreviations: GEH = gut epithelium height, MVH = microvillus height, VH = villus height.
Dph Treatment Mean GEH ± SE (µm) Mean MVH ± SE (µm) Mean VH ± SE (µm)
Total N
S/Mg Hg S/Mg Hg S/Mg Hg
0 Yolk sac 29.9 ± 1.3 25.2 ± 0.7 1.5 ± 0.1 1.8 ± 0.1 81 ± 5 71 ± 1 5
10
Artemia
Copepod
FD
40.8 ± 0.6
37.3 ± 0.7
32.7 ± 0.4
35.3 ± 1.1
33.8 ± 1.5
31.4 ± 0.8
2.5 ± 0.1
2.5 ± 0.1
2.1 ± 0.1
2.5 ± 0.0
2.4 ± 0.0
2.4 ± 0.1
104 ± 2
94 ± 2
94 ± 5
93 ± 3
100 ± 1
87 ± 1
5
5
5
21
Artemia
Copepod
FD
43.7 ± 0.8
32.8 ± 0.8
29.3 ± 3.1
41.0 ± 0.8
32.2 ± 1.3
35.0 ± 0.9
3.2 ± 0.2
3.2 ± 0.1
3.2 ± 0.1
3.1 ± 0.1
2.8 ± 0.1
2.7 ± 0.1
128 ± 4
99 ± 8
82 ± 11
119 ± 3
83 ± 10
113 ± 6
5
5
5
34
Artemia
Copepod
FD
42.2 ± 0.6
39.3 ± 0.9
42.2 ± 0.7
42.2 ± 1.2
41.0 ± 2.2
42.3 ± 0.6
4.3 ± 0.1
4.1 ± 0.1
3.9 ± 0.2
3.7 ± 0.2
3.4 ± 0.3
3.3 ± 0.3
14 ± 0 8
114 ± 6
130 ± 4
146 ± 11
124 ± 9
144 ± 5
5
5
5
42
Artemia
Copepod
FD
44.4 ± 0.6
44.3 ± 0.7
42.4 ± 0.4
42.8 ± 1.4
39.5 ± 1.7
37.3 ± 1.3
4.9 ± 0.2
5.2 ± 0.3
4.4 ± 0.2
3.8 ± 0.1
3.5 ± 0.1
3.7 ± 0.2
171 ± 11
164 ± 3
163 ± 11
153 ± 7
154 ± 2
146 ± 8
5
5
5
50
Artemia
Copepod
FD
46.0 ± 1.6
42.0 ± 0.8
45.8 ± 0.5
43.6 ± 0.4
39.5 ± 1.0
41.3 ± 0.9
5.3 ± 0.1
4.9 ± 0.1
4.7 ± 0.2
3.8 ± 0.2
3.3 ±0.1
3.5 ± 0.1
211 ± 16
192 ± 18
197 ± 7
176 ± 5
149 ± 17
149 ± 3
5
5
5