Ontario's Private Schools: Who Chooses Them and Why?
34
Ontario’s Private Schools: Who Chooses Them and Why? by Deani A. Van Pelt, Patricia A. Allison, and Derek J. Allison Contents Executive Summary .............................................. 3 Introduction: Growth in Private Education .............................. 6 Approach to Inquiry .............................................. 11 Characteristics of Private Schools ..................................... 12 Characteristics of Private School Families ............................... 14 Parental Reasons for Choosing Private Schools .......................... 23 Private Schools as “Effective Schools” .................................. 27 Conclusions ..................................................... 30 References ..................................................... 32 Acknowledgements ............................................... 33 About the Authors................................................. 34 May 2007 A FRASER INSTITUTE OCCASIONAL PAPER
Transcript of Ontario's Private Schools: Who Chooses Them and Why?

Ontario’s Private Schools:Who Chooses Them and Why?
by Deani A. Van Pelt, Patricia A. Allison, and Derek J. Allison
Contents
Executive Summary . . . . . . . . . . . . . . . . . . . . . . . . . . . . . . . . . . . . . . . . . . . . . . 3
Introduction: Growth in Private Education . . . . . . . . . . . . . . . . . . . . . . . . . . . . . . 6
Approach to Inquiry . . . . . . . . . . . . . . . . . . . . . . . . . . . . . . . . . . . . . . . . . . . . . . 11
Characteristics of Private Schools . . . . . . . . . . . . . . . . . . . . . . . . . . . . . . . . . . . . . 12
Characteristics of Private School Families . . . . . . . . . . . . . . . . . . . . . . . . . . . . . . . 14
Parental Reasons for Choosing Private Schools . . . . . . . . . . . . . . . . . . . . . . . . . . 23
Private Schools as “Effective Schools” . . . . . . . . . . . . . . . . . . . . . . . . . . . . . . . . . . 27
Conclusions . . . . . . . . . . . . . . . . . . . . . . . . . . . . . . . . . . . . . . . . . . . . . . . . . . . . . 30
References . . . . . . . . . . . . . . . . . . . . . . . . . . . . . . . . . . . . . . . . . . . . . . . . . . . . . 32
Acknowledgements . . . . . . . . . . . . . . . . . . . . . . . . . . . . . . . . . . . . . . . . . . . . . . . 33
About the Authors. . . . . . . . . . . . . . . . . . . . . . . . . . . . . . . . . . . . . . . . . . . . . . . . . 34
May 2007
A FRASER INSTITUTE OCCASIONAL PAPER
Studies in Education Policy are published periodically
throughout the year by The Fraser Institute, Vancouver,
B.C., Canada.
Our vision is a free and prosperous world where indi-
viduals benefit from greater choice, competitive mar-
kets, and personal responsibility. Our mission is to
measure, study, and communicate the impact of com-
petitive markets and government interventions on the
welfare of individuals.
Founded in 1974, we are an independent research and
educational organization with offices in Vancouver,
Calgary, and Toronto, and international partners in
over 70 countries. Our work is financed by tax-deduct-
ible contributions from thousands of individuals, orga-
nizations, and foundations. In order to protect its
independence, the Institute does not accept grants
from government or contracts for research.
Mailing address: The Fraser Institute, 4th Floor, 1770
Burrard St., Vancouver, BC, Canada V6J 3G7
Media: For media enquiries, please contact our com-
munications department by telephone at 604.714.4582
or by e-mail at [email protected].
Ordering publications: For information about order-
ing The Fraser Institute’s printed publications, please
contact the book sales coordinator by e-mai at
[email protected]; by telephone at 604.688.0221
ext. 580 or, toll free, 1.800.665.3558 ext. 580; or by fax
at 604.688.8539.
Copyright 8 2007 The Fraser Institute. All rights re-
served. No part of this monograph may be reproduced
in any manner whatsoever without written permission
except in the case of brief quotations in critical articles
and reviews.
The authors of this study have worked independently
and opinions expressed by them are, therefore, their
own, and do not necessarily reflect the opinions of the
members or trustees of The Fraser Institute.
Editing, design, & typesetting: Kristin McCahon and
Lindsey Thomas Martin
Printed and bound in Canada.
ISSN 1492-1863—Print version/
ISSN 1707-2395—On-line version
Date of issue: May 2007
The Fraser Institute, 4th Floor, 1770 Burrard Street, Vancouver, B.C., V6J 3G7
For find out how you can support The Fraser Institute, please contact the Development department:
in Vancouver
� via telephone at (604) 688-0221, ext. 586; via fax: (604) 688-8539
� via e-mail: [email protected]
in Calgary
� via telephone at (403) 216-7175 or, toll-free at 1-866-716-7175
� via fax: (403) 234-9010
in Toronto
� via telephone: (416) 363-6575, via fax: (416) 934-1639
Executive Summary
Private school attendance in Ontario has grown
over recent decades from 1.9 percent of the stu-
dent population in 1960 to 5.6 percent in 2006. What
are the characteristics of private schools? Why are par-
ents increasingly choosing them over public schools?
What kinds of parents are choosing them for their chil-
dren? This study is the most recent and comprehensive
attempt by researchers to document the characteristics
of private schools and the characteristics and motiva-
tions of Ontario parents of private school students.
Our study is based on a survey of parents (from 919
households) whose children attend private schools in
Ontario. We considered two major groups of private
schools: academically- or pedagogically- defined day
schools (ADS) and religiously-defined day schools
(RDS), schools which together served over 107,000
students in 2005-2006, or almost 90 percent of Ontario
private school students. We did not include schools
with a more specialized mandate: those specifically for
special needs students (11%), schools that cater almost
exclusively to international students, or publicly
funded First Nations schools.
Private School Characteristics
• Mission: All of the schools saw their mission as be-
ing the provision of a superior education.
• Size: The schools range in size from a reli-
giously-defined school enrolling 24 students to an
academically-defined school enrolling just over
1500 students.
• Governance: The majority of the schools (70%),
including all of the religiously-defined schools, are
non-profit schools governed by elected boards, al-
though a few of the religiously-defined schools are
run directly by churches or other religious organi-
zations.
Characteristics of Ontario’s Private
School Families
Our parent survey identified several differences be-
tween the average parent of private school children,
and the average Ontario parent with school aged chil-
dren, as reported in the 2001 census and in a 2003 Sta-
tistics Canada social survey.
• Higher levels of parental education:
� While a little over a third of the comparable
adult population had attended university,
three-quarters of private school parents had.
• Higher status occupations and more
self-employment:
� Private school parents tend to be twice as likely
(49%) as other parents with school aged chil-
dren to be employed in management, health or
teaching, and only half as likely to work in con-
struction, trades, transport, manufacturing or
as labourers.
� Of those that reported lower status occupations
almost all (89%) were parents who send their
children to religiously-defined schools.
� Fully 40 percent of private school families iden-
tified self-employment as a major source of in-
come, while only 7 percent of comparison
families did so.
• Wide variety of household incomes:
� Almost half of private school households sur-
veyed reported incomes over $120,000,
whereas only a quarter of comparable census
The Fraser Institute 3 Ontario’s Private Schools

families report similar (inflation adjusted an-
nual) incomes.
� Even so, 21 percent the private school families
reported annual incomes below $50,000, com-
pared to 37 percent of comparison families.
� Parents choosing religiously-defined schools re-
ported notably lower income levels than those
choosing academically-defined schools
• Civic participation:
� Parents choosing private schools are more
likely to vote in federal (98% vs. 61%), provin-
cial (93% vs. 59%), and municipal (82% vs.
49%) elections than other Ontario parents with
school aged children.
� Private school parents are three times as likely
to be members of a political party (9% vs. 3%,
respectively).
� They are almost equally likely to be involved in
local sporting, cultural, or hobby organizations;
� They are less likely to be involved in a union or
professional association (20% vs. 27%, respec-
tively).
• Importance of religion:
� Fully 90 percent of private school parents (of
both academically-defined and religiously-de-
fined schools) say their religious or spiritual be-
liefs are important or very important to the way
they lead their lives, compared to 75 percent of
the Ontario parents of school aged children re-
sponding to the 2003 social survey.
Reasons for Choosing Private
Schools
Disappointment with the public system:
• Disappointment with public or separate schools
was a factor in choosing their private school for 94
percent of surveyed parents. 75 percent said this
disappointment was a very important factor in
their choice.
Various features of private schools were positive rea-
sons for choosing private schools:
• Dedication of the teachers, emphasis on academic
quality, and safety were rated as very important
features of their private schools by almost all par-
ents.
• Parents who chose religiously-defined schools fre-
quently rated features concerned with morals, val-
ues, religion, family and character development as
being very important to them.
• Parents who chose academically-defined schools
consistently rated as highly important the quality
of the teachers and classroom instruction, individ-
ualized attention, and a motivating, supportive,
nurturing educational environment that instilled
confidence and independence in the students.
• Parents in religiously-defined schools were much
less concerned about class size and individualized
attention than parents choosing academically-de-
fined schools, but they were significantly more in-
terested in relational and identity opportunities
offered by the school community.
Experience in Private Schools
Parents were also asked to indicate the extent to which
various features were present in the private school of
their choice.
• The majority of all parents strongly agree their pri-
vate school has the following characteristics:
� safe (ADS 71%; RDS 74%),
� dedicated teachers (ADS 71%; RDS 73%),
� emphasizes academic quality (ADS 66%; RDS
66%),
� educates the whole child (ADS 63%; RDS
63%),
� and develops student character (ADS 61%;
RDS 62%).
• Parents at academically-defined schools strongly
agree that their school has:
Ontario’s Private Schools 4 The Fraser Institute
STUDIES IN EDUCATION POLICY, MAY 2007

� a good reputation (64%),
� offers unique opportunities (64%),
� and is motivating, supportive and nurturing
(62%).
• Parents at religiously-defined schools strongly agree
that their school:
� reinforced their religion (80%),
� taught right from wrong (78%) ,
� supported family values (74%),
� and valued parent-teacher collaboration (67%).
Parallels with
“Most Effective”
Public Schools
Our analysis found unanticipated but extensive paral-
lels between the characteristics of private schools iden-
tified by parents and the characteristics of effective
public schools identified in earlier research of the 1970s
and 1980s. These characteristics include:
• strong leadership,
• clear goals,
• parent-teacher collaboration,
• flexibility,
• responsiveness,
• high expectations,
• and good discipline.
Parents seem to be attracted to schools with these fea-
tures of effectiveness.
Conclusion
While parents choosing private schools for their chil-
dren tend, on average, to be better educated, employed
in higher status occupations, and display more indica-
tors of civic participation than their peers who opt for
state schools for their children, this study concludes that
parents from all income, occupational, and educational
groups do indeed send their children to private schools
in Ontario and find value in the education they offer.
The Fraser Institute 5 Ontario’s Private Schools
STUDIES IN EDUCATION POLICY, MAY 2007

Introduction: Growth inPrivate Education
More and more Ontario parents have been
choosing private schools for their children.
Fewer than 2 percent of Ontario students attended pri-
vate schools in 1960. Statistics currently available on
the Ontario Ministry of Education web site show that
this had risen to 5.3 percent by 2003. What’s more, pri-
vate sector growth has accelerated in recent decades.
As figure 1 illustrates, while enrolment trends in public
schools have remained fairly stable, enrolments in pri-
vate schools doubled between 1960 and 1975 and more
than doubled again by the turn of the century. Why
should this be? More specifically, what features of pri-
vate schools are attracting parents away from public
schools? And what kinds of parents choose private
schools? Is it the case, as some critics contend, that pri-
vate schools are only for rich, privileged parents who are
outside of the Canadian social mainstream? The an-
swers given in this paper are based on responses from a
2006 survey of more than 1,800 parents with children in
38 randomly selected private schools across Ontario.
Public Policy Regarding
School Choice
Each Canadian province has evolved its own policies
toward private schools. Most provide some form of fi-
nancial support, but this always comes with strings at-
tached. To qualify for public monies private schools are
typically required to comply with strategically impor-
tant standards, such as conformity to provincial curric-
ulum and employment of provincially certified
teachers, with the amount of financial support typically
varying with the extent of compliance. The latest avail-
able Canadian reports indicate growth in private
schooling nationally. “In 1998/99, one out of ev-
ery 18 children in Canada, or 5.6 percent, attended a
private school for elementary or secondary education.
In total, 298,000 were enrolled in private schools; just
under 5 million went to public schools” (Statistics Can-
ada, 2001, p. 1) and “in the 1999/2000 school year,
public school enrolment accounted for 93 percent of
the total enrolment compared with 6 percent for pri-
vate schools” (Statistics Canada, 2006a, p. 1).
Ontario is unique among Canadian provinces in that it
neither provides direct financial support for private
schools nor imposes any conditions on their establish-
ment. Consequently, Ontario has Canada’s least regu-
lated market for school choice which offers parents a
rich variety of alternatives. This makes the province
ideal for studying the dynamics of school choice.
Ontario also offers a variety of publicly governed and
funded educational options across and within its Eng-
lish Public, English Roman Catholic Separate, French
Public, and French Roman Catholic Separate district
boards, although various eligibility requirements apply.
While more than 2.1 million students attended pub-
licly funded and governed schools in 2004-2005, 32
percent of these Ontario students attended Roman
Catholic Separate schools, more specifically: 33 per-
cent attended elementary Roman Catholic Separate
schools, and 30 percent secondary Roman Catholic
Separate schools (Ontario Ministry of Education,
2005a). French immersion programs are widely avail-
able within English language boards, while some larger
boards operate various kinds of specialized schools such
as bilingual schools, schools dedicated to self-directed
learning in multi-age, multi-generational settings, aca-
demically rigorous schools boasting strong community
Ontario’s Private Schools 6 The Fraser Institute

connections, schools dedicated to year-round pro-
gramming, schools that offer a life skills and coopera-
tive education focus, and schools that promise small
class sizes and university level courses (see the Toronto
District School Board (2006) and the Ottawa Carleton
District School Board (2006)). Taken together, these
alternatives, which have multiplied in recent years,
provide a respectable degree of regulated school choice
within the public sector. Even so, increasing numbers
of parents continue to choose private over public
schools. In 2004, Ontario Premier Dalton McGuinty
pointed to one obvious reason when he recently de-
clared “We’ve let public education slide to the point
where the number of stories about our schools’ suc-
cesses have been overwhelmed by others—about
crumbling morale and schools, lost programs, and end-
less bickering” (22 April 2004, par. 21-29). Yet erosion
of confidence in the “free” public schools cannot by it-
self explain the growing preference for fee-charging pri-
vate schools. Parents must weigh anticipated financial
costs against the marginal value offered by the pre-
ferred private school, balancing anticipated benefits
against costs, both financial and otherwise.
Rationale for this study
Developing an informed understanding of Ontario par-
ents’ growing preference for private schools has impor-
tant policy ramifications for public schools if they are to
compete effectively—to, in effect, retain their market
share. It may also bear broader public policy implica-
tions by uncovering limits to the ability of public
schools to satisfy expectations of today’s parents. Here,
as in the broader analysis of school choice, the situation
of the parents themselves is important. It is not suffi-
cient to understand what parents find attractive about
The Fraser Institute 7 Ontario’s Private Schools
STUDIES IN EDUCATION POLICY, MAY 2007
0.0
0.5
1.0
1.5
2.0
2.5
3.0
3.5
4.0
4.5
5.0
1960 1964 1968 1972 1976 1980 1984 1988 1992 1996 2000 2004
Public
Private
1960
=1.
0Figure 1: Trends in Numbers of Public and Private School Students
Enrolled in Ontario Schools, 1960 to 2004
(1960 = base year)
Note: Public enrolments include Roman Catholic separate school students. The marked drop in private school enrolments
in the mid-1980s is attributable to the extension of “full funding” to senior grades in Roman Catholic secondary schools,
which brought them into the public sector.
Source: Ontario Ministry of Education statistics compiled by Neibert (2006), supplemented with more recent statistics
from the Ministry web site (http://www.edu.gov.on.ca/eng/general/elemsec/quickfacts/2004-05/quickFacts04-05.pdf).

private schools; we need an understanding of who
those parents are, so as to better appreciate how their
circumstances influence their choices. But before we
can attempt this we need some appreciation of the
choices available.
The market
One of the few legislated requirements for private
schools in Ontario is annual registration with the Min-
istry of Education (see Education Act, R.S.O., c. E2, s.
16). The registration form is short and simple: schools
are asked to provide name, enrolment, contact infor-
mation, and to identify any affiliations. Returns are
used to maintain a list on a website of all registered pri-
vate schools in Ontario (Ontario Ministry of Educa-
tion, 2005b). We began our study by using declared
affiliations to classify the 869 schools on the December
2005 list into the six types shown in table 1, using
school enrolment figures obtained directly from the
Ministry of Education. Unfortunately, data were not
available for all schools, and in such cases, and when
other uncertainties arose, we sought additional infor-
mation from school websites, affiliation membership
lists and, on occasion, through direct contact with
schools. Even so, it proved impossible to find further in-
formation on almost six percent of the schools and they
remain unclassified in table 1. For the most part these
schools appear to be very small, unaffiliated with any
other school or organization, unique in their philoso-
phy and/or clientele, and protective of their privacy.
We used our additional information to adjust the data
originally obtained from the Ministry. As a result of
these adjustments, our final enrolment estimate of
128,299, as shown in table 1, is larger than the total pri-
vate school enrolment number currently available on
the Ministry web site.
Although they appear on the Ministry list, two types of
school included in table 1 are not part of the private
school market in Ontario. First Nations Schools are
funded by federal transfers and enrolment is limited to
a specific population, while international schools com-
pete exclusively, or very nearly exclusively, for
off-shore, rather than Ontario, students. Once these
schools are excluded, the private school market in On-
tario as of December 2005 consisted of 791 schools or,
as shown in table 1, 741 when we ignore those for
whom we were unable to find information. We as-
signed each of these schools to one of the following
three types:
Academically-defined schools, of which there are more
than 250, are those which either pursue key tenets of a
traditional liberal arts education or subscribe to a re-
lated pedagogic philosophy, such as the Montessori or
Waldorf method. While not all academically-defined
schools (ADS) are affiliated with the Conference of In-
dependent Schools (CIS), those that are can be viewed
as conforming to stereotypical images of traditional,
elite, private schools, although not all of these schools
welcome such a characterization. All CIS affiliated
schools must nonetheless satisfy demanding qualifica-
tion requirements before being admitted to the Con-
ference, which include oversight by an arm’s length
Board of Governors and non-profit status. Ontario’s
academically-defined schools also include at least seven
bilingual/immersion schools, at least twenty entrepre-
neurial for-profit ventures, and one military school.
Religiously-defined schools are those which have a de-
clared religious or denominational affiliation. This does
not necessarily mean that they exist primarily to teach
a religious doctrine. To the contrary, some of the more
than 400 schools in this group offer academic programs
which are more comprehensive and demanding than
can be found in some schools in the academically-de-
fined group. Similarly, some provide accommodation
for exceptional pupils and other special programming.
Yet regardless of specific programming and pedagogy,
schools in this group are distinguished from others by
commitment to a declared religious affiliation or orien-
tation. While the vast majority of religiously-defined
schools (RDS) are not directly operated by a specific
church, mosque, or synagogue, these schools, in some
way, are defined by a religious perspective. A large ma-
jority of these schools, 80 percent, are Christian, with a
wide range of denominations being represented includ-
Ontario’s Private Schools 8 The Fraser Institute
STUDIES IN EDUCATION POLICY, MAY 2007

ing Adventist (9), Amish (22), Baptist (4),
Christadelphian (1), Jewish (43), Lutheran (4), Men-
nonite (78), and, perhaps surprisingly given Ontario’s
separate schools, Roman Catholic (18). Others, such
as those schools affiliated with the Ontario Alliance of
Christian Schools (67) and the Association of Chris-
tian Schools International (62), serve interdenomina-
tional Christian sectors. Jewish schools have long been
a part of Ontario’s private school sector, the oldest
having been founded in 1907. In contrast, the 37 Is-
lamic and the sole Sikh school were all established
within the past fifteen years.
The Fraser Institute 9 Ontario’s Private Schools
STUDIES IN EDUCATION POLICY, MAY 2007
Table 1: Ontario Private Schools, 2005-2006
Type Schools Details Founded* Students
Min Mean Max Total*
Academically-
Defined
253 CIS 42 1829-2003 15 461 1260 50,075
Montessori 115 1961-2000 6 158 1486
Waldorf 10 1926-2005 29 134 427
Other 86 — 6 145 1514
Religiously-
Defined
410 Christian 329 1852-2004 6 198 1243 57,366
Islamic 37 1992-2002 12 147 358
Jewish 43 1907-1995 8 316 1446
Sikh 1 — — 187 —
Special 78 Adult 1 2004 — 50 —
Ballet 2 1959 50 95 140 5,246
Cooperative 2 1975-2003 — 50 —
Cultural 7 1973-2000 27 160 455
On line 5 1999 22 44 50
Special needs 36 1989-2002 6 43 284
Summer 6 1922-2001 — 125 —
Tutoring 3 1997 15 77 125
Other 16 1970-2003 6 60 123
First Nation 34 7 161 730 5,436
International 44 11 224 1285 7,753
Unknown 50 6 48 283 2,423
TOTAL 869 6 148 1514 128,299
*Please note that these data are incomplete: not all schools provide founding dates in their information and
some enrolment figures are estimates.
Source: Derived from data obtained directly from the Ministry of Education, adjusted by data obtained from in-
dividual schools and, where necessary, estimates.

Special schools, of which there are at least 75, serve stu-
dents with quite specific needs or interests. Half of the
schools in this group cater to exceptional students,
with some offering general special education programs
(8) but most being dedicated to more specific needs,
such as learning disabilities (17), autism (5), giftedness
(4), or behavioural issues (2). Others address some-
thing specific such as summer outdoor education or
parent co-operative education.
As summarized in the enrolment column of table 1,
Ontario private schools exhibit considerable variation
in enrolment, ranging from a minimum of only six pu-
pils to 1,500. Overall, academically-defined schools
have an average enrolment of 198, religiously-defined
schools 140, and special schools 66. Larger schools typ-
ically offer classes across the full range of grades from
kindergarten to secondary level, or specialize in the
higher and middle grades. Many religiously-defined
schools do not offer secondary level programs, but
there are some notable exceptions. The enrolment
base of six pupils is an artifact of the Ontario Education
Act which defines a private school as an institution
providing instruction for “five or more pupils” (§1). In
consequence, private educational establishments with
fewer pupils need not be registered. Similarly, parents
who choose to homeschool their children do not have
to register with the Ministry, although according to a
directive to school boards (Ontario Ministry of
Ecucation, 2002), there is an expectation that they
should inform the local school board of their intentions
and provide some basic demographic information
about their children. Informed estimates place the
number of children currently being educated at home
in Ontario at close to 2 percent of Ontario’s school
aged children, that is, about 20,000 in total (Ontario
Federation of Teaching Parents, 2006).
While we believe that the three types of private schools
discussed above are readily recognizable, the concep-
tual boundaries between the three groups can become
less clear when attempting to classify specific schools.
Some of the academically-defined schools, for exam-
ple, have religious names, and some were originally
founded as religious schools, typically Anglican. How-
ever, while some still boast chapels and hold religious
services, their mission and culture are no longer de-
fined by their original faith and they are more properly
placed within the ADS category. There is a further
classification issue that needs to be mentioned to avoid
confusion with the studies undertaken by Davies and
Quirke (2005b, p. 528). Their “third sector” explicitly
includes schools subscribing to particular education
philosophies, such as Montessori and Waldorf. More-
over, their “first sector” academic category is limited to
CIS schools. In short, while both our approach and that
taken by Davies and Quirke recognize three types of
private schools, our first (academically-defined
schools) and third (special schools) categories do not
match theirs.
There were 50 schools in our original list which re-
mained unidentified due to lack of data, and when
these were eliminated along with the First Nations and
International schools, 741 registered private schools
remained, as of December 2005. Of these, we classified
253 (34%) as academically-defined, 410 (55%) as reli-
giously-defined, and 78 (11%) as catering to special
needs or expectations.
Ontario’s Private Schools 10 The Fraser Institute
STUDIES IN EDUCATION POLICY, MAY 2007
Approach to Inquiry
Our objective was to develop profiles of a random
sample of Ontario private schools and the par-
ents that had chosen them, with specific attention to
the features which attracted parents. We decided to
exclude the 78 Special schools as these appeal to spe-
cific expectations outside of the main private school
market. Further, schools in this group have been stud-
ied extensively by Davies and Quirke (2005a and
2005b), while the special education schools that make
up almost half of this group have been recently re-
viewed by Hepburn and Morzek (2004). In contrast,
the majority mainstream academically-defined and re-
ligiously-defined schools have attracted relatively lit-
tle research attention.
We proceeded by randomly selecting schools in each of
the academically-defined and religiously-defined
groups until we reached an estimated 1,000 families per
group. Each randomly selected school was contacted
and invited to participate in the study. If the Head of
school or governing agency, as appropriate, agreed,
parent questionnaires, up to a cap of 120, were deliv-
ered to the school for completion by willing parents.
Heads of participating schools were also asked to com-
plete a brief telephone interview to provide informa-
tion about school organization and operation. When a
school declined to participate, the next school on the
list of randomly selected schools in that group was ap-
proached. Ultimately, we approached 112 schools of
which 53 agreed to participate. A total of 4,400 parent
questionnaires were delivered to those schools.
We received 919 completed parent questionnaires
from 38 schools1: 523 (57%) from schools in the reli-
giously-defined group and 396 (43%) from schools in
the academically-defined sector. Within the reli-
giously-defined group a substantial majority (93%) of
our responses were from Christian schools, five percent
from parents with children enrolled in Islamic schools,
and two percent from parents with children enrolled in
a Jewish school. The Christian schools included four
Mennonite, three Amish, three Roman Catholic, and
one Lutheran; the remaining twelve being affiliated
with various Protestant organizations, including seven
who were members of the Ontario Association of
Christian Schools. Within the academically-defined
group, 175 (19%) responses were from CIS schools,
137 (15%) from academic-for-profit schools, and 84
(9%) from Montessori schools. These distributions
closely mirror provincial patterns as shown in table 1.
The Fraser Institute 11 Ontario’s Private Schools
1 The questionnaires collected data on a total of 1,801 parents in these families. A sample of this size is accurate within 2.3 percent 95 times
out of 100.
Characteristics of PrivateSchools
The schools represented in this study typify the
wide variety of choices within Ontario’s private
school market. They ranged in size from a Mennonite
school enrolling 24 students to an academically-de-
fined for-profit school enrolling just over 1500 students.
More than half of the schools (61%) offered only ele-
mentary programs; five (10%) offered only secondary
programs. The oldest school, an elementary CIS school,
was founded in 1918; the newest, an academically-de-
fined for-profit school offering only secondary credits,
was founded in 2003. Most of the schools (70%), in-
cluding all of the religiously-defined schools, are
non-profit schools governed by boards, although a few
are run directly by the church or mosque to which they
are attached. Religiously-defined schools typically
make stipulations regarding religious observance, ac-
cepting students from outside their community only if
the family agrees to appropriate conditions.
Premises
The schools operate in a wide range of buildings from
elaborate and elegant special-purpose structures to
church halls or rented commercial space. The older
schools were usually accommodated in designated
school buildings, while newer schools were more
likely to be located in rented space. Atypically, one re-
ligiously-defined school opened only a few years ago in
a large custom-built building. Almost all of the partic-
ipating schools reported having good playground
and/or playing field facilities: one academically-de-
fined school was described as being located on
“thirty-seven acres, with a thirteen acre wood lot, de-
signed with paths, three playing fields, four tennis
courts and a river.”
Staffing
The teaching and support staffs were also diverse. Half
of the schools had less than ten teachers; only three
had more than 50. On average about half of the teach-
ers held Ontario teaching qualifications. Aca-
demically-defined schools in general, and those which
operate for profit in particular, were most likely to have
more Ontario qualified teachers. More than four-fifths
of the schools have at least one Ontario-qualified
teacher, and for the most part their teachers hold un-
dergraduate degrees, with the exception of Amish and
Mennonite schools, whose teachers often hold denom-
inational qualifications instead. Only a few of the larger
schools employ librarians, most relying on volunteers
to staff libraries. Most schools have some clerical staff,
although in very small schools the Head often attends
to all clerical matters, while also teaching full time.
About half of the schools employ custodians and/or
night-time cleaning services, but some of the smaller
religiously-defined schools rely on volunteers to clean
the premises. Classroom assistants were common in the
larger schools, a few of which also reported having
cooks and/or kitchen staff, grounds-keepers, residence
supervisors, and/or technical support staff.
Mission
As described by the Heads of the schools, all of the par-
ticipating schools, whether religiously-defined or aca-
demically-defined, large or small, new or long
established, see their main mission as being the provi-
sion of a superior education. Religiously-defined
schools typically understand this as an education
framed by the tenets, histories, and practices of their
Ontario’s Private Schools 12 The Fraser Institute
religion, which informs all parts of the curriculum from
their religious perspective. Academically-defined
schools typically emphasize academic success, charac-
ter development, development of self-confidence, and
self-directed learning. All Heads of schools spoke to
the sense of community within the school, stressing op-
portunities available for parents to belong to a group of
like-minded peers.
Finances
While the main source of income for virtually all of
these schools is tuition fees, the way in which fees are
charged differs considerably: some charge a flat family
rate, some charge solely by student, some have dis-
counts for additional students from the same family,
and some have sliding scales based on family income.
Most also charge different rates for different curricu-
lum divisions. The actual amount charged in tuition
fees ranged from nothing at all at two of the Mennonite
schools to a high of $18,800 at one of the CIS academi-
cally-defined schools. On the whole, academically-de-
fined schools reported charging higher fees than
religiously-defined schools, and there was a slight ten-
dency for non-profit schools to be a little more expen-
sive than for-profit schools. Even so, fees for the three
private Roman Catholic schools (all not-for-profit)
were among the highest. The Head of one Mennonite
school explained the school does not charge tuition
fees as it is funded directly by the whole congregation.
One non-profit Montessori school reported making oc-
casional barter arrangements with parents in lieu of tui-
tion fees. A few schools include transportation costs in
tuition fees, and some include lunches, field trips, and
supplementary materials. In schools which charge sep-
arately for such things, parents estimated additional
costs ranging from $10 to $15,000 per child, with addi-
tional costs in religiously-defined schools typically be-
ing lower than those in academically-defined schools.
Where charged, boarding fees for residential students
ranged from $500 to $25,000.
Most schools, including for-profit schools, reported of-
fering some form of financial assistance. Among the
families in our study, 69 (8%) reported receiving bursa-
ries, scholarships, discounts, or subsidies from the
school to help them with tuition fees. Almost as many
families (64) reported receiving assistance from outside
the school. Eight families received grants from the
Children First School Choice Trust program of The
Fraser Institute, which is funded through private dona-
tions and which offers grants to economically disad-
vantaged parents who seek a private education for
their children. Eligible families, with incomes below an
established level, enter a lottery and if successful are
awarded half of the tuition costs, up to a maximum of
$4,000 per child per year. The most common outside
source of assistance, reported by 38 (4%) families, was
grandparents or other family members. Families with
children in religiously-defined schools were more likely
to receive aid from the school and from outside sources.
Many schools reported making use of outside resources
to keep their costs down. Religiously-defined schools in
particular raise additional funds and material support,
occasionally very substantial support, from their wider
communities. One Islamic school Head, for example,
noted, “The Muslim community, locally, nationally
and internationally, supports the school. A New York
Muslim donated all the computers in the school; the
use of the building is donated; and the Foundation
raised $100,000 this year.” One Head of a Christian
school noted that the school receives extensive support
from “former families, grandparents and some
churches” and also from supporters of Christian educa-
tion at large.
Summary
The diversity of Ontario private schools is such that it
is impossible to capture all variations in any sample, but
the schools in this study appear to be sufficiently repre-
sentative. Our sample includes schools which are very
large and very small, and those in between. They are
governed by elected boards, by churches or mosques,
by boards of investors, or by sole proprietors. They offer
elementary or secondary programs or both. They are
staffed entirely by Ontario qualified teachers, or by
The Fraser Institute 13 Ontario’s Private Schools
STUDIES IN EDUCATION POLICY, MAY 2007

teachers with other qualifications, or by teachers with
no formal qualifications at all, or by combinations of
these. They operate in church basements, in converted
commercial spaces, in surplus schools purchased from
public boards, or in purpose-built facilities. They
charge very high tuition fees, moderate tuition fees, or
no direct fees at all. They all, without exception, exist
primarily to provide a superior education to students,
but the definition of how it is achieved varies as much
as do the schools themselves.
Characteristics of PrivateSchool Families
The parent questionnaire collected demographic
information about each of the 1801 parents in the
919 families surveyed. Many questions were based on
those used in the 2001 Census (Statistics Canada,
2006b, 2006c) and the 2003 General Social Survey (Sta-
tistics Canada, 2004) so as to facilitate comparisons with
Ontario families with school-aged children in general.
Families
Fully 93 percent of participating families had two par-
ents, compared to 80 percent of Ontario families with
school aged children in the 2001 census. There were 36
lone parent families in our sample, 33 (92%) with a fe-
male parent, which is close to the 85 percent of female
lone parent families in the Ontario 2001 census. A
slight majority of our single parent families had chil-
dren in academically-defined schools, as did all three of
the families with two female parents. The 16 single-
parent families with children in religiously-defined
schools consisted of three with children in Islamic
schools, and 13 in Christian schools.
With a median of 2.4 children, participating families
appear similar to comparative 2001 census families,
which had a median of two children aged 6 - 17. Yet
this sense of equivalency disappears when overall num-
bers of children are considered. As illustrated in figure
2, one-sixth (16%) of our participating families had a
single child, somewhat lower than the 21 percent cen-
sus comparison families. Half of the 2001 census fami-
lies had two children, compared to only 39 percent of
our private school families, while 45 percent of these
families had three or more children, as compared to
only 29 percent of the comparative census families.
Parents with children in religiously-defined schools
were likely to have more children. A parallel pattern is
evident in the census data where families with parents
who reported a religious affiliation tended to have
more children.
Mobility
While the growing preference for private schools over
public schools is clear, the movement of students is not
always one way. Overall, more than two-thirds (68%)
of the 2,117 school-aged or older children in our partic-
ipating families were reported as having attended only
private schools, and six percent only public schools.
The remaining 26 percent had moved between public
and private schools: 16 percent began in public schools
and moved to private; five percent had moved from
STUDIES IN EDUCATION POLICY, MAY 2007
Ontario’s Private Schools 14 The Fraser Institute

private to public schools; two percent had moved from
public to private and back again; and two percent had
moved from private to public and back again (see figure
3). Our data suggest the switch from private to public
education happens most often at the beginning of sec-
ondary school, but there were also a notable number of
students who were reported as having moved in the op-
posite direction at that point in their academic careers.
Children from families associated with religiously-de-
fined schools were more likely to have attended only
private schools: 75 percent compared to 56 percent
from families supporting academically-defined schools.
The six percent of children from our sample families
who had always attended a public school were mostly
older children in families which now send their youn-
ger children to private schools.
Parents with children in a religiously-defined school
were more likely to have attended a private school
themselves. Even so, just over half of the parents with
children in religiously-defined schools, and almost
three-quarters of those with children in academi-
cally-defined schools, had spent some time attending
publicly funded elementary and secondary schools.
Only 12 percent of parents, mostly from reli-
giously-defined schools, had never attended a public
school, but 62 percent of parents—evenly distributed
between the academically-defined and religiously-de-
fined groups—had never attended a private school at
all. This offers eloquent testimony to the shift in pa-
rental preference for private over public education
over the past generation. A very small number of par-
ents (less than 1%) reported having been home
schooled. This is not surprising given that less than
two percent of contemporary Canadian home school-
ing parents were home schooled themselves (Van
Pelt, 2004, p. 34).
Religious affiliation
The greater majority of parents responding to our sur-
vey (82%) reported a religious affiliation, the most
common being some form of Christianity (72%), fol-
lowed by Islam (5.5%), Judaism (3.3%), then very small
numbers of Buddhist, Hindu, Sikh (1.3%) and other
religions (0.4%), including one Wiccan. Comparative
2001 census estimates yield a close match to this gen-
eral pattern, 83 percent of Ontario parents with school
aged children declaring a religious affiliation, with 71
percent classified as Christian, 4.5 percent Islamic, 3.1
percent Jewish, and 4.1 percent Buddhist, Hindu, or
The Fraser Institute 15 Ontario’s Private Schools
STUDIES IN EDUCATION POLICY, MAY 2007
0 10 20 30 40 50 60
1 child
2 children
3 or more children
StatsCan parents
Study parents
Percent
Figure 2: Comparison of Family Size, Study Families, and Population at Large
Sources: Statistics Canada, 2001; Statistics Canada, 2004; Statistics Canada, 2006a; Statistics Canada, 2006b; Statistics
Canada, 2006c.

Sikh. These numbers imply higher proportions of Is-
lamic and Judaic families are likely to choose private
schools than are families with other non-Christian reli-
gious affiliations. Moreover, the proportions of Bud-
dhist, Hindu, and Sikh parents in our sample were
notably lower than the 2001 census population esti-
mates, suggesting parents with such religious affilia-
tions are likely to send their children to public schools.
None of the schools in our sample were defined by one
of these religions and our broader inquiries identified
only a very few in the province. Most of the families
with Buddhist, Hindu, or Sikh parents in our sample
sent their children to academically-defined schools,
while a handful sent their children to Christian schools.
The 71.5 percent of parents reporting some form of
Christian affiliation in our survey was virtually identi-
cal to the comparable 2001 census estimate of 71.2 per-
cent. There was a smaller proportion of parents
identifying themselves as Catholic or Orthodox Chris-
tians in our data (20%) than was the case in the 2001
census (37%). This is to be expected given the ready
availability of publicly funded Roman Catholic Sepa-
rate schools in Ontario. Indeed, the most interesting
point that arises here is what appears to be a relatively
high proportion of Catholic parents who choose pri-
vate schools over public—and thus tuition free—alter-
natives. Slightly over half (51%) of our respondents fell
into the category of Protestant or other Christian de-
nominations, which is a substantially greater propor-
tion than the 34 percent of comparable parents in the
2001 census. This reflects the many and varied
non-Catholic Christian private schools in our sample
and the province at large. Even so, 34 percent of the
Christian parents in our survey sent their children to
academically-defined schools.
While the proportion of parents in our survey declaring
a religious affiliation was very similar to the compara-
tive 2001 census estimate, they appear to attach much
Ontario’s Private Schools 16 The Fraser Institute
STUDIES IN EDUCATION POLICY, MAY 2007
0 10 20 30 40 50 60 70 80
All Private (6)
Private to Public (5)
Private to Public to Private (4)
Public to Private (3)
Public to Private to Public (2)
All Public (1)Academic
Religious
Percent
Figure 3: Patterns of School Attendance, All Children in Sample Families
(1) All public—student has only ever attended a publicly-funded school.
(2) Public to Private to Public—student first attended a publicly-funded school, then a private school, then a publicly-funded school.
(3) Public to Private—student first attended a publicly-funded school, then a private school.
(4) Private to Public to Private—student first attended a private school, then a publicly-funded school, then a private school.
(5) Private to Public—student first attended a private school, then a publicly-funded school.
(6) All private—student has only ever attended a private school.
Sources: Statistics Canada, 2001; Statistics Canada, 2004; Statistics Canada, 2006a; Statistics Canada, 2006b; Statistics Canada, 2006c.

greater importance to their religious beliefs than re-
spondents to a 2003 survey (Statistics Canada, 2004).
Ninety percent of our private school parents declared
their religious or spiritual beliefs to be important or
very important to the way they live their lives, as com-
pared to 75 percent of Ontario parents in the Statistics
Canada survey. As indicated in figure 4, virtually all
(98%) parents with children in religiously-defined
schools declared their religious or spiritual beliefs to be
very important to them, but so did many (77%) parents
with children in academically-defined schools. A little
over half (53%) of private school parents reported at-
tending religious services or meetings at least once a
week, but this was so for only 29 percent of the compar-
ison group from the Statistics Canada data. Three
quarters (74%) of parents with children attending reli-
giously-defined schools reported attending religious
services at least once a week, but only 17 percent of
parents of academically-defined schools reported at-
tending as frequently.
Community participation
Private school parents in our data were more politically
active than their counterparts in Ontario society gener-
ally. As figure 5 indicates, almost all (98%) private
school parents reported voting in the last federal elec-
tion, 93 percent in the last provincial election, and 82
percent in the last municipal election. In contrast, Sta-
tistics Canada’s social survey data (Statistics Canada,
2004) show only 61 percent of Ontario parents with
school aged children reported voting in the last federal
election, and 59 percent and 49 percent in the last
provincial and municipal elections. Nine percent of pri-
vate school parents also reported being actively involved
in a political party or group, as opposed to only three per-
cent of comparison parents. Our data also provide
grounds to think that parents who choose private
schools are just as likely to be involved in social and fra-
ternal activities as are other parents: 44 percent of our
parents reported being active in sports and recreational
organizations as compared to 35 percent of comparable
Ontario parents, the respective proportions for partici-
pation in cultural, educational, and hobby organizations
being 17 percent and 19 percent. Private school parents
reported being less involved in union and professional
association activity (20%) than did parents in the com-
parison group (27%), a difference that could be ex-
plained by the high incidence of self-employment which
is discussed below.
The Fraser Institute 17 Ontario’s Private Schools
STUDIES IN EDUCATION POLICY, MAY 2007
0 20 40 60 80 100 120
Do not attend
Attend less often
Attend weekly
Religion is important
StatsCan
Academic
Religious
Percent
Figure 4: Importance of Religion and Religious Attendance
Sources: Statistics Canada, 2001; Statistics Canada, 2004; Statistics Canada, 2006a; Statistics Canada, 2006b; Statistics
Canada, 2006c.

Education
Private school parents appear to be much better edu-
cated than other Ontario parents with school aged
children. While five percent had not completed sec-
ondary school, most (75%) had attended university,
and almost a quarter (21%) held graduate degrees,
nine percent doctorates.2 Among comparative parents
in the 2001 census, more had not completed high
school (15%) and only 36 percent had attended uni-
versity, of which six percent had completed a graduate
degree, one percent a doctorate. Moreover, private
school parents who had not completed a Bachelor’s de-
gree were much more likely to have earned another
post-secondary credential (55%) than were parents in
the census comparison group (36%). The most com-
mon areas of post-secondary study among our private
school parents were medicine and related health fields,
which accounted for twelve percent of the reported
fields of study, followed by business and commerce
(11%), and then education, recreation or counseling
(10%); respective proportions for the 2001 census
comparison group are 4 percent, 4.5 percent, and 5
percent. Parents with children enrolled in reli-
giously-defined schools typically had lower levels of ed-
ucation than those with children in academically-
defined schools, but they still tended to have higher
levels of education than parents in the general popula-
tion. Less than one percent of ADS parents had not
graduated from high school, compared to eight percent
of parents supporting religiously-defined schools, and
whereas three-quarters of ADS parents had at least one
university level credential and 14 percent a doctorate,
43 percent of RDS parents had a university credential,
and five percent a doctorate (see figure 6).
Employment
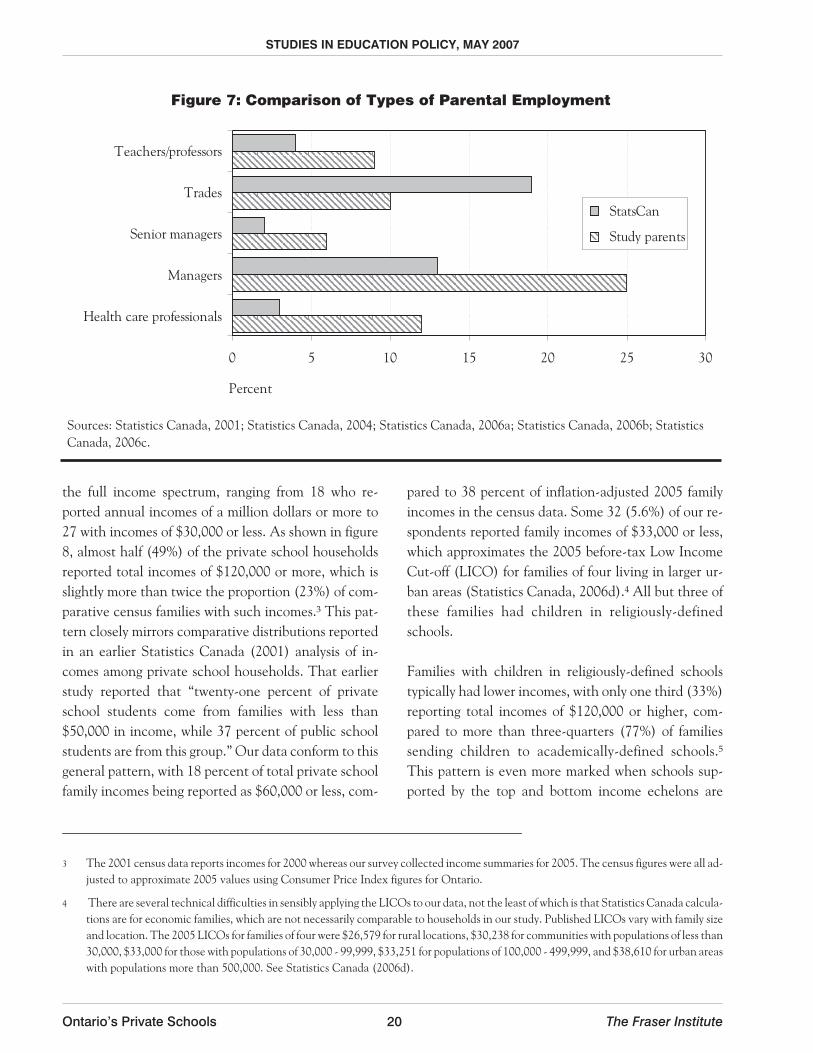
As indicated in figure 7, 12 percent of private school
parents reported being employed as professional health
workers, as compared to three percent in the compari-
son census population. Business occupations provide
an even sharper illustration of the effect of parents’ ed-
ucation. A quarter of private school parents (24.7%)
Ontario’s Private Schools 18 The Fraser Institute
STUDIES IN EDUCATION POLICY, MAY 2007
0 20 40 60 80 100 120
Active in prof/union
Active in arts/culture
Active in political party
Voted in municipal election
Voted in provincial election
Voted in federal election
StatsCan
Study parents
Percent
Figure 5: Comparison of Community Involvement
Sources: Statistics Canada, 2001; Statistics Canada, 2004; Statistics Canada, 2006a; Statistics Canada, 2006b; Statistics
Canada, 2006c.
2 Including medical degrees (5.7% medical doctorates, 3% PhDs).

worked in management positions, as compared to 13
percent of 2001 census parents, and six percent of the
private school parents were senior managers, compared
to just two percent of comparison Ontario parents.
Overall, half (49%) of private school parents reported
working in management, health, or teaching occupa-
tions, as compared to a quarter (24%) of comparative
Ontario parents in the 2001 census. In contrast, almost
one-fifth (19.3%) of census parents were classified as
working in construction or other trades, as transport or
equipment operators, in manufacturing, or as trades
helpers or labourers, compared to ten percent of pri-
vate school parents. Of the ten percent of the private
school parents who reported working in lower status
occupations, most (89%) enrolled children in reli-
giously-defined schools, but not all. Specific occupa-
tions reported by parents within this ten percent group
were truck driver, construction worker, house cleaner,
labourer, factory worker, and taxi driver.
Nine percent (154) of our respondent parents held a
teaching qualification, and most (71%) were currently
teaching, 45 percent in publicly-funded schools.
Slightly over half (58%) of these public school teachers
sent one or more of their children to a religiously-de-
fined private school. The 2001 census estimates show
four percent of parents with school-aged children em-
ployed as “teachers and professors.” This shows at least
a modest tendency for professional educators to enrol
their children in private schools.
Finally, 237 respondents (14%), three of whom were
male, listed their occupation as “Homemaker.” There
is no comparative occupational category in the 2001
census data, where such responses were classified as
not applicable, together with responses such as unem-
ployed or retired. The total of such inapplicable codes
among our 2001 census comparison group accounted
for 12 percent of all responses, the comparative propor-
tion in our data being 15 percent. Families with chil-
dren in private schools thus appear more likely to have
a parent who regards himself or herself as a full-time
homemaker.
Income
As would be expected from the comparative education
and employment patterns, most families responding to
our survey had relatively large incomes. Even so, the
private school families captured in our data spanned
The Fraser Institute 19 Ontario’s Private Schools
STUDIES IN EDUCATION POLICY, MAY 2007
0 10 20 30 40 50 60 70 80 90
Doctorates
Graduate degrees
Attended university
Secondary incomplete
StatsCan
Academic
Religious
Percent
Figure 6: Comparison of Parental Education Levels
Sources: Statistics Canada, 2001; Statistics Canada, 2004; Statistics Canada, 2006a; Statistics Canada, 2006b; Statistics
Canada, 2006c.
the full income spectrum, ranging from 18 who re-
ported annual incomes of a million dollars or more to
27 with incomes of $30,000 or less. As shown in figure
8, almost half (49%) of the private school households
reported total incomes of $120,000 or more, which is
slightly more than twice the proportion (23%) of com-
parative census families with such incomes.3 This pat-
tern closely mirrors comparative distributions reported
in an earlier Statistics Canada (2001) analysis of in-
comes among private school households. That earlier
study reported that “twenty-one percent of private
school students come from families with less than
$50,000 in income, while 37 percent of public school
students are from this group.” Our data conform to this
general pattern, with 18 percent of total private school
family incomes being reported as $60,000 or less, com-
pared to 38 percent of inflation-adjusted 2005 family
incomes in the census data. Some 32 (5.6%) of our re-
spondents reported family incomes of $33,000 or less,
which approximates the 2005 before-tax Low Income
Cut-off (LICO) for families of four living in larger ur-
ban areas (Statistics Canada, 2006d).4 All but three of
these families had children in religiously-defined
schools.
Families with children in religiously-defined schools
typically had lower incomes, with only one third (33%)
reporting total incomes of $120,000 or higher, com-
pared to more than three-quarters (77%) of families
sending children to academically-defined schools.5
This pattern is even more marked when schools sup-
ported by the top and bottom income echelons are
Ontario’s Private Schools 20 The Fraser Institute
STUDIES IN EDUCATION POLICY, MAY 2007
0 5 10 15 20 25 30
Health care professionals
Managers
Senior managers
Trades
Teachers/professors
StatsCan
Study parents
Percent
Figure 7: Comparison of Types of Parental Employment
Sources: Statistics Canada, 2001; Statistics Canada, 2004; Statistics Canada, 2006a; Statistics Canada, 2006b; Statistics
Canada, 2006c.
3 The 2001 census data reports incomes for 2000 whereas our survey collected income summaries for 2005. The census figures were all ad-
justed to approximate 2005 values using Consumer Price Index figures for Ontario.
4 There are several technical difficulties in sensibly applying the LICOs to our data, not the least of which is that Statistics Canada calcula-
tions are for economic families, which are not necessarily comparable to households in our study. Published LICOs vary with family size
and location. The 2005 LICOs for families of four were $26,579 for rural locations, $30,238 for communities with populations of less than
30,000, $33,000 for those with populations of 30,000 - 99,999, $33,251 for populations of 100,000 - 499,999, and $38,610 for urban areas
with populations more than 500,000. See Statistics Canada (2006d).

compared. Of the 101 families with incomes of
$310,000 or more, 75 percent sent children to academ-
ically-defined schools, 53 percent of this top income
group enrolling children in CIS schools. In stark con-
trast, 90 percent of the 93 families with incomes of
$59,000 or less had children in religiously-defined
schools. Yet, in contradiction of stereotypical expecta-
tions, three of these 93 families with the lowest in-
comes sent children to CIS schools.
Fully 83 percent of comparative 2001 census families
identified their major source of family income as wages
and salaries, compared to 57 percent among private
school families, with a further 10 per cent declaring
that wages and salaries were combined with another
source as the major sources of family income. And
whereas forty percent of private school families identi-
fied self-employment as their major source of income,
or one of their major sources of income, only seven per-
cent of the census comparison families did so. A little
over a third of private school families (37%) reported
receiving the Child Tax Benefit, compared to three-
quarters (75%) of the census families. Eighty-one per-
cent of the private school parents receiving the Child
Tax Credit sent children to religiously-defined schools.
Culture
A notably higher proportion of private school parents
(62%) were born in Ontario than were Ontario resi-
dents with school aged children in the 2001 census
(53%). Ten percent were born elsewhere in Canada,
compared to 11.5 percent of our census comparison
group. Although nine percent of our participating
parents were born in Asia, they were nonetheless un-
der-represented when compared to the 16 percent
Asian-born among comparison census parents. A
greater proportion of private school parents held Ca-
nadian citizenship (92%) than did comparable 2001
census parents (87%), with a lower proportion of pri-
vate school parents being citizens by naturalization
(19%) than was the case in the comparative census
data (30%).
The Fraser Institute 21 Ontario’s Private Schools
STUDIES IN EDUCATION POLICY, MAY 2007
0 10 20 30 40 50 60
<30,000
30,000 - 60,000
60,000 - 90,000
90,000 - 120,000
>120,000
StatsCan
Study parents
Percent
Figure 8: Comparison of Family Income Levels
Sources: Statistics Canada, 2001; Statistics Canada, 2004; Statistics Canada, 2006a; Statistics Canada, 2006b; Statistics
Canada, 2006c.
5 Examination of the 2001 census data found no statistically significant difference between mean total incomes of parents declaring a reli-
gious affiliation and those who did not.
Higher proportions of private school parents identified
English as their sole mother tongue (70%) and as the
language they most often speak at home (84%), the
comparative 2001 census proportions being 64 percent
and 78 percent respectively. The next most frequently
identified hearth languages among private school par-
ents were Dutch, (5%), German (5%), Italian (3%) and
Chinese (3%). Comparative census estimates being
Dutch 0.4 percent, German 0.8 percent, Italian 3.4 per-
cent and Chinese 6.3 percent. The over-representation
of Dutch languages mirrors the relatively higher propor-
tion of our private school parents who were born in the
Netherlands (2% in our data, 0.23% in the 2001 census
data). This might be a result of parents from the Nether-
lands being more readily disposed to private schools as a
result of the wide availability and acceptance of
non-state schools in the Netherlands.
While English clearly dominated the hearth and home
languages identified by the private school parents, re-
spondents nevertheless identified no less than 56 dif-
ferent hearth languages overall, 38 of which survive as
languages most often spoken at home. The strong ten-
dency for private school parents to be Canadian or Eu-
ropean-born English speakers is reflected in the lower
proportion of visible minority parents among our re-
spondents (15%) than in the comparative census data
(23%). More specifically, our data contain smaller pro-
portions of parents in each of Statistics Canada’s visible
minority categories (Chinese, South Asian, Black), the
greatest discrepancy being in the Black category which
accounted for only one percent of our respondents as
compared to the census estimate of four percent of On-
tario parents with school-aged children.
Summary
When viewed alongside comparable population esti-
mates, the private school families captured in our data
tended to have more children, and fewer were lone par-
ent families; a higher proportion of parents were On-
tario-born English speakers who were Canadian
citizens by birth, and a lower proportion were visible
minorities. While 57 percent of our parents sent chil-
dren to religiously-defined schools, the proportion of
the full sample reporting a religious affiliation (82%)
was comparable to that in the Ontario population at
large (83%). Even so, a markedly higher proportion of
private school parents said their religious or spiritual
beliefs were important to the way they live their lives
than did Ontario parents generally.
Parents sending children to private schools typically
had much higher levels of education and tended to
work in professional or semi-professional and adminis-
trative occupations. Unsurprisingly, then, private
school parents tended to have higher incomes than
their counterparts in the general population. Yet, as
found in earlier research, many private school families
reported relatively modest incomes, and some can be
fairly regarded as poor. It is also clear that parents send-
ing children to academically-defined schools will likely
have higher levels of education and income than those
with children in religiously-defined schools.
Even so, exceptions were evident to each of the domi-
nant patterns emerging from our data. While most pri-
vate school parents were highly educated, five percent
had not graduated from high school; while most worked
in higher status occupations, some had much more ordi-
nary jobs; while the great majority were Ontario-born,
English speaking Canadian citizens, some were
non-English speaking recent immigrants; while the great
majority of private school families had two married par-
ents, there were both female and male lone-parent fami-
lies as well as same-sex families in our sample. In sum,
parents sending children to Ontario academically-de-
fined and religiously-defined schools tend to be highly
educated, employed in high-status occupations, and rel-
atively rich—except, that is, for those who are plainly
not rich, are less well educated, and are employed in
comparatively lowly work. Our short answer to the ques-
tion of who sends their children to private school is thus
“anyone.”
Ontario’s Private Schools 22 The Fraser Institute
STUDIES IN EDUCATION POLICY, MAY 2007
Parental Reasons forChoosing Private Schools
Other North American researchers have studied
the reasons parents give for choosing private
schools. After considering Bell (2005), Bosetti (2000),
Community-University Partnership for the Study of
Children, Youth and Families (2004), Davies and
Quirke (2005a, 2005b), Erickson (1986), Mirski
(2005), Paquette (2000), Ungerleider (2003) and other
sources, we generated a list of sixty-one features and
characteristics of private schools. Our parent question-
naire asked respondents to rate how important each
was in their selection of a private school for their child
and to rate the extent to which they agreed the charac-
teristic was indeed a feature of their chosen school.
Consequently, two lists could be created, a ranked list
of reasons for choosing private schools and a ranked list
of the features present in private schools. These reasons
and features were further examined by considering the
responses for parents choosing academically-defined
schools or religiously-defined schools.
Top ten reasons for choosing
an Ontario private school
The most highly rated reason for choosing any private
school was the dedication of the teachers, which was
seen as very important by 91 percent of all parents. In
addition, more than 80 percent of all parents declared
as very important an emphasis on academic quality.
Teaching right from wrong and school safety were also
The Fraser Institute 23 Ontario’s Private Schools
Table 2: Top Ten Very Important Reasons by Type of Private School
Academically-Defined Schools Religiously-Defined Schools
This school ... This school ...
92% � has dedicated teachers 90% � teaches right from wrong
87% � emphasizes academic quality 90% � has dedicated teachers
85% � motivates students 88% � supports our family’s values
84% � is a safe school 86% � is a safe school
84% � has outstanding, quality teachers 83% � reinforces our religion
84% � instills confidence in the students 79% � emphasizes academic quality
82% � teaches students to think for themselves 79% � has good student discipline
82% � offers individualized attention 77% � values parent-teacher collaboration
79% � offers a supportive, nurturing, educational
environment
77% � is conducive to character development
77% � offers outstanding classroom instruction 77% � educates the whole child
Common reasons are in bold type.
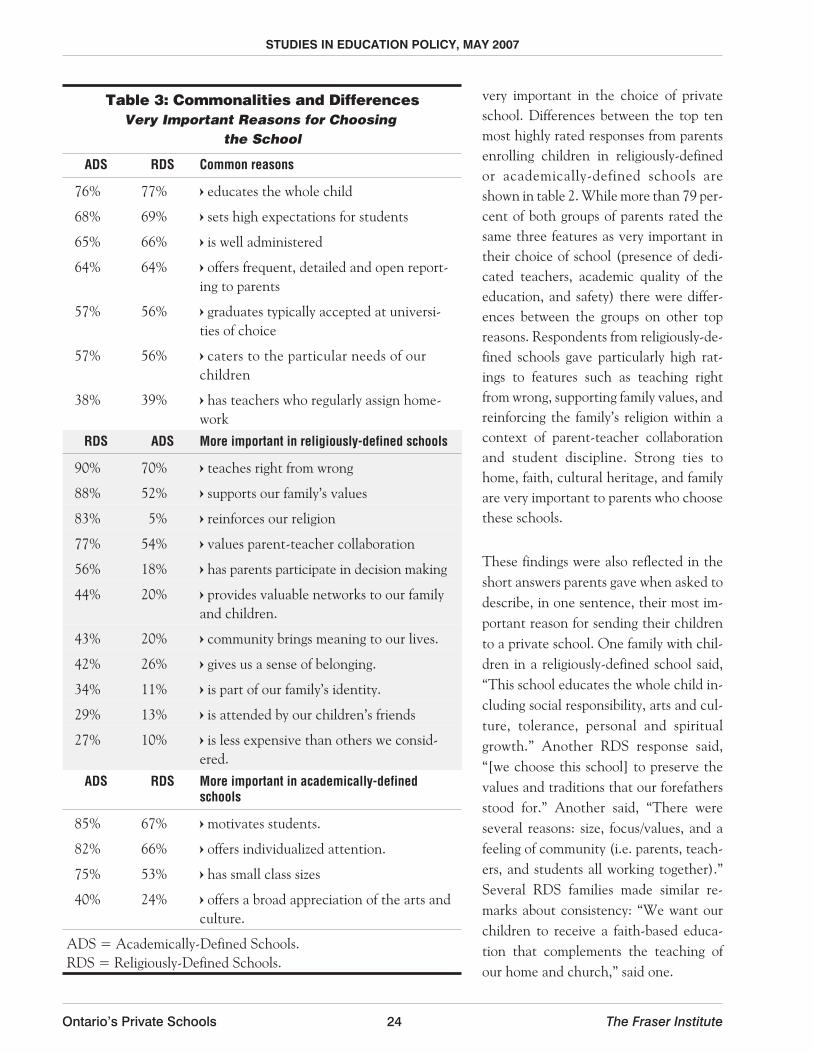
very important in the choice of private
school. Differences between the top ten
most highly rated responses from parents
enrolling children in religiously-defined
or academically-defined schools are
shown in table 2. While more than 79 per-
cent of both groups of parents rated the
same three features as very important in
their choice of school (presence of dedi-
cated teachers, academic quality of the
education, and safety) there were differ-
ences between the groups on other top
reasons. Respondents from religiously-de-
fined schools gave particularly high rat-
ings to features such as teaching right
from wrong, supporting family values, and
reinforcing the family’s religion within a
context of parent-teacher collaboration
and student discipline. Strong ties to
home, faith, cultural heritage, and family
are very important to parents who choose
these schools.
These findings were also reflected in the
short answers parents gave when asked to
describe, in one sentence, their most im-
portant reason for sending their children
to a private school. One family with chil-
dren in a religiously-defined school said,
“This school educates the whole child in-
cluding social responsibility, arts and cul-
ture, tolerance, personal and spiritual
growth.” Another RDS response said,
“[we choose this school] to preserve the
values and traditions that our forefathers
stood for.” Another said, “There were
several reasons: size, focus/values, and a
feeling of community (i.e. parents, teach-
ers, and students all working together).”
Several RDS families made similar re-
marks about consistency: “We want our
children to receive a faith-based educa-
tion that complements the teaching of
our home and church,” said one.
Ontario’s Private Schools 24 The Fraser Institute
STUDIES IN EDUCATION POLICY, MAY 2007
Table 3: Commonalities and Differences
Very Important Reasons for Choosing
the School
ADS RDS Common reasons
76% 77% � educates the whole child
68% 69% � sets high expectations for students
65% 66% � is well administered
64% 64% � offers frequent, detailed and open report-
ing to parents
57% 56% � graduates typically accepted at universi-
ties of choice
57% 56% � caters to the particular needs of our
children
38% 39% � has teachers who regularly assign home-
work
RDS ADS More important in religiously-defined schools
90% 70% � teaches right from wrong
88% 52% � supports our family’s values
83% 5% � reinforces our religion
77% 54% � values parent-teacher collaboration
56% 18% � has parents participate in decision making
44% 20% � provides valuable networks to our family
and children.
43% 20% � community brings meaning to our lives.
42% 26% � gives us a sense of belonging.
34% 11% � is part of our family’s identity.
29% 13% � is attended by our children’s friends
27% 10% � is less expensive than others we consid-
ered.
ADS RDS More important in academically-definedschools
85% 67% � motivates students.
82% 66% � offers individualized attention.
75% 53% � has small class sizes
40% 24% � offers a broad appreciation of the arts and
culture.
ADS = Academically-Defined Schools.
RDS = Religiously-Defined Schools.

In contrast parents with children in academically-de-
fined schools identified features such as outstanding
quality of the teachers, the outstanding quality of the
classroom instruction, a supportive, nurturing educa-
tional environment that motivates students, builds
confidence, teaches independent thought, and offers
individualized attention as being very important in
their choice. Parents enrolling children in academi-
cally-defined schools thus appear to value instruction
by outstanding teachers concerned with individual stu-
dent well-being and growth. As one such parent told
us, the most important reason for choosing was “Qual-
ity education in a controlled environment, with good
teacher/student ratio and a successful track record.”
Comments from parents with children in academi-
cally-defined schools frequently referred to dissatisfac-
tion with the public system: “Character building within
community, academics, confidence, and a sense of be-
ing a person, not a number as in the public system” said
one; and “Disappointment with the public school,
teachers spending too much time on discipline and not
enough time on instruction,” said another.
Commonalities and
differences
Were there any features that parents from one group
would be significantly more likely to claim were very
important in selecting their schools when compared
with parents from the other group? Table 3 explores
commonalities and differences in parental ratings of
very important features by school type. Parents from
both kinds of school, religiously-defined and academi-
cally-defined, were equally likely to select as “very im-
portant” features such as educating the whole child,
setting high expectations for students, being well ad-
ministered, offering frequent, detailed and open re-
porting to parents, preparing graduates who are more
likely to be accepted at the universities of their choice,
catering to the particular needs of children, and having
teachers who regularly assign homework.
Parents choosing religiously-defined schools were
significantly more likely than parents choosing aca-
demically-defined schools (p<.000 in all cases , that is,
The Fraser Institute 25 Ontario’s Private Schools
STUDIES IN EDUCATION POLICY, MAY 2007
Table 4: Top Ten Most Recognized Features of the Schools by Type of School
in Academically-Defined Schools in Religiously-Defined Schools
This school ... This school ...
71% � is a safe school 80% � reinforces our religion
71% � has dedicated teachers 78% � teaches right from wrong
66% � emphasizes academic quality 76% � has no danger of teachers going on strike
65% � has no danger of teachers going on strike 74% � supports our family’s values
64% � has a good reputation 74% � is a safe school
64% � offers opportunities unavailable in local
public schools
73% � has dedicated teachers
63% � educates the whole child 67% � values parent-teacher collaboration
62% � motivates students 66% � emphasizes academic quality
62% � offers a supportive, nurturing, educational
environment
63% � educates the whole child
61% � is conducive to character development 62% � is conducive to character development
Common reasons are in bold type.

there is less than one chance in a thousand that the re-
sults occurred by chance) to rate the following items as
very important: the schools’ support of the family’s reli-
gion, values, and morals; involvement of parents in de-
cision-making and collaboration with teachers; and
embedded family identity in the school, its community,
and its networks. An emphasis on the importance of
such features indicates an important enculturation
function that religiously-defined schools appear to pro-
vide to their supporting families.
Parents enrolling children in academically-defined
schools were significantly more likely to rate as very im-
portant to their choice features such as offering a broad
appreciation of arts and culture, motivating students,
and offering individualized attention (p < .000 in all
cases). In essence, parents choosing academically-de-
fined schools appear to prize the provision of individu-
alized and enriching environments for students.
In sum, parents supporting both types of schools were
equally likely to be looking for a school that would be
interested in the welfare of the whole child and his/her
particular needs, and which would provide quality and
effective education with sound school administration.
Parents choosing religiously-defined schools appeared
to be more specific in their expectations concerning re-
ligious values and moral teaching, and most particu-
larly in their search for a sense of involvement,
community, and belonging. Parents choosing academi-
cally-defined schools were attracted by the individual-
ized focus and broader cultural appreciation.
Top ten most recognized
features in Ontario private
schools
Parents were also asked to indicate the extent to which
each of the sixty-one school features was present in
their private school, using a four point scale from
strongly agree to strongly disagree. The majority of par-
ents agreed their private schools are indeed safe, sup-
portive, nurturing, and have good reputations; that
their teachers are dedicated and not likely to go on
strike, and that the education provided focuses on the
whole student, offers quality instruction, character de-
velopment, and a moral perspective that supports the
family’s values. Table 4 shows differences between re-
sponses by type of school. Parents of religiously-defined
schools strongly agree that their schools reinforce the
family’s religion and values, teach the difference be-
tween right and wrong, and value the role of parents in
parent-teacher collaboration. The presence and influ-
ence of the home and the emphasis on morality
emerged as distinctly recognizable features of reli-
giously-defined schools, indicating, again, the impor-
tant enculturation function that these schools offer.
Parents with children in academically-defined schools
tended to strongly agree their school had a good repu-
tation, offered opportunities unavailable in local public
schools and motivated students in a supportive, nur-
turing, environment. These recognized features point
toward ways in which these schools do indeed provide
opportunities for individualized enrichment.
Satisfaction
In the vast majority of cases the features that were very
important to parents in their choice of private school
were found to be features of the chosen school. Thus,
as might be expected, parents for the most part said
that their schools delivered the features they were
looking for when they chose them. Parents supporting
religiously-defined schools said that their schools did
indeed support the family’s religion, values, and mor-
als, and did involve parents in the school and its net-
work. Parents choosing academically-defined schools
identified more emphasis on extended activities and
enrichment programs offered by the school. These dif-
ferences imply that parents choosing academically-de-
fined schools may appreciate the additional
value-added features and conveniences that “round
out,” the individualized, motivating academic empha-
sis characteristic of these schools even though those
items were not the most important factors in their
choice of the school.
Ontario’s Private Schools 26 The Fraser Institute
STUDIES IN EDUCATION POLICY, MAY 2007

Past experience
The parent questionnaire asked parents to rate how
important their disappointment with other school op-
tions was in choosing their current private school. Fully
94 percent of respondents said that disappointment
with public or separate schools was a factor in their
choice of private school. Indeed, 75 percent said it was
a very important factor in choosing their private
school. More than half (54%) of the parents who had at
some time had a child in a publicly-funded Roman
Catholic separate school said that their disappoint-
ment with the separate school was a very important
factor in their choosing their current private school.
About a third of these parents now send their children
to a private Roman Catholic school, a third to another
religiously-defined school, and a third to academi-
cally-defined schools. More than half (58%) of the par-
ents who had at some time had a child in the secular
public system said that their disappointment with pub-
lic schools was a very important factor in choosing their
current private school. Half of these parents now send
children to religiously-defined schools and half to aca-
demically-defined schools. Thus, while 75 percent of
students in religiously-defined and 56 percent of stu-
dents in academically-defined schools have always at-
tended such schools (figure 3), when past experience
with a publicly-funded system was a factor in the par-
ents’ decision they were equally likely to choose either
a religiously-defined or academically-defined school.
Summary
Parent ratings of private school features show that in
general they overwhelmingly chose private schools be-
cause of the dedicated teachers and their outstanding
quality; safe, supportive, nurturing, motivating, confi-
dence-enhancing educational environments; and an
emphasis on quality academics. In addition, parents
who chose religiously-defined schools typically view a
focus on faith, morals, character, family, and commu-
nity as very important Those who chose academically-
defined schools typically see a focus on individualized
growth, confidence, and motivation as very important
and they are more likely to have tried a publicly-funded
option before choosing a private school for their chil-
dren. Altogether, we conclude that both kinds of pri-
vate school are seen as providing a high quality
education and different added value properties,
with religiously-defined schools providing specific en-
culturation functions, while academically-defined pri-
vate schools emphasize individualized enrichment.
Private Schools as“Effective Schools”
Our data revealed striking but somewhat unantici-
pated parallels between parent perceptions of pri-
vate schools, both rel igiously-defined and
academically-defined, and features characteristic of pub-
lic schools that have been identified by scholars as “effec-
tive schools.” For decades research on effective schools
has sought to identify the characteristics of those public
schools which achieve at higher levels than expected,
given their inputs and socio-economic-cultural context.
Purkey and Smith’s (1983) widely cited summary identi-
fied thirteen characteristics of effective schools. We
have summarized these in the first column of table 5, and
in the second column we have listed items from our sur-
vey which correspond to these features, along with the
STUDIES IN EDUCATION POLICY, MAY 2007
The Fraser Institute 27 Ontario’s Private Schools

percentage of parents who agreed or strongly agreed that
these were features of their chosen private school.
While we have adopted Purkey and Smith’s wording in
this discussion for consistency, subsequent work has
extended and refined the features characteristically as-
sociated with effective schools. Currently recognized
core features of effective schools include a strong sense
of identity, commitment and purpose, typically associ-
ated with and supported through cooperation and col-
laboration. Such schools also emphasize student
instruction and student progress, have high expecta-
tions for academic achievement and behaviour, which
is shared by staff and parents and typically accepted by
pupils. They also regularly assess student progress, have
an orderly school climate, and nurture consistent, mu-
tually supportive efforts by home and school. A subse-
quent landmark study by Coleman and Hoffer (1987)
expanded on the importance of the school community,
They identified two forms of school community: a
“functional” community where the school serves a
distinctive community, as might be expected in reli-
giously-defined schools; and a shared “values” commu-
nity, where parents (and staff) independently choose a
school on the basis of its ideals and world view, as is evi-
dently the case in many academically-defined schools.
Responses of parents participating in this study show
that features of effective schools are also features of pri-
vate schools. The first of Purkey and Smith’s character-
istics, school level decision making, is a defining
property of private schools which, by their very nature,
are self-governing and self-managed. As such, private
schools enjoy far greater scope for local initiatives than
are normally possible in a typical public school. Purkey
and Smith’s second characteristic, support for local
school leadership and collaborative decision making
from central (district) administration, may at first only
appear relevant to public school systems. Yet while it is
evident that private schools are not directly governed
or funded by a central agency, all, or virtually all, bene-
fit from advice, guidance, direction, and support avail-
able through their affiliations with one or more
supporting organizations. As table 5 shows, strong par-
allels to each of Purkey and Smith’s remaining features
emerged from our data, with the overwhelming major-
Ontario’s Private Schools 28 The Fraser Institute
STUDIES IN EDUCATION POLICY, MAY 2007
Table 5: Purkey and Smith’s (1983) Characteristics of Effective (Public) Schools
Compared to Reasons Parents Choose Independent (Ontario) Schools
Purkey and Smith’s (1983) characteristicsof effective schools
Percentage of all parents identifying similar feature as importantor very important in their independent school
1. School site management and democratic
decision making
Ontario independent schools in Ontario are by nature locally
managed and responsible for their educational decisions.
2. Support from the district level for
school-level leadership and collaborative
decision-making
The various affiliations to which most Ontario independent
schools belong can provide supportive direction and guidance
as required.
3. Strong leadership by administrators and
by and through teams of administrators,
teachers, and others
94% – This school is well administered.
94% – The principal of this school provides strong leadership.
95% – This school values collegial relationships amongst staff
members.
4. Staff stability 99% – This school has dedicated teachers.
95% – There is no danger of teachers at this school going on
strike.
92% – This school has a long tradition of success.
continued next page

The Fraser Institute 29 Ontario’s Private Schools
STUDIES IN EDUCATION POLICY, MAY 2007
Table 5: Purkey and Smith’s (1983) Characteristics of Effective (Public) Schools
Compared to Reasons Parents Choose Independent (Ontario) Schools
Purkey and Smith’s (1983) characteristicsof effective schools
Percentage of all parents identifying similar feature as importantor very important in their independent school
5. A planned, coordinated, integrated
curriculum that addresses student needs
98% – This school is conducive to character development.
98% – This school teaches right from wrong.
96% – This school offers a supportive, nurturing, educational
environment.
96% – This school educates the whole child.
92% – This school is flexible and responsive.
6. Staff development 95% – This school has outstanding, quality teachers.
7. Parental involvement and support 97% – This school supports our family’s values.
95% – This school values parent-teacher collaboration.
93% – This school offers frequent, detailed, and open reporting
to parents.
8. School-wide recognition of academic
success
98% – This school has a good reputation.
96% – This school recognizes student success.
9. Priority given to teaching and learning 97% – This school teaches students to think for themselves.
97% – This school motivates students.
96% – This school offers individualized attention.
95% – This school emphasizes basic skills.
95% – This school instills confidence in the students.
93% – This school offers outstanding classroom instruction.
10. A sense of community 98% – The students at this school seem happy.
95% – This school offers a supportive community.
11. Collaborative planning and collegial
relationships
95% – This school values parent-teacher collaboration.
94% – The staff at this school has a collaborative approach to
problem solving.
12. Commonly shared clear goals and high
achievable expectations
99% – This school emphasizes academic quality.
97% – This school has high achievement standards.
97% – This school has clear goals.
97% – This school frequently evaluates student progress.
96% – This school sets high expectations for students.
93% – This school has high expectations for teachers.
13. Order and discipline 100% – This is a safe school.
96% – This school has good student discipline.
ity of parents reporting that their schools exhibit these
same features of effective schools. Their schools are lo-
cally managed and locally accountable. They are led by
strong principals and boast collaboration amongst ad-
ministrators, teachers, and parents. Parents over-
whelmingly report private schools have clear goals and
prioritize learning and teaching. They evaluate student
performance and recognize academic success. The
school climate is ordered, safe, disciplined, and has a
sense of community. In this respect there is broad
agreement that, regardless of the socio-economic sta-
tus of the families, and regardless of the curricular ori-
entation of the school, parents choosing private
schools identify similar key features in their schools and
these features map onto those exhibited by those
schools identified as being particularly effective in ear-
lier research. This may have important implications
about where parents might begin to search when seek-
ing a more effective school for their child.
Our findings clearly show that that the private schools
studied were notably strong with respect to the core
characteristics of effective schools. This is perhaps to
be expected given the emphasis on identity, distinct
climate, and strong purpose characteristic of privately
founded and sustained schools. Most distinctively and
completely such schools are communities in one of
the two senses identified by Coleman and Hoffer
(1987). In the case of religiously-defined schools that
community will be defined by the religious identity
that defines the school. A broader sense of commu-
nity is likely in academically-defined schools, depend-
ing on the values and pedagogy defining the school. In
both cases the sense of community is formed and sus-
tained by parental choice. The extent to which other
common features of effective schools are present will
be influenced by the collective commitments of the
governors, administrators, teachers, and parents in
the school.
Conclusions
Parents everywhere desire the best education
available for their children. Perhaps nowhere else
is this better displayed than by those who are able to
choose a private school for their children. Decade by
decade, the percentage of Ontario students enrolled in
private schools has increased, until today an estimated
6.5 percent of Ontario elementary and secondary
school students attend private schools in the province.
This increase includes growing numbers of students in
attendance at private Roman Catholic schools despite
the presence of fully-funded, state-provided Roman
Catholic Separate schools in the province. This study
investigated what these private schools are, why they
are being chosen, and who is choosing them.
Schools and the reasons
parents choose them
A vast array of schools operate across the private
school sector. They range in size, facilities, staffing,
governance, and financing, but all of them see their
main mission as being the provision of a superior ed-
ucation. While parental reasons for choosing either
religiously-defined or academically-defined schools
emerged as different from one another in some re-
spects, and while the parents from each group
emerged as being different not only from the general
population but also from each other, we nevertheless
found a coherence in why parents choose their
Ontario’s Private Schools 30 The Fraser Institute
STUDIES IN EDUCATION POLICY, MAY 2007

schools and how they characterized their schools of
choice.
According to the parents who choose them, private
schools consistently embody distinctive characteristics
which have been previously identified through large
scale comparative research as components of effective
schools. As such, private schools are self-governed and
managed, and typically operate within a supportive and
collaborative atmosphere provided by broader school
affiliations. Strong local leadership, collegial collabora-
tion between principals, teachers, and parents, a focus
on learning and teaching, high expectations, and an or-
dered environment were features overwhelmingly
identified by the parents as characteristics present in
their private school of their choice.
Although we did not set out to identify whether On-
tario private schools exhibited characteristics of effec-
tive schools, those characteristics nevertheless
surfaced, unambiguously, and forcefully. The parallels
between the majority of Ontario private schools re-
ported in this survey and effective schools in general is
intuitively sensible. The current move by Ontario’s
publicly governed schools toward ever greater stan-
dardization and hierarchical accountability runs coun-
ter to the findings of effective schools research. Parents
are compelled to search elsewhere for such features in
schools for their children.
According to the parents who choose them, distinct
differences do exist between religiously-defined and ac-
ademically-defined private schools and their parents.
Academically-defined schools tend to place greater
emphasis on individuality whereas religiously-defined
schools focus more on community. Academically-de-
fined schools are appreciated by parents for the enrich-
ing educational environment and opportunities they
offer for the individual child. Religiously-defined
schools are valued by the parents for their specific
enculturation functions and the ways they support, re-
inforce, and enhance the religious and/or cultural heri-
tage of students and their families. Many parents
choosing academically-defined schools have tried pub-
licly-funded schools and have found them inadequate.
Parents supporting religiously-defined schools believe
that public schools simply cannot achieve the educa-
tional goals they value for their children. It appears
that relatively few give public schools a try, most pre-
ferring to collaborate with others of like mind or cir-
cumstances to provide alternative, more apt venues for
their children’s education.6
Parent characteristics
Parents who choose private schools differ from the gen-
eral population of Ontario families with school age
children in several ways. Their family size, religious ap-
preciation, civic and political involvement, education
levels, employment status, income source, and income
levels all tend to be more extensive or higher than the
average Ontario parent with school aged children.
These differences might be expected given the larger fi-
nancial contribution Ontario parents must make to-
wards their children’s education should they choose
outside of the government-provided systems. Demo-
graphic differences also emerged between supporters
of schools in the academically-defined and reli-
giously-defined groups. There are marked differences
with regard to levels of education, employment and
income between the two sets of parents. While, on av-
erage, those who chose religiously-defined schools
were better credentialed and lived with higher house-
hold incomes than the general population, they were
not nearly as highly educated nor as wealthy as those
who, on average, chose the academically-defined pri-
vate schools.
The Fraser Institute 31 Ontario’s Private Schools
STUDIES IN EDUCATION POLICY, MAY 2007
6 Our dataset contains rich and varied stories of why parents choose private schools for their children. In this report we focused mainly on
the demographic characteristics of the families that choose and on their selected reasons for choosing. It is our intention to further analyze
and report on the stories that parents shared with us about choosing their private school for their childre.

In summary
Many Ontario parents are unable to choose the school
their children will attend. A close examination of those
parents who have chosen a private school for their chil-
dren reveals that while they represent all levels of edu-
cation and income, and have a wide range of ethnic
heritages, religious preferences, and countries of origin,
and are employed in a diversity of occupations, they all
choose private schools because they want a superior
education for their children.
Their preferred schools, while offering a safe educa-
tional environment, sound academic content and dedi-
cated teachers, will likely give priority to one of two
functions. Either they will respect the child’s individu-
ality and enhance his or her unique potential by offer-
ing various kinds of enrichment, or they will respect the
child’s participation in a distinct cultural or religious
group and actively promote this enculturation.
A common bond exists among all parents choosing
Ontario private schools. They have been persuaded, by
direct experience or by belief, that the superior educa-
tion they desire for their children, whether driven by an
explicit individual need of the child or by the child’s
cultural or religious identity, cannot be adequately met
in the educational experiences currently provided by
the state.
References
Allison, P.A., D. J. Allison, and D. Van Pelt (2006). Mapping
Ontario private schools. Unpublished working paper.
Bell, C.A. (2005). All choices created equal?: How good parents
select “failing” schools. Working Paper. New York: Na-
tional Centre for the Study of Privatization in Education.
Bosetti, L. (2000). “Alberta charter schools: Paradox and
promises.” Alberta Journal of Educational Research, 46
(2): 179-190.
Coleman, J.S. and T. Hoffer (1987). Public and private high
schools: The impact of communities. New York: Basic
Books.
Community-University Partnership for the Study of
Children, Youth, and Families (2004). Choice and ac-
countability in Canadian Education. Edmonton. Digital
document available at www.cup.ualberta.ca/resources_
documents.html (accessed April 20, 2006).
Davies, S. and L. Quirke (2005a). “Innovation in educa-
tional markets: An organizational analysis of private
schools in Toronto.” Catholic Education, 8 (3): 274-305.
Davies, S. and L. Quirke (2005b). “Providing for the priceless
student: Ideologies of choice in an emerging educational
market.” American Journal of Education, 111 (4):
523-547.
Erickson, D. (1986). “Choice and private schools: Dynamics
of supply and demand.” In D.C. Levy. Private education:
Studies in choice and public policy. Pp. 82-109. New York:
Oxford University Press.
Government of Ontario (2007). Education Act. R.S.O., c. E2.
Digital document available at www.e-laws.gov. on.ca.
Hepburn, C.R. and A. Mrozek (2004). Let the funding follow
the children. Studies in Education Policy. Vancouver:
The Fraser Institute.
McGuinty, D. (2004). Remarks at Character Communities
Spring Conference. April 22. Digital document avail-
able at www.premier.gov.on.ca/news/Product.asp?
ProductID=383 (accessed January 20, 2007).
Mirski, J. (2005). Why some Ontario parents and guardians
choose private schooling. Unpublished Master’s thesis.
Queen’s University.
Neibert, R. (2006). How and why CIS schools were founded in
Ontario, 1960 – present. Unpublished M.Ed Thesis. Uni-
versity of Western Ontario.
STUDIES IN EDUCATION POLICY, MAY 2007
Ontario’s Private Schools 32 The Fraser Institute

Ontario Federation of Teaching Parents (2006).
Homeschooling frequently asked questions. Digital docu-
ment available at www.ontariohomeschool.org/FAQ.
html#howmany (accessed January 20, 2007).
Ontario Ministry of Education (2002). Policy/Program Mem-
orandum 131 (June 17). Digital document available at
www.edu.gov.on.ca.
Ontario Ministry of Education (2005a). Quick facts: Ontario
Schools 2004-2005. Digital document available at
www.edu.gov.on.ca.
Ontario Ministry of Education (2005b). Private elementary
and secondary schools. Digital document available at
www.edu.gov.on.ca/eng/general/ elemsec/privsch (accessed
July 6, 2005).
Ottawa-Carleton District School Board (2006). Schools/ed-
ucational programs. Digital document available at
www.ocdsb.edu.on.ca.
Paquette, J. (2000). “Public funding for “private” education:
The equity challenge of enhanced choice.” American
Journal of Education, 111 (4): 568-595.
Purkey, S.C. and M.S. Smith (1983). “Effective schools: A
review.” Elementary School Journal, 83 (4): 427-52.
Statistics Canada (2001). “Trends in the use of private edu-
cation, 1987/88 to 1998/99.” The Daily (July 4). Digital
document available at www.statcan.ca/Daily/ English/
010704/d010704b.htm (accessed April 5, 2007).
Statistics Canada. (2004). General Social Survey of Canada,
2003. Cycle 17: Social Engagement, 1st ed. Ottawa: Sta-
tistics Canada (October 1).
Statistics Canada (2006a). Summary tables: Education. Digi-
tal document available at www41.statcan.ca.
Statistics Canada. (2006b). Census of Canada, 2001. Public
Use Microdata File. Individuals File: province 35 (On-
tario). 3rd (2nd revised) ed. Ottawa: Statistics Canada
(March 31).
Statistics Canada. (2006c). Census of Canada, 2001. Public
Use Microdata File. Families File 2001 PUMF of Fam-
ilies. 1st ed. Ottawa: Statistics Canada (January 10).
Statistics Canada (2006d). Low income cut-offs for 2005 and
low income measures for 2004. Income statistics division,
income research paper series. Catalogue no.
75F0002MIE, Vol. 4. Ottawa: Minister of Industry.
Toronto District School Board (2006). Schools. Digital docu-
ment available at www.tdsb.on.ca.
Ungerleider, C. (2003). Failing our kids: How we are ruining
our public schools. Toronto: McClelland & Stewart.
Van Pelt, D.A. (2004). Home education in Canada: A report on
the pan-Canadian study on home education 2003. Medi-
cine Hat, AB: Canadian Centre for Home Education.
Acknowledgements
Funding for this project was provided by the Society for
Quality Education (SQE), Toronto, Ontario. The au-
thors are also grateful for the additional financial support
offered by the Ontario Alliance of Christian Schools,
Ancaster, Ontario, and W. Garfield Weston Foundation,
Toronto, Ontario. Correspondence can be addressed to
Malkin Dare at SQE or to any of the research team.
The authors wish to thank the parents and heads of
schools for offering the time and commitment re-
quired to participate in our study. Without their gen-
erous participation this study would not have been
possible.
STUDIES IN EDUCATION POLICY, MAY 2007
The Fraser Institute 33 Ontario’s Private Schools

About the authors
Deani A. Van Pelt, B.Comm. (McMaster), B.Ed.
(UofT), M.Ed. (UWO), is currently completing a
Ph.D. in the Faculty of Education at The University
of Western Ontario, London, Ontario. In her posi-
tion as Assistant Professor in the Department of Ed-
ucation at Redeemer University College in Ancaster,
Ontario, she instructs courses in social foundations
of education, educational psychology, and systems of
education. As the primary investigator of a recent
milestone study on home education in Canada, she is
frequently interviewed by national media on educa-
tion policy issues. She and her husband Michael live
with their three school aged children in Ancaster,
Ontario.
Patricia A. Allison, B.Ed. (Alberta), M.Ed. (UWO)
teaches in the Faculty of Education at The University
of Western Ontario, and recently retired from many
years as an administrator and institutional researcher.
She teaches the social and legal foundations of educa-
tion and also developed (and still teaches) an elective
course on private and independent schools. She has
extensive experience as a researcher in many facets of
education.
Derek J. Allison, B.Ed., M.Ed., Ph.D. (Alberta) has
taught in the Faculty of Education at The University of
Western Ontario for thirty years, specializing in educa-
tional administration, organization and law. He has
taught the social and legal foundations of education to
thousands of teacher education candidates, and guided
hundreds of graduate students through advanced re-
search and study. Prior to beginning his academic ca-
reer, he was a teacher and principal, in England and
northern Alberta. He has an extensive publication and
research record.
Ontario’s Private Schools 34 The Fraser Institute