
Ontario_Competes
32
Ontario Competes: Performance Overview Using the 3Ts of Economic Development Benchmarking Project Overview: Ontario in the Creative Age April 2009 REF. 2009-BMONT-001
-
Upload
michael-wolfe -
Category
Documents
-
view
24 -
download
0
Transcript of Ontario_Competes

Ontario Competes: Performance Overview Using the 3Ts of Economic Development
Benchmarking Project Overview: Ontario in the Creative Age April 2009 REF. 2009-BMONT-001

Ontario Competes, April 2009
Martin Prosperity Institute REF. 2009-BMONT-001 2
Table of Contents
Introduction ............................................................................................................. 3
Technology ........................................................................................................... 4
Talent ................................................................................................................... 10
Tolerance ............................................................................................................. 19
Conclusion ............................................................................................................. 24
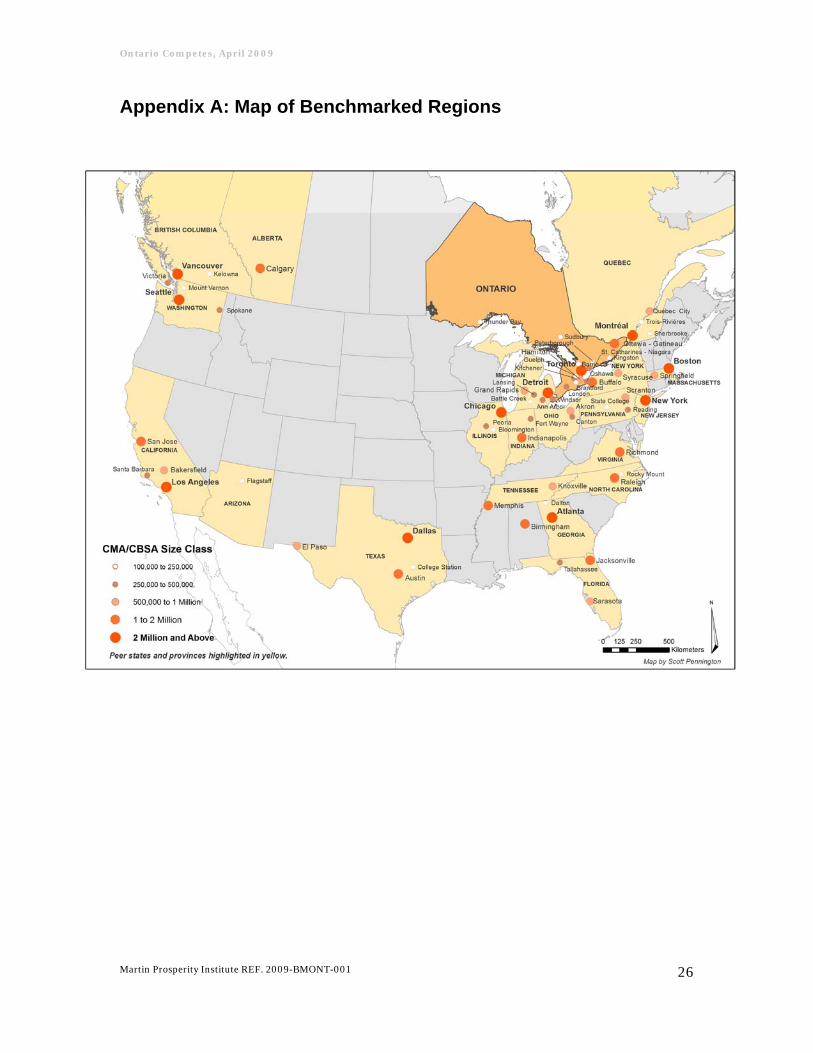
Appendix A: Map of Benchmarked Regions ......................................................... 26
Appendix B: Metric Definitions for Ontario Project Benchmarking ..................... 27
Appendix C: Research Methods ............................................................................ 28
Works Cited ........................................................................................................... 29
List of Figures
Figure 1: Patents per 10,000, Ontario and Peer Regions, 2005 ............................. 6 Figure 2: North American Tech Pole Index, Ontario and Peer Regions, 2006 ..... 8 Figure 3: Talent Index (Population >25, Bachelors and Above), 2006 ................. 13 Figure 4: Population > 25, Graduate and/or Professional Degree, 2006 ............. 14 Figure 5: Brain Drain/Gain Index, Ontario and Peer Regions, 2006 ................... 16 Figure 6: Creative Class as a Percentage of Workforce, 2006 ............................... 18 Figure 7: Mosaic Index (% Pop), Ontario and Peer Regions, 2006 ...................... 22 Figure 8: Bohemian Index, Ontario and Peer Regions, 2006 ............................. 24
List of Tables
Table 1: Overall Performance .................................................................................. 4 Table 2: North American Tech-Pole Industries by Size .......................................... 9 Table 3: Average Wages for Occupational Groups, Ontario .................................. 17

Ontario Competes, April 2009
Martin Prosperity Institute REF. 2009-BMONT-001 3
Introduction
A rising tide may lift all boats, but prosperity shouldn't have to depend on the ebb and
flow of the global economy. Some boats are more buoyant than others, and there is
nothing like a recession to focus your attention not only on staying afloat, but on
charting a course that does not leave you vulnerable to falling tides or turbulent
waters.
It is not hard to see that Ontario is a world-class economy. It has vibrant cities and
innovative companies; with its high standard of living and role as the country's
economic core⎯Ontario has a great deal to be proud of. But is it built to weather the
current economic storm and to sail into the unfamiliar waters of an ever-more
competitive global market?
Ontario's place among North America's elite jurisdictions shows just what the province
can achieve. But this implies that our competition is the world's elite jurisdictions.
Change is inevitable in a time of economic crisis, and Ontario's challenge is to navigate
change strategically and decisively, so that the province emerges not just as a
competitor, but as a global leader.
The Martin Prosperity Institute (MPI) has benchmarked Ontario and its
cities against peer regions to understand its competitiveness within North
America as part of the larger “Ontario in the Creative Age" project, with the aim
of providing input to the development of a long-term economic blueprint for the
province. The larger goal is to chart the transition from an economy based on
brawn to one of creativity. At a moment when every region is looking for ways to
become more competitive, the question is: how does Ontario stack up?
Economic development is driven by what we call the three "T"s –
technology, talent, and tolerance. All three are critical to generating sustained
economic growth and prosperity. It is great to excel at one or two; however,
sustained economic strength comes from performing well on all three.

Ontario Competes, April 2009
To see how the province fares against competition, we compared Ontario
against seventeen US states with a population of six million or more and three of
the most competitive provinces⎯Quebec, British Columbia and Alberta. (See
Appendix A for the map of peer regions.) On the traditional measures of
economic prosperity, Ontario falls behind the peer average on GDP per capita by
$5,200 (2006 CAD); moreover, the province shows weakness on lagging
indicators of economic prosperity such as job growth or wage growth.
The fact is that Ontario has been giving up ground to its competition for
some time now. Before Ontario becomes an elite economic region it must
establish its credentials in the three "T"s. This is Ontario's "Three T" report card1.
Table 1: Overall Performance
Overall Performance OntarioBenchmark Ranking
Peer Min Value
Benchmark Average
Peer Max Value
N.A. Average
Population Growth (00‐05) 6.6% 10 1.1% 6.9% 20.2% 5.4%Job Growth (00‐05) 8.2% 10 ‐1.2% 9.7% 25.9% 9.0%
GDP per capita, 2006 $44,200 18 $36,100 $49,400 $67,500 $47,200Change in Average Wage (00‐05) ‐0.2% 10 ‐4.8% 0.2% 16.1% 0.8%
Creativity Index, 2006 0.80 6 0.33 0.67 0.92 N/A
Technology
An economy is not technologically advanced because it is prosperous.
Rather, it is prosperous because it is technologically advanced. Technology, and
in particular, technological innovation, improves competitiveness by either
providing new goods or services or by inducing cost advantages, often through
productivity gains. Second, competitive advantages generate profits, which can be
redistributed back into production in the form of investment or to increasing the
average wage of employees. New ideas are what fuel economic growth.
The competition amongst the most technologically advanced regions
resembles what is a called a "race to the top" in game theory. And the way to win
a race to the top is to take the most direct route. Look for the environment where 1 See Appendix B for more information on our research methods.
Martin Prosperity Institute REF. 2009-BMONT-001 4

Ontario Competes, April 2009
Martin Prosperity Institute REF. 2009-BMONT-001 5
structural conditions direct individuals and firms to produce more efficient
outcomes, and you will find the frontrunners in the race to prosperity. Unlike
some kinds of competition, which drain the rivals' resources, a race to the top
affords efficiency gains for all of society, while the risk-taking innovators bear the
costs of the rewards they expect to reap. The more companies and individuals
you have trying to improve things, the better off the entire society will be.
The nature of competition between firms has changed over the past
decades. The marketplace for goods and services has developed from inter-firm
rivalry in relatively small geographic regions to a global battle between large
multinational corporations. At the apex of this economic ladder, regions are
separated only by marginal differences in productivity. As a result, firms within
regions are competing aggressively for the smallest technological advantages over
their rivals. What this means is that if you're not innovating, you are not only
failing to grow, you are giving your rivals room to do so. There is no stasis in this
game.
To determine how Ontario stacks up technologically against its
competitors, we looked at two indicators: how much innovation is simmering in
the province, and how important technology-related industries are to the
economy.
A great way to measure technological innovation is to track applications
for patents. Patents are used to guarantee inventors a period of time to recoup
the cost associated with bringing new ideas to the market. In the process of
patenting products, inventors disclose information related to the product so that
others may learn and benefit from their work. Patents promote the accumulation
and growth of knowledge in the public rather than in the private sphere. You
need patent protection to foster innovation, just as you need innovation to spur
patent applications.

Ontario Competes, April 2009
The sobering fact is that Ontario is below average in patent output,
ranking 13th out of 21 amongst its peer states and provinces in 2005. With only
1,467 patents, Ontario’s total output was only slightly greater than Arizona and
just behind North Carolina. California, with 17,961, has set the standard for
innovation and technology that any region in the world could aspire to.
Figure 1: Patents per 10,000, Ontario and Peer Regions, 2005
0.81
0.89
0.96
1.21
1.24
1.25
1.26
1.30
1.75
1.82
1.84
2.01
2.14
2.24
2.36
2.43
2.91
3.32
3.57
4.82
4.93
Quebec
Alberta
Tennessee
Ontario
Virginia
British Columbia
Florida
Georgia
Indiana
North Carolina
Pennsylvania
Ohio
Illinois
Texas
Arizona
New York
New Jersey
Michigan
Washington
Massachusetts
California
Source: Martin Prosperity Institute and Dieter Franz Kogler Analysis. USPTO (1975-07)
To adjust for the size difference between the regions, we calculated the
number of patents per 10,000 people. California remains the clear leader, with
almost 5 patents per 10,000 people. But Ontario’s ranking falls further to 17th
amongst its peers, with only 1.2 patents produced for every 10,000 people, which
Martin Prosperity Institute REF. 2009-BMONT-001 6

Ontario Competes, April 2009
Martin Prosperity Institute REF. 2009-BMONT-001 7
puts it just behind Georgia, Florida and Virginia. Ontarians are simply not
innovating at the same pace as their competitors.
However, the picture that emerges is not entirely disheartening. Ontario
does significantly better than its peer provinces of Quebec, Alberta and British
Columbia, which rank 19th, 20th and 21st respectively (See Figure 1). More
importantly, Ontario's performance has been improving steadily. Over the last
three decades the province's year-over-year patent growth has been 11.5%, well
above that of California and New York.
But patent activity measures only catalogued innovation, not the
importance of that technology to the economy. The North American Tech-Pole
Index is an indicator designed to capture the size and importance of tech
industries in a region. A high ranking indicates a region with a significant level of
activity in high-tech industries. The level of activity is not tied to the total
economic output but rather to the number of people employed. Here Ontario fares
much better.
Not surprisingly, California tops our list of regions scoring more than three
times higher than its closest peer, Texas. But Ontario is near the top of the list,
ranking an impressive 4th overall (See Figure 2). The index shows that the level of
technological production in the province is highly competitive in the North
American context, surpassing both Massachusetts and New York State.
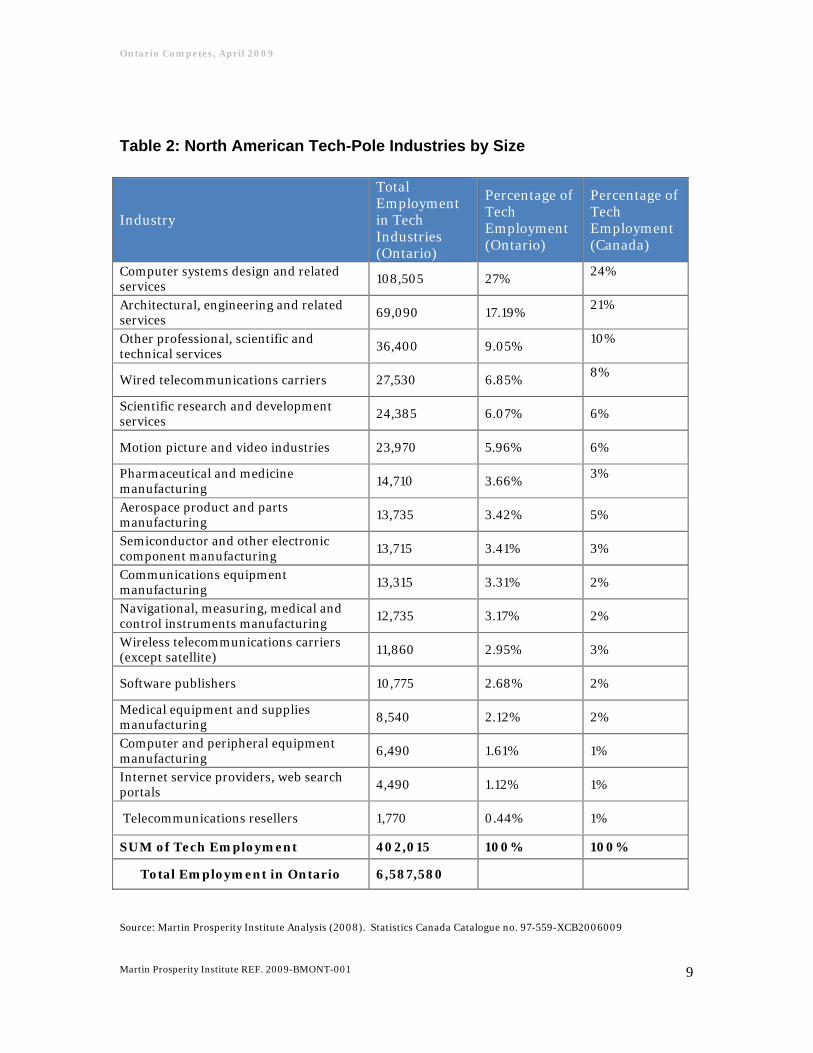
A look at the breakdown of the industries on the Tech-Pole Index gives a
sense of the breadth of technological employment in the province. There are
402,015 people employed in the high-tech industries in Ontario, contributing just
over $53 billion CAD (2005) or 11% of the GDP of Ontario. To give a sense of how
important these jobs are to the province's economy, the GDP per capita of people
employed in these industries is $133,000⎯more than three times the Ontario
average of $44,200. Even more interesting is that it is $78,000 more than the
Ontario auto manufacturing industries, which contributes approximately $17.3
billion a year, or 3.2% percent of the provincial GDP. This differential is
Ontario Competes, April 2009
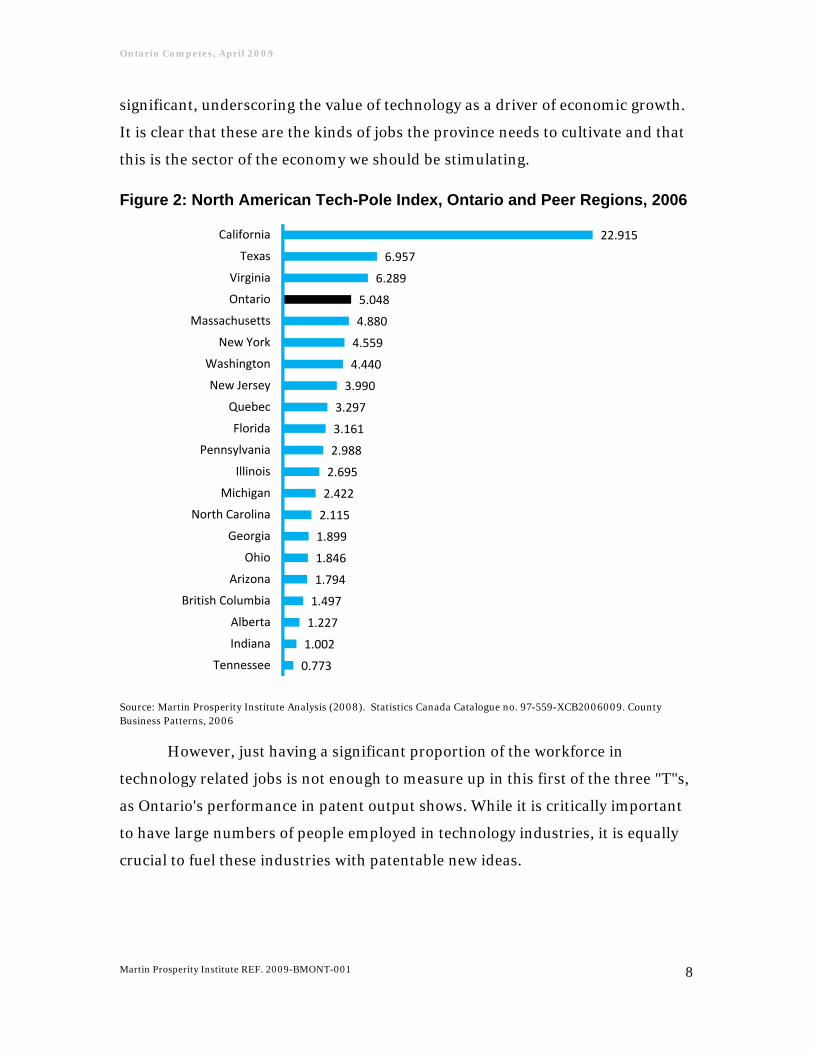
significant, underscoring the value of technology as a driver of economic growth.
It is clear that these are the kinds of jobs the province needs to cultivate and that
this is the sector of the economy we should be stimulating.
Figure 2: North American Tech-Pole Index, Ontario and Peer Regions, 2006
0.773
1.002
1.227
1.497
1.794
1.846
1.899
2.115
2.422
2.695
2.988
3.161
3.297
3.990
4.440
4.559
4.880
5.048
6.289
6.957
22.915
Tennessee
Indiana
Alberta
British Columbia
Arizona
Ohio
Georgia
North Carolina
Michigan
Illinois
Pennsylvania
Florida
Quebec
New Jersey
Washington
New York
Massachusetts
Ontario
Virginia
Texas
California
Source: Martin Prosperity Institute Analysis (2008). Statistics Canada Catalogue no. 97-559-XCB2006009. County Business Patterns, 2006
However, just having a significant proportion of the workforce in
technology related jobs is not enough to measure up in this first of the three "T"s,
as Ontario's performance in patent output shows. While it is critically important
to have large numbers of people employed in technology industries, it is equally
crucial to fuel these industries with patentable new ideas.
Martin Prosperity Institute REF. 2009-BMONT-001 8
Ontario Competes, April 2009
Martin Prosperity Institute REF. 2009-BMONT-001 9
Table 2: North American Tech-Pole Industries by Size
Industry
Total Employment in Tech Industries (Ontario)
Percentage of Tech Employment (Ontario)
Percentage of Tech Employment (Canada)
Computer systems design and related services
108,505 27% 24%
Architectural, engineering and related services 69,090 17.19%
21%
Other professional, scientific and technical services
36,400 9.05% 10%
Wired telecommunications carriers 27,530 6.85% 8%
Scientific research and development services
24,385 6.07% 6%
Motion picture and video industries 23,970 5.96% 6%
Pharmaceutical and medicine manufacturing
14,710 3.66% 3%
Aerospace product and parts manufacturing 13,735 3.42% 5%
Semiconductor and other electronic component manufacturing
13,715 3.41% 3%
Communications equipment manufacturing 13,315 3.31% 2%
Navigational, measuring, medical and control instruments manufacturing
12,735 3.17% 2%
Wireless telecommunications carriers (except satellite) 11,860 2.95% 3%
Software publishers 10,775 2.68% 2%
Medical equipment and supplies manufacturing 8,540 2.12% 2%
Computer and peripheral equipment manufacturing
6,490 1.61% 1%
Internet service providers, web search portals 4,490 1.12% 1%
Telecommunications resellers 1,770 0.44% 1%
SUM of Tech Employment 402,015 100% 100%
Total Employment in Ontario 6,587,580
Source: Martin Prosperity Institute Analysis (2008). Statistics Canada Catalogue no. 97-559-XCB2006009

Ontario Competes, April 2009
Martin Prosperity Institute REF. 2009-BMONT-001 10
Ontario’s economic environment for technology is not significantly
different than that of New York, Massachusetts or any other region that
outperforms Ontario. As a share of total employment, Ontario’s high-tech
industry employment is amongst the highest in North America. Yet the relative
dearth of innovation suggests that while Ontario is a region able to support
technological industries, it is not one leading the charge in the global race to the
top.
Ontario, on the whole, is a reactive region taking in new technologies and
products from around the world, creating new markets and demand but not
taking advantage of its own technological strengths or taking the entrepreneurial
risks required to bring new ideas to market. These industries are major
employers but they are not innovators on the scale required to hold on to their
most talented people. Ontario’s future success is in large part dependent on
creating a jurisdiction that not only promotes technology, but excels in it. This is
a difficult challenge as there is no clear route to creating an environment that is
adaptive, creative and innovative. However, Ontario can better utilize its growing
pool of Talent and strength in Tolerance to help facilitate technologically driven
growth. As such, we will turn our discussion to these factors.
Talent
One key to improving Ontario's ranking against its technological peers is
the performance of the province's talent, the second of the three "T"s. Ontario
requires its creative people to provide the innovation necessary to compete
globally. How the province stacks up against the competition will go a long way
towards determining the kind of prosperity we can look forward to.
There are a number of ways to measure something as intangible as talent,
but they fall into two categories: education level and occupation. Education is a
good proxy for talent⎯measure the population's education level and you begin to

Ontario Competes, April 2009
Martin Prosperity Institute REF. 2009-BMONT-001 11
get a sense of what it is capable of achieving. And looking at what those people
actually do day in and day out is a good way measuring how talented they are.
Talent's role in regional development is not entirely straightforward. It is
not a commodity in the traditional sense or a product that the individual can use.
Talent enhances a region’s prosperity, and through this the individual benefits.
This process occurs through a number of mechanisms, such as the attraction of
business and the utilization of knowledge and skills to the creation of new ideas,
which in turn lead to greater economic productivity.
Talent is the driving force behind production. Talented people generate
ideas and bring them to market. And it is a talented workforce that innovates and
develops the technologies that stimulate economic development. Moreover, this
dependence on talent only increases in a global economy marked by the flow of
new ideas and the sharing of knowledge. Talent breeds talent.
The processes that allow a region to perform well on talent are not
accidental. There are distinct ways in which a region can concentrate its efforts
to improve upon its talent base. By creating, attracting, and retaining talent, a
region can achieve advantages over other places. Although regional advantage
was once limited to transportation access, natural resources and the costs of
labour, this is no longer the case. Talent is becoming increasingly uneven and
divergent between regions. And, while talent creation is important, the regions
that can successfully attract and retain talent will ultimately be the most
competitive. More than ever before, talented workers have the ability to locate
wherever they desire. An excellent example of this would be Silicon Valley, which
acts as a talent magnet, drawing talented workers from all over North America
and globally. These workers have in turn created some of the most successful
companies in the world, thus it is no surprise that Northern California is an
incredibly prosperous region.
But while great migrations of talented people mean that some places swell
with creative, innovative people, things do not look as promising if you live in one

Ontario Competes, April 2009
Martin Prosperity Institute REF. 2009-BMONT-001 12
of the places where your talented neighbours are packing up to head to more
prosperous locales. The sobering reality is that if you are not attracting talent, you
are probably losing it. In the race to the top, those in front just get faster, while
those tailing tend to stay behind. As with the other two "T"s, the point is not for
the province just to perform decently. Ontario's goal must be to rank among the
very best globally competitive jurisdictions.
Given the importance of creative, innovative people to a region's economy,
Ontario has a lot of ground to make up. The two measures of education we have
used are the Talent Index, and Graduate and Professional Degrees. The Talent
Index is the percentage of a region’s population with a bachelor’s degree (BA) or
above, and Graduate and Professional Degrees is the percentage of a region’s
population whose highest level of achievement is an advanced degree. Neither
index provides very reassuring news for Ontario.
Ontario ranks 16th out of 21 on the Talent Index, with Massachusetts
ranking 1st and a number of less competitive states also outperform the province
(See Figure 3). Ontario fares slightly better on Graduate and Professional
Degrees, ranking 12th out of 21, but is still among the bottom half of its peers with
only 9% of people having obtained these important degrees (See Figure 4). The
province underperforms considerably on both measures of human capital,
ranking lower than even some of the least competitive regions, such as Michigan.
The province's race to the top begins from somewhere near the back of the pack.
What is truly surprising is that researchers affiliated with the Martin
Prosperity Institute have shown that college degrees have no significant impact
on income, and are unlikely to affect regional development.2 If we want to
improve Ontario's performance, we will need to put our investments where they
are most effective.
1 MPI Working Paper - Richard Florida, Charlotta Mellander, Kevin Stolarick (2009). Talent, Technology and Tolerance in Canadian Regional Development

Ontario Competes, April 2009
Figure 3: Talent Index (Population >25, Bachelors and Above), Ontario and Peer Regions, 2006
18.1%
19.8%
21.4%
21.7%
21.7%
22.8%
23.0%
24.5%
24.7%
24.8%
25.3%
25.4%
25.5%
26.6%
28.9%
29.0%
30.5%
31.2%
32.7%
33.4%
37.0%
Quebec
Alberta
British Columbia
Tennessee
Indiana
Ontario
Ohio
Michigan
Texas
North Carolina
Florida
Pennsylvania
Arizona
Georgia
Illinois
California
Washington
New York
Virginia
New Jersey
Massachusetts
Source: MPI Analysis (2008). Statistics Canada Catalogue no. 94-581-XCB2006007. US Census Bureau, American Community Survey. (2006).
Martin Prosperity Institute REF. 2009-BMONT-001 13

Ontario Competes, April 2009
Figure 4: Population > 25, Graduate and/or Professional Degree, Ontario and Peers, 2006
Source: Statistics Canada Catalogue no. 94-581-XCB2006004. U.S. Census Bureau, 2006 American Community Survey
6.3%
6.6%
7.5%
8.0%
8.0%
8.1%
8.3%
8.3%
8.9%
9.0%
9.2%
9.2%
9.2%
9.6%
10.4%
10.7%
10.8%
12.4%
13.2%
13.3%
15.6%
Alberta
Quebec
Tennessee
Indiana
Texas
British Columbia
Ohio
North Carolina
Florida
Ontario
Michigan
Arizona
Georgia
Pennsylvania
California
Washington
Illinois
New Jersey
Virginia
New York
Massachusetts
One positive indicator along this dimension shows both what the province
is doing effectively and how it is falling short. The Brain Drain/Gain Index
measures the number of people graduating with degrees in Ontario, versus the
number of people working with degrees in the province. It tells us roughly what
direction a region's talent is headed. A Brain Drain/Gain Index number of over
1.0 indicates that a region is attracting educated workers, and a number of less
than 1.0 indicates that a region is losing them to other places.
Ontario performs quite well on this measure, ranking 6th of 21 with an
Index number of 1.34. (See Figure 5). The ability to attract talent is the mark of a
Martin Prosperity Institute REF. 2009-BMONT-001 14

Ontario Competes, April 2009
Martin Prosperity Institute REF. 2009-BMONT-001 15
vibrant culture and economy, and is itself a real achievement. But Ontario's
performance reveals a dependence on talent developed elsewhere, which is a
vulnerability. If Ontario could develop talent at the same pace it attracts it, the
province would climb these indices and, more importantly, show measurable
gains in innovation.
Although education shows a high correlation with regional development, it
is not the only indicator of talent. Talent is measured by other factors, and
creativity is an extremely important dimension. Unfortunately, capturing the
creative component of talent is difficult when using education levels as a
measure. The inability of education to properly describe all aspects of talent
forces us to use other indicators as well if we want a complete picture. Instead of
looking just at what people know, we need to look at what they actually do3.
Occupational skill affects wages, and through this leads to increases in
regional labour productivity. It is a dynamic measure which makes occupation an
excellent measure of talent, and has been shown to have strong relationships with
regional development. Looking at specific occupations, we can measure the
creative component of a region’s workforce; if you can figure out how creative a
region's workforce is, you can benchmark how talented it is. Creative workers are
important to Ontario because of their ability to invent and innovate. Companies
locate in cities and regions with large numbers of creative workers in order to
capture the benefits these people offer. Not only do good companies attract good
people; good people attract good companies.
3 MPI Working Paper - Karen King, Charlotta Mellander, Kevin Stolarick (2009). What You Do, Not Who You Work For: A Comparison of the Occupational and Industry Structures of Canada, the United States, and Sweden

Ontario Competes, April 2009
Figure 5: Brain Drain/Gain Index, Ontario and Peer Regions, 2006
0.92
0.92
0.94
0.98
1.07
1.07
1.11
1.16
1.18
1.19
1.20
1.22
1.25
1.26
1.30
1.34
1.35
1.39
1.43
1.74
1.88
Michigan
Ohio
Indiana
Pennsylvania
Tennessee
Quebec
North Carolina
New York
Illinois
Florida
California
Texas
Arizona
Massachusetts
Georgia
Ontario
Virginia
New Jersey
Washington
British Columbia
Alberta
Source: Statistics Canada. Postsecondary Student Information System (PSIS). U.S. Census Bureau, 2006 American Community Survey
Creativity in Ontario is measured by examining jobs that pay a person to
think; this is in contrast to most working class jobs, which require routine
physical inputs. We refer to this group of creative workers as creativity-oriented,
or the Creative Class. Although the exact definition of the Creative Class is not
fixed and will change over time as the requirements of various occupations
change, it is possible to identify the occupations which currently can be
considered as ‘creative’ work. Broadly, the acronym TAPE is used to describe the
Creative Class. It stands for Technology, Arts and Culture, Professionals,
Educators⎯people who add economic value by using their creativity. Generally,
the Creative Class includes senior and specialist managers, high-ranking business
Martin Prosperity Institute REF. 2009-BMONT-001 16

Ontario Competes, April 2009
and finance positions, health care professionals, scientists and advanced
technicians, educators, professional occupations in arts, culture and sport, and
thinkers like judges, lawyers, social workers and psychologists. The important
characteristic these occupations share is their intellectual autonomy. These
people are not only paid to think, but to make decisions.
Table 3: Average Wages for Occupational Groups, Ontario
Source: Martin Prosperity Institute analysis based on data from Statistics Canada, Census 2006. Note: FFF occupations only account for 1.5% of the workforce and have an employment income of $26,400
Ontario Wages Creative Class Working Class Service Class Average $64,100 $37,500 $30,900
The Creative Class approximates the talent a region possesses. Simply by
looking at the average full-time wages in Ontario by occupational class, we can
see the tremendous difference for the individual, and the indirect effect it should
have on the provincial economy. Above are the full-time and part-time average
employment incomes for the Creative Class, Service Class, and Working Class in
Ontario. The difference in average wage between these class groupings is
significant and demonstrates the varying role that certain occupations have on
prosperity. Just as technology fuels a modern economy, so does talent.
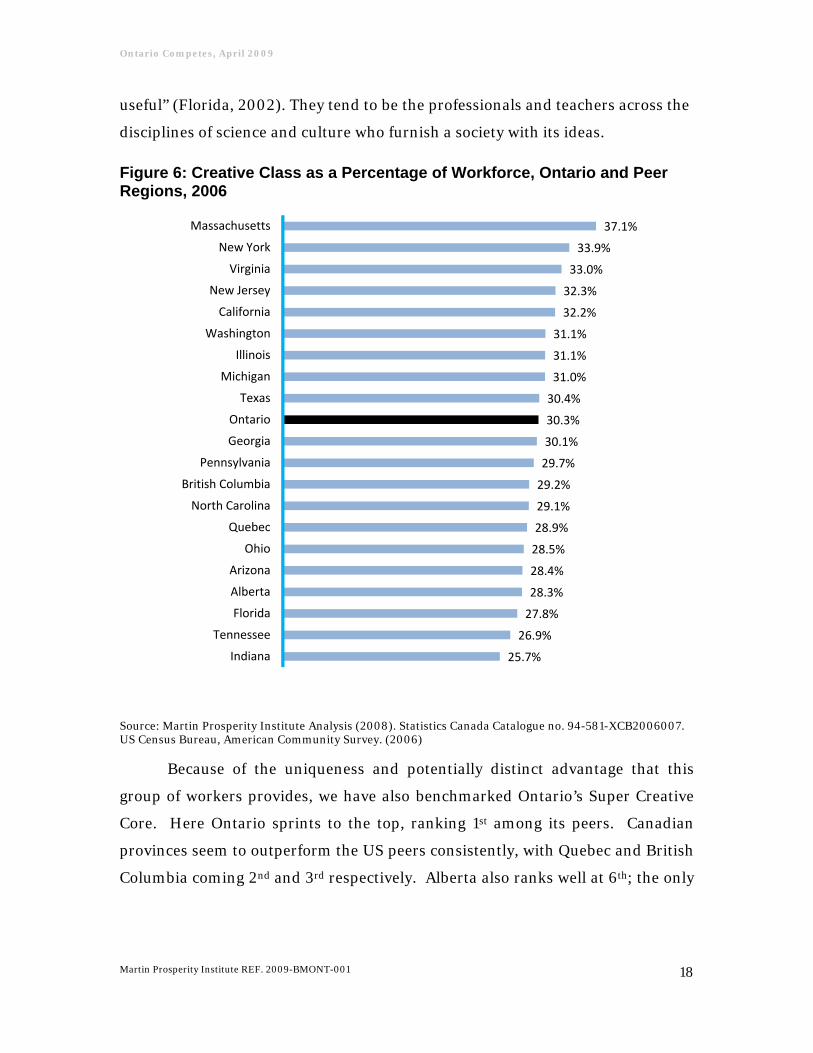
Despite its disappointing performance on education measures, Ontario
performs moderately well on the Creative Class indicator. Ontario ranks 10th out
of 21 on the Creative Class against its peers (See Figure 6). With 30.3% of the
workforce employed in Creative Class occupations, Ontario ranks only slightly
below the nine peers above. Only Massachusetts has a considerably higher
percentage of Creative Class workers. Measured by what we do rather than what
we know, our workforce begins to look a little more talented. And we look better
still when we focus on a subsection of the Creative Class that has been identified
as the Super Creative Core. These people are considered to be extremely creative,
developing new knowledge across many fields of study and work in occupations
“that produce new forms and ideas that are readily transferable and widely
Martin Prosperity Institute REF. 2009-BMONT-001 17
Ontario Competes, April 2009
useful” (Florida, 2002). They tend to be the professionals and teachers across the
disciplines of science and culture who furnish a society with its ideas.
Figure 6: Creative Class as a Percentage of Workforce, Ontario and Peer Regions, 2006
25.7%
26.9%
27.8%
28.3%
28.4%
28.5%
28.9%
29.1%
29.2%
29.7%
30.1%
30.3%
30.4%
31.0%
31.1%
31.1%
32.2%
32.3%
33.0%
33.9%
37.1%
Indiana
Tennessee
Florida
Alberta
Arizona
Ohio
Quebec
North Carolina
British Columbia
Pennsylvania
Georgia
Ontario
Texas
Michigan
Illinois
Washington
California
New Jersey
Virginia
New York
Massachusetts
Source: Martin Prosperity Institute Analysis (2008). Statistics Canada Catalogue no. 94-581-XCB2006007. US Census Bureau, American Community Survey. (2006)
Because of the uniqueness and potentially distinct advantage that this
group of workers provides, we have also benchmarked Ontario’s Super Creative
Core. Here Ontario sprints to the top, ranking 1st among its peers. Canadian
provinces seem to outperform the US peers consistently, with Quebec and British
Columbia coming 2nd and 3rd respectively. Alberta also ranks well at 6th; the only
Martin Prosperity Institute REF. 2009-BMONT-001 18

Ontario Competes, April 2009
Martin Prosperity Institute REF. 2009-BMONT-001 19
US peers higher are Virginia and Massachusetts, two states that have consistently
ranked highly on measures of talent.
This silver lining may be wrapped in another layer of bad news, since it is
possible that Canadians are working less hours, or less efficiently, and thus are
forced to hire more people for the same tasks. But the fact is that Canada, in
general, and Ontario in particular, has a wealth of people working in super-
creative occupations to help steer our economy into the future.
When you rank number one in something, you have every reason to
believe you are doing something right and there is no doubt that Ontario has
done well in fostering its Creative Class. But that should not be allowed to
obscure the fact that the province is at a disadvantage in education compared to
its peers. The lack of human capital in Ontario will prove to be detrimental in the
long run. Whether this is due to a problem with talent creation, attraction or
retention, it is important to perform well on both occupation and education
measures. The two are complementary, not offsetting, and both are important to
success. The peer regions we have used are very competitive, but that is just the
point. These regions are Ontario’s competition, and the province must strive to
perform at or above their level. Currently Ontario is underperforming on these
measures, and, as one of the critical components for economic development this
deficiency must be corrected.
Tolerance
So far, we have focused primarily on how talent and technology are
important to Ontario’s continued success, but little has been said of how
the province can improve in these areas. This is the role the third "T"
plays in regional development: talent is attracted to a place by tolerance of
other views, ethnicities, and sexual orientations, and that talent in turn
generates technology and economic development. While tolerance is not

Ontario Competes, April 2009
Martin Prosperity Institute REF. 2009-BMONT-001 20
normally considered vital to economic growth, openness and inclusiveness
are not just ethical goals⎯they imply whole new ways of thinking that lead
to innovation. John Stuart Mill (1869) recognized long ago that tolerance
is essential to objective thinking. The toleration of diverse opinions allows
an intellectual freedom that is just not available when the individual rights
of the person are not given their fullest expression.
In other words, a society should strive for tolerance not for the sake of the
people it is called upon to tolerate, but for everyone's benefit. We all benefit from
tolerance and positive attitudes towards diverse points of view. It is only when
everyone is free to express diverse opinions that we can fully explore the world.
Just as technology breeds technology, and talent attracts talent, tolerance leads to
more tolerance. It attracts the Creative Class.
The Creative Class can be defined along two lines. First, they prize
individuality and the opportunity for self-expression. Second, they very clearly
value diversity and openness; in fact, the very idea of an occupationally defined
creative class cuts across all classifications based on ethnicity, gender, or sexual
orientation. A bellwether subgroup of this class is what we call Bohemians, or the
artists and iconoclasts that keep a culture fresh and fizzing with new ideas.
Bohemians do not seek to be at the core of accepted culture; they would rather
remain on the edge where they can be individuals, and allowed freedom of self-
expression. A vibrant economy relies on these people for innovation, and
tolerance of the new and challenging is what attracts and keeps them around. The
regions and cities with the highest concentrations of bohemians tend to be the
world's most exciting and prosperous, just as tolerant regions provide talent the
space necessary to conduct research and to engage in activities that may not be
possible in less open and diverse places.
The level of tolerance in a society or region can only be approximated. To
understand the variation in tolerance between different North American
jurisdictions we use five variables which measure diversity as a marker of

Ontario Competes, April 2009
Martin Prosperity Institute REF. 2009-BMONT-001 21
tolerance: the Mosaic Index, Visible Minorities Index, the Bohemian Index, the
Integration Index and the Gay and Lesbian Index indicate the openness and
diversity of regions. The Bohemian, Gay and Lesbian, and Mosaic index are used
as the main indicators of openness. (The Integration Index, which measures
whether racial groups live together in a community is not included at the
provincial level because it is a meant for analysis of urban regions, but it will form
an important part of the analysis of Ontario’s CMAs.) The diversity of a region,
which is measured by the Visible Minority Index, indicates low barriers to entry.
A tolerant and inclusive culture does not guarantee success, but it does
provide greater access for everyone. Tolerance acts to equalize differences; it
facilitates talent by embracing difference and focusing on merit. Of course,
tolerance does not magically erase all inequalities, but it works towards this goal.
Ontario has a culture of tolerance. People from all over the world come to live
here. While Ontario does have a core cultural group, it does not exclude other
groups on the periphery from accessing the public sphere. So it may not come as
a surprise that the province performs well on tolerance measures, and is in fact a
North American leader.
Ontario can be proud of its rank on the Mosaic Index: 1st out of 21. The
Mosaic Index measures the proportion of the total population that is foreign
born. As an indicator of tolerance the Mosaic Index helps describe the ability of a
region to attract and retain the immigrants needed in today’s global competition
for talent. Regions that fail to do so miss the opportunity to add new high-skill
workers that generate economic value to their labour force. They also lose the
potential creative and innovative output that often flows from the interaction of
cultures. With 27.9% of Ontario’s population being foreign born, Ontario is only

Ontario Competes, April 2009
Figure 7: Mosaic Index (% Pop), Ontario and Peer Regions, 2006
3.6%
3.9%
4.2%
5.1%
5.9%
6.9%
9.2%
10.1%
11.3%
12.4%
13.8%
14.1%
15.1%
15.9%
16.0%
18.9%
20.1%
21.6%
27.2%
27.2%
27.9%
Ohio
Tennessee
Indiana
Pennsylvania
Michigan
North Carolina
Georgia
Virginia
Quebec
Washington
Illinois
Massachusetts
Arizona
Texas
Alberta
Florida
New Jersey
New York
California
British Columbia
Ontario
Source: Martin Prosperity Institute Analysis (2008). Statistics Canada Catalogue no. 94-581-XCB2006007. US Census Bureau, American Community Survey. (2006).
slightly ahead of British Columbia and California, which have 27.2% foreign-born
populations. (See Figure 7) What is most remarkable though is the wide range in
our results. What is clear is that immigrants heavily favour some places over
others4. Those regions hold an immense diversity advantage.
Ontario performs adequately on the Visible Minority Index, however due
to large amount of non-immigrant visible minorities in certain US states Ontario
ranks lower than one might expect. With 22.6% of the population classified as
Martin Prosperity Institute REF. 2009-BMONT-001 22
4 MPI Working Paper - Karen King (2009). The Geography of Immigration in Canada: Settlement,
Education, Labour Activity and Occupation Profiles

Ontario Competes, April 2009
Martin Prosperity Institute REF. 2009-BMONT-001 23
visible minorities, 1 in 5 Ontarians would fall under this category. However,
California dwarfs Ontario’s numbers at 40.2%.
The third indicator used to judge Ontario’s tolerance is the Gay and
Lesbian Index. This measure compares the share of same-sex couples in a region
to the national share of same-sex couples. The presence of same sex couples and a
large gay population in general tends to correspond not only with openness but
prosperity as well. Ontario’s performance on this indicator is decent as well,
ranking 11th out of 21, with a location quotient of 1.00 meaning that the
proportion of gay and lesbians in North America is the same as Ontario.
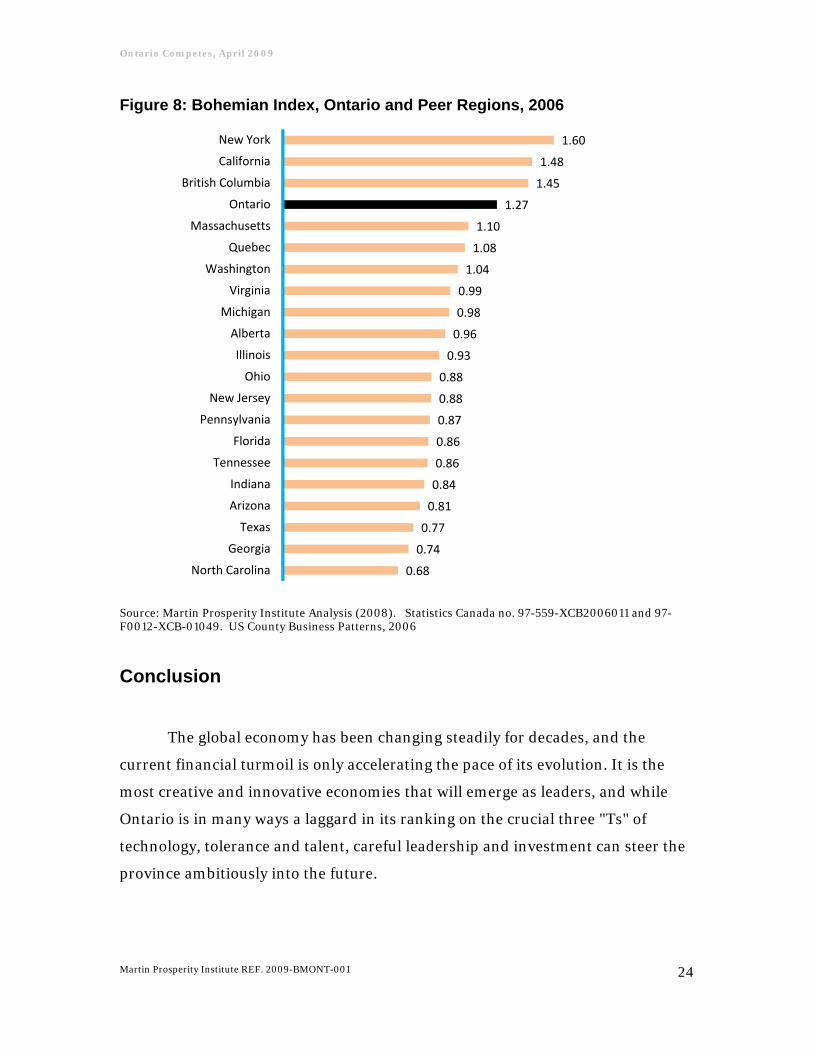
Finally, we created the Bohemian Index in an attempt to measure the
freedom individuals have to express themselves in a given region. The index
measures whether the number of bohemians in a region is greater or less than the
average. Ontario ranks a respectable 4th out of 21 on the Bohemian Index, trailing
only New York, California, and British Columbia (See Figure 8).
It is not difficult to see what Ontario does well. The province's culture of
tolerance has created a place for Ontario among North America's most
competitive jurisdictions. Ontario is a magnet for exactly the kind of people we
need to nourish economic growth and cross the threshold between an economy
built on brawn to one fuelled by brains. We need the infusion of new ideas that
comes with rubbing shoulders with different cultures and perspectives, and our
tolerance should ensure that we keep building on this strength.
Ontario Competes, April 2009
Figure 8: Bohemian Index, Ontario and Peer Regions, 2006
0.68
0.74
0.77
0.81
0.84
0.86
0.86
0.87
0.88
0.88
0.93
0.96
0.98
0.99
1.04
1.08
1.10
1.27
1.45
1.48
1.60
North Carolina
Georgia
Texas
Arizona
Indiana
Tennessee
Florida
Pennsylvania
New Jersey
Ohio
Illinois
Alberta
Michigan
Virginia
Washington
Quebec
Massachusetts
Ontario
British Columbia
California
New York
Source: Martin Prosperity Institute Analysis (2008). Statistics Canada no. 97-559-XCB2006011 and 97-F0012-XCB-01049. US County Business Patterns, 2006
Conclusion
The global economy has been changing steadily for decades, and the
current financial turmoil is only accelerating the pace of its evolution. It is the
most creative and innovative economies that will emerge as leaders, and while
Ontario is in many ways a laggard in its ranking on the crucial three "Ts" of
technology, tolerance and talent, careful leadership and investment can steer the
province ambitiously into the future.
Martin Prosperity Institute REF. 2009-BMONT-001 24

Ontario Competes, April 2009
Martin Prosperity Institute REF. 2009-BMONT-001 25
The province is already a leader in tolerance, and must foster this
advantage and leverage it to improve in technology and talent. But it cannot
afford to wait for ideas and innovators to arrive. At a time when the province is
called upon to invest, it must mobilize its assets where they will yield the
strongest return: not in propping up the fading artifacts of an old economy, but in
bolstering the competitive advantages of the new one. We have fallen behind our
peers by a wide margin in education. However, increasing the proportion of the
population with at least a bachelor’s degree from 22.3 percent to the peer median
of 25.3 percent is an attainable milestone that would not only move the province
up the rankings, but would also increase the pace of patenting and innovation in
Ontario.
The continued development of an already strong culture of tolerance can
help attract and retain the talent to make the prior two goals a reality: improving
talent and technology through tolerance. Ontario has slipped in the past decades
from an elite among its peers to an unassuming spot in the middle of the pack.
But it still has many robust strengths and glittering advantages, like its
impressive Creative Class. If the province deploys its three "Ts" judiciously,
Ontario is poised to begin making up lost ground in the race to the top.
Ontario Competes, April 2009
Appendix A: Map of Benchmarked Regions
Martin Prosperity Institute REF. 2009-BMONT-001 26

Ontario Competes, April 2009
Appendix B: Metric Definitions for Ontario Project Benchmarking
Population Population Counts from ACS and Statistics Canada, 2006Median Age Median Age from ACS and Statistics Canada, 2006Overall Cost of Living Index Composite measure that use CPI data from both the US and Canada.
Population Growth (2000-2005) (Population(2006) - Population(2001))/Population(2001)
Job Growth (2000-2005)(Labor Force, Total Employment(2006) -Labor Force, Total Employment(2001))/Labor Force, Total Employment(2001)
GDP per Capita, 2006 GDP/Population, PPP adjustedChange in Average Wage (2000-2005) (Average Wage(2000) -Average Wage(2001))/Average Wage(2001)
Creativity IndexState and Province: Technology (North American Tech Pole, Patent Growth (00-05) and Total Patents, Tolerance ( Bohemian Index, Integration Index, Gay Index and Mosaic Index), Talent (Creative Class) each account for 1/3 of index
Total Patents, 2005Total number of patents issued to primary inventors in region 2005; US Patent & Trademark Office (USPTO)
Patents per 10,000, 2005 Total patents issued per 10,000 residents 2005; USPTO & U.S. CensusPatent Growth, Short Term (00-05) Average annual growth in number of patents issued 2000-2005; USPTO
North American High Tech LQ, 2006
A location quotient captures the difference between a specific regions concentration of a specific characteristic and the average concentration across the entire country or larger regions. The high tech LQ measures the concentration of high technology among employment for a region against the concentration of high technology among employment for the US and Canada combined.
North American Tech Pole IndexCombination of two factors (1) the share of a region's employment that is high-tech and (2) the high tech location quotient (below) for U.S and Canada combined. High Tech includes software, electronics, biomedical products, and engineering
Creative Class, 2006Percentage of the employed population in the region in the Super Creative occupations (see below) or occupations in the following categories: Management, Business/Finance, Law, Healthcare(does not include Healthcare support)
Super Creative Core, 2006Percentage of the employed population in the region in occupations in the following categories: Computers, Architecture/Engineering, Science, Education, Arts and Design
Pop> 25, Above High School Below BA, 2006Percentage of the population aged 25 and above in the region that has a high school diploma orequivalent and Percentage of the population aged 25 and above in the region that has a college certificate (associate's degree for U.S.)
Talent Index (Pop >25, BA and Above) Percentage of the population aged 25 and above with a bachelor's degree or higherGraduate and/or Professional Degree Percentage of population aged 25 and above with a graduate and or professional degree
Brain Gain/ Brain Drain IndexPercentage of the workforce, age 25 and above, with at least a college certificate divided by the percentage of the population age 20 to 24 currently attending college or university
Visible Minorities (% Pop) Percentage of Non-white populationMosaic Index (% Pop) Percent of population that is foreign born
Gay and Lesbian IndexLocation quotient that is the ratio of same sex unmarried partners to total partners in the region over same sex unmarried partners to total partners for the entire U.S. (from 2000); Census
Bohemian IndexBohemian Index; Location quotient that measures whether a region has more or fewer professional artistically creative people than the average region 2006; estimated from Census, ACS
Integration Index Where VGroupDA,G is the population of group G in the dissemination area And where VGroupDA,H is the population of group H in the dissemination areaWhere VGroupG is the total population of group G in the CMAWhere VGroupH is the total population in group H in the CMA
Tolerance (Inclusiveness) Measures
Summary Statistics
Overall Statistics
Technology Measures
Talent Measures
Martin Prosperity Institute REF. 2009-BMONT-001 27

Ontario Competes, April 2009
Martin Prosperity Institute REF. 2009-BMONT-001 28
Appendix C: Research Methods
The process of benchmarking the Province of Ontario and its 15 Census Metropolitan Areas (CMAs) against peer regions in both the United States and Canada was conducted as part of the Ontario in the Creative Age project commissioned by the government of Ontario. In order to better understand the competitiveness of Ontario and its CMAs we conducted a quantitative analysis of North America by collecting data from national statistical agencies on over 30 different indicators that have been shown to influence regional economic prosperity. These collections of indicators developed by Florida (2002) are representative of the 3Ts of economic development (Technology, Talent and Tolerance) and are part of his larger Creative Class theory. In selecting the North American regions for the benchmarking, the main determinate of peers for Ontario’s CMAs was population. Population is a highly important variable to control for because each of the following factors is size and density dependent: the division of labour, economies of scope, agglomeration and scale. In total we compared the province to 20 peer states and provinces, selecting sub-national regions with a population of 6 million or more (17 states) and the 3 largest provinces (Quebec, British Columbia and Alberta). For the CMAs which range from Toronto with a population of 5.1 million to Peterborough with just under 120,000 people, we subdivided the 15 regions into five class categories (Population >2 million, 1-2 million, 0.5-1 million, 250,000-500,000 and 100,000-250,000) for which 10 peer regions having a similar population were selected. In total 50 peer regions were selected from the 20 peer states and provinces. The indicators used to inform this report were based on previous research conducted by Richard Florida (2002) which showed that Technology, Talent, and Tolerance are key elements for the success and continued development of a region. A region needs substantial but balanced performance across ALL of the “Three Ts” to grow and be prosperous. In order to maintain objectivity, the analysis involved in this benchmarking process was entirely quantitative. This may lead to results that seem odd when discussed out of context or by an individual with specific regional knowledge. For example, our analysis found that Ottawa-Gatineau is incredibly competitive on certain occupation measures which are a result of the large federal government presence in the CMA. When viewing the results it is important to remember that they have not been informed by specific knowledge that is local to the regions.

Ontario Competes, April 2009
Martin Prosperity Institute REF. 2009-BMONT-001 29
Works Cited
Baumol, W. J. (2002). The Free-Market Innovation Machine. Princeton, NJ: Princeton University Press.
Florida, R. (2002). Rise of the Creative Class. New York, NY: Basic Books.
Florida, R., Mellander, C., & Stolarick, K. (2008, July). Inside the block box of regional development - human capital, the creative class and tolerance. Journal of Economic Geography , 615-649.
Florida, R., Mellander, C., & Stolarick, K. (2009). Talent, Technology and Tolerance in Canadian Regional Development. MPI Working Paper.
King K. (2009). The Geography of Immigration in Canada: Settlement, Education, Labour Activity and Occupation Profiles. MPI Working Paper.
King K., Mellander C., & Stolarick K. (2009). What You Do, Not Who You Work For: A Comparison of the Occupational and Industry Structures of Canada, the United States, and Sweden. MPI Working Paper.
Mill, J. S. (1869). On Liberty. Adelaide, Australia, Australia.
Sachs, J. (2008). Common Wealth: Economics for a Crowded Planet. New Yor, NY: Penguin Press.
Science and Innovation Sector, Industry Canada. (2007). Mobilizing Science and Technology: To Canada's Advantage. Ottawa, ON: Industry Canada.
WIPO. (2007). WIPO Patent Report: Statistics on World Wide Patent Activities. Geneva: World Intellectual Property Office.
Statistics
Visible Minorities and Mosaic Index: CMA
Statistics Canada. Profile of Ethnic Origin and Visible Minorities for Census Metropolitan Areas, Tracted Census Agglomerations and Census Tracts, 2006 Census. Statistics Canada Catalogue no. 94-580-XCB2006005. Using University of Toronto Data Library Service. Version updated April 2, 2008. http://www.chass.utoronto.ca/datalib/cc06/profil06.htm. Beyond 20/20.
Visible Minorities and Mosaic Index: Provinces
Statistics Canada. Profile of Ethnic Origin and Visible Minorities for Canada, Provinces, Territories, Census Divisions, Census Subdivisions and Dissemination Areas, 2006 Census. Statistics Canada Catalogue no. 94-580-XCB2006002. Using University of Toronto Data Library Service. Version updated April 16, 2008. http://www.chass.utoronto.ca/datalib/cc06/profil06.htm. Beyond 20/20.

Ontario Competes, April 2009
Martin Prosperity Institute REF. 2009-BMONT-001 30
Married and Common Law: Provinces and CMA
Statistics Canada. Legal Marital Status (6), Common-law Status (3), Age Groups (17) and Sex (3) for the Population 15 Years and Over of Canada, Provinces, Territories, Census Metropolitan Areas and Census Agglomerations, 2001 and 2006 Censuses - 100% Data. Statistics Canada Catalogue no. 97-552-XCB2006007. Using University of Toronto Data Library Service. Version updated September 12, 2007. http://www.chass.utoronto.ca/datalib/cc06/tbt06. Beyond 20/20.
Classes, % high school, % BA, Talent, Population, Income and Wages (2005): Provinces
Statistics Canada. Profile for Canada, Provinces, Territories and Federal Electoral Districts (2003 Representation Order), 2006 Census. Statistics Canada Catalogue no. 94-581-XCB2006007. Using University of Toronto Data Library Service. Version updated July 24, 2008. http://www.chass.utoronto.ca/datalib/cc06/profil06.htm. Beyond 20/20.
Classes, % high school, % BA, Talent, Population, Income and Wages (2005), Labor Force: CMAs and CAs
Statistics Canada. Profile for Census Metropolitan Areas and Census Agglomerations, 2006 Census. Statistics Canada Catalogue no. 94-581-XCB2006004. Using University of Toronto Data Library Service. Version updated July 24, 2008. http://www.chass.utoronto.ca/datalib/cc06/profil06.htm. Beyond 20/20.
Income and Wages (2000), Labor Force, Population: CMAs and CAS
Statistics Canada. Profile for Census Metropolitan Areas and Census Agglomeration, 2001 Census. Statistics Canada Catalogue no. 95-F0495-xcb-01004. Using University of Toronto Data Library Service. Version updated October 7, 2003. http://www.chass.utoronto.ca/datalib/cc01/profil01.htm. Beyond 20/20.
Income and Wages (2000), Labor Force, Population: Provinces
Statistics Canada. Profile for Canada, Provinces, Territories and Forward Sortation Areas, 2001 Census. Statistics Canada Catalogue no. 95-F0495-xcb-01003. Using University of Toronto Data Library Service. Version updated October 23, 2003. http://www.chass.utoronto.ca/datalib/cc01/profil01.htm. Beyond 20/20.
HTLQ: All of Canada
Statistics Canada. Industry-North American Industry Classification System 2002 (433), Class of Worker (6) and Sex (3) for the Labor Force 15 Years and Over of Canada, Provinces, Territories, Census Metropolitan Areas and Census Agglomerations, 2006 Census- 20% Sample D. Statistics Canada Catalogue no. 97-559-XCB2006009. Using University of Toronto Data Library Service. Version updated February 27, 2008. http://www.chass.utoronto.ca/datalib/cc06/tbt06. Beyond 20/20.
Boho: Canada
Statistics Canada. Occupation- National Occupational Classification for Statistics 2006 (720), Class of Worker (6) and Sex (3) for the Labor Force 15 Years and Over of Canada, Provinces Territories, Census Metropolitan Areas and Census Agglomerations, 2006 Census-2. Statistics

Ontario Competes, April 2009
Martin Prosperity Institute REF. 2009-BMONT-001 31
Canada Catalogue no. 97-559-XCB2006011. Using University of Toronto Data Library Service. Version updated February 27, 2008. http://www.chass.utoronto.ca/datalib/cc06/tbt06. Beyond 20/20.
Boho: Canada
Statistics Canada. Occupations-2001 National Occupational Classification for Statistics (718), Industry – 1997 North American Industry Classification System (120), Class of Worker (5), Sex(3) and 2000 Employment Income (2) for Population 15 Years and Over with Employment. Statistics Canada Catalogue no. 97-F0012-XCB-01049. Using University of Toronto Data Library Service. Version updated November 19, 2003. http://www.chass.utoronto.ca/datalib/cc01/sit01.htm#workp. Beyond 20/20.
Gay Index: Province
Statistics Canada. 2007. Status of Same-sex Couples (3), Sex (3) and Presence of Other Household Members (5) for the Same sex Couples in Private Households of Canada, Provinces and Territories, 2006 Census - 20% Sample Data. Topic Based Tabulations: Families and households. Statistics Canada Catalogue no. 97-553-XCB2006024. Ottawa. September 12, 2007
Gay Index: CMAs and CAs
Statistics Canada. 2007; Persons in same-sex unions by broad age groups and sex for both sexes 2006 counts for Canada and census metropolitan areas and census agglomerations - 20% sample data (table). Families and Households Highlight Tables. 2006 Census. Statistics Canada Catalogue no. 97-553-XWE2006002. Ottawa. Released September 12 2007.
Statistics Canada. Gross Domestic Product (GDP) at basic prices, by North American Industry Classification System (NAICS) and Province, annually (Dollars). Cansim table no. 3790025 Using CHASS(University of Toronto. Version updated November 8, 2007. http://dc1.chass.utoronto.ca/cgi-bin/cansimdim/c2_getArrayDim.pl (accessed August 5, 2008).
Statistics Canada. Postsecondary Student Information System (PSIS). February 7, 2008. Statistics Canada Catalogue
American Statistical Sourcing
Bureau of Labor Statistics. (2006). Occupational Employment and Wage Estimates, Metropolitan Area Cross-Industry estimates. Version updated June 16, 2008. http://www.bls.gov/oes/oes_2006.htm
US Census Bureau, American Community Survey. (2006). Selected Social Characteristics in the United States: 2006.
Source: U.S. Census Bureau, 2006 American Community Survey
Source: US Census, 2000
Source: County Business Patterns, 2006

Ontario Competes, April 2009
Martin Prosperity Institute REF. 2009-BMONT-001 32
Research Team This work was jointly supervised by Dr. Kevin Stolarick, Research Director and David Smith, Project Leader. They would like to acknowledge the tremendous efforts of researchers Ronnie Sanders and Michael Wolfe for their countless hours dedicated to gathering, analyzing and processing the wide range of data used during this benchmarking project. They would also like to acknowledge the early contributions from researchers Scott Pennington and Yousuf Haque. Benchmarking Project This paper is part of the Ontario in the Creative Age series, a project we are conducting for the Ontario Government. The project was first announced in the 2008 Ontario Budget Speech, and its purpose is to understand the changing composition of Ontario’s economy and workforce, examine historical changes and projected future trends affecting Ontario, and provide recommendations to the Province for ensuring that Ontario’s economy and people remain globally competitive and prosperous. The purpose of the benchmarking papers in this series was to gather and analyze data on Ontario’s CMAs and assess how well they compete with similar jurisdictions across North America our 3Ts of Economic Development. The assessments are intended to inform a constructive discussion on what factors contribute to regional economic development. They are not intended to be all encompassing. Disclaimer The views represented in this paper are those of the Martin Prosperity Institute and may not necessarily reflect the views of its affiliates or its funding partners. Any omissions or errors remain the sole responsibility of the research team. Any comments or questions regarding the content of this report may be directed to [email protected].


