Ontario Harm Reduction Distribution Program Final · PDF fileadditional harm reduction...
102
HIV and HCV Prevention Research Team Department of Epidemiology and Community Medicine University of Ottawa [email protected] Lynne Leonard PhD Andree Germain MSW The purpose of the OHRDP is to increase the capacity of Ontario’s Needle Exchange Programs to deliver additional harm reduction equipment beyond the distribution of needles and syringes to people in Ontario who inject drugs. This report details the methods used and the resultant findings of an evaluative analysis comparing data collected concurrent with the implementation of the OHRDP at 26 sites associated with 27 Public Health Units in Ontario with data collected nine to twelve months post- implementation. In addition, the data represent the first provincial profile of drug use and associated HIV- and HCV- related risk behaviours and practices across Ontario. Ontario Harm Reduction Distribution Program Final Outcome Evaluation April 2009
Transcript of Ontario Harm Reduction Distribution Program Final · PDF fileadditional harm reduction...

H I V a n d H C V P r e v e n t i o n
R e s e a r c h T e a m
D e p a r t m e n t o f
E p i d e m i o l o g y a n d
C o m m u n i t y M e d i c i n e
U n i v e r s i t y o f O t t a w a
l l e o n a r d @ u o t t a w a . c a
Lynne Leonard PhD
Andree Germain MSW The purpose of the OHRDP is to increase the capacity of Ontario’s Needle Exchange Programs to deliver
additional harm reduction equipment beyond the distribution of needles and syringes to people in Ontario who inject drugs.
This report details the methods used and the resultant findings of an evaluative analysis comparing data collected concurrent with the implementation of the OHRDP at 26 sites associated
with 27 Public Health Units in Ontario with data collected nine to twelve months post-implementation.
In addition, the data represent the first provincial profile of drug use and associated HIV- and HCV-related risk behaviours and practices across Ontario.
Ontario Harm
Reduction Distribution
Program
Final Outcome
Evaluation
April 2009

TABLE OF CONTENTS
ACKNOWLEDGEMENTS ................................................................................................................4
LIST OF TABLES ..............................................................................................................................5
1.0 INTRODUCTION...................................................................5 1.1 Ontario’s Harm Reduction Distribution Program .......................8 1.2 Objectives of the Evaluation ................................................ 11
2.0 METHODS ......................................................................... 13 2.1 Outcome Evaluation Time Points .......................................... 13 2.2 Sample Size ...................................................................... 13 2.3 Criteria for Inclusion in the Outcome Evaluation..................... 14 2.4 Recruitment ...................................................................... 14 2.5 Research Instrument .......................................................... 16 2.6 Statistical Analysis ............................................................. 16 2.7 Ethical Approval................................................................. 17
3.0 RESULTS .......................................................................... 18 3.2 Demographic Characteristics of Participants .......................... 20 3.3 Drug Use Patterns.............................................................. 24
3.3.1 Drugs injected ................................................................... 24 3.3.2 Non-injection drug use ....................................................... 27 3.3.3 Engagement in smoking crack ............................................. 30 3.4.1 Drug preparation and injection preparation equipment ........... 32 3.4.2 Crack-smoking equipment................................................... 46 3.5.1 Sterile/new injection supplies .............................................. 48
3.6 Barriers to the Collection of Equipment through Local NEP or Community Agency ............................................................ 65
3.6.1 Barriers to the collection of sterile injection supplies............... 65 3.6.2 Barriers to the collection of new crack-smoking supplies ......... 66
3.7 Methods of Disposal of Used Equipment ................................ 68 3.7.1 Disposal of used needles..................................................... 68 3.7.2 Disposal of used drug injection equipment ............................ 70
3.8 HCV and HIV-Related Risk Behaviours and Practices............... 74 3.8.1 Multi-person use (sharing) of needles for injection ................. 74 3.8.2 Multi-person use (sharing) of drug preparation and injection
preparation equipment ....................................................... 77 3.9 HIV AND HCV INFECTION ................................................... 85
3.9.1 HIV Testing ....................................................................... 85 3.9.3 Hepatitis C (HCV) Testing.................................................... 89 3.9.4 HCV Status ....................................................................... 91
4.0 DISCUSSION..................................................................... 93
5.0 CONCLUSIONS AND RECOMMENDATIONS............................. 94 5.1 OHRDP Successful in reducing HIV- and HCV-related Risk
Behaviours........................................................................ 94 5.2 Areas of Concern ............................................................... 95
5.2.1 Demonstrated capacity of regional Medical Officers of Health to resist full implementation of the OHRDP................................ 95

5.2.3 Program development to include the distribution of safer inhalation materials for people who smoke drugs ................... 96
6.0 REFERENCES..................................................................... 97
7.0 APPENDIX ....................................................................... 100

OHRDP FINAL REPORT Page 4
ACKNOWLEDGEMENTS
The OHRDP Evaluation Research Team would like to personally acknowledge the strong
contribution made to the success of the evaluation in public health regions of Ontario by the
OHRDP Evaluation Interviewers and the OHRDP Evaluation Site Administrators whose names
appear in Appendix A1.
In addition, we would like to acknowledge the support given to the OHRDP Evaluation by
managers and staff of the participating needle exchange programs, particularly those who
assisted with recruitment at both fixed and mobile needle exchanges and most particularly
to the women and men in Ontario who inject drugs who graciously participated in the study.
The OHRDP Evaluation was funded by the Hepatitis C Secretariat of the Ontario Ministry of
Health and Long Term Care. The views herein are those of the authors and do not
necessarily reflect those of the funders.

OHRDP FINAL REPORT Page 5
LIST OF TABLES
Table 1 Participants in Baseline and Final Interviews by Site and Public Health Unit.......................................................................... 19
Table 2 Socio-demographic Profile: Gender ............................................. 20
Table 3 Socio-demographic Profile: Age ................................................. 20
Table 4 Socio-demographic Profile: Level of Education and Living Situation. 21
Table 5 Socio-demographic Profile: Needle Exchange Program Use ........... 22
Table 6 Socio-demographic Profile: Collection of Drug Injection Supplies.....23
Table 7 Drug Use Patterns: Frequency of Injecting Six Months Prior to Interview .............. 24
Table 8 Drug Use Patterns: Frequency of Injecting Month Prior to Interview ..................... 24
Table 9 Drug Use Patterns: Drugs Injected at Least Once Six Months Prior to Interview........... 25
Table 10 Drug Use Patterns: Drugs INJECTED Most Often Six Months Prior to Interview............. 27
Table 11 Drug Use Patterns: Drugs USED at Least Once Six Months Prior to Interview ......... 28
Table 12 Drug Use Patterns: Drugs USED MOST Often Six Months Prior to Interview .................29
Table 13 Drug Use Patterns: Frequency of Smoking Crack Six Months Prior to Interview ............30
Table 14 Drug Use Patterns: Frequency of Smoking Crack Month Prior to Interview .............31
Table 15 Drug Preparation and Injection Preparation Equipment: Breaking Down Non-dissolvable Drugs Prior to Injection ......... 32
Table 16 Drug Preparation and Injection Preparation Equipment: Dissolving Drugs Prior to Injection......................................... 34
Table 17 Drug Preparation and Injection Preparation Equipment: Use of Mixing and Heating Container Prior to Injection ............ 36
Table 18 Drug Preparation and Injection Preparation Equipment: Filtering Drugs Prior to Injection ........................................... 38
Table 19 Drug Preparation and Injection Preparation Equipment: Tying Off Vein Prior to Injection............................................. 40
Table 20 Drug Preparation and Injection Preparation Equipment: Cleaning Skin Prior to Injection Skin Prior to Injection............. 42
Table 21 Drug Preparation and Injection Preparation Equipment: Rinsing Needles Following Injection............................................ 44

OHRDP FINAL REPORT Page 6
Table 22 Equipment Used to Smoke Crack........................................... 47
Table 23 Accessing Sterile/Unused Equipment: Access to Sterile Needles .....49
Table 24 Access to Sterile Water ........................................................ 51
Table 25 Access to New Filters ............................................................... 53
Table 26 Access to Sterile/New Cookers................................................... 55
Table 27 Access to New Tourniquets........................................................ 57
Table 28 Access to Sterile Acidifiers......................................................... 60
Table 29 Access to Sterile Alcohol Swabs ............................................ 63
Table 30 Access to New Crack-smoking Supplies ................................. 63
Table 31 Unavailability of Supplies in Past Six Months: Injection Supplies.............................................................................. 65
Table 32 Unavailability of Supplies in Past Six Months: Crack-smoking Supplies.............................................................................. 67
Table 33 Methods of Disposal of Used Needles/Syringes......................... 69
Table 34 Methods of Disposal of Used Drug and Injection Preparation Equipment........................................................................... 71
Table 35 Methods of Disposal of Used Equipment: Drug-smoking Equipment .......................................................................... 73
Table 36 HCV and HIV-Related Risk Behaviours and Practices: Multi-person Use of Needles for Injection in Six Months Prior to Interview............................................................................ 75
Table 37 HCV and HIV-Related Risk Behaviours and Practices: Engagement in Sharing Water in Six months Prior to Interview. 77
Table 38 HCV and HIV-Related Risk Behaviours and Practices: Engagement in Sharing Filters in Six Months Prior to Interview.. 78
Table 39 HCV and HIV-Related Risk Behaviours and Practices: Engagement in Sharing Cookers in Six Months Prior to Interview............................................................................ 79
Table 40 HCV and HIV-Related Risk Behaviours and Practices: Engagement in Sharing Tourniquets in the Six Months Prior to Interview............................................................................ 80
Table 41 HCV and HIV-Related Risk Behaviours and Practices: Engagement in Sharing Acidifiers in Six Months Prior to Interview............................................................................ 81
Table 42 HCV and HIV-Related Risk Behaviours and Practices: Engagement in Sharing Alcohol Swabs in Six Months Prior to Interview............................................................................ 82

OHRDP FINAL REPORT Page 7
Table 43 HIV and HCV-Related Risk Behaviours and Practices: Multi-person Use of Crack-smoking Equipment in Six Months Prior to Interview............................................................................ 84
Table 44 HIV and HCV Infection: Testing for HIV ................................. 86
Table 45 HIV and HCV Infection: Self-report of HIV Prevalence by Health Region ………………………………………………………………………………………………… 88
Table 46 HIV and HCV Infection: Testing for HCV.................................. 90
Table 47 HIV and HCV Infection: Self-report of HCV Prevalence by Health Region…………………………………………………………………………………………………. 92

OHRDP FINAL REPORT Page 8
1.0 INTRODUCTION
1.1 Ontario’s Harm Reduction Distribution Program
The Ontario Harm Reduction Distribution Program (OHRDP) was implemented to assist in
the reduction of the transmission of the hepatitis C virus (HCV), the human
immunodeficiency virus (HIV) and other blood-borne pathogens among people who inject
drugs (IDUs) in Ontario. The purpose of the OHRDP is to increase the capacity of Ontario’s
Needle Exchange Programs (NEPs) to deliver additional harm reduction equipment beyond
the distribution of needles and syringes to IDUs across Ontario. In January 2006, the Oasis
Program of the Sandy Hill Community Health Centre in Ottawa, Ontario accepted the
responsibility from the Hepatitis C Secretariat of the Ontario Ministry of Health and Long–
Term Care to deliver the new Ontario Harm Reduction Distribution Program. Due to logistic
difficulties, the program was subsequently relocated in July 2006 to Kingston Community
Health Centres. The Kingston-based program was fully operational by September 2006 with
sterile water, alcohol swabs, tourniquets, ascorbic acid, cookers, filters and promotional
material available for distribution, at no cost and on request, to Ontario NEPs.
Scientific Basis of the Program
IDUs are at direct risk of acquiring and transmitting HCV and HIV infection through sharing
needles and other injection equipment contaminated with HCV and/or HIV. The HCV- and
HIV-related risks associated with the multi-person use of needles (sharing) have been well
documented in the scientific literature. Recently, emerging virologic and epidemiologic
evidence documents HCV- and HIV-related risks and negative health impacts associated
with sharing other injection equipment such as mixing and rinse water, alcohol swabs,
tourniquets, ascorbic acid, cookers and filters used in the process of drug preparation and
injection. In research studies examining injection practices among IDUs, approximately 25-
60% of IDUs continue to report using needles previously used by someone else (1-4). A
recent review of the literature relating to the HCV and HIV risks associated with sharing
other injection equipment (i.e., water, alcohol swabs, tourniquets, ascorbic acid, cookers
and filters) showed that IDUs share these items more frequently than needles (5-15). For
example, in international studies 50–94% of IDUs reported sharing other injection
equipment, 32–54% of IDUs reported sharing other injection equipment in the Canadian I-
Track pilot study while 55–80% of IDUs from nine Ontario NEPs reported sharing other
injection equipment (8-10; 15-18).

OHRDP FINAL REPORT Page 9
Mixing and rinse water is used to dissolve drugs and flush needles. Sharing mixing and
rinse water was found to double the risk of HCV seroconversion (ARH = 2.2, 95% CI: 1.1,
4.6) among a group of Chicago IDUs (19). HIV DNA was detected in 67% of waters from
shooting galleries in Miami, Florida while HCV RNA was detected in 33% of waters from
Australian injection settings (20-21). Providing sufficient amounts of sterile water may
discourage sharing water. In addition, the unavailability of sterile water frequently results in
IDUs using non-sterile fluids such as tap water, rain or puddle water, toilet water, saliva or
urine which elevate the risk of local or systemic infection (22-23).
Alcohol swabs are used to clean injection sites and remove blood from fingers and
surfaces. Abscesses and endocarditis were less common among IDUs who always cleaned
their skin prior to injecting (24-25). HCV RNA was detected in 67% of swabs from Australian
injection settings (20). Providing sufficient quantities of alcohol swabs may discourage
sharing swabs and the use of aftershave lotion or soap and water to clean injection sites as
these are not effective in reducing the risk of abscesses (26).
Tourniquets are used to increase blood flow to the vein at the injection site. Blood-
smeared tourniquets may be a potential source of exposure to blood-borne viruses (27-28).
Five percent of tourniquets in one UK hospital were found to be contaminated with
Staphylococcus, a bacterium known to cause abscesses (29). In another UK hospital, 50% of
tourniquets had visible bloodstains, while 34% cultured bacterial organisms (30). The
provision of clean tourniquets may encourage single-use, reduce the risk of exposure to
potential abscess-forming bacteria and discourage the use of rope, belts or bandanas as
these are hard to clean, hard to release and may damage the skin or vein (26).
Acidifiers (acetic, citric and ascorbic acid) are added to non water-soluble drugs such as
brown heroin and crack or crystal methamphetamine which come in the form of “rocks” or
“crystals”. Adding acidifiers makes these drugs water-soluble and they can then be used for
injection. Many IDUs use lemon juice, vinegar or kettle de-scalers to break down these
drugs. Lemon juice and vinegar are growth media for bacteria and fungi. The use of lemon
juice has also been associated with fungal infections causing heart (endocarditis) and eye
(candidal endophthalmitis) infections which can lead to loss of vision and blindness (31-32).
Among 360 Glasgow IDUs, 38% reported eye problems associated with the use of lemon
juice or vinegar (31, 33). Other adverse health effects include citric acid burns and local vein
damage (33). Providing sufficient quantities of individual packets of citric or ascorbic acid
may encourage single-use and thus discourage sharing and reduce the risk of infection,
abscesses and damage to the skin or vein (26).

OHRDP FINAL REPORT Page 10
Cookers are used for mixing drugs with water and for heating the liquefied drug solution to
further dissolve the drug. Spoons and bottle caps are used as cookers by many IDUs.
Sharing cookers is a common practice among IDUs. In 2005, Huo and colleagues found that
65% of street-recruited Chicago IDUs reported sharing cookers (12) while Needle and
colleagues found that IDUs in 54 networks selected from six American cities and Puerto Rico
shared cookers 84% of the time (34). Among 503 IDUs in Ottawa, the majority of both men
(82%) and women (76%) reported sharing another person’s cooker (35). Sharing cookers
was found to elevate the risk of HCV seroconversion in several studies. Hagan and
colleagues found that among 123 HCV-negative IDUs who did not share syringes but shared
cookers and filters, the risk of HCV was elevated six-fold (ARR = 5.9; 95% CI: 1.1, 31.7)
(37) while Thorpe and colleagues (2002) found the risk of HCV seroconversion was elevated
three-fold (ARH = 3.5; 95% CI: 1.3, 9.9) among 353 HCV-negative, younger Chicago IDUs
who shared cookers (19). The presence of HCV RNA was detected on 25% of spoons
(cookers) tested from 10 Australian injection settings (20) while HIV DNA was detected on
54% of the cookers examined from shooting galleries in Miami, Florida (21). Providing clean
cookers may encourage single-use and discourage the use of spoons or bottle caps which
are difficult to clean (26).
Filters are placed on the tips of needles to prevent any undissolved fragments of a drug,
other particles and/or bacteria from being injected. Cotton balls, tampons, cigarette filters
and cigarette rolling papers are some of the items commonly used as filters by IDUs. After
using a filter there is some drug residue left in the filter. Many IDUs will combine several
filters with water to make a “wash” which is then injected. Injecting washes from filters
previously used by someone else is a common practice particularly to prevent withdrawal
symptoms. Sharing filters has been found to be a common practice among IDUs in many
studies. Needle and colleagues found that IDUs in 54 networks selected from six American
cities and Puerto Rico shared filters 77% of the time (34). Among 2,062 IDUs from London,
U.K., over 50% reported sharing filters and/or spoons and 33% who had reported that they
had not shared needles had shared filters and spoons (15). Among 503 IDUs in Ottawa, the
majority of both men (68%) and women (72%) reported sharing another person’s filter (35).
Epidemiologic studies have documented an increased HCV risk associated with the sharing
of filters. Among 165 HCV-negative IDUs in France, the risk of HCV infection was elevated
more than 16 fold (ARH = 16.4; 95% CI: 1.4-190.6) through injection with a used filter (36).
Hagan and colleagues found that among 123 HCV-negative IDUs who did not share syringes
but shared cookers and filters the risk of HCV was elevated six-fold (ARR = 5.9; 95% CI:
1.1-31.7) (37) while Thorpe and colleagues found the risk of HCV seroconversion was

OHRDP FINAL REPORT Page 11
doubled (ARH = 2.4; 95% CI: 1.1-5.0) among 353 HCV-negative, younger Chicago IDUs
who shared filters (19). HCV RNA was detected on 40% of filters tested from 10 Australian
injection settings (20) while HIV DNA was detected on 36% of filters examined from shooting
galleries in Miami, Florida (21).
In addition to the increased risk of HCV transmission through sharing filters, the use of
cigarette filters or large pore filters has been associated with the formation of abscesses and
deep vein thrombosis. Cigarette filters are unable to prevent bacterial contamination of
syringes or the passage of foreign particles (38-39). The distribution of small-pore filters may
encourage single-use and discourage the use of alternatives such as cigarette filters or
tampons which allow for the passage of abscess-forming bacteria and foreign particles (26).
1.2 Objectives of the Evaluation
Overall Evaluation Objective
The overall objective of the OHRDP evaluation was to provide rigorous scientific data to the
Hepatitis C Secretariat of the Ontario Ministry of Health and Long-Term Care on which to
base recommendations for the operation of the OHRDP.
In addition, the evaluation process provided local and provincial data relating to drug use,
injection practices, drug smoking practices, access to injection and drug smoking
equipment, access and use of NEPs, self–reported HCV and HIV status and documented
evidence to support advocacy efforts locally and provincially.
Specific Evaluation Objectives
The evaluation consists of two components: the OHRDP outcome evaluation and the OHRDP
process evaluation.
The objective of the OHRDP Outcome Evaluation was to describe the impact of the
distribution of additional harm reduction supplies (water, alcohol swabs, filters, cookers,
acidifiers and tourniquets) on the HCV- and HIV-related risk practice of sharing drug
preparation equipment.
The objective of the OHRDP Process Evaluation was to document the effectiveness of the
OHRDP to increase the capacity of Ontario NEPs to deliver evidence-based harm reduction
resources including equipment and education to people who use drugs in Ontario.

OHRDP FINAL REPORT Page 12
Hypotheses
• That the implementation of the distribution of harm reduction materials will reduce
the proportion of people injecting with previously-used injection and drug
preparation equipment.
• That the capacity of Ontario NEPs to deliver evidence-based harm reduction
resources including equipment and education to people who use drugs in Ontario will
increase.
Research Questions Related to Objectives
• What is the impact of a province-wide harm reduction distribution program on the
HCV- and HIV-related risk practices and behaviours of Ontario IDUs?
• To what extent has the implementation of a province-wide harm reduction program
enabled Ontario NEPs to increase their capacity to deliver harm reduction resources?

OHRDP FINAL REPORT Page 13
2.0 METHODS
2.1 Outcome Evaluation Time Points
To meet the objectives of the Outcome Evaluation, personal structured interviews with
women and men in Ontario who inject drugs (IDUs) were undertaken at three time points.
Interviews undertaken at the first time point, T0, were to obtain an approximation of a
baseline measure, carried out as close as possible to the date of commencement of
distribution of OHRDP materials by each individual NEP in Ontario. Interviews undertaken at
the second time point, T1, were to obtain data on the medium-range effect of the distribution
of OHRDP supplies and took place approximately six months after the first wave of
interviews.
Interviews undertaken at the third time point, T2, were to obtain data on the more long-term
effect of the distribution of OHRDP supplies and took place six months after the second
wave of interviews, approximately one year after the commencement of distribution of
OHRDP supplies by each NEP.
This report details the methods used and the resultant findings of an analysis
comparing data from T0 (Wave 1) of the Outcome Evaluation from 26 sites
associated with 27 Public Health Units in Ontario with data from the latest round
of evaluation interviews completed at each of 26 sites associated with 27 Public
Health Units in Ontario.
For two-thirds of sites (65%) the “latest round of interviews” referred to interviews
undertaken at the third time point, T2. For the remaining sites, joining the evaluation
process at a later date primarily consequent on implementing the OHRDP at a later date,
the latest round referred to interviews undertaken at the second time point, T1.
2.2 Sample Size
I-Track is an enhanced surveillance project documenting HCV- and HIV-related risk
behaviours among IDUs in Canada. In calculating the sample size needed for each data
collection wave for any centre joining the surveillance project, the I-Track Investigators
worked on the assumption that the proportion of IDUs who report sharing other injection
equipment to be 40% (44).1 This same proportion, 40%, was used to calculate the sample
size required for each NEP participating in the evaluation of the Ontario Harm Reduction
Distribution Program.
1 As two of the Ontario centres in the I-Track pilot survey, Sudbury reported 40% of IDUs sharing other injection
equipment and Toronto 32%. Among 728 IDUs in Ottawa interviewed between 1996 and 2000, 45% reported injecting with previously-used equipment.

OHRDP FINAL REPORT Page 14
Results of the I-Track/SurvIDU study in Ottawa in 2004 indicate that 77% of crack-smoking
IDUs reported sharing drug-smoking equipment (pipes, glass stems) before the
implementation of Ottawa’s Safer Crack-smoking Initiative. (45). In order to calculate the
sample size required for any NEP participating in the evaluation of the Ontario Harm
Reduction Distribution Program it was assumed that 75% of crack-smoking IDUs will report
sharing drug smoking equipment.
Using Hassard’s formula (46) for the comparison of two proportions, it was calculated that a
sample of 70 individuals would provide 80 percent power at α = 0.05 (one-sided) for
detecting a minimally important clinical difference of 0.2 in the proportion of people who
inject with previously-used injection equipment and/or people who share drug smoking
equipment. That is, a sample size of 70 injection drug users per NEP is required to be 80%
certain of detecting a 20% reduction in the proportion of people who report injecting with
previously-used drug preparation and injection preparation equipment and/or smoking with
used drug smoking equipment.
2.3 Criteria for Inclusion in the Outcome Evaluation
IDUs had to meet the following criteria in order to participate in each round of interviews of
the evaluation study:
• To be capable of informed consent; and
• To have injected drugs in the previous six months.
2.4 Recruitment
A convenience sample of IDUs was recruited using methods based on previous successful
experiences with other studies among IDUs in Ottawa and elsewhere. The OHRDP
evaluation team provided the site administrators of each participating site with distinctive
recruitment posters and business cards. Site administrators were encouraged to implement
the project’s agreed recruitment plan but to tailor it to their region. Depending on the size
of the catchment area of each public health unit and the unit’s experience in primary
research with people who use drugs in their community, recruitment posters were displayed
anywhere from two weeks before commencement of interviews for each round of
interviewers to the same day as interviews were to begin. Posters were placed in a variety
of locations: the fixed site NEP – reported by 89% of participating sites; health clinic offices
and waiting areas - reported by 52%; addictions services facilities – reported by 48%; as
well as several other locations including hospitals, AIDS service organizations, housing
facilities, laundry mats, Ontario Works and other income support offices, soup kitchens, food
banks and on the street.

OHRDP FINAL REPORT Page 15
Frontline staff from many of these locations was engaged in participant recruitment and
IDUs were also recruited by word of mouth from other IDUs who had completed an
interview. Participant recruitment continued in each public health region until the target of
70 interviews per interview round was reached. The majority of interviews took place
throughout the weekday mornings and afternoons; however a minority of sites also offered
interviews in the evenings and on weekends. Interviews were held in various locations,
including: clinic and/or meeting rooms at public health units and needle exchange
programs; in mobile NEP units; at addictions service centres; in private rooms at housing
shelters and soup kitchens; as well as other locations that were desirable for the participant.
Depending on demand, some sites chose to schedule appointments for interviews in
advance while other sites chose to advertise a time and location and interviews were
completed on a first-come, first-served basis. In areas where a phone number was provided
for appointment booking or other information, participants were made aware of eligibility
criteria over the phone. As potential participants arrived, they were screened in accordance
with the eligibility criteria confirming status as an IDU and were then interviewed. Such
screening questions were considered a less intrusive method of determining injection drug
use status than requesting to verify track marks.
Interviewers welcomed all potential participants and explained the voluntary nature of the
interview, the parameters of the study and subsequent use of the data. At the
commencement of each interview, the interviewer read the information and consent form to
participants emphasising the confidential nature of the interview, the fact that participants
could choose not to answer questions, could terminate the interview at any time, and that
their right to services or treatment would not be affected by their decision to participate in
the interview. The interviewer recorded the participant’s verbal consent to participate.
Participants were offered a copy of the signed information and consent form for their own
use.
Debriefing after the interview was an essential feature of the interview process and was
conducted to counsel on a variety of services available within each public health region.
Issues covered in the debriefing included: information regarding NEP services and hours of
operation – reported by all sites; safer drug injection and smoking practices – reported by
93% of sites; HIV and HCV testing information – reported by 93% of sites; safer sexual and
reproductive health information – reported by three-quarters of participating sites (74%);
and whenever appropriate participants were referred to addiction treatment services,
housing shelters, soup kitchen and food banks, or AIDS service organizations.

OHRDP FINAL REPORT Page 16
On average, the interview process, including debriefing, took between twenty and forty
minutes. Participating IDUs were compensated $20 for their time spent away from their
other activities and several sites also provided coffee, tea or other beverages and/or
transportation support in the form of taxi vouchers or bus tickets.
2.5 Research Instrument
The outcome evaluation questionnaire used in each round of evaluation interviews at all
sites participating in the OHRDP Evaluation comprised questions focusing on: socio-
demographic variables including the participant’s use of needle exchange services; drug use
patterns; patterns of drug preparation and drug-smoking equipment use; access and
barriers to collection of OHRDP supplies; and patterns of disposal of used drug injection and
drug-smoking equipment. Questions documenting the participant’s engagement in the
practices of sharing other people’s needles for injection, sharing drug preparation and
injection preparation equipment including cotton filters, cookers and spoons and sharing
equipment to smoke drugs were included to document behaviours and practices associated
with HIV and HCV transmission. Questions investigating the uptake of testing for the
presence of HIV and HCV antibodies were also included as was self-report of HIV and HCV
status.
An Interviewer’s Manual and Interviewer’s Handbook were produced for use with the
questionnaire. These materials were produced to maximise accuracy and uniformity in
administering the questionnaire. The questionnaire was administered by interviewers, all of
whom had received extensive training on the interviewing protocol from the OHRDP
Evaluation Team at the University of Ottawa and who had knowledge and experience in
working with IDUs.
2.6 Statistical Analysis
The statistical analysis of the collected data was performed using the structured computer
database SPSS 15.0. Specific procedures were followed to ensure the integrity of the data
entered. These included the use of a data coding manual and verification of coding and data
input through comparing a 10% random sample of questionnaire responses with the
entered data. Validating of the data included: the performance of range checks to ensure all
values for each variable fell within the expected range; consistency edits to ensure that
responses to questions were consistent with those to other questions; and examination of
missing data.

OHRDP FINAL REPORT Page 17
Descriptive statistics (frequencies, ranges, means) were computed for this baseline wave of
interviews. For open-ended questions, categories were determined post-hoc.
2.7 Ethical Approval
Ethical approval for the overall OHRDP Evaluation was granted by the Ottawa Hospital
Research Ethics Board and reviewed and renewed on an annual basis.
Twenty-eight of the 30 participating regional Public Health Units accepted the ethical
approval granted by this board and gave administrative approval for the activities
associated with the evaluation of the OHRDP to be carried out in their jurisdictions. Two
Public Health Units requested minor revisions to the Participant Consent and Information
Sheet. Two Public Health Units, Ottawa and Toronto, obtained ethical approval from their
own Research Ethics Committees.

OHRDP FINAL REPORT Page 18
3.0 RESULTS
3.1 Sample Size
Baseline interviews
Baseline interviews were completed during the period 1st September 2006 to 16th August
2007 with 1,622 women and men in Ontario who inject drugs. These participants originated
from 26 sites representing 27 Public Health Units in Ontario2. Ten of the 26 sites started
data collection in September 2006; while 12 of the 26 sites completed data collection by the
end of 2006.
Final interviews
Final interviews were completed during the period 11th May 2007 to 11th May 2008 with
1,643 women and men in Ontario who inject drugs. Recruitment at the majority of sites
(77%) commenced during the months of September, October and November 2007 and was
finalised at the majority of sites (77%) during the months of October, November and
December 2007.
2 Data from Exchange Works NEP, Halton Regional Health Department; Northern Points Exchange, North Bay and
Parry Sound District Health Unit; and Mackay Manor, Renfrew County & District Health Unit were not complete at the time of development of the Baseline Report.

OHRDP FINAL REPORT Page 19
Table 1 Participants in Baseline and Final Interviews by Site and Public Health
Unit
REGIONAL PUBLIC HEALTH UNIT
SITE NAME BASELINE FINAL
Algoma Algoma PHU NEP 60 66 (W2)
Chatham-Kent Chatham-Kent PHU NEP 70 70 (W3)
County of Lambton County of Lambton PHU NEP 70 70 (W2)
Durham John Howard Society (Durham Region) – Project X-change
71 70 (W3)
Eastern Ontario Change Health Care Inc (formerly OATC) 56 29 (W3)
Hamilton The AIDS Network, Van Needle Exchange and Street Health Program
70 71 (W3)
Hastings & Prince Edward Counties
Hastings & Prince Edward Counties PHU NEP
70 70( W3)
Kingston Kingston Street Health Centre 70 70 (W3)
Leeds, Grenville, Lanark District
Leeds, Grenville, Lanark District PHU NEP 34 18 (W3)
Middlesex-London AIDS Committee of London – Counterpoint NEP
70 70 (W3)
Niagara Region AIDS Niagara – Streetworks NEP 70 70 (W2)
Northwestern Northwest Points NEP 42 71 (W2)
Ottawa The Site NEP 70 69 (W3)
Oxford County Oxford County PHU NEP 70 70 (W3)
Haliburton, Kawartha, Pine Ridge &
Peterborough City County
Peterborough AIDS Resource Network
58 70 (W2)
Peel Regional Peel Works NEP 17 15 (W2)
Perth District Perth District PHU NEP 70 70 (W3)
Porcupine The Quill NEP 22 70 (W3)
Simcoe Muskoka District Simcoe Muskoka District PHU & David Busby Street Centre
70 70 (W3)
Sudbury District Sudbury Action Centre for Youth 70 68 (W2)
Thunder Bay AIDS Thunder Bay & Superior Points NEP
70 70 (W2)
Toronto The Works NEP 70 69 (W3)
Waterloo Waterloo PHU NEP & AIDS Committee of Cambridge, Kitchener
and Waterloo Area (ACCKWA)
71 70 (W3)
Wellington-Dufferin-Guelph WDGHU NEP & AIDS Committee of Guelph – Stay Sharp
NEP
72 70(W3)
Windsor-Essex AIDS Committee of Windsor – New Points NEP
70 67 (W3)
York Region Health Services Dept.
York Region Health Services Department 69 50 (W2)
TOTAL
1,622
1,643
W2 Indicates 2 waves of data collection completed; final refers to second round of data collection W3 Indicates all 3 waves of data collection completed; final refers to third round of data collection

OHRDP FINAL REPORT Page 20
3.2 Demographic Characteristics of Participants
Gender
There were no significant gender differences between participants in the baseline interviews
and the final interviews; two-thirds of participants in both the baseline (69%) and the final
interviews (66%) were men (Table 2).
Table 2 Socio-demographic Profile: Gender
Baseline N=1622
Final N=1643
N (%) N (%)
Gender n=1620 n=1642
Male 1113 (68.7) 1083 (66.0)
Female 503 (31.0) 557 (33.9)
Trans 4 (0.2) 2 (0.1)
Age
The average age of participants in both the baseline and final interviews was 37 years old
and in both interviews the youngest participant was aged 14. In the final interviews, the
oldest participant was 70 years old compared with 74 years in the baseline interviews (Table
3).
Table 3 Socio-demographic Profile: Age
Baseline N=1622
Final N=1643
Age n=1610 n=1632
Mean(standard deviation) 37.0 (10.9) 36.8 (10.7)
Range 14 to 74 14 to 70
Level of education
Education has been shown to be an important factor, or determinant, that affects a person’s
ability to enjoy good health. It is strongly related to other determinants of health as it can
increase opportunities for income and job security.
As can be seen in Table 4, there was an almost equal split between participants with lower
levels of educational attainment and those with higher levels in both the baseline and final
interviews. Close to the majority of IDUs in both the baseline (49%) and final interviews
(50%) had not completed high school; while approximately one-quarter (25%) had
completed high school and one-quarter (25%) had completed some post secondary or had
completed their post secondary studies.

OHRDP FINAL REPORT Page 21
Living situation
The ability to access stable housing is also an important influence on a person’s health. In
this study, unstable housing was defined as living in a shelter or welfare residence, in a
rooming or boarding house, on the street, in an abandoned building or renting a hotel or
motel room on a daily or weekly basis. As shown in Table 4, there was a significant
reduction in the proportion of participants in the final interviews reporting recent unstable
housing compared with participants in the baseline interviews. Forty-three percent of final
participants were unstably housed in the six months prior to their interview compared with
54% of baseline participants (p<0.001) and 22% of final participants were unstably housed
at the time of their interview compared with 29% of baseline participants (p<0.001).
Table 4 Socio-demographic Profile: Level of Education and Living Situation
Baseline Final
N=1622 N=1643
N (%) N (%) p-value
Highest level of education completed n=1620 n=1640
Less than high school 800 (49.4) 822 (50.1)
Completed high school 412 (25.4) 407 (24.8)
Completed or some post secondary 408 (25.2) 411 (25.1)
Living in unstable housing in six months prior to interview
n=1619 n=1642
Yes 879 (54.3) 712 (43.4) ***
No 740 (45.7) 930 (56.6)
Living in unstable housing at time of interview n=1619 n=1642
Yes 465 (28.7) 354 (21.6) ***
No 1154 (71.3) 1288 (78.4)
*** p≤0.001
Needle exchange program use
As shown in Table 5, the vast majority of IDUs (90%) participating in the baseline
evaluation interviews had at some point in their injecting career accessed the services of
their local needle exchange program (NEP). Among participants in the final interviews, a
significantly greater proportion (93%) reported a history of accessing NEP services
(p<0.001).
Frequency of recent use of NEP services was not particularly high, however significant
differences were observed in the proportion of participants in the baseline interviews
compared with the final interviews reporting each frequency (p<0.001). As shown in Table

OHRDP FINAL REPORT Page 22
5, among those participants who had ever accessed the NEP, the majority in both the
baseline (54%) and final interviews (56%) reported infrequent use in the six months prior
to their interview - reporting less than weekly use of NEP services. Conversely, just over
one-third of both baseline (36%) and final participants (35%) were more frequent users -
visiting the NEP at least once a week in the six months prior to their interview, with a small
proportion of both baseline (4%) and final participants (3%) reporting daily use.
Table 5 Socio-demographic Profile: Needle Exchange Program Use
Baseline Final
N=1622 N=1643
N (%) N (%) p-value
EVER used the services of the local NEP n=1618 n=1643
Yes 1450 (89.6) 1531 (93.2) ***
No 168 (10.4) 112 (6.8)
Frequency of using NEP (past 6 months) n=1434 n=1517 ***
Never 137 (9.6) 132 (8.7)
Once/First time today 212 (14.8) 156 (10.3)
Not every week 562 (39.2) 694 (45.7)
Once or twice/week 369 (25.7) 395 (26.0)
Three to six times/week 92 (6.4) 90 (5.9)
Daily 62 (4.3) 50 (3.3)
*** p≤0.001
Among participants who had accessed the NEP in the six months prior to their interview, the
greatest proportion of both baseline (85%) and final participants reported that they had
collected drug injection supplies during their visits to the NEP. (Data not shown.)
However, as shown in Table 6, a significant increase was observed in the proportion of final
participants (69%) compared with baseline participants (66%) who reported collecting
supplies both for themselves and for other people, with a corresponding decline in the
proportion of final participants (31%) compared with baseline participants (34%) who
reported collecting supplies just for themselves (p=0.05).

OHRDP FINAL REPORT Page 23
Table 6 Socio-demographic Profile: Collection of Drug Injection Supplies
Baseline Final
N=1622 N=1643
N (%) N (%) p-value
Collected drug injection supplies for n=1162 n=1271
Just myself 398 (34.3) 392 (30.8) *
Myself and other people 764 (65.7) 876 (68.9)
Just for other people 0 (0.0) 3 (0.2)
* p≤0.05
OHRDP FINAL REPORT Page 24
3.3 Drug Use Patterns
3.3.1 Drugs injected
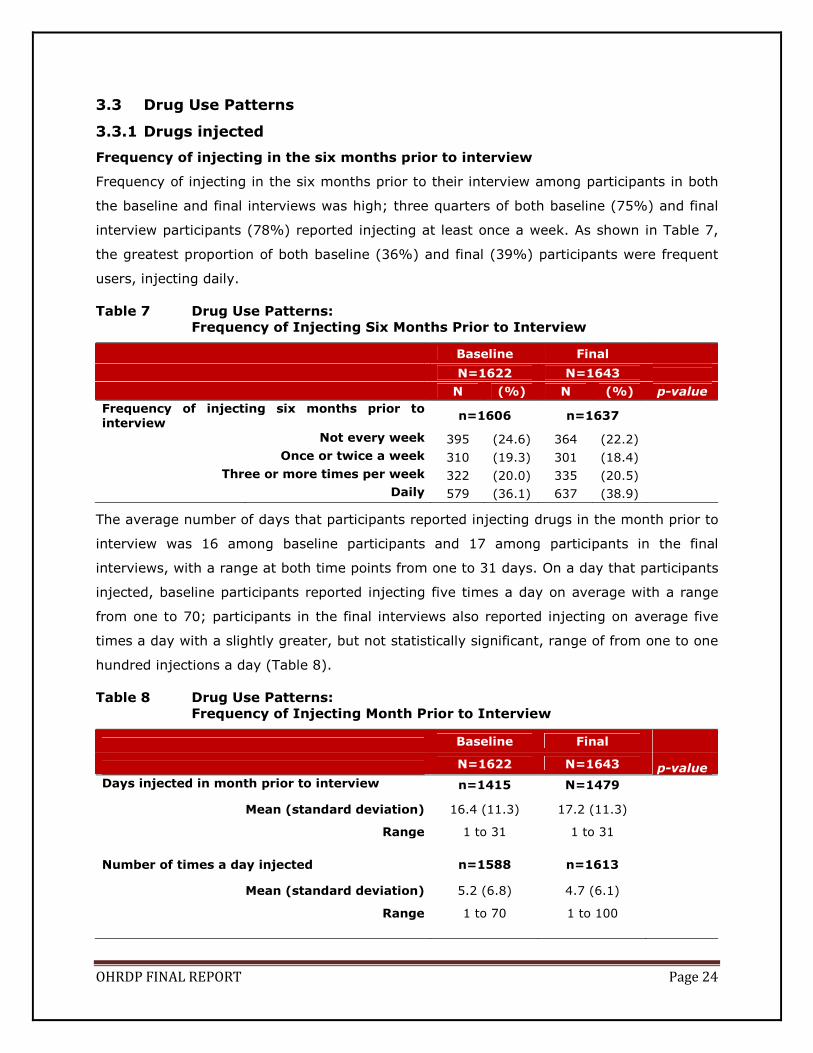
Frequency of injecting in the six months prior to interview
Frequency of injecting in the six months prior to their interview among participants in both
the baseline and final interviews was high; three quarters of both baseline (75%) and final
interview participants (78%) reported injecting at least once a week. As shown in Table 7,
the greatest proportion of both baseline (36%) and final (39%) participants were frequent
users, injecting daily.
Table 7 Drug Use Patterns:
Frequency of Injecting Six Months Prior to Interview
Baseline Final
N=1622 N=1643
N (%) N (%) p-value
Frequency of injecting six months prior to interview
n=1606 n=1637
Not every week 395 (24.6) 364 (22.2)
Once or twice a week 310 (19.3) 301 (18.4)
Three or more times per week 322 (20.0) 335 (20.5)
Daily 579 (36.1) 637 (38.9)
The average number of days that participants reported injecting drugs in the month prior to
interview was 16 among baseline participants and 17 among participants in the final
interviews, with a range at both time points from one to 31 days. On a day that participants
injected, baseline participants reported injecting five times a day on average with a range
from one to 70; participants in the final interviews also reported injecting on average five
times a day with a slightly greater, but not statistically significant, range of from one to one
hundred injections a day (Table 8).
Table 8 Drug Use Patterns:
Frequency of Injecting Month Prior to Interview
Baseline Final
N=1622 N=1643 p-value
Days injected in month prior to interview n=1415 N=1479
Mean (standard deviation) 16.4 (11.3) 17.2 (11.3)
Range 1 to 31 1 to 31
Number of times a day injected n=1588 n=1613
Mean (standard deviation) 5.2 (6.8) 4.7 (6.1)
Range 1 to 70 1 to 100

OHRDP FINAL REPORT Page 25
Drugs injected in the six months prior to interview
As shown in Table 9, participants in both the baseline and final interviews had injected a
variety of drugs on at least one occasion in the six months prior to their interview. Among
both final and baseline participants the top five drugs injected on at least one occasion by
the greatest proportion of participants prior to interview were the same: cocaine (71%
baseline, 69% final); oxycontin/oxycodone (53% baseline, 56% final); non-prescribed
morphine (53% baseline, 53% final); dilaudid (45% baseline, 45% final); and crack (43%
baseline, 39% final).
Table 9 Drug Use Patterns:
Drugs Injected at Least Once Six Months Prior to Interview
Baseline Final
N=1622 N=1643
N (%) N (%) p-value
n=1622 n=1643 ***
Amphetamines 375 (23.1) 358 (21.8)
Cocaine 1149 (70.8) 1138 (69.3)
Crack 691 (42.6) 633 (38.5)
Dilaudid 727 (44.8) 737 (44.9)
Heroin 321 (19.8) 300 (18.3)
Speedballs (Heroin+Cocaine) 151 (9.3) 124 (7.5)
Methadone (prescribed) 71 (4.4) 38 (2.3)
Methadone (non-prescribed) 112 (6.9) 81 (4.9)
Methamphetamine 293 (18.1) 296 (18.0)
Morphine (prescribed) 145 (8.9) 113 (6.9)
Morphine (non-prescribed) 861 (53.1) 866 (52.7)
Oxycontin/Oxycodone 863 (53.2) 913 (55.6)
Percocet 166 (10.2) 176 (10.7)
Tylenol #3's 71 (4.4) 66 (4.0)
Other drugs1 183 (11.3) 221 (13.5)
1 Other includes: depressants (n=32); dissociative anaesthetics (n=12); hallucinogens (n=2); opioids/morphine derivatives (n=56); stimulants (n=78); steroids (n=9); other drugs or combination of two drugs (n=45).
*** p≤0.001
While the ranking of the top five drugs remained the same among participants in both the
baseline and final interviews, there were some significant changes in the proportions
reporting injecting each drug. For example, the proportion reporting injecting crack declined
from 43% to 39%, the proportion reporting injecting prescribed morphine declined from 9%
to 7%, and the proportion reporting injecting non-prescribed methadone from 7% to 5%.
Conversely, increases were seen among participants in the final interviews in terms of
injecting oxycontin/oxycodone, the proportion increasing from 53% among baseline

OHRDP FINAL REPORT Page 26
participants to 56% among final interview participants. These differences in proportions
were statistically significant (p=0.001).
Interestingly, in contrast to the injection use of non-prescribed morphine, injection use of
prescribed morphine was low – reported by only 9% of baseline participants and 7% of final
interview participants suggesting substantial diversion of this drug at both time points.
Injection use of crystal meth was moderate – reported by 18% of participants in both the
baseline and final interviews.
Drugs injected most often in the six months prior to interview
These same five drugs were reported to be those injected MOST often by the greatest
proportions of participants in both the baseline and final interviews. As shown in Table 10,
cocaine was the drug injected most often by the greatest proportion of participants (29% in
baseline interviews, 28% in final interviews), followed by non-prescribed morphine (19% in
baseline interviews, 21% in final interviews), oxycontin/oxycodone (13% in baseline
interviews, 16% in final interviews), dilaudid (10% in baseline interviews, 9% in final
interviews) and crack (10% in baseline interviews, 9% in final interviews).
Again, in contrast to the proportion of participants who reported injecting non-prescribed
morphine the most, only 3% of participants in the baseline interviews and 2% in the final
interviews reported injecting prescribed morphine the most. Similarly, few participants in
both rounds of interviews – less than one percent - reported injecting prescribed and non-
prescribed methadone the most and only 5% of baseline participants and 6% of final
interview participants reported injecting crystal meth the most in the six months prior to
their interview.
While the top five drugs injected the most remained the same among participants in both
the baseline and final interviews, there were some changes in the proportions reporting
injecting each drug. Most changes in proportions were plus or minus 1%, however the
proportion injecting non-prescribed morphine the most increased from 19% among baseline
participants to 21% among final interview participants and the proportion injecting
oxycontin/oxycodone the most increased from 13% among baseline participants to 16%
among final interview participants, however these differences were only marginally
statistically significant (p<0.07).

OHRDP FINAL REPORT Page 27
Table 10 Drug Use Patterns:
Drugs INJECTED Most Often Six Months Prior to Interview
Baseline Final
N=1622 N=1643
N (%) N (%) p-value
n=1605 n=1622
Amphetamines 50 (3.1) 44 (2.7)
Cocaine 463 (28.8) 454 (28.0)
Crack 157 (9.8) 141 (8.7)
Dilaudid 167 (10.4) 145 (8.9)
Heroin 69 (4.3) 44 (2.7)
Speedballs (Heroin+Cocaine) 6 (0.4) 4 (0.2)
Methadone (prescribed) 3 (0.2) 2 (0.1)
Methadone (non-prescribed) 2 (0.1) 1 (0.1)
Methamphetamine 75 (4.7) 102 (6.3)
Morphine (prescribed) 45 (2.8) 35 (2.2)
Morphine (non-prescribed) 303 (18.9) 333 (20.5)
Oxycontin/Oxycodone 203 (12.6) 257 (15.8)
Percocet 4 (0.2) 3 (0.2)
Tylenol #3's 3 (0.2) 3 (0.2)
Other drugs1 55 (3.4) 54 (3.3)
1 Includes other: dissociative anaesthetics (n=1); opioids/morphine derivatives (n=5); stimulants (n=22); steroids (n=6); other drugs or combination of two drugs (n=20).
3.3.2 Non-injection drug use
Drugs USED, not injected, in the six months prior to interview
Nearly all participating IDUs (97%) in both the baseline and final interviews had also used
drugs without injecting on at least one occasion in the six months prior to their interview. As
shown in Table 11, the top four drugs used on at least one occasion without injecting in the
six months prior to interview were the same top four for participants in both the baseline
and final interviews: marijuana (74% baseline, 75% final); alcohol (70% baseline, 68%
final); crack (67% baseline, 62% final); cocaine (58% baseline, 56% final). While the top
four drugs remained the same among participants in both the baseline and final interviews,
there were significant changes in the proportions reporting injecting each drug. The
proportion of participants reporting using each drug in the final interviews was lower than
the proportions reporting using the same drugs in the baseline interviews with the exception
of marijuana and solvents which increased. These differences in proportions were
statistically significant (p < 0.001).

OHRDP FINAL REPORT Page 28
Table 11 Drug Use Patterns: Drugs USED at Least Once Six Months Prior to Interview
Baseline Final
N=1622 N=1643
N (%) N (%) p-value
n = 1575 n = 1586 ***
Alcohol 1104 (70.1) 1082 (68.2)
Amphetamines 343 (21.8) 294 (18.5)
Benzodiazepines 737 (46.8) 637 (40.2)
Cocaine 920 (58.4) 880 (55.5)
Crack 1051 (66.7) 982 (61.9)
Dilaudid 402 (25.5) 378 (23.8)
Ecstasy 372 (23.6) 305 (19.2)
Heroin 139 (8.8) 145 (9.1)
Marijuana 1168 (74.2) 1185 (74.7)
Methadone (prescribed) 375 (23.8) 375 (23.6)
Methadone (non-prescribed) 249 (15.8) 158 (10.0)
Methamphetamine 231 (14.7) 226 (14.2)
Morphine (prescribed) 130 (8.3) 67 (4.2)
Morphine (non-prescribed) 546 (34.7) 484 (30.5)
Mushrooms 300 (19.0) 236 (14.9)
Oxycontin/Oxycodone 702 (44.6) 698 (44.0)
Percocet 731 (46.4) 711 (44.8)
Solvents 16 (1.0) 25 (1.6)
Tylenol #3's 601 (38.2) 538 (33.9)
Other drugs1 203 (12.9) 162 (10.2)
1 Other includes: cannabinoids (n=21); depressants (n=6); dissociative anaesthetics (n=27); hallucinogens (n=20); opioids/morphine derivatives (n=27); stimulants (n=48); inhalants (n=2); Tylenol #1 or #2 or #4 (n=34); other drugs or combination of two drugs (n=65).
*** p≤0.001
The use of crystal meth was low; its use on at least one occasion in the six months prior to
interview was reported by 15% of participants in the baseline interviews and by 14% of
participants in the final interviews.
Drugs USED most often in the six months prior to interview
In terms of drugs used MOST often by the greatest proportions of participants in both the
baseline and final interviews, while the ranking of the top four drugs remained the same -
crack, marijuana, alcohol and prescribed methadone - a non-significant change in the
proportions using each was observed. As shown in Table 12, while crack was the drug used
by the greatest proportion of participants at both baseline and at the final time-point, a
smaller proportion of final (23%) compared with baseline participants (26%) reported that it
was the drug they used the most and a greater proportion of final (23%) compared with

OHRDP FINAL REPORT Page 29
baseline participants (20%) reported that marijuana was the drug they used the most.
Similarly, a greater proportion of final (11%) compared with baseline participants (10%)
reported using alcohol the most and a smaller proportion of final (8%) compared with
baseline participants (9%) reported that prescribed methadone was the drug they had used
the most in the six months prior to their interview (p=0.06).
Table 12 Drug Use Patterns:
Drugs USED MOST Often Six Months Prior to Interview
Baseline
N=1622 N (%)
Final
N=1643 N (%)
n = 1563 n = 1579
Alcohol 150 (9.6) 169 (10.7)
Amphetamines 5 (0.3) 4 (0.3)
Benzodiazepines 56 (3.6) 39 (2.5)
Cocaine 123 (7.9) 112 (7.1)
Crack 404 (25.8) 369 (23.4)
Dilaudid 32 (2.0) 27 (1.7)
Ecstasy 6 (0.4) 6 (0.4)
Heroin 6 (0.4) 3 (0.2)
Marijuana 309 (19.8) 369 (23.4)
Methadone (prescribed) 140 (9.0) 133 (8.4)
Methadone (non-prescribed) 4 (0.3) 4 (0.3)
Methamphetamine 20 (1.3) 25 (1.6)
Morphine (prescribed) 24 (1.5) 11 (0.7)
Morphine (non-prescribed) 51 (3.3) 54 (3.4)
Mushrooms 1 (0.1) 3 (0.2)
Oxycontin/Oxycodone 112 (7.2) 125 (7.9)
Percocet 47 (3.0) 60 (3.8)
Solvents 2 (0.1) 0 (0.0)
Tylenol #3's 25 (1.6) 36 (2.3)
Other drugs 46 (2.9) 30 (1.9)
1 Other includes: hallucinogens (n=3); opioids/morphine derivatives (n=1); stimulants (n=8); Tylenol #1 or #2 or #4 (n=3); other drugs or combination of two drugs (n=31).

OHRDP FINAL REPORT Page 30
3.3.3 Engagement in smoking crack
As previously shown in Table 11, approximately two-thirds of participating IDUs in both the
baseline (67%) and final interviews (62%) had also smoked crack in the six months prior to
their interview and among these crack-smoking IDUs frequency of engagement in smoking
crack was high. As shown in Table 13, close to two-thirds of both baseline (64%) and final
participants (64%) reported smoking crack on a regular basis at least once a week; one-
quarter of both baseline (26%) and final participants (24%) participants were frequent
crack smokers, smoking crack on a daily basis, while just over one-third of both baseline
(36%) and final participants (36%) reported less frequent engagement, smoking crack once
in a while not every week.
Table 13 Drug Use Patterns:
Frequency of Smoking Crack Six Months Prior to Interview
Baseline Final N=1622 N=1643 N (%) N (%)
n=1039 n=964 Not every week 374 (36.0) 343 (35.6)
Once or twice a week 179 (17.2) 204 (21.2)
Three or more times a week 215 (20.7) 186 (19.3)
Daily 271 (26.1) 231 (24.0)
In the month prior to interview, participants in the final interviews reported a slightly
reduced average number of days of smoking crack - 13 days compared to the 14 reported
by baseline participants, although the range reported by both baseline and final participants
was of one to 31 days. Although final participants reported slightly less days of smoking
crack compared with baseline participants, final participants reported smoking more on the
days they did smoke - 24 times a day compared with the 22 times reported by the baseline
participants. However the range of the average number of times per day baseline and final
participants smoked was the same - from one to 1,000 times (Table 14).

OHRDP FINAL REPORT Page 31
Table 14 Drug Use Patterns:
Frequency of Smoking Crack Month Prior to Interview
Baseline Final
N=1622 N=1643 p-value
Days smoked crack in month prior to interview n=925 N=882
Mean (standard deviation) 13.9 (10.7) 13.2 (10.7)
Range 1 to 31 1 to 31
Number of times a day smoked crack n=982 n=871
Mean (standard deviation) 21.9 (49.6) 23.5 (66.7)
Range 1 to 1000 1 to 1000

OHRDP FINAL REPORT Page 32
3.4 Use of Recommended Equipment
3.4.1 Drug preparation and injection preparation equipment
Breaking down non-dissolvable drugs prior to injection
Approximately half of all participants in both the baseline (52%) and final interviews (46%)
reported breaking down non-dissolvable drugs prior to injection in the six months prior to
their interview. The recommended material (acidifier) for this task is vitamin C powder from
an individual packet(26) .
As shown in Table 15, a significant decline was observed in the proportions of these
participants reporting the use of only non-recommended materials for this task and a
corresponding increase in the proportions of participants using only recommended
materials between baseline and final interviews. The use of vinegar or lemon, lime, orange
or pickle juice was reported by 53% of participants in the baseline interviews and by 47% of
participants in the final interviews; whereas 11% of participants in the final interviews
compared with 6% of participants in the baseline interviews reported the use of vitamin C
powder from an individual packet (p = 0.001).
Table 15 Drug Preparation and Injection Preparation Equipment:
Breaking Down Non-dissolvable Drugs Prior to Injection
Baseline Final
N=1622 N=1643
N (%) N (%) p-value
Broke down drugs prior to injection in six
months prior to interview n=1601 n=1614
Yes 829 (51.8) 743 (46.0) ***
No 772 (48.2) 871 (54.0)
Substance used, at least once, to break down drugs prior to injection
n=829 n=743 ***
Used recommended only 50 (6.0) 82 (11.0)
Used non-recommended only 441 (53.2) 347 (46.7)
Used both recommended and non-
recommended 338 (40.8) 314 (42.3)
Substance used the MOST to break down drugs
prior to injection n=825 n=739
Recommended 165 (20.0) 232 (31.4) ***
Non-recommended 660 (80.0) 507 (68.6)
*** p≤0.001

OHRDP FINAL REPORT Page 33
A similar significant decline was observed in relation to the material used MOST often as an
acidifier. As shown in Table 15, there was a significant decline in the proportion of final
participants (69%) reporting the use of only non-recommended materials the MOST to
break down drugs compared with the proportion of baseline participants (80%) and a
corresponding increase in the proportion of final participants (31%) reporting the use of
only recommended materials the MOST to break down drugs compared with the
proportion of baseline participants (20%) (p<0.001).

OHRDP FINAL REPORT Page 34
Dissolving drugs prior to injection
As shown in Table 16, the vast majority of participants (99%) in both the baseline and final
interviews reported dissolving drugs prior to injection in the six months prior to their
interview. Sterile water from an ampoule is the recommended source of water for this task
as detailed in the Best Practice Recommendations (26) .
A decline was observed in the proportions of these participants reporting the use of only
non-recommended materials for this task and a corresponding increase in the
proportions of participants using only recommended materials between baseline and final
interviews. The use of vinegar, lime or lemon juice, alcohol, tap water, bottled water or
water from an outside source such as from a river, water fountain or from snow on at least
one occasion was reported by 36% of participants in the baseline interviews and by 33% of
participants in the final interviews; whereas 14% of participants in the final interviews
compared with 10% of participants in the baseline interviews reported the use of sterile
water from an ampoule (p = 0.001).
Table 16 Drug Preparation and Injection Preparation Equipment:
Dissolving Drugs Prior to Injection
Baseline Final
N=1622 N=1643
N (%) N (%) p-value
Dissolved drugs in six months prior to interview
n=1620 n=1641
Yes 1605 (99.1) 1618 (98.6)
No 15 (0.9) 23 (1.4)
Liquid used, at least once, to dissolve drugs n=1605 n=1618 ***
Used recommended only 152 (9.5) 220 (13.6)
Used non-recommended only 569 (35.5) 527 (32.6)
Used both recommended and non-recommended
884 (55.1) 871 (53.8)
Liquid used the MOST to dissolve drugs n=1596 n=1612
Recommended 525 (32.9) 654 (40.6) ***
Non-recommended 1071 (67.1) 958 (59.4)
*** p≤0.001

OHRDP FINAL REPORT Page 35
The majority of participants in both the baseline and final interviews reported only non-
recommended materials as the MOST frequently accessed sources of water for dissolving
drugs prior to injection. However, there was a statistically significant reduction in the
proportion of participants reporting these sources as the MOST frequently accessed sources
in the final interviews (59%) compared with the proportion of participants in the baseline
interviews (67%) and a corresponding statistically significant increase in the proportion of
participants in the final interviews (41%) who reported the sole use of recommended
materials as the MOST frequently accessed source in comparison with the proportion in
the baseline interviews (33%) (p < 0.001).

OHRDP FINAL REPORT Page 36
Use of mixing or heating container in the six months prior to interview
In the six months prior to their interview, nearly all participants in both the baseline (98%)
and final interviews (99%) reported using a container to mix and/or heat drugs prior to
injection. A single-use cooker is the recommended equipment for this task as detailed in the
Best Practice Recommendations (26).
Among these participants, as shown in Table 17, a decline was observed in the proportions
of participants reporting the use of only non-recommended materials for this task and a
corresponding increase in the proportions of participants using only recommended
materials between baseline and final interviews. The use of spoons, bottle and needle
caps, the bottom or tops of cans, tinfoil, baggies from drugs, pill bottles or caps, or glasses
or glass jars on at least one occasion was reported by 71% of participants in the baseline
interviews and by 52% of participants in the final interviews; whereas 6% of participants in
the final interviews compared with 3% of participants in the baseline interviews reported the
use of sterile water from an ampoule (p< 0.001).
Table 17 Drug Preparation and Injection Preparation Equipment:
Use of Mixing and Heating Container Prior to Injection
Baseline Final
N=1622 N=1643
N (%) N (%) p-value
Used a container to mix and/or heat drugs in six months prior to interview
n=1619 n=1641
Yes 1590 (98.2) 1617 (98.5)
No 29 (1.8) 24 (1.5)
Container used, at least once, to mix and/or heat drugs
n=1590 n=1617 ***
Used recommended only 41 (2.6) 91 (5.6)
Used non-recommended only 1128 (70.9) 841 (52.0)
Used both recommended and non-
recommended 421 (26.5) 685 (42.4)
Container used the MOST to mix and/or heat drugs
n=1586 n=1610
Recommended 133 (8.4) 355 (22.0) ***
Non-recommended 1453 (91.6) 1255 (78.0)
*** p≤0.001

OHRDP FINAL REPORT Page 37
The majority of participants in both the baseline and final interviews reported only non-
recommended materials as the MOST frequently used container to mix and or heat their
drugs prior to injection. However, there was a statistically significant reduction in the
proportion of participants reporting these materials as the MOST frequently used materials
in the final interviews (78%) compared with the proportion of participants in the baseline
interviews (92%) and a corresponding statistically significant increase in the proportion of
participants in the final interviews (22%) who reported the sole use of recommended
materials as the MOST frequently used container in comparison with the proportion in the
baseline interviews (8%) (p< 0.001).

OHRDP FINAL REPORT Page 38
Filtering drugs prior to injection
Nearly all participants in both the baseline (94%) and final interviews (95%) reported
filtering drugs prior to injection in the six months prior to their interview. The recommended
material for this task is a filter with a pore width of 0.22µm (26) .
Among these participants, as shown in Table 18, there was a decline in the proportions of
participants reporting the use of only non-recommended materials for this task and a
corresponding increase in the proportions of participants using only recommended
materials between baseline and final interviews. The use of cigarette filters, tampons,
cotton buds or cotton balls, Kleenex or a paper towel, or an item of clothing such as socks,
on at least one occasion was reported by 52% of participants in the baseline interviews and
by 41% of participants in the final interviews; whereas 13% of participants in the final
interviews compared with 7% of participants in the baseline interviews reported the use of
new filters obtained from their NEP (p<0.001).
Table 18 Drug Preparation and Injection Preparation Equipment:
Filtering Drugs Prior to Injection
Baseline Final
N=1622 N=1643
N (%) N (%) p-value
Filtered drugs in six months prior to interview n=1621 n=1643
Yes 1524 (94.0) 1552 (94.5)
No 97 (6.0) 91 (5.5)
Item used, at least once, to filter drugs n=1524 n=1552 ***
Used recommended only 102 (6.7) 194 (12.5)
Used non-recommended only 795 (52.2) 630 (40.6)
Used both recommended and non-
recommended 627 (41.1) 728 (46.9)
Item used the MOST to filter drugs n=1516 n=1549
Recommended 359 (23.7) 545 (35.2) ***
Non-recommended 1157 (76.3) 1004 (64.8)
*** p≤0.001

OHRDP FINAL REPORT Page 39
The majority of participants in both the baseline and final interviews reported only non-
recommended materials as the MOST frequently used materials to filter their drugs.
However, there was a statistically significant reduction in the proportion of participants in
the final interviews (65%) reporting these materials as the MOST frequently used materials
compared with the proportion of participants in the baseline interviews (76%) and a
corresponding statistically significant increase in the proportion of participants in the final
interviews (35%) who reported the sole use of recommended materials as the MOST
frequently used filter in comparison with the proportion in the baseline interviews (24%)
(p<0.001).

OHRDP FINAL REPORT Page 40
Tying off vein prior to injection
Approximately two-thirds of participants in both the baseline (73%) and final interviews
(69%) reported tying off their vein prior to injection in the six months prior to their
interview. The recommended material for this task is a thin, pliable, easy-to-release
tourniquet with a non-porous surface (26) .
Among these participants, as shown in Table 19, there was a decline in the proportions of
participants reporting the use of only non-recommended materials for this task and a
corresponding increase in the proportions of participants using only recommended
materials between baseline and final interviews. The use of belts, rope, bandanas, some
form of clothing such as a shirtsleeve or string from pajamas or a necktie, shoelaces, string,
some form of cord or their own body part such as their leg, hands or toes on at least one
occasion to tie off a vein was reported by 49% of participants in the baseline interviews and
by 40% of participants in the final interviews; whereas 27% of participants in the final
interviews compared with 17% of participants in the baseline interviews reported the use of
new tourniquets obtained from their NEP(p<0.001).
Table 19 Drug Preparation and Injection Preparation Equipment:
Tying Off Vein Prior to Injection
Baseline Final
N=1622 N=1643
N (%) N (%) p-value
Tied off vein prior to injection in six months prior to interview
n=1621 n=1641
Yes 1179 (72.7) 1137 (69.3) *
No 442 (27.3) 504 (30.7)
Item used, at least once, to tie off vein prior to injection
n=1179 n=1137 ***
Used recommended only 196 (16.6) 309 (27.2)
Used non-recommended only 577 (48.9) 456 (40.1)
Used both recommended and non-recommended
406 (34.4) 372 (32.7)
Item used the MOST to tie off vein prior to injection
n=1158 n=1119
Recommended 391 (33.8) 530 (47.4) ***
Non-recommended 767 (66.2) 589 (52.6)
* p≤0.05
*** p≤0.001

OHRDP FINAL REPORT Page 41
The majority of participants in both the baseline and final interviews reported only non-
recommended materials as the MOST frequently used material to tie off their vein prior
to injection. However, there was a statistically significant reduction in the proportion of
participants in the final interviews (53%) reporting these materials as the MOST frequently
used materials compared with the proportion of participants in the baseline interviews
(66%) and a corresponding statistically significant increase in the proportion of participants
in the final interviews (47%) who reported the sole use of recommended materials as the
MOST frequently used material to tie off their vein prior to injection in comparison with the
proportion in the baseline interviews (34%) (p<0.001).

OHRDP FINAL REPORT Page 42
Cleaning skin prior to injection
Three-quarters of participants in both the baseline (76%) and final interviews (76%)
reported cleaning their skin prior to injection in the six months prior to their interview. The
recommended material for this task is an individual sterile alcohol swab(26).
Among these participants, as shown in Table 20, a decline was observed in the proportions
of participants reporting the use of only non-recommended materials and a
corresponding increase in the proportions of participants using only recommended
materials between baseline and final interviews. The use of soap and water, toilet tissue,
baby wipes, water alone, vinegar, bleach, saliva, alcohol, ether, iodine or peroxide on at
least one occasion to clean their skin prior to injection in the six months preceding their
interview was reported by 16% of participants in the baseline interviews and by 12% of
participants in the final interviews; whereas 65% of participants in the final interviews
compared with 56% of participants in the baseline interviews reported the use of individual
sterile alcohol swabs (p<0.001).
Table 20 Drug Preparation and Injection Preparation Equipment:
Cleaning Skin Prior to Injection Skin Prior to Injection
Baseline Final
N=1622 N=1643
N (%) N (%) p-value
Cleaned skin prior to injection in six months prior to interview
n=1619 n=1642
Yes 1229 (75.9) 1245 (75.8)
No 390 (24.1) 397 (24.2)
Substance used, at least once, to clean skin prior to injection
n=1229 n=1245 ***
Used recommended only 687 (55.9) 812 (65.2)
Used non-recommended only 194 (15.8) 145 (11.6)
Used both recommended and non-recommended
348 (28.3) 288 (23.1)
Substance used the MOST to clean skin prior to
injection n=1220 n=1243
Recommended 913 (74.8) 1028 (82.7) ***
Non-recommended 307 (25.2) 215 (17.3)
*** p≤0.001

OHRDP FINAL REPORT Page 43
The majority of participants in both the baseline and final interviews reported only
recommended materials as the MOST frequently used material to clean their skin prior to
injection and there was a statistically significant increase in the proportion of participants in
the final interviews (83%) reporting these materials as the MOST frequently used materials
compared with the proportion of participants in the baseline interviews (75%). A
corresponding statistically significant decrease in the proportion of participants in the final
interviews (17%) who reported the sole use of non-recommended materials as the
MOST frequently used material to clean their skin prior to injection in comparison with the
proportion in the baseline interviews (25%) was observed (p<0.001).

OHRDP FINAL REPORT Page 44
Rinsing needles following injection
In the six months prior to their interview, 42% of participants in the baseline interviews and
45% of participants in the final interviews reported that they did not re-use their needles so
did not rinse them between injections. This positive change was reflected in the significantly
smaller proportion of final participants (49%) compared with baseline participants (57%)
who reported rinsing their needles in the six months prior to their interview (p<0.001). The
recommended material for this task is a single-use 2mL sterile water ampoule (26).
As shown in Table 21, among participants who did re-reuse and rinse their needles, an
increase was observed between baseline and final interviews in the proportions of
participants who carried out this task using only recommended materials; however an
increase was also observed between baseline and final interviews in the proportions of
participants reporting the use of only non-recommended materials. Three percent of
participants in the baseline interviews and 5% of participants in the final interviews reported
the use of individual sterile water from an ampoule; whereas the use of tap water, bottled
water, rain/puddle water, bleach, urinal/toilet water or saliva to rinse needles in the six
months preceding their interview was reported by 80% of participants in the final interviews
compared with 74% of participants in the baseline interviews (p<0.001).
Table 21 Drug Preparation and Injection Preparation Equipment:
Rinsing Needles Following Injection
Baseline Final
N=1622 N=1643
N (%) N (%) p-value
Rinsed needles in six months prior to interview n=1620 n=1639
Yes 930 (57.4) 802 (48.9) ***
No 11 (0.7) 99 (6.0)
N/A: Did not re-use needles 679 (41.9) 738 (45.0)
Liquid used, at least once, to rinse needles n=930 n=802 ***
Used recommended only 32 (3.4) 38 (4.7)
Used non-recommended only 687 (73.9) 642 (80.0)
Used both recommended and non-recommended
211 (22.7) 122 (15.2)
Liquid used the MOST to rinse needles n=920 n=798
Recommended 84 (9.1) 81 (10.2)
Non-recommended 836 (90.9) 717 (89.8)
*** p≤0.001

OHRDP FINAL REPORT Page 45
In terms of the liquid used the MOST to rinse needles between injections, there was no
significant change observed between the baseline and final evaluation time points in the use
of recommended materials. Only a small proportion of both final (10%) and baseline
participants (9%) had used the recommended method of rinsing with sterile water from an
ampoule; the vast majority of both final (90%) and baseline participants (91%) had used
tap water, bleach, hot or boiled water, lemon juice or vinegar as the liquid they had used
the most to rinse needles between injections.

OHRDP FINAL REPORT Page 46
3.4.2 Crack-smoking equipment
Among crack-smoking participants (1,051 baseline participants, 982 participants in the final
interviews), the greatest proportion of participants in both the baseline (83%) and final
interviews (89%) had at some point used a glass stem to smoke crack as shown in Table
22. Although the ranking of other materials and devices that had been used to smoke crack
remained the same between the baseline and final evaluation points, a significant change in
the pattern of use was observed. In addition to the greater proportion of final participants
who reported the use of a crack pipe, a greater proportion of final (79%) compared with
baseline participants (76%) reported that they had used a metal pipe at some point to
smoke crack, and a greater proportion of final (74%) compared with baseline participants
(71%) reported that they had used a pop can. Conversely, a smaller proportion of final
(21%) compared with baseline participants (23%) reported that they had at some point
used a car antenna to smoke crack.
In terms of more recent use, again a significant change in the pattern of use was observed.
The greatest proportion of participants in both the baseline (77%) and final interviews
(81%) had used a glass stem to smoke crack in the six months prior to interview as shown
in Table 22. However, this increase in use observed among final participants was the only
increase observed; the use of all other materials to smoke crack declined among
participants in the final interviews compared with participants in the baseline interviews.
Fifty-seven percent of final participants compared with 60% of baseline participants had
used a metal pipe, 45% of final participants compared with 46% of baseline participants had
used a pop can, 42% of final participants compared with 46% of baseline participants had
used an inhaler and 9% of final participants compared with 11% of baseline participants had
used a car antenna.
The use of non-recommended materials remained high when equipment used the MOST to
smoke crack among final and baseline participants was examined. However, a non-
significant decline in their use was observed with a corresponding non-significant increase in
the proportion of final participants (54%) compared with baseline participants (49%) who
reported that they had used the recommended material, a glass stem, the MOST to
smoke crack in the six months prior to their interview.

OHRDP FINAL REPORT Page 47
Table 22 Equipment Used to Smoke Crack
Baseline Final
N=1051 N=982
N (%) N (%) p-value
Equipment EVER used n = 1040 a n = 967 a
Glass stem 864 (83.1) 861 (89.0)
Metal pipe 788 (75.8) 764 (79.0)
Light bulb 136 (13.1) 121 (12.5)
Car antenna 234 (22.5) 201 (20.8)
Pop can 741 (71.3) 716 (74.0)
Inhalers 723 (69.5) 667 (69.0)
Other 456 (43.8) 395 (40.8)
Equipment used at least once six months prior to interview
n = 1032 a n = 966 a
Glass stem 790 (76.6) 781 (80.8)
Metal pipe 618 (59.9) 546 (56.5)
Light bulb 56 (5.4) 37 (3.8)
Car antenna 109 (10.6) 87 (9.0)
Pop can 470 (45.5) 436 (45.1)
Inhalers 475 (46.0) 407 (42.1)
Other 321 (31.1) 288 (29.8)
Equipment used the MOST six months prior to interview
n = 1027 a n = 944 a
Glass stem 500 (48.7) 505 (53.5)
Metal pipe 207 (20.2) 180 (19.1)
Light bulb 0 (0.0) 1 (0.1)
Car antenna 5 (0.5) 2 (0.2)
Pop can 77 (7.5) 64 (6.8)
Inhalers 112 (10.9) 87 (9.2)
Other 126 (12.3) 105 (11.1)
a Participants could report more than one piece of equipment to smoke crack, therefore % may be >100%.

OHRDP FINAL REPORT Page 48
3.5 Accessing Sterile/New Equipment
3.5.1 Sterile/new injection supplies
Sterile needles
Baseline participants had identified four main sources from which they had ever obtained
sterile needles on at least one occasion; 70% had obtained sterile needles from a NEP, 51%
from a pharmacy, 34% from friends or family and 12% from a community agency. As
shown in Table 23, these four sources were similarly identified as the main sources by final
participants. However, a significant increase in the proportion of final participants accessing
the NEP was observed with a corresponding decline in proportions accessing the other
sources. Seventy-six percent of final participants had obtained sterile needles from a NEP,
41% from a pharmacy, 32% from friends or family and 9% from a community agency
(p<0.001).

OHRDP FINAL REPORT Page 49
Table 23 Accessing Sterile/Unused Equipment: Access to Sterile Needles
Baseline Final
N=1622 N=1643
N (%) N (%) p-value
Collected sterile needles at least once from... n = 1616 n = 1639 ***
Pharmacy 822 (50.9) 676 (41.2)
NEP 1135 (70.2) 1242 (75.8)
Community Agency 188 (11.6) 139 (8.5)
Sexual Partner(s) 107 (6.6) 87 (5.3)
Friend(s)/Family 549 (34.0) 516 (31.5)
People I don't know well 73 (4.5) 40 (2.4)
People I don't know at all 19 (1.2) 16 (1.0)
Make them myself from different sources 6 (0.4) 2 (0.1)
Other 48 (3.0) 45 (2.7)
Collected sterile needles the MOST from... n = 1505 n = 1618 ***
Pharmacy 280 (18.6) 187 (11.6)
NEP 876 (58.2) 1075 (66.4)
Community Agency 70 (4.7) 42 (2.6)
Sexual Partner(s) 11 (0.7) 20 (1.2)
Friend(s)/Family 242 (16.1) 276 (17.1)
People I don't know well 11 (0.7) 7 (0.4)
Make them myself from different sources 3 (0.2) 0 (0.0)
Other 12 (0.8) 11 (0.7)
*** p≤0.001

OHRDP FINAL REPORT Page 50
These four sources were identified as those participants had obtained sterile needles from
the MOST in the six months preceding their interview, although significant changes were
observed in terms of the proportions accessing each. A NEP remained the most frequently
accessed source for final participants (66%) as it had for baseline participants (58%). A
greater proportion of final participants (17%) compared with baseline participants (16%)
had obtained their sterile needles the most from friends or family, a smaller proportion of
final participants (12%) compared with baseline participants (19%) had obtained their
sterile needles the most from a pharmacy and a smaller proportion of final participants
(3%) compared with baseline participants (5%) had obtained their sterile needles the most
from a community agency (p<0.001).

OHRDP FINAL REPORT Page 51
Sterile water
A significant change in the pattern of sources of sterile water accessed by baseline
compared with final participants was observed. A shown in Table 24, a greater proportion of
final (62%) compared with baseline participants (55%) had accessed a NEP to obtain on at
least one occasion sterile water, while a smaller proportion of final participants (5%)
compared with baseline participants (7%) reported accessing a community agency to obtain
sterile water (p<0.01). However, of concern must be the high proportion of participants at
both baseline (66%) and at the final evaluation point (65%) who reported using other
sources of water.
Table 24 Access to Sterile Water
Baseline Final
N=1622 N=1643
N (%) N (%) p-value
Collected sterile water at least once from... n = 1564 n = 1585 **
Pharmacy 40 (2.6) 30 (1.9)
NEP 862 (55.1) 988 (62.3)
Community Agency 106 (6.8) 74 (4.7)
Sexual Partner(s) 54 (3.5) 41 (2.6)
Friend(s)/Family 195 (12.5) 214 (13.5)
People I don't know well 31 (2.0) 13 (0.8)
People I don't know at all 13 (0.8) 3 (0.2)
Make them myself from different sources 1029 (65.8) 1023 (64.5)
Other 9 (0.6) 14 (0.9)
Collected sterile water the MOST from... n = 1481 n = 1562 ***
Pharmacy 12 (0.8) 9 (0.6)
NEP 571 (38.6) 731 (46.8)
Community Agency 32 (2.2) 26 (1.7)
Sexual Partner(s) 7 (0.5) 12 (0.8)
Friend(s)/Family 83 (5.6) 97 (6.2)
People I don't know well 4 (0.3) 3 (0.2)
Make them myself from different sources 770 (52.0) 683 (43.7)
Other 2 (0.1) 1 (0.1)
** p≤0.01
*** p≤0.001
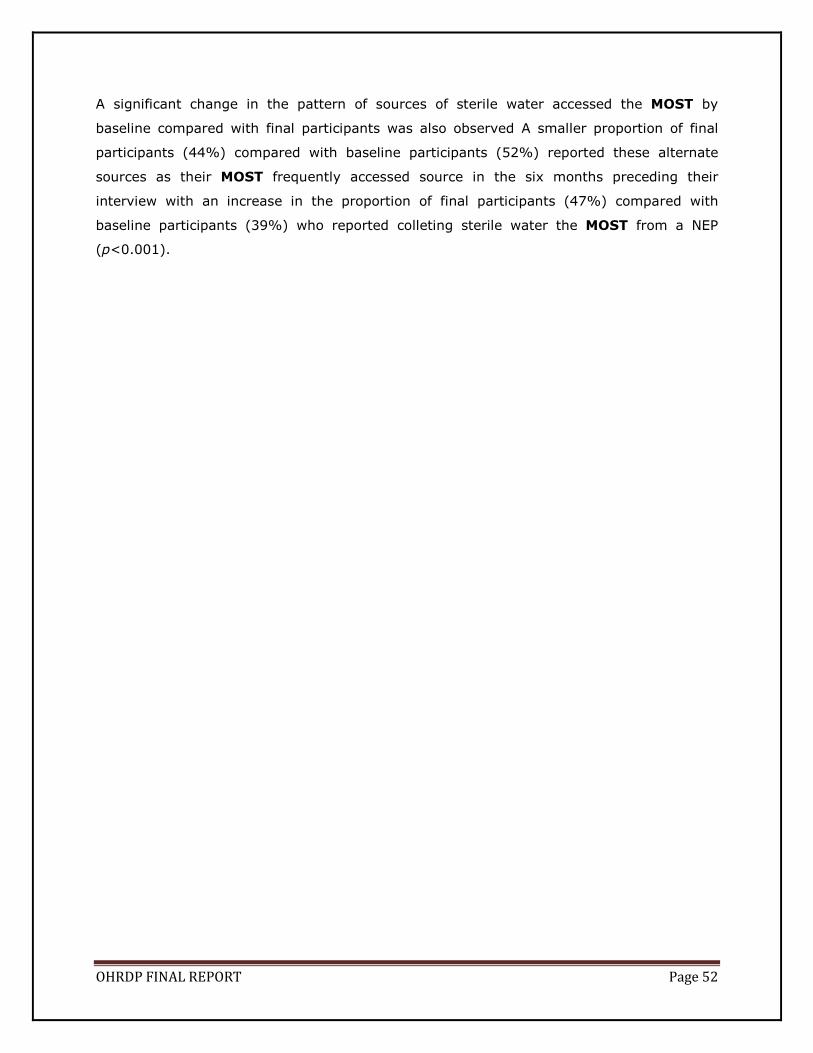
OHRDP FINAL REPORT Page 52
A significant change in the pattern of sources of sterile water accessed the MOST by
baseline compared with final participants was also observed A smaller proportion of final
participants (44%) compared with baseline participants (52%) reported these alternate
sources as their MOST frequently accessed source in the six months preceding their
interview with an increase in the proportion of final participants (47%) compared with
baseline participants (39%) who reported colleting sterile water the MOST from a NEP
(p<0.001).

OHRDP FINAL REPORT Page 53
New filters
Similarly, a significant change in the pattern of sources of new filters accessed by baseline
compared with final participants was observed, with the pattern of accessing new filters
resembling that of accessing sterile water. As shown in Table 25, the greatest proportions of
both baseline and final participants reported making their own filters from different sources
but with a decline among final participants (68%) compared with baseline participants
(72%) reporting this source; an increase in the proportion of final participants (56%)
compared with baseline participants (43%) who reported that on at least one occasion they
had collected new filters from a NEP; and a smaller proportion of final participants (4%)
compared with baseline participants (6%) who reported accessing a community agency to
obtain new filters (p<0.001).
Table 25 Access to New Filters
Baseline Final
N=1622 N=1643
N (%) N (%) p-value
Collected new filters at least once from... n = 1500 n = 1518 ***
Pharmacy 91 (6.1) 49 (3.2)
NEP 639 (42.6) 852 (56.1)
Community Agency 93 (6.2) 62 (4.1)
Sexual Partner(s) 41 (2.7) 41 (2.7)
Friend(s)/Family 151 (10.1) 195 (12.8)
People I don't know well 22 (1.5) 13 (0.9)
People I don't know at all 11 (0.7) 4 (0.3)
Make them myself from different sources 1081 (72.1) 1032 (68.0)
Other 10 (0.7) 13 (0.9)
Collected new filters the MOST from... n = 1424 n = 1485 ***
Pharmacy 46 (3.2) 16 (1.1)
NEP 399 (28.0) 608 (40.9)
Community Agency 28 (2.0) 19 (1.3)
Sexual Partner(s) 7 (0.5) 10 (0.7)
Friend(s)/Family 63 (4.4) 89 (6.0)
People I don't know well 5 (0.4) 3 (0.2)
Make them myself from different sources 873 (61.3) 739 (49.8)
Other 3 (0.2) 1 (0.1)
*** p≤0.001

OHRDP FINAL REPORT Page 54
Again, similar to the pattern of accessing sterile water, a significant change in the pattern of
sources of new filters accessed the MOST by baseline compared with final participants was
also observed. A smaller proportion of final participants (50%) compared with baseline
participants (61%) reported these alternate sources as their MOST frequently accessed
source in the six months preceding their interview with an increase in the proportion of final
participants (41%) compared with baseline participants (28%) who reported collecting new
filters the MOST from a NEP (p<0.001).

OHRDP FINAL REPORT Page 55
Sterile or new cookers
The significant change observed in the pattern of accessing sterile water and new filters was
also observed in new or sterile cooker access patterns. As shown in Table 26, the greatest
proportions of participants reported making their own cookers from different sources but a
decline was observed among the proportions of final participants (76%) compared with
baseline participants (82%) who reported these sources. In addition, an increase was
observed in the proportion of final participants (46%) compared with baseline participants
(28%) who reported that on at least one occasion they had collected new or sterile cookers
from a NEP, while equal proportions of final (4%) and baseline participants (4%) reported
accessing a community agency to obtain new or sterile cookers (p<0.001).
Table 26 Access to Sterile/New Cookers
Baseline Final
N=1622 N=1643 p-value
N (%) N (%)
Collected sterile/new cookers at least once from...
n = 1537 n = 1544 ***
Pharmacy 6 (0.4) 6 (0.4)
NEP 436 (28.4) 710 (46.0)
Community Agency 56 (3.6) 61 (4.0)
Sexual Partner(s) 33 (2.1) 44 (2.8)
Friend(s)/Family 175 (11.4) 200 (13.0)
People I don't know well 38 (2.5) 15 (1.0)
People I don't know at all 19 (1.2) 8 (0.5)
Make them myself from different sources 1260 (82.0) 1179 (76.4)
Other 12 (0.8) 12 (0.8)
Collected sterile/new cookers the MOST from... n = 1469 n = 1516 ***
Pharmacy 2 (0.1) 0 (0.0)
NEP 240 (16.3) 453 (29.9)
Community Agency 8 (0.5) 17 (1.1)
Sexual Partner(s) 6 (0.4) 11 (0.7)
Friend(s)/Family 88 (6.0) 89 (5.9)
People I don't know well 7 (0.5) 2 (0.1)
Make them myself from different sources 1109 (75.5) 943 (62.2)
Other 9 (0.6) 1 (0.1)
*** p≤0.001

OHRDP FINAL REPORT Page 56
A significant change in the pattern of sources of new or sterile cookers accessed the MOST
by baseline compared with final participants was also observed. A decline was observed in
the proportion of final participants (62%) compared with baseline participants (76%) who
reported alternate sources as their MOST frequently accessed source of new or sterile
cookers in the six months preceding their interview with an increase in the proportion of
final participants (30%) compared with baseline participants (16%) who reported collecting
new or sterile cookers the MOST from a NEP (p<0.001).

OHRDP FINAL REPORT Page 57
New tourniquets
As shown in Table 27, significant changes in the pattern of access of new tourniquets were
similarly observed among final compared with baseline participants. As observed with the
collection of other harm reduction materials, substantial proportions reported using other
materials from different sources as their tourniquets but a decline was observed among final
participants (52%) compared with baseline participants (63%) in reporting these sources.
An increase was observed in the proportion of final participants (55%) compared with
baseline participants (43%) who reported that on at least one occasion they had collected
new tourniquets from a NEP and a decline was observed among final participants (4%)
compared with baseline participants (6%) who reported accessing a community agency to
obtain new tourniquets (p<0.001).
Table 27 Access to New Tourniquets
Baseline Final
N=1622 N=1643
N (%) N (%) p-value
Collected new tourniquets at least once from... n = 1080 n = 1033 ***
Pharmacy 8 (0.7) 7 (0.7)
NEP 468 (43.3) 565 (54.7)
Community Agency 62 (5.7) 44 (4.3)
Sexual Partner(s) 25 (2.3) 28 (2.7)
Friend(s)/Family 114 (10.6) 133 (12.9)
People I don't know well 14 (1.3) 5 (0.5)
People I don't know at all 7 (0.6) 3 (0.3)
Make them myself from different sources 683 (63.2) 539 (52.2)
Other 15 (1.4) 16 (1.5)
Collected new tourniquets the MOST from... n = 1044 n = 1023 ***
Pharmacy 6 (0.6) 3 (0.3)
NEP 359 (34.4) 489 (47.8)
Community Agency 26 (2.5) 18 (1.8)
Sexual Partner(s) 7 (0.7) 10 (1.0)
Friend(s)/Family 64 (6.1) 89 (8.7)
People I don't know well 5 (0.5) 1 (0.1)
People I don't know at all 1 (0.1) 0 (0.0)
Make them myself from different sources 568 (54.4) 408 (39.9)
Other 8 (0.8) 5 (0.5)
*** p≤0.001

OHRDP FINAL REPORT Page 58
A significant change in the pattern of sources of new tourniquets accessed the MOST by
baseline compared with final participants was also observed. A decline was observed in the
proportion of final participants (40%) compared with baseline participants (54%) who
reported alternate sources as their MOST frequently accessed source of new tourniquets in
the six months preceding their interview with an increase in the proportion of final
participants (48%) compared with baseline participants (34%) who reported collecting new
tourniquets the MOST from a NEP (p<0.001).

OHRDP FINAL REPORT Page 59
Sterile Acidifiers
The significant changes observed in the patterns of accessing sterile water, new filters, new
or sterile cookers and new tourniquets between baseline and final participants was also
observed in sterile acidifier access patterns. As shown in Table 28. the greatest proportions
of participants reported making their own acidifiers from different sources but a decline was
observed among the proportions of final participants (71%) compared with baseline
participants (77%) who reported these sources, an increase was observed in the proportion
of final participants (51%) compared with baseline participants (37%) who reported that on
at least one occasion they had collected sterile acidifiers from a NEP and a decline was
observed among the proportions of final participants (5%) compared with baseline
participants (6%) who reported accessing a community agency to obtain sterile acidifiers
(p<0.001).

OHRDP FINAL REPORT Page 60
Table 28 Access to Sterile Acidifiers
Baseline Final
N=1622 N=1643
N (%) N (%) p-value
Collected unused acidifiers at least once from... n = 790 n = 686 ***
Pharmacy 13 (1.6) 4 (0.6)
NEP 291 (36.8) 349 (50.9)
Community Agency 49 (6.2) 36 (5.2)
Sexual Partner(s) 19 (2.4) 20 (2.9)
Friend(s)/Family 109 (13.8) 87 (12.7)
People I don't know well 16 (2.0) 10 (1.5)
People I don't know at all 10 (1.3) 4 (0.6)
Make them myself from different sources 606 (76.7) 484 (70.6)
Other 4 (0.5) 8 (1.2)
Collected unused acidifiers the MOST from... n = 749 n = 677 ***
Pharmacy 7 (0.9) 3 (0.4)
NEP 168 (22.4) 255 (37.7)
Community Agency 15 (2.0) 10 (1.5)
Sexual Partner(s) 2 (0.3) 6 (0.9)
Friend(s)/Family 46 (6.1) 38 (5.6)
People I don't know well 2 (0.3) 3 (0.4)
People I don't know at all 1 (0.1) 0 (0.0)
Make them myself from different sources 506 (67.6) 360 (53.2)
Other 2 (0.3) 2 (0.3)
*** p≤0.001
A significant change in the pattern of sources of sterile acidifiers accessed the MOST by
baseline compared with final participants was also observed. A decline was observed in the
proportion of final participants (53%) compared with baseline participants (68%) who
reported alternate sources as their MOST frequently accessed source of sterile acidifiers in
the six months preceding their interview with an increase in the proportion of final
participants (38%) compared with baseline participants (22%) who reported collecting
sterile acidifiers the MOST from a NEP (p<0.001).

OHRDP FINAL REPORT Page 61
Sterile alcohol swabs
Although in comparison to the previous patterns of collection of items of drug preparation
and injection preparation equipment only small proportions of both baseline and final
participants reported making sterile alcohol swabs themselves from other sources at least
once in the six months prior to their interview, a significant change was nevertheless
observed in the patterns of accessing sterile alcohol swabs between baseline and final
participants. As shown in Table 29, an increase was observed in the proportion of final
participants (77%) compared with baseline participants (74%) who reported that on at least
one occasion they had collected sterile alcohol swabs from a NEP and among the proportion
of final participants (18%) compared with baseline participants (16%) who reported that on
at least one occasion they had collected sterile alcohol swabs from a friend or family
member. Conversely, a decline was observed among the proportions of final participants
(6%) compared with baseline participants (8%) who reported making swabs themselves
from different sources and among the proportions of final participants (6%) compared with
baseline participants (9%) who reported accessing a community agency to obtain sterile
alcohol swabs (p<0.001).
Significant changes in the pattern of sources accessed the MOST for sterile alcohol swabs
among baseline compared with final participants were also observed. A decline was
observed in the proportion of final participants (3%) compared with baseline participants
(6%) who reported alternate sources as their MOST frequently accessed source of sterile
alcohol swabs in the six months preceding their interview and among the proportions of final
participants (3%) compared with baseline participants (5%) who reported accessing a
community agency to obtain sterile alcohol swabs. Conversely, an increase was observed in
the proportion of final participants (73%) compared with baseline participants (67%) who
reported collecting sterile alcohol swabs the MOST from a NEP and among the proportion of
final participants (13%) compared with baseline participants (10%) who reported collecting
sterile alcohol swabs the MOST from a friend or family member (p<0.001).

OHRDP FINAL REPORT Page 62
Table 29 Access to Sterile Alcohol Swabs
Baseline Final
N=1622 N=1643
N (%) N (%) p-value
Collected unused alcohol swabs at least once from...
n = 1197 n = 1238 ***
Pharmacy 166 (13.9) 118 (9.5)
NEP 885 (73.9) 953 (77.0)
Community Agency 113 (9.4) 72 (5.8)
Sexual Partner(s) 42 (3.5) 40 (3.2)
Friend(s)/Family 194 (16.2) 228 (18.4)
People I don't know well 12 (1.0) 7 (0.6)
People I don't know at all 7 (0.6) 1 (0.1)
Make them myself from different sources 92 (7.7) 70 (5.7)
Other 26 (2.2) 24 (1.9)
Collected unused alcohol swabs the MOST
from... n = 1160 n = 1229 ***
Pharmacy 103 (8.9) 73 (5.9)
NEP 782 (67.4) 893 (72.7)
Community Agency 61 (5.3) 36 (2.9)
Sexual Partner(s) 7 (0.6) 15 (1.2)
Friend(s)/Family 117 (10.1) 162 (13.2)
People I don't know well 4 (0.3) 1 (0.1)
Make them myself from different sources 73 (6.3) 41 (3.3)
Other 13 (1.1) 8 (0.7)
*** p≤0.001

OHRDP FINAL REPORT Page 63
3.5.2 New crack-smoking supplies
Not surprisingly, as few Ontario NEPs or community agencies distribute safer inhalation
equipment, the greatest proportion of both baseline and final participants reported making
pipes themselves from other materials. As shown in Table 30, a decrease was observed in
the proportion of final (46%) compared with baseline participants (55%) who reported
these sources of smoking supplies. Declines were also observed in the proportion of final
participants (36%) compared with baseline participants (38%) who reported collecting new
smoking supplies from smoke shops and in the proportion of final participants (28%)
compared with baseline participants (31%) who reported collecting supplies from other
people. The proportion of participants accessing smoking supplies from their local NEP or
local community agency increased from 14% of baseline participants to 18% of final
participants and the proportion of participants accessing smoking supplies from a NEP in
another place increased from 5% of baseline participants to 6% of final participants
(p<0.001).
Table 30 Access to New Crack-smoking Supplies
Baseline Final
N=1622 N=1643
N (%) N (%) p-value
Collected new crack-smoking supplies at least once from...
n = 1028 n = 963 ***
Buy them from smoke shops 390 (37.9) 351 (36.4)
Get them from local NEP or other
local community agency 143 (13.9) 175
(18.2)
Make them from different pieces 570 (55.4) 447 (46.4)
Get them from other people 314 (30.5) 266 (27.6)
Other 144 (14.0) 193 (20.0)
NEP in another place 47 4.6 56 (5.8)
Collected new crack-smoking supplies the MOST from...
n = 1019 n = 942 ***
NEP/Community agency 122 (12.0) 133 (14.1)
Combined other source 868 (85.2) 772 (82.0)
NEP in another place 29 (2.8) 37 (3.9)
*** p≤0.001

OHRDP FINAL REPORT Page 64
In terms of the MOST frequently accessed source of these materials, a slight increase was
observed in the proportion of final participants (14%) compared with baseline participants
(12%) who reported collecting new smoking supplies the MOST from a NEP or community
agency in the six months prior to their interview; however this difference was not
statistically significant.

OHRDP FINAL REPORT Page 65
3.6 Barriers to the Collection of Equipment through Local NEP or Community Agency
3.6.1 Barriers to the collection of sterile injection supplies
Unavailability of supplies
A significant decline was observed between the proportions of participants in the final and
baseline interviews who reported the experience of being unable, in the six months prior to
their interview, to get ANY injection supplies from their local NEP or other community
agency. As shown in Table 31, the unavailability of supplies was reported by 24% of
participants in the baseline interviews and by 14% of participants in the final interviews
(p<0.001).
Table 31 Unavailability of Supplies in Past Six Months: Injection Supplies
Baseline Final
N=1622 N=1643
N (%) N (%) p-value
n=1163 n=1269 Unable to get ANY drug injection supplies from local NEP or other community agency No 884 (76.0) 1098 (86.5) ***
Yes 279 (24.0) 171 (13.5)
n=1152 n=1259 Unable to get ENOUGH drug injection supplies from local NEP or other community agency No 925 (80.3) 1105 (87.8) ***
Yes 227 (19.7) 154 (12.2)
*** p≤0.001
Insufficient supplies
Similarly, a significant decline was observed between the proportions of participants in the
final and baseline interviews who reported the experience of being unable, in the six months
prior to interview, to get ENOUGH injection supplies from their local NEP or other
community agency. As shown in Table 31, being unable to collect enough supplies for their
needs was reported by 20% of participants in the baseline interviews and by 12% of
participants in the final interviews (p<0.001).

OHRDP FINAL REPORT Page 66
3.6.2 Barriers to the collection of new crack-smoking supplies
Unavailability of crack-smoking supplies
Data from Phase 2 of the associated OHRDP Process Evaluation revealed that five of the
31 participating sites in this process component of the OHRDP evaluation were distributing
at least some safer inhalation supplies. Kingston and Toronto reported that they always
distributed glass stems, brass filters, chopsticks, rubber mouthpieces and safer smoking
information either as individual items or in a kit; Durham reported that they sometimes
were able to distribute the above items; and for Ottawa participants these items were
available through community agencies but not through Ottawa Public Health. Hamilton was
distributing rubber mouthpieces and safer smoking information and Wellington-Dufferin-
Guelph was distributing glass stems, rubber mouthpieces and safer smoking information.
As shown in Table 32, among the 143 baseline participants and 174 final participants from
the six sites (Ottawa, Kingston, Toronto, Wellington-Dufferin-Guelph, Hamilton, Durham)
distributing safer inhalation supplies at the time of the evaluation interviews, a significant
increase was observed in the proportions of final participants (25%) compared with baseline
participants (8%) who reported being unable to collect ANY safer smoking supplies from
their local NEP or other community agency in the six months prior to their interview
(p<0.001).
A significant increase was also observed in the frequency with which this unavailability
occurred; a greater proportion of final participants (48%) compared with baseline
participants (8%) reported that this unavailability happened “every time” or “frequently” in
the six months prior to their interview (p<0.05).

OHRDP FINAL REPORT Page 67
Table 32 Unavailability of Supplies in Past Six Months: Crack-smoking Supplies
Baseline Final
N=143 N=174
N (%) N (%) p-value
Unable to get ANY crack/crystal meth-smoking
supplies from local NEP or community agency in the six months prior to interview
n = 1612 n = 1616
No 131 (91.6) 131 (75.3)
Yes 12 (8.4) 43 (24.7)
If YES, frequency of not being able to get ANY
crack/crystal meth-smoking supplies in six months prior to interview
n = 12 n = 42
Every time 0 (0.0) 1 (2.4)
Frequently 1 (8.3) 19 (45.2)
Sometimes 2 (16.7) 9 (21.4)
Hardly ever 9 (75.0) 13 (31.0)

OHRDP FINAL REPORT Page 68
3.7 Methods of Disposal of Used Equipment
3.7.1 Disposal of used needles
As shown in Table 33, a significant change in the pattern of methods of disposal of used
needles in the six months prior to interview by final compared with baseline participants was
observed; although patterns of safer disposal predominated. A greater proportion of final
(53%) compared with baseline participants (49%) had, on at least one occasion, returned
them to the NEP while equal proportions of both baseline (11%) and final participants
(11%) had placed them in needle drop boxes. However, a decline in methods of safer
disposal of needles in the garbage was observed; 10% of final compared with 13% of
baseline participants reported placing them in a biohazard container before throwing in the
garbage and 36% of final compared with 40% of baseline participants reported placing them
in a container such as a plastic bottle or can before throwing them in the garbage.
In terms of patterns of unsafe disposal, a decline was observed among the proportions of
final participants (16%) compared with baseline participants (21%) who reported throwing
them loose in the garbage and among the proportions of final participants (6%) compared
with baseline participants (9%) who reported giving them to others to discard. Equal
proportions of both final (8%) and baseline participants (8%) reported throwing them loose
in the streets, parks, alleys or down a sewer (p<0.001).
Of all the methods that both final and baseline participants had used, the MOST frequently
used method of disposal of used needles was that recommended for safer disposal (26). In
the six months prior to their interview, the greatest proportion of final participants (44%)
reported returning them to the NEP themselves; this was a significant increase in
proportions when compared with baseline participants, 37% of whom had returned them to
the NEP themselves. Similarly, a decline was observed in engagement in two methods of
unsafe disposal; 10% of final participants compared with 13% of baseline participants
reported that the method they had used the MOST to dispose of their used needles was to
throw them loose in the garbage and 2% of final participants compared with 3% of baseline
participants reported that the method they had used MOST to dispose of their used needles
was to throw them in the street or alley, in a park or down a sewer. (p=0.001).

OHRDP FINAL REPORT Page 69
Table 33 Methods of Disposal of Used Needles/Syringes
Baseline Final
N=1622 N=1643
N (%) N (%) p-value
Method n=1614 n=1642 ***
Throwing them loose in the garbage 332 (20.6) 265 (16.1)
Putting them in a container (e.g., plastic bottle, can) and then throwing them in the garbage
650 (40.3) 597 (36.4)
Putting them in a biohazard container and then
throwing them in the garbage
203 (12.6) 160 (9.7)
Returning them to the NEP 792 (49.1) 868 (52.9)
Throwing them in the needle drop boxes 179 (11.1) 174 (10.6)
Giving them to others to discard 137 (8.5) 97 (5.9)
Giving them to others to return to the NEP 300 (18.6) 235 (14.3)
Throwing them in the street/parks/alleys/sewers
132 (8.2) 125 (7.6)
Other 121 (7.5) 109 (6.6)
Method used the MOST n=1605
n=1640
***
Throwing them loose in the garbage 204 (12.7) 164 (10.0)
Putting them in a container (e.g., plastic bottle,
can) and then throwing them in the garbage
415 (25.9) 358 (21.8)
Putting them in a biohazard container and then
throwing them in the garbage
87 (5.4) 73 (4.5)
Returning them to the NEP 593 (36.9) 721 (44.0)
Throwing them in the needle drop boxes 60 (3.7) 66 (4.0)
Giving them to others to discard 27 (1.7) 46 (2.8)
Giving them to others to return to the NEP 111 (6.9) 108 (6.6)
Throwing them in the street/parks/alleys/sewers
40 (2.5) 34 (2.1)
Other 68 (4.2) 70 (4.3)
*** p≤0.001

OHRDP FINAL REPORT Page 70
3.7.2 Disposal of used drug injection equipment
Overall, in contrast to the high prevalence of safer disposal of used needles, used injection
and drug preparation equipment was less safely disposed at both baseline and final
evaluation time points. However, a significant change in the pattern of disposal of used drug
injection and preparation equipment in the six months prior to interview by final compared
with baseline participants was observed with a trend toward safer disposal.
In terms of safer methods of disposal and in contrast to the high return of used needles to
a NEP, as shown in Table 34 smaller proportions of both baseline and final participants had
returned used equipment to the NEP, but an increase was observed among the proportion of
final participants (18%) compared with the proportion of baseline participants (16%) who
reported this method of disposal. A similar increase was observed in the proportion of final
participants (25%) compared with the proportion of baseline participants (23%) who
reported putting them in a puncture-free container before placing in the garbage. Although
the greatest proportion of both baseline and final participants reported throwing used
equipment loose in the garbage, a decline was observed in the proportions of participants
reporting this unsafe method from 66% of baseline participants to 63% of final
participants and 3% of final participants compared with 4% of baseline participants reported
throwing used equipment loose on the street, in parks, in alleys or down sewers (p<0.001).
The greatest proportion of both final and baseline participants reported an unsafe method of
disposal of used injection preparation equipment as the MOST common method they had
used in the six months prior to interview; however a decline in the proportions of final
(54%) compared with baseline participants (55%) who reported throwing used equipment
loose in the garbage was observed. Similarly an increase in the proportions of final
compared with baseline participants who reported safer methods of disposal was observed;
18% of final compared with 16% of baseline participants reported placing used equipment
in a puncture-proof container before disposal in the garbage and 13% of final compared
with 11% of baseline participants reported returning used equipment to a NEP (p=0.01).

OHRDP FINAL REPORT Page 71
Table 34 Methods of Disposal of Used Drug and Injection Preparation
Equipment *** p≤0.001
** p≤0.01 *** p≤0.001
Baseline Final
N=1622 N=1643
N (%) N (%) p-value
Method n=1613 n=1639 ***
Throwing it loose in the
garbage 1059 (65.7) 1025 (62.5)
Putting it in a container (e.g., plastic bottle, can) and then throwing them in the garbage
377 (23.4) 403 (24.6)
Putting it in a biohazard container and then throwing in the garbage
94 (5.8) 82 (5.0)
Returning it to the NEP 253 (15.7) 298 (18.2)
Throwing it in the needle drop
boxes 49 (3.0) 46 (2.8)
Giving it to others to discard 65 (4.0) 62 (3.8)
Giving it to others to return to the NEP 62 (3.8) 48 (2.9)
Throwing it in the street/parks/alleys/sewers 59 (3.7) 55 (3.4)
Other 388 (24.1) 274 (16.7)
Method used the MOST n=1607 n=1630 **
Throwing it loose in the
garbage 881 (54.8) 882 (54.1)
Putting it in a container (e.g., plastic bottle, can) and then throwing them in the garbage
253 (15.7) 289 (17.7)
Putting it in a biohazard container and then throwing in the garbage
30 (1.9) 42 (2.6)
Returning it to the NEP 175 (10.9) 215 (13.2)
Throwing it in the needle drop
boxes 11 (0.7) 9 (0.6)
Giving it to others to discard 26 (1.6) 27 (1.7)
Giving it to others to return to
the NEP 19 (1.2) 17 (1.0)
Throwing it in the street/parks/alleys/sewers 17 (1.1) 13 (0.8)
Other 195 (12.1) 136 (8.3)

OHRDP FINAL REPORT Page 72
3.7.3 Disposal of used crack-smoking equipment
Again, in contrast to the high prevalence of safer disposal of used needles, used crack-
smoking equipment was less safely disposed.
As shown in Table 35, in the six months prior to their interview, very few participants at
either the baseline or final evaluation time points had returned their used crack-smoking
equipment to the NEP; although an increase was observed in the proportion of final
participants (6%) compared with baseline participants (3%) who reported this safer
method of disposal. Putting used crack smoking materials in a puncture-proof container
before placing them in the garbage, another method of safer disposal, was reported by a
greater proportion of final participants (17%) compared with baseline participants (15%). In
terms of less safe disposal, although the greatest proportions of both final and baseline
participants reported they disposed of their used crack-smoking equipment by throwing it
loose in the garbage, a modest decline was observed in the proportion of final participants
(62%) reporting this unsafe non-recommended method compared with baseline participants
(66%). Similarly, a modest decline was observed in the proportion of participants reporting
throwing their used crack-smoking equipment in the street, in a park, in an alley or down a
sewer; 8% of final participants compared with 9% of baseline participants (p<0.001).
The MOST common method of disposal of used drug-smoking equipment at both baseline
and final evaluation time points was to throw it loose in the garbage; although a non-
significant decrease was observed in the proportion of final participants (54%) compared
with baseline participants (56%) who reported this less safe method of disposal as the
most frequent method used. A modest increase was observed in the safer disposal method
of putting used crack smoking materials in a puncture-proof container before placing them
in the garbage, reported by a greater proportion of final participants (12%) compared with
baseline participants (10%) as the method they used the most to dispose of their used
crack-smoking equipment.

OHRDP FINAL REPORT Page 73
Table 35 Methods of Disposal of Used Equipment: Drug-smoking Equipment
Baseline Final
N=1622 N=1643
N (%) N (%) p-value
Method n=980 n=885 ***
Throwing it loose in the garbage 645 (65.8) 548 (61.9)
Putting it in a container (e.g., plastic bottle, can) and then throwing in the garbage
148 (15.1) 147 (16.6)
Putting it in a biohazard container and then throwing in the garbage
13 (1.3) 10 (1.1)
Returning it to the NEP 30 (3.1) 56 (6.3)
Throwing it in the needle drop boxes 11 (1.1) 13 (1.5)
Giving it to others to discard 79 (8.1) 37 (4.2)
Giving it to others to return to the NEP 10 (1.0) 10 (1.1)
Throwing it in the street/parks/alleys/sewers 89 (9.1) 74 (8.4)
Other 176 (18.0) 137 (15.5)
I keep my equipment 141 (14.4) 109 (12.3)
Method used the MOST n=979 n=881
Throwing it loose in the garbage 550 (56.2) 472 (53.6)
Putting it in a container (e.g., plastic bottle, can) and then throwing in the garbage
95 (9.7) 109 (12.4)
Putting it in a biohazard container and then throwing in the garbage
3 (.3) 5 (.6)
Returning it to the NEP 18 (1.8) 31 (3.5)
Throwing it in the needle drop boxes 5 (.5) 4 (.5)
Giving it to others to discard 19 (1.9) 19 (2.2)
Giving it to others to return to the NEP 6 (.6) 3 (.3)
Throwing it in the street/parks/alleys/sewers 42 (4.3) 38 (4.3)
Other 128 (13.1) 102 (11.6)
I keep my equipment 113 (11.5) 98 (11.1)
*** p≤0.001

OHRDP FINAL REPORT Page 74
3.8 HCV and HIV-Related Risk Behaviours and Practices
3.8.1 Multi-person use (sharing) of needles for injection
Engagement in the practice of passing on previously-used needles to others to use did not
differ between the two evaluation time points; a minority of participants in both the baseline
(14%) and final interviews (13%) reported passing on their own used needles in the six
months prior to their interview by giving, selling or lending them to other users. As shown in
Table 36, frequency of engagement in this practice was low; the majority of participants in
both the baseline (54%) and final interviews (56%) reporting “hardly ever” doing so. Of
concern however must be the continuing high proportion (18%) of final participants who
reported doing so every time or frequently; a similar proportion to that noted at baseline
(17%).
In comparison to the almost static level of engagement observed in passing on used needles
between the two evaluation points, a significant decline was observed in engagement in
injecting with previously-used needles in the six months prior to interview; 19% of baseline
participants compared with 16% of final participants reported this practice (p<0.05).
Frequency of engagement in this practice was again low; two-thirds of participants in both
the baseline (61%) and final interviews (64%) reporting “hardly ever” doing so. A non-
significant decline in the proportion of baseline participants (15%) compared with final
participants (12%) who reported doing so every time or frequently was observed.
In addition to the observed decline in participants injecting with needles known to have
been used by someone else, a significant decline in engagement was also observed in the
related practice of injection with a needle without knowing if it had been previously used by
someone else; 11% of final participants compared with 14% of baseline participants
reported this practice (p<0.01). Frequency of engagement in this practice was again low;
nearly three-quarters of participants in both the baseline (70%) and final interviews (73%)
reporting “hardly ever” doing so.

OHRDP FINAL REPORT Page 75
Table 36 HCV and HIV-Related Risk Behaviours and Practices:
Multi-person Use of Needles for Injection in Six Months Prior to
Interview
Baseline Final
N=1622 N=1643
N (%) N (%) p-value
Gave, lent or sold needles previously used by self
n=1620 n=1643
Yes 219 (13.5) 217 (13.2)
No 1401 (86.5) 1426 (86.8)
Frequency of giving, selling or lending needles previously used by self
n=219 n=217
Every time 13 (5.9) 10 (4.6)
Frequently 25 (11.4) 28 (12.9)
Sometimes 62 (28.3) 58 (26.7)
Hardly ever 119 (54.3) 121 (55.8)
n=1618 n=1642 Used a needle that had previously been used by someone else
Yes 308 (19.0) 261 (15.9) *
No 1310 (81.0) 1381 (84.1)
Frequency of using a needle that had previously been used by someone else
n=308 n=261
Every time 15 (4.9) 10 (3.8)
Frequently 30 (9.7) 21 (8.0)
Sometimes 74 (24.0) 63 (24.1)
Hardly ever 189 (61.4) 167 (64.0)
Injected with needles without knowing if they had been previously used by someone else
n=1606 n=1634
Yes 225 (14.0) 172 (10.5) **
No 1381 (86.0) 1462 (89.5)
Frequency of injecting with needles without knowing if they had been previously used by someone else
n=225 n=172
Every time 2 (0.9) 2 (1.2)
Frequently 13 (5.8) 9 (5.2)
Sometimes 52 (23.1) 35 (20.3)
Hardly ever 158 (70.2) 126 (73.3)
* p≤0.05 ** p≤0.01

OHRDP FINAL REPORT Page 76
In terms of reasons for ever injecting with a needle known to have been used by someone
else, resource-associated reasons continued to predominate over individual reasons.
However, a significant decline was observed in the proportion of final participants (48%)
compared with baseline participants (54%) who explained it was because needles were hard
to get, in the proportion of final participants (10%) compared with baseline participants
(17%) who explained that their behaviour was due to the fact that they did not know where
to go to get sterile needles and in the proportion of final participants (2%) compared with
baseline participants (5%) who explained that their behaviour was due to the fact that the
NEP would not give them as many needles as they needed. (Data not shown.)
Overall, individual reasons were less frequently reported; although declines were observed
in these behaviours. For example, always sharing with other people was reported by 2% of
final participants and by 5% of baseline participants; always sharing with their sexual
partner by 22% of final and by 23% of baseline participants, 27% of final participants
compared with 35% of baseline participants explained it was because they were too high,
and 24% of final participants compared with 27% of baseline participants explained it was
the person looked or told them that they were “clean.” (Data not shown.)

OHRDP FINAL REPORT Page 77
3.8.2 Multi-person use (sharing) of drug preparation and injection preparation equipment
Water
A significant decline in engagement in the practice of using water in the six months prior to
interview that had been previously used by someone else was observed between the two
evaluation time points. Eighteen per cent of final participants compared with 23% of
baseline participants reported this practice (p<0.01). In addition, a non-significant decline
was observed in frequency of engagement in this practice; 38% of final participants
compared with 42% of baseline participants reported sharing water “every time” or
“frequently”.
Table 37 HCV and HIV-Related Risk Behaviours and Practices:
Engagement in Sharing Water in Six months Prior to Interview
Baseline Final
N=1622 N=1643
N (%) N (%) p-value
Used WATER previously used by someone else n = 1613 n = 1630
Yes 363 (22.5) 298 (18.3) **
No 1250 (77.5) 1332 (81.7)
Frequency of using water previously used by someone else
n = 335 n = 291
Every time 68 (19.2) 49 (16.8)
Frequently 79 (22.3) 63 (21.6)
Sometimes 104 (29.3) 99 (34.0)
Hardly ever 104 (29.3) 80 (27.5)
** p≤0.01

OHRDP FINAL REPORT Page 78
Filters
Engagement, in the six months prior to interview, in the practice of using previously-used
filters did not significantly differ between the two evaluation time points; 15% of baseline
participants and 14% of final participants reported this practice. However, a non-significant
decline was observed in the proportion of final participants (44%) compared to baseline
participants (47%) reporting sharing filters “every time” or “frequently”.
Table 38 HCV and HIV-Related Risk Behaviours and Practices:
Engagement in Sharing Filters in Six Months Prior to Interview
Baseline Final
N=1622 N=1643
N (%) N (%) p-value
Used FILTERS previously used by someone else n = 1612 n = 1633
Yes 244 (15.1) 225 (13.8)
No 1368 (84.9) 1408 (86.2)
Frequency of using filters previously used by someone else
n = 237 n = 221
Every time 48 (20.3) 43 (19.5)
Frequently 63 (26.6) 53 (24.0)
Sometimes 65 (27.4) 64 (29.0)
Hardly ever 61 (25.7) 61 (27.6)

OHRDP FINAL REPORT Page 79
Cookers
Although still at a high level of engagement, a significant decline in the six months prior to
interview in engagement in the practice of using cookers previously used by someone else
was observed. Twenty-eight percent of final participants compared with 32% of baseline
participants reported this practice (p<0.01). A significant decline was also observed in the
frequency of engagement in this practice; a smaller proportion of final participants (37%)
compared to baseline participants (44%) reported sharing cookers “every time” or
“frequently” (p=0.5).
Table 39 HCV and HIV-Related Risk Behaviours and Practices:
Engagement in Sharing Cookers in Six Months Prior to Interview
Baseline Final
N=1622 N=1643
N (%) N (%) p-value
Used COOKERS previously used by someone else
n = 1613 n = 1629
Yes 518 (32.1) 452 (27.7) **
No 1095 (67.9) 1177 (72.3)
Frequency of using cookers/spoons previously used by someone else
n = 506 n = 444
Every time 99 (19.6) 71 (16.0) *
Frequently 122 (24.1) 94 (21.2)
Sometimes 128 (25.3) 147 (33.1)
Hardly ever 157 (31.0) 132 (29.7)
* p≤0.05 ** p≤0.01

OHRDP FINAL REPORT Page 80
Tourniquets
A significant decline in absolute engagement in the practice of using tourniquets in the six
months prior to interview previously used by someone else was observed. Nineteen percent
of final participants compared with 23% of baseline participants reported this practice
(p<0.01). However, a non-significant increase in the frequency of engagement in this
practice was observed; 45% of final participants compared to 43% of baseline participants
reported sharing tourniquets “every time” or “frequently”.
Table 40 HCV and HIV-Related Risk Behaviours and Practices:
Engagement in Sharing Tourniquets in the Six Months Prior to
Interview
Baseline Final
N=1622 N=1643
N (%) N (%) p-value
Used TOURNIQUETS previously used by someone else
n = 1616 n = 1636
Yes 375 (23.2) 309 (18.9) **
No 1241 (76.8) 1327 (81.1)
Frequency of using tourniquets previously used by someone else
n = 362 n = 294
Every time 63 (17.4) 60 (20.4)
Frequently 92 (25.4) 73 (24.8)
Sometimes 98 (27.1) 83 (28.2)
Hardly ever 109 (30.1) 78 (26.5)
** p≤0.01

OHRDP FINAL REPORT Page 81
Acidifiers
Engagement in the practice of breaking down drugs with an acidifier previously used by
someone else was reported by a significantly smaller proportion of final participants (8%)
than baseline participants (12%) (p=0.001). However, as observed in the practice of
sharing tourniquets, a non-significant increase in the frequency of engagement in sharing
acidifiers was observed; 42% of final participants compared to 40% of baseline participants
reported sharing tourniquets “every time” or “frequently”.
Table 41 HCV and HIV-Related Risk Behaviours and Practices:
Engagement in Sharing Acidifiers in Six Months Prior to Interview
Baseline Final
N=1622 N=1643
N (%) N (%) p-value
Used ACIDIFIERS previously used by someone
else n = 1612 n = 1616
Yes 186 (11.5) 128 (7.9) ***
No 1426 (88.5) 1488 (92.1)
Frequency of using acidifiers previously used by someone else
n = 176 n = 123
Every time 31 (17.6) 23 (18.7)
Frequently 39 (22.2) 29 (23.6)
Sometimes 56 (31.8) 44 (35.8)
Hardly ever 50 (28.4) 27 (22.0)
*** p≤0.001

OHRDP FINAL REPORT Page 82
Alcohol swabs
Although engagement in sharing alcohol swabs was low at both evaluation time points, a
significant decline in the proportions of final participants reporting this practice compared
with baseline participants was observed; 3% and 5% respectively (p<0.01). Frequency of
engagement in sharing alcohol swabs remained high however, with no significant difference
between the proportion of final participants (45%) and the proportion of baseline
participants (40%) who reported sharing alcohol swabs “every time” or “frequently”.
Table 42 HCV and HIV-Related Risk Behaviours and Practices:
Engagement in Sharing Alcohol Swabs in Six Months Prior to
Interview
Baseline Final
N=1622 N=1643
N (%) N (%) p-value
Used ALCOHOL SWABS previously used by someone else
n = 1610 n = 1631
Yes 76 (4.7) 43 (2.6) **
No 1534 (95.3) 1588 (97.4)
Frequency of using alcohol swabs previously used by someone else
n = 70 n = 42
Every time 13 (18.6) 5 (11.9)
Frequently 15 (21.4) 14 (33.3)
Sometimes 23 (32.9) 10 (23.8)
Hardly ever 19 (27.1) 13 (31.0)
** p≤0.01

OHRDP FINAL REPORT Page 83
3.8.3 Multi-person use (sharing) of crack-smoking equipment
In comparison to the rates of engagement in sharing drug preparation and drug injection
equipment, participants reported higher rates of passing on and using previously-used crack
smoking equipment at both baseline and final evaluation points. No significant differences
were observed among the proportions of final and baseline participants who reported
engagement in passing on or smoking with previously used equipment in the six months
prior to their interview and no significant differences were observed in the frequency with
which participants engaged in these practices.
As shown in Table 43, in the six months prior to their interview, over three-quarters of both
baseline participants (78%) and final participants (78%) who injected drugs and who also
smoked crack reported they had passed on to other smokers their own crack smoking
equipment which they had previously used. Although a modest decline in the proportion of
participants reporting doing so “every time” or “frequently” was observed between the
baseline (56%) and final time points (54%), this difference was not statistically significant.
Similarly, the vast majority of both baseline (80%) and final participants (78%) who
injected drugs and who also smoked crack reported smoking crack with equipment
previously used by someone else; this modest decline was not significant. Among those
participants who reported smoking with previously-used equipment, a modest increase was
observed between the proportion of final participants (49%) compared with the proportion
of baseline participants (48%) who reported doing so “every time” or “frequently”.

OHRDP FINAL REPORT Page 84
Table 43 HIV and HCV-Related Risk Behaviours and Practices:
Multi-person Use of Crack-smoking Equipment in Six Months Prior to
Interview
Baseline Final
N=1051 N=982
N (%) N (%) p-value
Lent drug smoking equipment previously used by self
n=1039 n=967
Yes 808 (77.8) 756 (78.2)
No 231 (22.2) 211 (21.8)
Frequency of lending drug smoking equipment previously used by self
n=808 n=756
Every time 191 (23.6) 186 (24.6)
Frequently 261 (32.3) 224 (29.6)
Sometimes 197 (24.4) 188 (24.9)
Hardly ever 159 (19.7) 158 (20.9)
Used drug smoking equipment previously used by someone else in six months prior to interview
n=1039 n=968
Yes 834 (80.3) 752 (77.7)
No 205 (19.7) 216 (22.3)
Frequency of using drug smoking equipment previously used by someone else
n=834 N=752
Every time 164 (19.7) 158 (21.0)
Frequently 234 (28.1) 207 (27.5)
Sometimes 233 (27.9) 202 (26.9)
Hardly ever 203 (24.3) 185 (24.6)

OHRDP FINAL REPORT Page 85
3.9 HIV AND HCV INFECTION
3.9.1 HIV Testing
As shown in Table 44, a significant increase in the proportions of participants undergoing a
blood test to test for the presence of HIV was observed between baseline participants
(84%) and final participants (86%)(p<0.05). Although a slightly higher proportion of final
participants (59%) compared with baseline participants (58%) had tested within a year of
their interview, this difference was not statistically different.
HIV testing, with the opportunity to learn of and adopt HIV-preventive behaviours and to
learn about treatment, is maximally effective when the result of the HIV blood test is
known. Virtually all of the IDUs participating in the baseline interviews (99%) and final
interviews (98%) who had undergone testing had returned to collect the results of their
most recent HIV test when they were available.
A significant change in the pattern of test locations was observed. A smaller proportion of
final (24%) compared with baseline participants (27%) reported that they had undertaken
their most recent HIV test with a family physician, and a smaller proportion of final (14%)
compared with baseline participants (16%) reported that they had undergone their most
recent HIV test in a hospital. Conversely, a greater proportion of final (17%) compared with
baseline participants (14%) reported that they had undergone their most recent HIV test
while in jail and a greater proportion of final (13%) compared with baseline participants
(10%) reported that they had undertaken their most recent HIV test at a drug treatment
program. Equal proportions of both final (13%) and baseline participants (13%) reported
that they had undertaken their most recent HIV test at a community health centre. A NEP
was seldom accessed for HIV testing by either final (4%) or baseline participants (5%);
although slightly more final (7%) than baseline (6%) participants reported undergoing their
most recent HIV test at a Health Unit (p<0.001).

OHRDP FINAL REPORT Page 86
Table 44 HIV and HCV Infection: Testing for HIV
Baseline Final
N=1622 N=1643 N (%) N (%) p-value
EVER tested for HIV
n=1618 n=1642
Yes 1357 (83.9) 1419 (86.4) *
No 234 (14.5) 208 (12.7)
Don't know 27 (1.7) 15 (0.9)
Date last tested for HIV n=1313 n=1373
<1 year ago 767 (58.4) 814 (59.3)
>1 year - >2 years 231 (17.6) 248 (18.1)
>2 years ago 315 (24.0) 311 (22.7)
Location where last HIV test undertaken n=1350 n=1413 ***
Canadian Blood Services Donation 6 (0.4) 0 (0.0)
Community Health Centre 170 (12.6) 183 (13.0)
Family Physician 364 (27.0) 344 (24.3)
Hospital 212 (15.7) 193 (13.7)
Jail 182 (13.5) 237 (16.8)
Health Unit 74 (5.5) 101 (7.1)
Needle Exchange Program (NEP) 73 (5.4) 62 (4.4)
Prenatal Testing 0 (0.0) 3 (0.2)
Drug Treatment Program 138 (10.2) 178 (12.6)
Immigration 0 (0.0) 0 (0.0)
Anonymous Testing Program 4 (0.3) 6 (0.4)
Methadone Clinic 68 (5.0) 53 (3.8)
Outreach Worker 5 (0.4) 3 (0.2)
Clinic (Walk-In, Drop-In) 21 (1.6) 18 (1.3)
AIDS Service Organization (ASO) 0 (0.0) 8 (0.6)
HIV/HCV Specialist/Hepatologist 5 (0.4) 5 (0.4)
STI Clinic 0 (0.0) 2 (0.1)
Other 28 (2.1) 17 (1.2)
Self-report of most recent HIV test result n=1353 n=1415
HIV positive 82 (6.1) 58 (4.1)
HIV negative 1217 (89.9) 1284 (90.7)
Indeterminate 2 (0.1) 3 (0.2)
Waiting for results 33 (2.4) 47 (3.3)
Did not go back to get results 19 (1.4) 23 (1.6)
*p≤0.05 *** p≤0.001

OHRDP FINAL REPORT Page 87
3.9.2 HIV Status
A non-significant decline in the self-reported HIV prevalence rate among final compared
with baseline participants was observed.
Among the 1,299 IDUs participating in the baseline interviews who had undergone testing
for HIV and had collected conclusive results, 6% reported receiving a positive result from
their most recent HIV blood test. Based on the self-reported test results, the HIV prevalence
rate with a 95% confidence interval for the cross sectional sample of IDUs participating in
the provincial evaluation baseline interviews and who had undergone HIV testing and
received conclusive results was 6.3% (95% CI: 5.0, 7.6).
Among the 1,342 IDUs participating in the final interviews who had undergone testing for
HIV and had collected conclusive results, 4% reported receiving a positive result from their
most recent HIV blood test. Based on the self-reported test results, the rate of HIV
prevalence with a 95% confidence interval for the cross sectional sample of IDUs
participating in the final provincial evaluation interviews was 4.3% (95% CI: 3.2, 5.4).
The self-reported provincial HIV prevalence rate of 4% among participants in the final
interviews masks the wide range of final self-reported HIV prevalence rates reported at the
different sites.
As shown in Table 45, among 64 IDUs in Sudbury who had collected conclusive results, 20%
reported a positive result from their most recent HIV blood test as did 15% of 62 IDUs in
Thunder Bay, 12% of 60 IDUs in Ottawa, 9% of 23 IDUs in Eastern Ontario, and 7% of 14
IDUs in Peel. At the other end of the scale, no participant in the final interviews from Health
Units in Leeds, Grenville and Lanark, Oxford County, Simcoe Muskoka, Hastings/ Prince
Edward, Perth, Lambton, Northwestern and Porcupine reported a positive result from their
most recent HIV blood test.
Despite the high HIV prevalence rate among participants in the final interviews in Thunder
Bay, a significant decrease in the proportion of participants reporting a positive HIV test
results was observed; 34% of participants in the baseline interviews reported a positive HIV
test result compared with 15% of participants in the final interviews (p<0.01).

OHRDP FINAL REPORT Page 88
Table 45 HIV and HCV Infection: Self-report of HIV Prevalence by Health Region
Baseline Final
Site (N1) % (N1) % p-value
Algoma (45) 11.1 (54) 3.7
Chatham-Kent (61) 8.2 (57) 1.8
Durham (58) 0.0 (64) 3.1
Eastern Ontario (33) 9.1 (23) 8.7
Hamilton (60) 6.7 (62) 4.8
Hastings, Prince Edward (58) 0.0 (56) 0.0
Kingston (64) 3.1 (67) 1.5
Lambton (50) 0.0 (54) 0.0
Leeds, Grenville & Lanark (26) 7.7 (14) 0.0
Middlesex-London (67) 3.0 (62) 3.2
Niagara Region (60) 8.3 (51) 3.9
Northwestern (32) 0.0 (51) 0.0
Ottawa (52) 21.2 (60) 11.7
Oxford County (35) 0.0 (42) 0.0
Peel (17) 5.9 (14) 7.1
Perth (35) 0.0 (46) 0.0
Peterborough (55) 3.6 (62) 4.8
Porcupine (20) 5.0 (37) 0.0
Simcoe Muskoka (57) 0.0 (58) 0.0
Sudbury (63) 12.7 (64) 20.3
Thunder Bay (53) 34.0 (62) 14.5 **
Toronto (61) 6.6 (64) 6.3
Waterloo (59) 0.0 (63) 1.6
Wellington-Guelph (60) 6.7 (56) 3.6
Windsor-Essex County (54) 5.6 (55) 3.6
York (64) 3.1 (44) 2.3 1 N includes only those IDUs who had undergone testing for HIV and who had collected conclusive test results.
** p≤0.01

OHRDP FINAL REPORT Page 89
3.9.3 Hepatitis C (HCV) Testing
Uptake of testing to detect the presence of HCV antibodies was somewhat lower among
participants in both the baseline and the final interviews compared with that reported for
HIV. However, as shown in Table 46, an increase in the proportions of participants
undergoing a blood test to determine the presence of HCV antibodies was observed between
final participants (84%) and baseline participants (82%) which was marginally significant
(p=0.06). Although a slightly higher proportion of final participants (57%) compared with
baseline participants (55%) had tested within a year of their interview, this difference again,
was not statistically significant. Virtually all baseline (99%) and final interview participants
(99%) who had been tested had returned to collect the result of their most recent HCV test
when available.
A change in the pattern of test locations, in the same direction as HIV testing locations, was
observed; and, as was the case of HIV testing, this difference in testing locations between
baseline and final participants was statistically significant (p=0.01). A smaller proportion of
final (25%) compared with baseline participants (28%) reported that they had undertaken
their most recent HCV test with a family physician, and a smaller proportion of final (14%)
compared with baseline participants (15%) reported that they had undergone their most
recent HCV test in a hospital. Conversely, a greater proportion of final (16%) compared with
baseline participants (14%) reported that they had undergone their most recent HCV test
while in jail and a greater proportion of final (14%) compared with baseline participants
(12%) reported that they had undertaken their most recent HIV test at a drug treatment
program. As with HIV testing, a NEP was seldom accessed for HCV testing by either final
(4%) or baseline participants (5%) and similarly, a slight increase was observed in the
proportion of final participants (7%) compared with baseline participants (5%) who had
undergone their most recent HCV test at a Health Unit.

OHRDP FINAL REPORT Page 90
Table 46 HIV and HCV Infection: Testing for HCV
Baseline Final
N=1622 N=1643 N (%) N (%) p-value
EVER tested for HCV n=1574 n=1607
Yes 1290 (82.0) 1357 (84.4)
No 284 (18.0) 250 (15.6)
Date last tested for HCV n=1242 n=1287
<1 year ago 682 (54.9) 731 (56.8)
>1 year - >2 years 211 (17.0) 234 (18.2)
>2 years ago 349 (28.1) 322 (25.0)
Location where last HCV test undertaken n=1281 n=1339 **
Canadian Blood Services Donation 6 (0.5) 0 (0.0)
Community Health
Centre 155 (12.1) 168 (12.5)
Family Physician 360 (28.1) 337 (25.2)
Hospital 195 (15.2) 184 (13.7)
Jail 177 (13.8) 218 (16.3)
Health Unit 65 (5.1) 87 (6.5)
Needle Exchange Program (NEP) 60 (4.7) 55 (4.1)
Prenatal Testing 0 (0.0) 2 (0.1)
Drug Treatment Program 151 (11.8) 188 (14.0)
Immigration 0 (0.0) 0 (0.0)
Anonymous Testing Program 2 (0.2) 2 (0.1)
Methadone Clinic 71 (5.5) 54 (4.0)
Outreach Worker 3 (0.2) 3 (0.2)
Clinic (Walk-In, Drop-In) 11 (0.9) 18 (1.3)
AIDS Service Organisation 0 (0.0) 5 (0.4)
HIV/HCV Specialist 3 (0.2) 1 (0.1)
Hepatologist 0 (0.0) 0 (0.0)
STI Clinic 0 (0.0) 2 (0.1)
Other 22 (1.7) 15 (1.1)
Self-report of most recent HCV test result n=1281 n=1346 *
HCV positive 650 (50.7) 637 (47.3)
HCV negative 598 (46.7) 644 (47.8)
Indeterminate 8 (0.6) 15 (1.1)
Waiting for results 15 (1.2) 32 (2.4)
Did not go back to get results 10 (0.8) 18 (1.3)
* p≤0.05 ** p≤0.01

OHRDP FINAL REPORT Page 91
3.9.4 HCV Status
As with HIV prevalence, a decrease in the self-reported HCV prevalence rate among final
compared with baseline participants was observed. However, in the case of HCV prevalence,
this reduction in self-reported HCV prevalence between the baseline participants and the
final interview participants was significant (p<0.05).
Among the 1,248 baseline participants who had undergone testing for HCV and had
collected conclusive results, 52% reported receiving a positive result from their most recent
HCV blood test. Based on the self-reported test results, the rate of HCV prevalence with a
95% confidence interval for the cross sectional sample of IDUs participating in the provincial
evaluation baseline interviews was 52.1% (95% CI: 49.3, 54.9).
Among the 1,281 IDUs in the final interviews who had undergone testing for HCV and had
collected conclusive results, 50% reported receiving a positive result from their most recent
HCV blood test. Based on the self-reported test results, the rate of HCV prevalence with a
95% confidence interval for the cross sectional sample of IDUs participating in the final
provincial evaluation interviews was 49.7% (95% CI: 47.0, 52.4).
The self-reported provincial HCV prevalence rate of 50% masks the wide range of HCV
prevalence rates reported at the different sites. As shown in Table 47, among 13 IDUs in
Peel, 85% reported a positive result from their most recent HCV blood test as did 73% of 55
IDUs in Niagara Region, 71% of 66 IDUs in Kingston, 68% of 63 IDUs in Sudbury, 70% of
59 IDUs in Hamilton and 64% of 64 IDUs in Toronto. Lower self-reported HCV prevalence
rates were observed among participants from Northwestern, Perth and Oxford County;
among 45 IDUs in Northwestern, 11% reported a positive result from their most recent HCV
blood test as did 25% of 40 IDUs in Perth and 25% of 40 IDUs in Oxford County.
A significant decrease in the proportion of participants from Waterloo reporting a positive
HCV test result was observed; 51% of participants in the baseline interviews reported a
positive HCV test result compared with 29% of participants in the final interviews (p<0.05).

OHRDP FINAL REPORT Page 92
Table 47 HIV and HCV Infection: Self-report of HCV Prevalence by Health Region
Baseline Final
Site (N1) % (N1) % p-value
Algoma (47) 61.7 (49) 44.9
Chatham-Kent (58) 63.8 (57) 56.1
Durham (57) 45.6 (64) 46.9
Eastern Ontario (29) 37.9 (23) 34.8
Hamilton (59) 62.7 (59) 69.5
Hastings, Prince Edward (53) 43.4 (54) 46.3
Kingston (61) 62.3 (66) 71.2
Lambton (50) 20.0 (48) 31.3
Leeds, Grenville & Lanark (26) 53.8 (11) 63.6
Middlesex-London (65) 66.2 (62) 56.5
Niagara Region (58) 65.5 (55) 72.7
Northwestern (29) 17.2 (45) 11.1
Ottawa (58) 65.5 (60) 55.0
Oxford County (30) 13.3 (40) 25.0
Peel (14) 50.0 (13) 84.6
Perth (26) 26.9 (40) 25.0
Peterborough (56) 66.1 (63) 57.1
Porcupine (16) 50.0 (31) 25.8
Simcoe Muskoka (58) 41.4 (54) 35.2
Sudbury (65) 69.2 (63) 68.3
Thunder Bay (48) 58.3 (57) 50.9
Toronto (65) 60.0 (64) 64.1
Waterloo (55) 50.9 (51) 29.4 *
Wellington-Guelph (55) 40.0 (58) 50.0
Windsor-Essex County (51) 49.0 (51) 56.9
York (59) 45.8 (43) 39.5 1 N includes only those IDUs who had undergone testing for HCV and who had collected conclusive test results.
* p≤0.05

OHRDP FINAL REPORT Page 93
4.0 DISCUSSION
Implementation of the OHRDP
Data from the on-line questionnaire completed by managers and staff during May 2007 for
the purposes of Phase One of the Process Evaluation established the status of distribution of
each item at the time of the baseline interviews in each public health region.
While the previous analyses assume full implementation of the OHRDP at all sites,
examination of these early process data permitted an analysis based on full compared with
partial implementation of the OHRDP in terms of items distributed.
The process data revealed that overall approximately one-third of public health units (32%)
were not distributing all supplies; 31% were not distributing acidifiers, 24% were not
distributing cookers, 17% were not distributing filters and 10% were not distributing
tourniquets. The baseline participants were divided into two groups; the ACC Group whose
local Public Health Unit (PHU) had fully implemented the OHRDP for more than two months
at the time of the outcome evaluation baseline interviews and the NOACC Group whose local
PHU had not fully implemented the OHRDP or had implemented the OHRDP for less than
two months at the time of the baseline outcome interviews.
Significant effects of less than full implementation of the program were observed on the
HIV- and HCV-related practice of the multi-person use of drug preparation and injection
preparation equipment. A significantly greater proportion of participants in the NOACC
group (37%) compared with the proportion of participants in the ACC Group (26%) reported
sharing cookers (p<0.001); a significantly greater proportion of participants in the NOACC
group (27%) compared with the proportion of participants in the ACC Group (21%) reported
sharing cookers (p<0.05); a significantly greater proportion of participants in the NOACC
group (20%) compared with the proportion of participants in the ACC Group (13%) reported
sharing filters (p<0.001); and a significantly greater proportion of participants in the NOACC
group (27%) compared with the proportion of participants in the ACC Group (21%) reported
sharing tourniquets (p<0.01).
The majority of the sites (70%) not distributing the full range of harm reduction materials
available through the OHRDP cited either the lack of approval from their regional Medical
Officer of Health or lack of approval from their Regional Board of Health.

OHRDP FINAL REPORT Page 94
5.0 CONCLUSIONS AND RECOMMENDATIONS
5.1 OHRDP Successful in reducing HIV- and HCV-related Risk Behaviours
The objective of this outcome evaluation was to describe the impact of the
distribution of additional harm reduction supplies such as sterile water, sterile
alcohol swabs, new filters, new and sterile cookers, sterile acidifiers and new
tourniquets on the HIV and HCV-related risk practice of sharing drug preparation
and injection preparation equipment. As previously discussed, engagement in the
practice of using drug preparation and injection preparation equipment previously
used or currently being used by some else poses significant risk of HIV and HCV
transmission. The observed significant declines in engagement in these practices
and behaviours among final participants - interviewed several months post-
implementation of the OHRDP, compared with the proportions of baseline
participants - interviewed concurrent with the implementation of the OHRDP, are
arguably associated with the implementation of the OHRDP. For example,
significantly smaller proportions of participants completing final interviews
compared with the proportion of participants completing baseline interviews
reported lower levels of engagement in sharing water to dissolve drugs, in sharing
filters, cookers, tourniquets, acidifiers and alcohol swabs – all materials distributed
free of charge and on request through the OHRDP. In addition, among those
participants continuing to share water, cookers and filters declines were observed in
the frequency of engagement.
The use of readily available materials such as tap or puddle water or water from a
urinal to dissolve drugs and to rinse needles, the use of cigarette filters, cotton
buds or tampons to filter drugs, the use of water, alcohol, ether, iodine and saliva
to clean skin prior to injection, the use of clothing and body parts to tie off a vein
prior to injection and the use of lemon juice, vinegar or pickle juice to break down
drugs has been demonstrated to be associated with significant health problems for
the user (26). The significant declines observed in the exclusive use of these non-
recommended materials and the corresponding significant increase in the exclusive
use of only recommended materials reported by a greater proportion of participants
in the final interviews compared with the proportion of participants in the baseline

OHRDP FINAL REPORT Page 95
interviews can also similarly be argued to be linked to the impact of the
implementation of the OHRDP.
In addition, a more indirect benefit of the implementation of the OHRDP was the
increase in use of needle exchange programs (NEPs). Significantly greater
proportions of final compared with baseline participants reported the NEP as their
primary source for the collection of sterile water, new filters, new and sterile
cookers, new tourniquets, new acidifiers and sterile alcohol swabs. This
development suggests potential greater exposure to the wide range of other harm
reduction and health improving resources and materials available at NEPs including
education on safer injecting and sexual practices.
5.2 Areas of Concern
5.2.1 Demonstrated capacity of regional Medical Officers of Health to resist
full implementation of the OHRDP
While the above two observations are compelling testaments to the success of the
program and demonstrate the critical importance of its sustained continuance, two
areas of concern must be addressed.
The first is the demonstrated capacity of individual Medical Officers of Health to
prevent the full implementation of the program in their region. As previously
discussed, the impact of the non-distribution of harm reduction materials by one-
third of Public Health Units appears to have had significant impacts on the ability of
people who inject drugs to engage in the recommended practice of single use of
these materials and to refrain from multi-person use of these materials.

OHRDP FINAL REPORT Page 96
5.2.3 Program development to include the distribution of safer inhalation
materials for people who smoke drugs
Levels of engagement in the practices of smoking crack with equipment already
used by someone else and passing on to others smoking equipment that had
already been used were unacceptably high. These two practices were reported by
over three-quarters of participants in both the baseline and final interviews. As
approximately two-thirds of the injection drug users participating in both the
baseline and final interviews reported smoking crack as well as injecting drugs in
the six months prior to their interviews, the scope of this problem is not
insubstantial. Emerging epidemiologic and virologic evidence documents the
biological plausibility of HIV and, most particularly, HCV transmission through the
shared use of devices to smoke crack. The OHRDP is well positioned to quickly and
effectively assume a key and pivotal role in ensuring the reduction of harm through
this method of ingestion of drugs, a method which demands the same level of
resources and attention as drug use by injection.

OHRDP FINAL REPORT Page 97
6.0 REFERENCES
1. Houston, S. (1998). HIV risk behaviours among Canadians: An inventory and synthesis.
Division of HIV/AIDS Epidemiology, Ottawa, Health Canada in Riley, D., Teixeira, P., Hausser, D. Dialogue on HIV/AIDS: Policy dilemmas facing governments. HIV/AIDS policy issues related to large-scale targeted interventions for injection drug users.
Montebello, Quebec, November 8-10, 1999.
2. Laurie, M.L. & Green, K.L. Health risks and opportunities for harm reduction among injection – drug - using clients of Saskatoon’s needle exchange program. Canadian Journal of Public Health. 2000; 91 (5), 350 – 353.
3. Leonard L., Navarro C., Birkett N. A gendered analysis of sexual and injection practices associated with high levels of HIV prevalence among injection drug users in Ottawa-Carleton 1996-2000: Issues for HIV prevention and policy development. Community Health Research Unit, Department of Epidemiology and Community Medicine,
University of Ottawa. 2001.
4. Millson P., Myers T., Rankin J., MCLaughlin B., Major C., Mindell W., Coates R., Rigby., Strathdee S. Prevalence of human immunodeficiency virus and associated risk
behaviour in injection drug users in Toronto. Canadian Journal of Public Health. 1995; 86 (3), 176-180.
5. Bennett GA, Velleman RD, Barter G, et al. Gender differences in sharing injecting equipment by drug users in England. AIDS Care. 2000; 12(1):77-87.
6. Gossop M, Griffiths P, Powis B, et al. Continuing drug risk behaviour: Shared use of injecting paraphernalia among London heroin injectors. AIDS Care. 1997; 9(6):651-660.
7. Vlahov D, Junge B, Brookmeyer R, et al. Reductions in high-risk drug use behaviours among participants in the Baltimore needle exchange program. Journal of Acquired Immune Deficiency Syndrome. 1997; 16(5):400-406.
8. Power R, Hunter GM, Jones SG, et al. The sharing of injecting paraphernalia among illicit
drug users. AIDS. 1994; 8(10):1509-1511.
9. Wang J, Marcinko J, Meili D, et al. Looking beyond needle sharing: “Indirect” sharing and viral infections among injecting drug users in Zurich, Switzerland. Int Conf AIDS. 1998; 12:412 Abstract 23352.
10. Thorpe LE, Bailey SL, DeZheng H, et al. Injection-related risk behaviours in young urban and suburban injection drug users in Chicago (1997-1999). Journal of Acquired Immune Deficiency Syndrome. 2001; 27(1):71-78.
11. Green ST, Mohsen AH, McKendrick MW, et al. Potential for hepatitis C transmission among non-needle/syringe sharing. Sheffield drug injectors through the sharing of drug preparation paraphernalia. Communicable Disease Public Health. 2001; 4(1):38-41.
12. Huo D, Bailey SL, Garfein RS, et al. Changes in the sharing of drug injection equipment among street-recruited injection drug users in Chicago, Illinois, 1994-1996. Subst Use Misuse. 2005; 40(1):63-76.
13. Koester SK, Booth RE, Zhang E. The prevalence of additional injection-related HIV risk behaviours among injection drug users. J Acquir Immune Defic Syndr Hum Retrovirol. 1996; 12(2):202-207.

OHRDP FINAL REPORT Page 98
14. Archibald CP, Williamson NJ, Hay K, et al. Needle sharing behaviour among injecting drug users in Regina: An indicator of risk and a guide for prevention. Canadian
Journal of Infectious Diseases. 2001; 12 (Suppl B): 348P.
15. Hunter GM, Donoghoe MC, Stimson G, et al. Changes in the injecting risk behaviour of injecting drug users in London, 1990-1993. AIDS. 1995; 9(5):493-501.
16. Siushansian J, Houston S, Archibald CP, et al. Sharing injection drug equipment: Are
Canadian injection drug users friendly to a fault? CAHR. 1998.
17. Health Canada. I-Track: Enhanced surveillance of risk behaviours among injecting drug users in Canada, Pilot Survey Report. 2004.
18. Millson P, Myers T, Calzavara L, et al. Regional variation in HIV prevalence and risk
behaviours in Ontario injection drug users (IDU). Canadian Journal of Public Health. 2003; 94(6):431-435.
19. Thorpe LE, Quellet LJ, Hershow R, Bailey SL, Williams IT, Williamson J, Monterrosso ER.
(2002). Risk of hepatitis C virus infection among young adult injection drug users who share injection equipment. American Journal of Epidemiology, 2002; 155 (7), 645-653.
20. Crofts N, Caruana S, Bowden S, et al. Minimising harm from hepatitis C virus needs
better strategies. British Medical Journal. 2000; 321(7265):899.
21. Shah SM, Shapshak P, Rivers JE, et al. Detection of HIV-1 DNA in needle/syringes, paraphernalia, and washes from shooting galleries in Miami: a preliminary laboratory
report. J Acquired Immune Deficiency Syndrome and Human Retrovirology, 1996; 11, 301-306.
22. Ross JJ, Shamsuddin H. Sternoclavicular septic arthritis: review of 180 cases. Medicine. 2004; 83(3):139-148.
23. Gonzalez MH, Garst J, Nourbash P, et al. Abscesses of the upper extremity from drug abuse by injection. Journal of Hand Surgery. 1993; 18(5):868-870.
24. Vlahov D, Sullivan M, Astemborski J, et al. Bacterial infections and skin cleaning prior to injection among intravenous drug users. Public Health Rep. 1992; 107(5):595-598.
25. Murphy EL, DeVita D, Liu H, et al. Risk factors for skin and soft-tissue abscesses among injection drug users: A case-control study. Journal of Infectious Diseases. 2001; 33(1):35-40.
26. Strike C, Leonard L, Millson M, Anstice S, Berkeley N, Medd E. Ontario Needle Exchange Programs: Best Practice Recommendations. 2006; Toronto: Ontario Needle Exchange Coordinating Committee.
27. Crofts N, Aitken CK, Kaldor JM. The force of numbers: Why hepatitis C is spreading
among Australian injection drug users while HIV is not. Medical Journal of Australia. 1999; 170(5):220-221.
28. Taylor A, Fleming A, Rutherford J, et al. Examining the injecting practices of injecting
drug users in Scotland. Edinburgh: Effective Interventions Unit, Scottish Executive Drug Misuse Research Programme, University of Paisley. 2004.
29. Rourke C, Bates C, Reade RC. Poor hospital infection control practice in venipuncture and use of tourniquets. Journal of Hospital Infections. 2001; 49(1):59-61.
30. Golder M, Chan CLH, O'Shea S, et al. Potential risk of cross-infection during peripheral-venous access by contamination of tourniquets. The Lancet. 2000; 355(9197):44.

OHRDP FINAL REPORT Page 99
31. Preston A, Derricott J, Scott J. Providing citric acid sachets to drug users. Exchange Publications, Dorset, U.K. 2001.
32. Gallo J, Playfair J, Gregory Roberts J, et al. (1985) Fungal endophthalmitis in narcotic abusers. The Medical Journal of Australia. 1985; 142: 3868.
33. Garden J, Roberts K, Taylor A, et al. Evaluation of the provision of single use citric acid sachets to injecting drug users. Edinburgh: Effective Interventions Unit, Scottish
Executive Drug Misuse Research Programme, University of Paisley. 2003.
34. Needle RH, Coyle S, Cesari H, Trotter R, Clatts M, Koester S, Price L, McLellan E, Finlinson A, Bluthenthal RN, Pierce T, Johnson J, Jones TS, Williams M. HIV risk behaviours associated with the injection process: Multiperson use of drug injection
equipment and paraphernalia in injection drug user networks. Substance Use & Misuse. 1998; 33 (12), 2403-2423.
35. Leonard L., Navarro C., Birkett N, Remis R. The POINT Project. Department of
Epidemiology and Community Medicine, Faculty of Medicine, University of Ottawa. 2005; (In press).
36. Lucidarme D, Bruandet A, Ilef D, et al. Incidence and risk factors of HCV and HIV infections in a cohort of intravenous drug users in the north and east of France.
Epidemiologic Infection. 2004; 132(4):699-708.
37. Hagan H, Thiede H, Weiss NS, Hopkins SG, Duchin JS, Alexander ER. Sharing of drug preparation equipment as a risk factor for hepatitis C. Am J Public Health. 2001;
91(1):42-46.
38. Caflisch C, Wang J, Zbinden R. The role of syringe filters in harm reduction among injection drug users. American Journal of Public Health. 1999; 89(8):1252-1254.
39. McColl MD, Tait RC, Greer IA, et al. Injecting drug use is a risk factor for deep vein
thrombosis in women in Glasgow. British Journal of Haematology. 2001; 112(3):641-643.
40. Leonard L. I-Track/SurvIDU study. Department of Epidemiology and Community Medicine, Faculty of Medicine, University of Ottawa. 2006; (In press).
41. Haydon E & Fischer B. Crack use as a public health problem in Canada. Canadian Journal of Public Health 2005; 9 (3): 185-188.
42. Nyamathi AM, Dixon EL, Robbins W, Smith C, Wiley D, Leake B, Longshore D, Gelberg L.
Risk factors for hepatitis C virus infection among homeless adults. Journal of General Internal Medicine 2002; 17 (2): 134-143.
43. Porter J, Bonilla L, Drucker E, Methods of smoking crack as a potential risk factor for HIV infection: Crack smoker’s perceptions and behaviour. Contemporary Drug Problems
1997; 24 (2): 319-347.
44. Leonard L, Forrester L, Navarro C, Hansen J, Doucet C. The effectiveness of Needle Exchange Programmes in modifying HIV-related outcomes. Community Health
Research Unit, Department of Epidemiology and Community Medicine, University of Ottawa, CHRU Publication No. M99-5. May 1999.
45. Choudri Y. Personal Communication. Health Canada, February 2006.
46. Hassard TH. Understanding Biostatistics. Mosby Year Book, St. Louis. 1991; 178-179.

OHRDP FINAL REPORT 2009 Page 100
7.0 APPENDIX
Table A1 List of Site Administrators and Interviewers
Site Name1 Site Administrator(s) Interviewer(s)2
Algoma PHU Elizabeth Larocque Theresa Balch
Mary Russon
Chatham-Kent PHU Betty Schepens Thomas Maxwell
Debbie Mestermaker
County of Lambton PHU Rhonda Galler Beatrice Lennan
Durham PHU,
John Howard Society (Durham Region)
Beth Whalen Kertis John
Eastern Ontario HU Linda Cleroux Angie Jesmer
Lisa Martin
Hamilton PHU,
The AIDS Network
Suzanne Newmark
Joe Whelan
Ursula Brown
Michelle Vebert
Hastings & Prince Edward Counties HU Bill Sherlock
Debbie Laughton
Debbie Breau
Brent Taylor
Kingston Street Health Centre
Kingston PHU
Ron Shore Matt Silburn
Leeds, Grenville, Lanark District HU Muriel Campbell
Melanie Ramsey
Violet Capper
Kari Evoy
Gail Larocque
Middlesex-London HU,
AIDS Committee of London
Janine Luce
Brian Lester
Karen Burton
Natalie Hebert
Niagara Regional HU,
AIDS Niagara – Streetworks
Rhonda Thompson Colin Willoughby
Northwestern HU Arlene Lesenke David Schwartz
Eva Shields
Joan McGogy
Judy Roy
Kim Vares
Lori Green
Shelly McLarty

OHRDP FINAL REPORT 2009 Page 101
Site Name1 Site Administrator(s) Interviewer(s)2
Sue Wood
Twyla Berube
Moyra Koivukosky
Ottawa PHU, The Site NEP Paul Lavigne Sarah Brown
Leslie Fleming
Oxford County HU Mary Metcalfe
Lisa Gillespie
Ruth Ferris
Peterborough AIDS Resource Network,
Haliburton, Kawartha, Pine Ridge HU &
Peterborough City County HU
Charles Shames
Owen McEwan
Heather Koller
Christine Hignett
Peel Regional HU – Peel Works NEP Sherry Baidwan
Vanessa Secan
Danny Bilan
Clare Hay
Lisa Marie Middleton
Perth District HU Jane DeBlock Tara Johnson
Porcupine PHU – The Quill NEP Lynn Leggett
Carole Guillemette
Terry Boucher
Simcoe Muskoka District HU Donna Milne
Louise Thompson
Pauline Leroux
Sudbury Action Centre for Youth,
Sudbury District HU
Marlene Gorman Kelly Sinclair
Doris Schwar
Julie Gorman
Thunder Bay HU - Superior Points NEP,
AIDS Thunder Bay
Don Young
Michael Sobota
Lori Frazen
Gail Linklater
Stuart Boland
Chris Barbini
Toronto PHU - The Works NEP Shaun Hopkins Emily Cooper
Patrick Shaw
Waterloo PHU Heidy Choi-Keirstead Karen Verhoeve
Julie Porter
Rob Smith
Leesa Stephenson
Wellington-Dufferin-Guelph PH, Alison Burnett Kimberly Patton

OHRDP FINAL REPORT 2009 Page 102
Site Name1 Site Administrator(s) Interviewer(s)2
AIDS Committee of Guelph Kimberly Patton
Oscar Reimer
AIDS Committee of Windsor – New Points NEP,
Windsor-Essex HU
Sharron Aaron
Lori Baxter
Lauren St.Louis
York Region Health Services Department Ethel Achampong Sue Williamson
Mohamed Mjasiri
1 Several of the Site Administrators were also interviewers for their region.
2 PHU = Public Health Unit, HU = Health Unit, PH = Public Health.


![Elizabeth Sherman, PharmD, AAHIVPhivaidsinstitute.med.miami.edu/documents/...HIV-HCV...• SVR rates similar to HCV monoinfected [1,2] • In HCV/HIV coinfection, treat HCV as though](https://static.fdocuments.in/doc/165x107/5fbc30e57653e03e261e9924/elizabeth-sherman-pharmd-aa-a-svr-rates-similar-to-hcv-monoinfected-12.jpg)