Online Supplementary Information for Holbourn et al. · PDF fileOnline Supplementary...
23
1 Online Supplementary Information for Holbourn et al. Site locations and materials Our study is based on marine sediments recovered at ODP Site 1146 during Leg 184 in Spring 1999 and at ODP 1237 during Leg 202 in April 2002. Site 1146 (19˚ 27.40‘N, 116˚ 16.37‘E) is located at 2092 m water depth within a small rift basin on the mid-continental slope of the northern South China Sea 1 (Supplementary Fig. S1). Tectonic backtracking suggests that middle Miocene paleodepths were not significantly shallower than in the present day 1 . A free connection existed between the South China Sea and the western Pacific during the middle Miocene, as the modern Bashi Strait (sill depth ~2600 m) only formed between Luzon and Taiwan at ~6.5 Ma, as a result of the Luzon Arc collision 1 . Coring with the Extended Core Barrel (XCB) system at Site 1146 recovered a continuous Miocene sequence of carbonate-rich hemipelagic sediments, which grade from unlithified green nannofossil clay in the lower Miocene to light brownish gray foraminifers and nannofossil clay in the upper Miocene 1 . ODP Site 1237 (16°0.421'S, 76°22.685'W) is located at 3212 m water depth on a relatively flat bench on the easternmost flank of Nazca Ridge, about 140 km off the coast of Peru 2 (Supplementary Fig. S1). The tectonic backtrack path moves Site 1237 about 20˚ westward relative to South America over the last 42 myr. In the middle Miocene the site lay in the oligotrophic subtropical gyre, at slightly shallower water depths than in the present day 2 . Middle Miocene sediments recovered with the Advanced Piston Corer (APC) system at Site 1237 consist of unlithified, pale brown nannofossil ooze with an average of 95 wt% calcium carbonate 2 .
Transcript of Online Supplementary Information for Holbourn et al. · PDF fileOnline Supplementary...

1
Online Supplementary Information for Holbourn et al.
Site locations and materials
Our study is based on marine sediments recovered at ODP Site 1146 during Leg
184 in Spring 1999 and at ODP 1237 during Leg 202 in April 2002. Site 1146 (19˚
27.40‘N, 116˚ 16.37‘E) is located at 2092 m water depth within a small rift basin on the
mid-continental slope of the northern South China Sea1 (Supplementary Fig. S1).
Tectonic backtracking suggests that middle Miocene paleodepths were not significantly
shallower than in the present day1. A free connection existed between the South China
Sea and the western Pacific during the middle Miocene, as the modern Bashi Strait (sill
depth ~2600 m) only formed between Luzon and Taiwan at ~6.5 Ma, as a result of the
Luzon Arc collision1. Coring with the Extended Core Barrel (XCB) system at Site 1146
recovered a continuous Miocene sequence of carbonate-rich hemipelagic sediments,
which grade from unlithified green nannofossil clay in the lower Miocene to light
brownish gray foraminifers and nannofossil clay in the upper Miocene1. ODP Site 1237
(16°0.421'S, 76°22.685'W) is located at 3212 m water depth on a relatively flat bench
on the easternmost flank of Nazca Ridge, about 140 km off the coast of Peru2
(Supplementary Fig. S1). The tectonic backtrack path moves Site 1237 about 20˚
westward relative to South America over the last 42 myr. In the middle Miocene the site
lay in the oligotrophic subtropical gyre, at slightly shallower water depths than in the
present day2. Middle Miocene sediments recovered with the Advanced Piston Corer
(APC) system at Site 1237 consist of unlithified, pale brown nannofossil ooze with an
average of 95 wt% calcium carbonate2.

2
Sampling strategy
Foraminifers and nannofossil clays were sampled at ~ 10 cm intervals (~ 4 kyr
time resolution, 30cm3 sample size) in Hole 1146A (463.05 – 513.30 meters below
seafloor). One obvious coring gap between Cores 1146A-54X and -55X was bridged
with samples from Hole 1146C, based on the shipboard correlation and the match of our
isotope records. Nannofossil oozes were sampled at ~ 5 cm intervals (~ 4-5 kyr time
resolution, 20 cm3 sample size) from a composite sequence (the so called splice) from
Holes 1237A and C (200.82 - 221.86 meters composite depth). Overlapping XRF
measurements (50-100 cm) were made with 1 cm resolution at correlation points of the
Site 1237 splice to verify its accuracy and ensure the completeness of the record. All
samples were oven dried at 40˚C and weighed, before washing over a 63 µm sieve.
Residues were oven dried at 40˚C on a sheet of filter paper, then weighed and sieved
into 63-150 µm, 150-250 µm, 250–630 µm size fractions.
Chronology
Sites 1146 and 1237
The Site 1146 original age model3 for the interval 11.7-14.7 Ma is constrained by
11 biostratigraphic datums (Supplementary Table S1). We revised the shipboard
foraminiferal datums, based on higher resolution sampling, and integrated the revised
datums with shorebased nannofossil biostratigraphy4, using updated ages from
ATNTS20045. This revised chronology, provided the framework to develop the
orbitally-tuned age model for Site 1146. The Site 1237 original age model for the
interval 12.4-14.9 Ma is based on 8 magnetostratigraphic and 5 biostratigraphic datums
(Supplementary Table S2). We revised the shipboard foraminiferal datums based on

3
higher resolution sampling, and integrated these with datums derived from stacked
shipboard inclination data between 197 and 208 mcd, using updated ages from
ATNTS20045. This revised chronology provided the framework to develop the
orbitally-tuned age model for Site 1237. We subsequently compared ages from
ATNTS20045 with ages derived from the astronomically tuned age models developed
here for Sites 1146 and 1237 (Supplementary Tables S1 and S2). We found a
reasonably good match between datum ages, taking into account uncertainties related to
biogeographic distribution, taxonomic concept, preservation bias, placement of datums
depth within cores, temporal resolution of orbital solution and for datums older than 13
Ma the lack of direct astronomical calibration in ATNTS20045.
New chronologies were generated by initially matching the 400 kyr and 100 kyr
amplitude variations in the δ18O series to the latest astronomical solution6, then fine-
adjusting individual obliquity-scale cycles. As tuning target, we constructed an
eccentricity-tilt composite (ET) with no phase shift and equal weight of eccentricity and
obliquity. We initially experimented with several eccentricity/obliquity mixes, then
selected the target curve, which showed most similarity to our δ18O curves. We tuned
δ18O minima to obliquity maxima, since we assumed (a) that relatively warm summers
during high obliquity would promote ice-sheet melting in Antarctica, whereas cool
summers during low obliquity would favour ice-sheet growth, and (b) that a low
summer insolation gradient between low and high latitudes during high obliquity would
decrease poleward moisture transport, inhibiting ice-sheet buildup7. We did not adjust
our tuning for possible phase lags between δ18O and insolation forcing, since the
response time of a smaller middle Miocene Antarctic ice-sheet is unknown. Age
tiepoints are given in Fig. 1, Supplementary Fig. S2 and Supplementary Tables S3-S4.
The δ18O profiles from Sites 1146 and 1237 are plotted versus depth and time in
Supplementary Fig. S2. The average sedimentation rate in Site 1146 is ~ 0.025 m kyr-1
with a chronologic resolution of ~ 4 kyr. The average sedimentation rate in Site 1237 is

4
~ 0.013 m kyr-1 between 201 and 216 mcd with a chronologic resolution of ~ 4 kyr and
~ 0.010 m kyr-1 between 216 and 222 mcd with a chronologic resolution of ~ 5 kyr. The
change in sedimentation rate at ~ 216 mcd in Site 1237 is supported by XRF Fe and
coarse fraction (> 63 µm) data, indicating increased carbonate dissolution below this
level (Fig. 1).
We applied Gaussian band-pass filters to the 1146 and 1237 δ18O and 1237 Fe
series to extract oscillations associated with the 400, 100 and 41 kyr periods. Gaussian
band-pass filters were centered at 0.0244 kyr-1 (41 kyr period) with 0.005 kyr-1
bandwidth (34.0-51.5 kyr period), 0.01 kyr-1 (100 kyr period) with 0.003 kyr-1
bandwidth (76.9-142.9 kyr period) and 0.0025 kyr-1 (400 kyr period) with 0.0005 kyr-1
bandwidth (333.3-500.0 kyr period). δ18O is phase-locked with obliquity in the 41 kyr
band, and the amplitude modulation of the 41 kyr filtered signals closely follows
obliquity between 14.7 and 13.5 Ma (Fig. 1). The amplitude of the 100 kyr filtered δ18O
and Fe signals increases after 14.1 Ma, exbibiting similar modulation as eccentricity
(Figs. 1 and 2, Supplementary Fig. 2). Spectral analysis of the δ18O, Fe and coarse
residue time series reveal strong power at all Milankovitch frequency bands, except
precession (Supplementary Fig. S4). The spectral peak for short eccentricity shows a
characteristic split into 95 kyr and 125 kyr periods. Spectral power in the short and long
eccentricity periods are enhanced after tuning to obliquity. Orbital tuning, bandpass-
filtering and sedimentation rates calculation were performed with AnalySeries 1.28.
Site 1171
We revised the Site 1171 chronology9-10 for the interval 13.2 to 14.3 Ma by
correlating the benthic δ18O profile in Site 1171 to the benthic δ18O profiles in Sites
1146 and 1237, using tie points shown in Supplementary Fig. S3. The revised age
model is validated by spectral analysis, which in contrast to the original age model,

5
shows Milankovitch periodicities, in particular the 400 and 41 kyr (Supplementary Fig.
S4). The original age model9-10 for the interval 13.2-14.3 Ma was based on a linear
interpolation between magnetostratigraphic, biostratigraphic and isotopic datums, which
were not calibrated to an astronomical timescale. The new 1171 age model indicates
higher sedimentation rates (~ 0.015-0.025 m kyr-1) between 13.7 to 14.3 Ma
(Supplementary Fig. S3) in comparison to the original age model9-10, which assumes a
linear sedimentation rate of 0.0136 m kyr-1 over the interval 13.6 to 17 Ma.
Spectral analysis
Power spectra of benthic foraminiferal δ18O (1146, 1237 and 1171), coarse
fraction (1237) and XRF Fe counts (1237) are given in Supplementary Fig. S4. Spectra
were estimated using REDFIT11 with 2 segments and a Hanning window. Power spectra
show strong response of δ18O at the obliquity (41 kyr) and eccentricity (400 kyr) and to
a lesser extent at the eccentricity (125 kyr, 95 kyr) periods. In contrast, most of the
power is concentrated at the eccentricity bands (400 kyr, 125 kyr, 95 kyr) for carbonate
dissolution proxies (coarse fraction and Fe).
Time frequency analysis
Temporal changes in amplitude of signal components in the Milankovitch band
were estimated using a modified harmonic-filtering algorithm12, which fits sinusoidal
waves to a time series by means of least-squares. This method can process unevenly
spaced time series directly, that is, without the requirement of prior interpolation. To
obtain time-dependent amplitude estimates, the input time series is analyzed within a

6
moving window of width Tw = w × Tf, where w = 3 is a width–factor and Tf denotes the
signal periodicity of interest (e.g. 400 kyr). The window is shifted consecutively by one
data point along the time axis of the input time series. Each “window segment” is
linearly detrended prior to tapering with a Welch-Shape-1 window13. The resulting
amplitude and phase of the best-fit sinusoid are saved vs. the average of the observation
times within the current segment and are used to reconstruct the signal component as
function of time. The result of this procedure is equivalent to band-pass filtering (cf. ref.
14). The selected value of w offers a good compromise between statistical and
systematic errors and results in a half-amplitude bandwidth of approximately 0.5/Tf
cycles/Myr. Note that due to the finite window width, a step-like increase in signal
amplitude appears w × Tf wide. Applying the above filtering algorithm over a
predefined range of frequencies allows us to detect changes in signal components in
time-frequency space15. The dependence of window width, Tw on frequency leads to a
change in temporal resolution with frequency. At low (high) frequencies wide (narrow)
windows result in a low (high) temporal resolution. This scale dependence of the
temporal resolution is similar to that of wavelet analysis. A program for time-frequency
analysis (TIMEFRQ, version 4.3) is available from www.palmod.uni-
bremen.de/~mschulz.
References
1. Wang, P. Prell, W. L. & Blum P. et al. Proc. ODP, Init. Repts. 184 [CD-ROM].
Available from: Ocean Drilling Program, Texas A&M University, College
Station TX 77845-9547, USA (2000).

7
2. Mix, A .C., Tiedemann, R. & Blum P. et al. Proc. ODP, Init. Repts. 202 [CD-
ROM]. Available from: Ocean Drilling Program, Texas A&M University,
College Station TX 77845-9547, USA (2003).
3. Holbourn, A. E. Kuhnt, W. & Schulz, M. in Continent-Ocean Interactions in the
East Asian Marginal Seas (eds Clift, P. Wang, P. Kuhnt, W. Hayes, D.) 309-326
(Geophys. Monog. Ser. 149, AGU, Washington, DC, 2004).
4. Nathan, S.A. & Leckie, R.M. in Proc. ODP, Sci. Results 184 [Online] (eds Prell,
W.L. Wang, P. Blum, P. Rea, D.K. & Clemens, S.C.) Available from World
Wide Web: http://www-odp.tamu.edu/publications/184_SR/219/219.htm. [Cited
2005-06-05].
5. Lourens, L., Hilgen, F., Shackleton, N.J., Laskar, J. & Wilson, D. in A Geologic
Time Scale (eds Gradstein, F., Ogg J., Smith, A.) 409-440 (Cambridge
University Press, 2004).
6. Laskar J. et al. A long term numerical solution for the insolation quantities of the
Earth. Astron. Astrophys. 428, 261-285 (2004).
7. Loutre, M.-F., Paillard, D., Vimeux, F. & Cortijo, E. Does mean annual
insolation have the potential to change the climate? Earth Planet. Sci. Lett. 221,
1-14 (2004).
8. Paillard, D., Labeyrie, L. & Yiou, P. Macintosh program performs time-series
analysis. EOS Trans. AGU 77, 379 (1996).
9. Shevenell, A. E. & Kennett, J. P. in The Cenozoic Southern Ocean: Tectonics,
Sedimentation and Climate Change between Australia and Antarctica (eds
Exon, N., Kennett, J.P. Malone, M.) 235-252 (Geophys. Monog. Ser. 151, AGU,
Washington, DC, 2004).

8
10. Shevenell, A. E., Kennett, J. P. & Lea, D. W. Middle Miocene Southern Ocean
Cooling and Antarctic Cryosphere expansion. Science 305, 1766-1770 (2004).
11. Schulz, M. & Mudelsee, M. REDFIT; estimating red-noise spectra directly from
unevenly spaced paleoclimatic time series. Computers and Geosciences, 28,
421-426 (2002).
12. Ferraz- Mello, S. Estimation of periods from unequally spaced observations,
Astron. J. 86, 619-624 (1981).
13. Welch, P. D. The use of fast Fourier transform for the estimation of power
spectra: A method based on time averaging over short, modified periodograms,
IEEE Trans. Audio and Electroacoustics Au-15, 70-73 (1967).
14. Hinnov, L. A., Schulz, M. & Yiou, P. Interhemispheric space-time attributes of
the Dansgaard-Oeschger oscillations between 100 and 0 ka, Quat. Sci. Rev. 21,
1213-1228 (2002).
15. Schulz, M., Berger, W. H., Sarnthein, M. & Grootes, P. M. Amplitude variations
of 1470-year climate oscillations during the last 100,000 years linked to
fluctuations of continental ice mass, Geophys. Res. Lett. 26, 3385-3388 (1999).

9
Supplementary Figure S1 Location of ODP Site 1146 (19˚ 27.40‘N, 116˚
16.37‘E) drilled at 2092 m water depth in the northern South China Sea, ODP
Site 1237 (16°0.421'S, 76°22.685'W) drilled at 3212 m water depth on the
Nazca Ridge, off Peru and ODP Hole 1171C (48°29.9971´S, 149°6.7051´E)
drilled at 2147.8 m water depth on the southernmost South Tasman Rise.

120°
120
150°
°
180°
180°
-150°
-150°
-120°
-120°
-90°
-90°
-60°
-60°
-60° -60°
-30° -30°
0° 0°
30° 30°
0 2000 km
-70 -70
1146
1237
120
°
150
150
180
180
-150
-150
-120
-120
-90
-90
-60
-60
-60 -60
-30 -30
0 0
30 30
0 2000 km
-70° -70°
1146
1237
Supplementary Figure S1
1171

10
Supplementary Figure S2 Benthic foraminiferal δ18O profiles plotted against
depth (a-b) and against age (c). Age control points (Supplementary Tables S3-
S4) are indicated by crosses (black= both sites, blue=Site 1237, red=Site 1146).
(d) Linear sedimentation rates between age tie points. (e) Comparison of 100
kyr filtered iron contents and eccentricity6. Gaussian band-pass filter centered at
0.01 kyr-1 (100 kyr period) with 0.003 kyr-1 bandwidth (76.9-142.9 kyr period).
Note: Filtered Fe record shows similar phasing and amplitude modulation as
filtered eccentricity. (f) Eccentricity- Tilt tuning target. Age correlation points
marked by crosses.

0.511.522.5
464
468
472
476
480
484
488
492
496
500
504
508
512
11461146
0.511.522.5
202
206
210
214
218
222
1237
δ18O (‰ vs. PDB) δ18O (‰ vs. PDB)
dep
th (m
eter
s b
elo
w s
eaflo
or)
dep
th (m
eter
s co
mp
osi
te d
epth
)
Sedimentation rate (m/kyr)
core break
Ag
e (M
a)
0.511.522.512.7
12.9
13.1
13.3
13.5
13.7
13.9
14.1
14.3
14.5
14.7
1237 1146
0.01 0.03
1237 1146
0.42 0.44 0.46 0.48ET target
1237 Fe (cps) 100kyr filtered
Eccentricity 100kyr filtered
-40 -20
δ18O (‰ vs. PDB)
Supplementary Figure S2
a b c d e f
-0.01 0.010 0.02-0.02
0 20 40
11
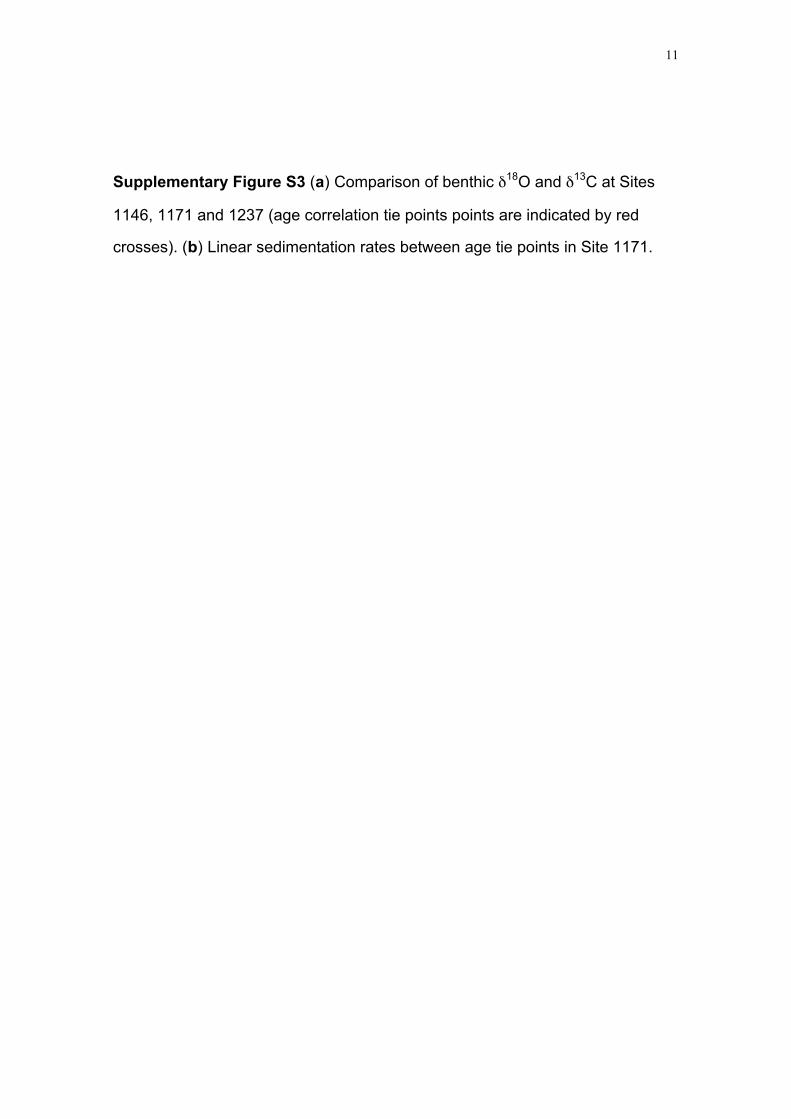
Supplementary Figure S3 (a) Comparison of benthic δ18O and δ13C at Sites
1146, 1171 and 1237 (age correlation tie points points are indicated by red
crosses). (b) Linear sedimentation rates between age tie points in Site 1171.

13.2
13.4
13.6
13.8
14.0
14.2
Ag
e (M
a)
2.5 2 1.5 1 0.5 1 1.5 2 2.5
Benthic δ18O (‰ vs. PDB) Benthic δ13C (‰ vs. PDB)
114611711237
Supplementary Figure S3
Sed. Rate (m/kyr)
0.01 0.02 0.03
11711171
13.2
13.4
13.6
13.8
14.0
14.2
Ag
e (M
a)
a b

12
Supplementary Figure S4 Power spectra of (a) δ18O in ODP Site 1237, (b)
δ18O in ODP Site 1146, (c) proportion of coarse fraction in ODP Site 1237, (d)
Fe concentration in ODP Site 1237. (e) δ18O in ODP Site 1171. Spectral power
is given in (units of data)2/f, where f is frequency (cycle/kyr). The 6-dB
bandwidth is ~ 0.0015 cycles/kyr in A to D and 0.002 cycles/kyr in E. Numbers
above peaks indicate associated periods in kyr. The 95% and 80% false-alarm
levels are shown.

a1237 Oδ18
e1171 Oδ18
c1237 Fraction > 63 µm
d1237 Fe
b1146 Oδ18
125
125
125
41
41
41
95
95
95
95
400
400
400
400
400
Supplementary Figure S4

13
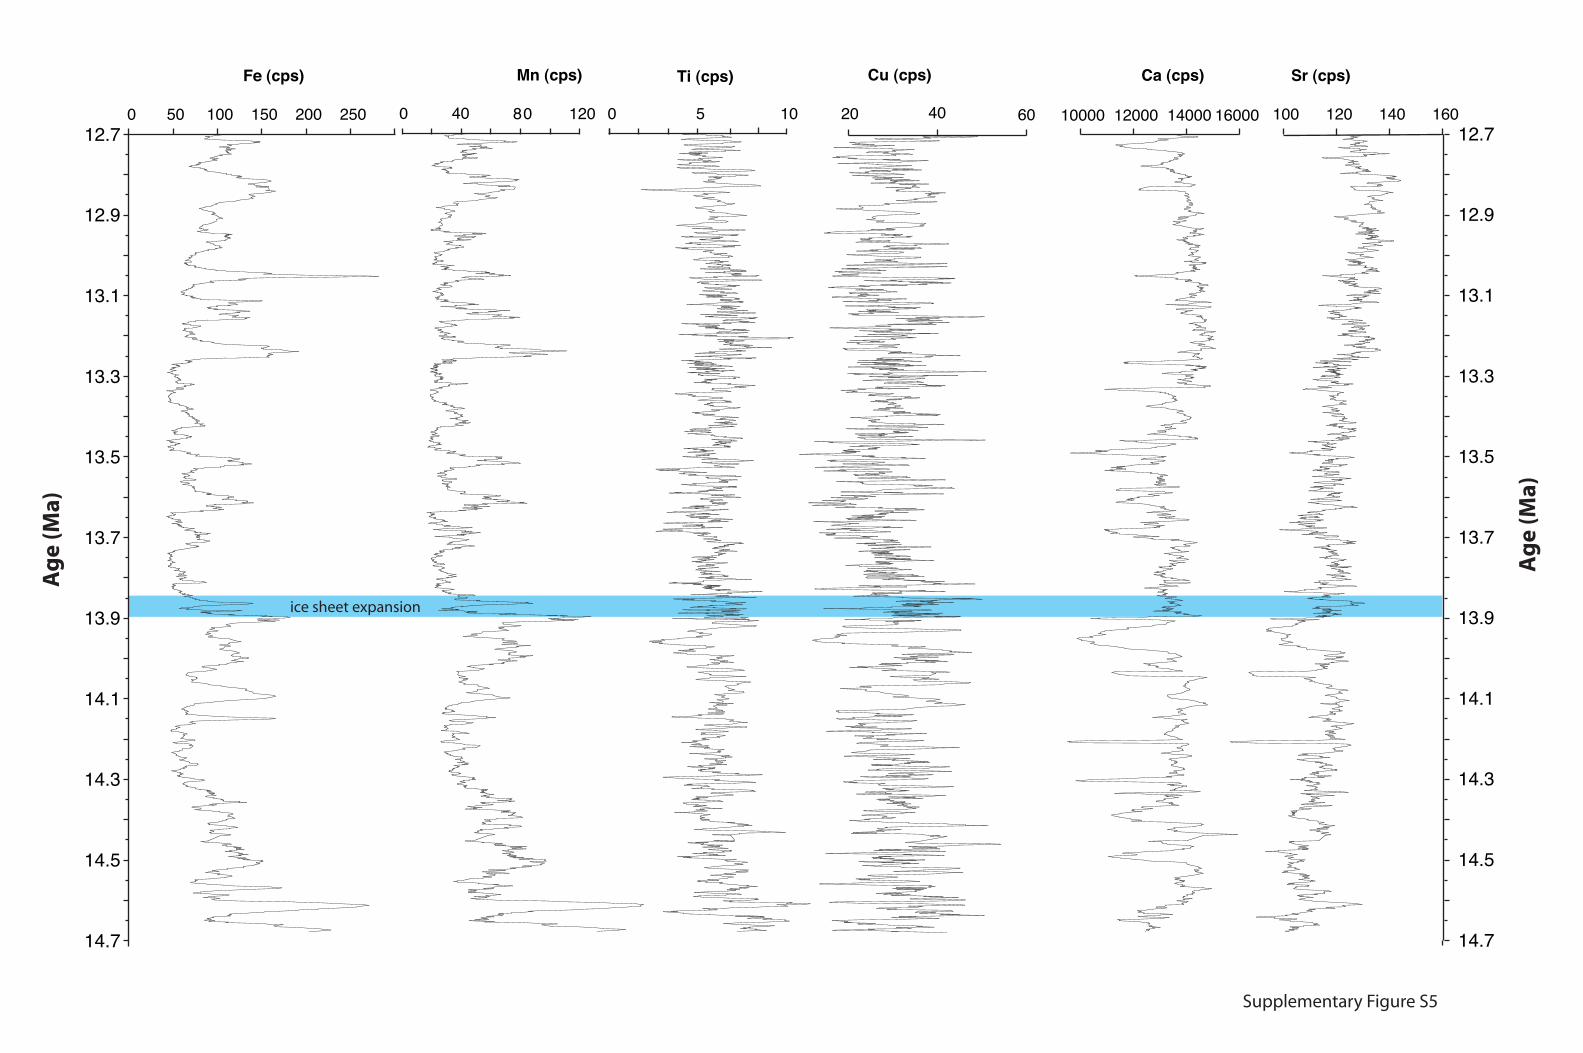
Supplementary Figure S5 Chemical element composition from XRF scanning
measurements with 1 cm resolution on archive halves of ODP Site 1237 (12.7-
14.7 Ma). All data are given in counts per second (cps) with a 5-pt moving
average smoothing.
0 50 100 150 200 250 012.7
12.9
13.1
13.3
13.5
13.7
13.9
14.1
14.3
14.5
14.7
Fe (cps)
80 120 160
Mn (cps)
0 5 10
Ti (cps) Cu (cps) Ca (cps)
10000 12000 14000 16000 100 120 140 160
Sr (cps)
40
ice sheet expansion
Supplementary Figure S5
Ag
e (M
a)
12.7
12.9
13.1
13.3
13.5
13.7
13.9
14.1
14.3
14.5
14.7
Ag
e (M
a)
20 40 60

14
Supplementary Table S1 Comparison of ages for 1146 biostratigraphic datums
from ATNTS20045 and this work (all ages given in Ma). The uncertainty in the
placement of datums within cores is 20 cm for planktonic events and 25 cm for
nannofossil events.
Event mbsf ATNTS20045 ages Ages (this work)
FO D. kugleri 447.00 11.86 NA
FO T. rugosus 465.43 NA 12.79
FO F. fohsi robusta 474.53 13.13 13.19
LO C. floridanus 478.22 13.33 13.33
FO F. fohsi s.l. 480.51 13.41 13.45
LO S. heteromorphus 484.58 13.53 13.63
FO F. praefohsi 490.13 13.77 13.85
LO G. archaeomenardii 494.48 13.87 14.04
LO P. circularis 507.85 NA 14.52
FO O. suturalis 515.95 NA 14.78
LO H. ampliapertura 529.18 14.91 15.17

15
Supplementary Table S2 Comparison of ages for 1237 magnetostratigraphic
and biostratigraphic datums from ATNTS20045 and this work (all ages given in
Ma). The uncertainty in the placement of planktonic foraminiferal datums within
cores is 10 cm. The uncertainty in the placement of polarity boundaries is 20-50
cm. We followed the shipboard interpretation for the placement of C5An.2n. We
re-interpreted shipboard inclination data in the interval 200-208 mcd, where a
relatively good correlation exists between Holes 1237B and 1237C.
Event mcd ATNTS20045 ages Ages (this work)
C5An.2n (bottom) 197.70 12.415 12.42
C5Ar1n (top) 200.83 12.730 12.70
C5Ar1n (bottom) 201.65 12.765 12.78
C5Ar2n (top) 202.21 12.820 12.84
C5Ar2n (bottom) 202.71 12.878 12.93
C5AAn (top) 204.57 13.015 13.08
FO F. fohsi robusta 204.48 13.13 13.07
C5AAn (bottom) 206.20 13.183 13.20
C5ABn (top) 207.94 13.369 13.32
FO F. fohsi s.l. 208.78 13.41 13.40
FO F. praefohsi 214.23 13.77 13.81
FO F. peripheroacuta 218.32 14.24 14.25
FO P. circularis 223.98 14.89 NA

16
Supplementary Tables S3 and S4 Age control points between δ18O depth
series and ET target curve used to derive orbitally tuned timescales for interval
12.7–14.7 Ma in ODP Sites 1146 and 1237.
Supplementary Table S3: ODP Site 1146
Depth (mbsf) Age (ka)
466.25 12815
467.24 12848
468.45 12934
469.34 12966
470.24 13016
471.25 13051
473.14 13133
473.60 13168
475.28 13218
475.96 13252
478.45 13334
479.69 13416
481.73 13500
484.32 13620
487.23 13705
490.60 13874
491.15 13908
492.16 13949
492.98 13993
494.20 14025
495.05 14071
496.55 14111
497.39 14146

17
498.25 14189
499.75 14229
501.08 14269
501.45 14310
502.30 14347
503.70 14386
504.65 14430
505.95 14466
507.00 14506
508.58 14547
509.71 14589
513.66 14708
Supplementary Table S4: ODP Site 1237
Depth (mcd) Age (ka)
202.02 12815
202.28 12848
202.73 12934
203.23 12966
203.68 13016
204.26 13051
204.86 13101
205.27 13133
205.72 13168
206.42 13218
206.83 13252
207.68 13297
208.18 13334
208.98 13416
210.32 13500
211.68 13620
212.79 13705
213.93 13791
214.47 13822

18
215.22 13874
215.97 13908
216.22 13949
216.47 13993
216.77 14025
217.02 14071
217.17 14111
217.82 14189
218.12 14229
218.47 14269
218.93 14310
219.36 14347
219.81 14386
220.16 14430
220.51 14466
220.96 14506
221.21 14547
221.61 14589